TRANSACTIONS OF SOCIETY OF ACTUARIES 1965 VOL. 17 PT. 1 NO. 49 CERTAIN ACTUARIAL CONSIDERATIONS IN DETER- MINING LIFE INSURANCE COMPANY EQUITY VALUES--ACTUARIAL NOTE THOMAS P. BOWLES, JR., AND LLOYD S. COUGHTRY* INTRODUCTION W ITH the rather dramatic increase in interest of the investing public in life insurance company equities during the past decade and the increased demand from the investment com- munity for sound and knowledgeable counsel with regard to values and earnings of life insurance companies, the actuary now has an additional responsibility. He should assume a pre-eminent position in advising the investment community on life company equity values. His continual in- vestigation, research, and analysis should provide guides, indices, and techniques which can be used to establish reasonable prices for life company equities. There is a tendency on the part of some actuaries to maintain that the actuary should not be involved in determining the value of life company equities, since this is an investment and judgment question and not one that can be answered through actuarial devices or techniques. Since the public does not understand what underlies the earnings and values of life companies, the actuary is in a unique position, since he is presum- ably better prepared than others to provide guidelines and offer compe- tent counsel. The actuary is equipped by training, knowledge, and expe- rience to measure underlying values and earnings and trends thereof. Even though he may be able to determine values better than others, he should not be the one who recommends the purchase or sale of a stock. This is the province of the investment counselor or broker. The actuary, the trained technician in the life industry, cannot ignore his responsibility to both policyholders and stockholders. Traditionally, the actuary has considered that his obligation related principally to the solvency of the enterprise and the equitable treatment of its policyholders. It must now be extended to include a responsibility to stockholders and to the investing public, which demands that he present and interpret in a meaningful way the profits which emerge from year to year. The actuary cannot remain detached from the investing public. If he is attached to * Mr. Coughtry, not a member of the Society, is a Partner of Bear, Stearns & Co., New York City. 281
Transcript
TRANSACTIONS OF SOCIETY OF ACTUARIES 1965 VOL. 17 PT. 1 NO. 49
C E R T A I N ACTUARIAL CONSIDERATIONS I N D E T E R - M I N I N G L I F E INSURANCE COMPANY EQUI TY
VALUES- -ACTUARIAL NOTE
THOMAS P. BOWLES, JR., AND LLOYD S. COUGHTRY*
INTRODUCTION
W ITH the rather dramatic increase in interest of the investing public in life insurance company equities during the past decade and the increased demand from the investment com-
munity for sound and knowledgeable counsel with regard to values and earnings of life insurance companies, the actuary now has an additional responsibility. He should assume a pre-eminent position in advising the investment community on life company equity values. His continual in- vestigation, research, and analysis should provide guides, indices, and techniques which can be used to establish reasonable prices for life company equities.
There is a tendency on the part of some actuaries to maintain that the actuary should not be involved in determining the value of life company equities, since this is an investment and judgment question and not one that can be answered through actuarial devices or techniques. Since the public does not understand what underlies the earnings and values of life companies, the actuary is in a unique position, since he is presum- ably better prepared than others to provide guidelines and offer compe- tent counsel. The actuary is equipped by training, knowledge, and expe- rience to measure underlying values and earnings and trends thereof. Even though he may be able to determine values better than others, he should not be the one who recommends the purchase or sale of a stock. This is the province of the investment counselor or broker.
The actuary, the trained technician in the life industry, cannot ignore his responsibility to both policyholders and stockholders. Traditionally, the actuary has considered that his obligation related principally to the solvency of the enterprise and the equitable treatment of its policyholders. I t must now be extended to include a responsibility to stockholders and to the investing public, which demands that he present and interpret in a meaningful way the profits which emerge from year to year. The actuary cannot remain detached from the investing public. If he is attached to
* Mr. Coughtry, not a member of the Society, is a Partner of Bear, Stearns & Co., New York City.
281
282 LI~E rN'SIYRANCE COMPANY EQIYlTY VALUES
it, he has the responsibility to remain the predominant figure in stating values and revealing earnings trends. The actuary of a stock company is, after all, the employee and servant of the stockholders and, as such, must be responsive to their interest to the best of his ability.
PRICE-EARNINGS RATIO
The Record A sophisticated approach to the analysis of life earnings is particu-
larly important at this point of time, because life company equities, as a group, have "matured." Maturi ty in this context means that the price-earnings ratio, determined by a relationship of market value to adjusted earnings, has increased to that level which can be justified by the growth rate of adjusted earnings. ("Adjusted earnings" is a term often referred to by life stock analysts. I t has no rigid, universally ac- cepted meaning. I t should refer to the arithmetic sum of the after-tax earnings reported by the insurance company in its annual statement convention blank filed with the insurance commissioner and an amount which adjusts for the noncapitalization and nonamortization of the additional expenses incurred in the acquisition of new business.) In ex- cess of 90 per cen t of the increase in the market price of life company stocks since 1953 has been due to the increase in price-earnings ratio rather than to an increase in adjusted earnings. For this reason the in- vesting community should be particularly careful to measure earnings adequately and trends thereof and reach sound conclusions from a com- parison of earnings among companies. This is important not only be- cause of the maturing of the price-earnings ratio but also because of the possible adverse trend in earnings that could result from forces at work in the industry, the principal ones being (1) a substantial reduction in rate levels and (2) a probable continued deceleration in increase in net rate of interest earned on invested assets (see Table 4).
Table 1 shows the ratio at the end of each calendar year 1954--64 of bid market values to adjusted earnings for the year (i.e., price-earnings ratios) for a selected group of life companies.
Theoretical Basis for Determining Price-Earnings Ratio In determining the value of a life company equity, it is necessary to
estimate future earnings per share. Generally a price-earnings ratio can be determined if the following two items are known: (1) future growth rate of earnings per share and (2) the discount rate the investor applies to earnings. With these data, it becomes a mathematical exercise to determine an appropriate price-earnings ratio to be applied to current earnings to obtain the corresponding value per share.
LIFE INSLrRANCE COMPANY EQUITY VALUES 283
The marke t does not always, of course, take this approach to the de terminat ion of price. In the long run, however, the var ia t ions in the marke t price of a share will reflect the publ ic 's changing concept of the possibilities for future growth. Once a de terminat ion of future growth ra te in earnings is made, the m a r k e t price is, within cer tain l imits, gen- eral ly determined. Table 2 i l lustrates the var ia t ion in price-earnings ra- t io which occurs as growth rates and discounts change. I t is possible to jus t i fy a given price-earnings rat io by a combinat ion of several growth rates and discount rates. For example, an interpolat ion will produce a price-earnings rat io of 25 for many combinat ions of growth ra te and discount rate as shown in Table 2.
The actuary should carefully avoid making arbitrary assumptions as to future growth rate in carnings. Such a determination or forecast of earnings must be bascd on reasonable assumptions with regard to all those forces that, in fact, determine earnings. This note considers only the effect on earnings of a change in investment income and a change in the interest and mortality bases of reserves. It ignores such other signifi- cant factors as change in levels of gross premiums, expenses, actual mortality experience, etc.
~FFECT ON EA~NGS OF CHANGE zy I~rVEST~N'r mco~m
A substantial part of the increase in adjusted earnings per share of life companies during the past ten years was the result of an increase in the rate of interest earned on invested assets. Therefore, the actuary must recognize the impact of this increased interest on earnings, on growth rate in future earnings, and on resultant price-earnings ratio.
Table 3 shows the net rate of interest earned on invested assets of
T A B L E 2
PRICE-EARNINGS RATIO BASED UPON GROWTH RATES IN EARNINGS AND DISCOUNT RATES
GROWTH RATE
1. Earnings during years 1-5, inclusive, grow at the compound rate shown below. Increase in earnings in 6th year and thereafter same dol- lar a m o u n t as in 5th year:
3. 10% growth in year 1. Growth rate in each year thereafter is 950/0 of rate in previous year but not less t han 5% . . . . . . . . . . . . . . . . . . . . .
4. 10% growth in year 1, reducing by 1 percent- age point dur ing each of next 5 years, there- after remaining at 5% . . . . . . . . . . . . . . . . . . . .
5. Growth rate in year 1 is the percentage shown below, and growth in each year thereafter is same dollar amoun t as in year 1:*
* Chart I gives the price-earnings ratios for growth rates of this type from I% to 20% for five different discount rates.
70
65
60
55
50
.o 45
~. 40 ~ ,3s "E 30
,~ 2s ~ ao
1o
5
0
C H A R T I
i i I t t i i I t t [ I i ~ i I i i i
- _-
3,
I I I I 1 1 t I I I I I I I I I i l I 2 5 4 5 6 7 8 9 I0 II 12 15 14 15 16 17 18 19 20
6rowth Rate Per Cent In Year I
LIFE INSURANCE COMPANY EQUITY VALUES 285
U.S. life companies during the period 1947-1964, before ad jus tmen t for federal income tax.
The increase during 1964 of the net rate was the lowest of the last nine years. A running three-year average also suggests a decelerat ion of in- crease. This deceleration is due pr incipal ly to the leveling of the yield obtained on new investments .
The relat ionship between adjus ted earnings and excess interest m a y be shown by Table 4. Even though pa r t of the increase in excess interest
TABLE 3
NET RATE OF INTEREST EARNED ON INVESTED ASSETS UNITED STATES LIFE COMPANIES
earnings per share reflects the decline in the rate of interest required on policy reserves, the table does reveal tha t the increase in ad jus ted earn- ings during the ten years was subs tant ia l ly the result of the increase in excess interest .
If there is a decelerat ion in the ra te a t which the net rate of interest earned is increasing, the major source of the increase in earnings will correspondingly diminish. Thereupon, growth in earnings previously de- r ived from increasing interest ra tes mus t be obtained from other sources, such as greater volume, higher profit margins obtained through decreased expenses or increased premium levels, etc. I t becomes increasingly im- po r t an t t ha t the investor in life insurance equities make an analysis of the t rend in interest earnings as well as of other elements of profit.
286 LIFE INSURANCE COMPANY EQUITY VALUES
EFFECT ON SURPLUS FUNDS AND EARNINGS OF
Cm~NCE IN m~SERW BASIS
Surplus Funds A significant factor in the determinat ion of earnings is the charge
against income of the increase in policy reserves. M a n y studies have been made to demonstrate the effect on a company 's total reserve lia- bili ty of a change in mortal i ty rate. For example, it has been demon- strated in model-office computat ions tha t the 1958 CSO reserves are about 95 per cent of the 1941 CSO reserves computed by the same method
TABLE 4
ADJUSTED EARNINGS AND INTEREST EARNINGS IN EXCESS OF REQUIRED INTEREST
50 UNITED STATES STOCK LIFE COMPANIES
Calendar Adjusted Excess Inter- Year Earnings An est Earnings An
and at the same rate of interest. I n the model-office studies made for purpose of this note, this "rule of t h u m b " has been substantiated, as shown by Table 5. The table is of particular interest because it shows the impact of a change in morta l i ty table by age of company. The rule of thumb applies to a mature company, as revealed by the status at the end of the fortieth year. This is equally true of Table 6.
I t has also been stated that a change of x per cent in the interest rate results in a change of 10x per cent in the amount of reserve. This has also been substant ia ted by the model-office studies made for purpose of this note, as shown by Table 6.
The change in reserve resulting from a change in method from net level to a CRVM is indicated by the computations made for purpose of this note, as shown by Table 7.
TABLE 5*
MODEL-OFFICE DISTRIBUTION 1--WITHDRAWAL S INCREASE IN PRODUCTION 7.5 PER CENT--N.L. RESERVES AT 3 PER CENT
* See Appendix A for model-office structure and assumptions.
288 LIFE INSURANCE COMPANY EQUITY VALUES
It is noted, however, that the above rules of thumb, each of which was developed from model-office tests, give only the change in total reserve liability, producing, therefore, a change in the company 's surplus as reported on page 3 of the annual s tatement (convention blank). This change does not reveal directly the effect on earnings of variations in such factors as persistency, rates of increase in production, plan distribution, etc.
TABLE 7*
-MODEL-OFFICE DISTRIBUTION 1--WITHDRAWAL S INCREASE IN PRODUCTION 7.5 PER CENT--
N.L. AND CRV]V~ '58 CSO 3 PER CENT RESERVES (000%)
* Scc Appendix A for model-office structure and assumptions.
Earnings Even though the reserve basis does not determine the ultimate earn-
ings on a policy, except as affected by taxes based on earnings, it does determine the incidence of those earnings. Since earnings used to deter- mine market value are those reported by the company in its annual statement convention blank, adjusted in various ways as pointed out above, it is desirable to recognize the effect on earnings of a variation in reserve basis. This will also permit a review of the relationship between the annual increase in reserve and gross premiums collected. Recognition of the extent to which reserve basis affects earnings is of particular im- portance when a comparison is made of adjusted earnings and market values of two or more companies. An examination of the variation in earnings caused by varying reserve bases is pertinent to the evaluation of life insurance companies due to the varied reserve bases employed
LIFE INSIYRANCE COMPANY EQUITY VALUES 289
by companies and to varying rates of increase in production, withdrawal rates and distribution by plans, etc.
Although a gross premium valuation is recognized as an acceptable technique for determining the value of a block of business in force at a given point of time, it alone is not sufficient to determine the going con- cern value with which the investor is principally concerned. Conse- quently, it is essential that a forecast of earnings recognize the impact on reported earnings of the reserve basis used by the company. Theoreti- cally, it would be appropriate to use mortality and interest bases which reasonably reflect anticipated experience over the long range, provided that, for purposes of comparison, the same bases are used for all com- panies in the comparison. In practice, however, completely realistic rates are not generally used, since the traditional conservative basis of reserves is considered desirable.
To demonstrate the effect on reserves and earnings of differing re- serve interest and mortality assumptions, a model-office technique has been utilized. In weighing the effect upon reserve increases created by varying the reserve assumptions, variations in other parameters have been introduced. The variations are shown in Appendix A, which gives the model-office assumptions and parameters.
An analysis of fifty large United States stock life insurance companies indicates that the reported 1963 earnings before income tax amounted to approximately 40 per cent of the increase in policy reserves. For these companies a decrease in reserves of 5 per cent of the reserves would have the effect of increasing before-tax earnings by 12.5 per cent.
The magnitude of the effect on earnings of a change in reserve may also be demonstrated by reference to certain of the model-office compu- tations shown in Table 8.
If it is assumed that reported pre-tax earnings are 14 per cent of pre- mium when using a 2.5 per cent interest assumption, Table 8 indicates that a change to a 4 per cent interest assumption would increase reported earnings after about thirty years by 50 per cent, or 7 per cent of pre- mium. Eventually the reverse would prevail, which is shown inferentially in the last column in Table 8, which reveals the additional earnings as per- centage of premium where there is no growth in the initial annual issue of $100,000 (i.e., where a level in force is reached fairly early).
Theoretically, since reserves do not determine the ultimate pre-tax earnings, any change in reserves should produce an offsetting change in growth rate of earnings. This produces a change in price-earnings ratio which, when applied to the changed earnings, should produce approxi- mately the same price per share. This is illustrated by Table 8. For
290 LIFE INS~CE COMPANY EQUITY VALUES
example, under "Withdrawal S, Increase in Production 7.5 per cent for Distribution 3," the growth rate in earnings where a 4 per cent reserve is used will be less than the growth rate where a 2½ per cent reserve is used, even though in any year the earnings will be higher. But higher earnings times a reduced price-earnings ratio may minimize what might otherwise appear to be a significant change in value.
I t is essential t ha t the a c tua ry or ana lys t be aware of this so tha t he will not glibly s ta te t ha t a price-earnings rat io of, say, 25 is acceptable for valuing a life company. The reserve basis p lays a significant pa r t in the
TABLE 8*
MODEL-OFFICE DISTRIBUTION 3--WITHDRAWAL S INCREASE IN PRODUCTION 7.5 PER CENT--
No GRowra ADDITIONAL EARNINGS AS PEECENTAG~ o~ PREMI-
UM t
12% 10 8 6 4 3 2 1
* See Appendix A for model-office structure and assumptions. t See accompanying paragraph.
valua t ion procedure. Theoret ical ly, to compare adequate ly earnings, ra tes of increase in earnings, and price-earnings rat ios for several com- panies, i t is necessary to compute , or otherwise es t imate , the reserves for each company on the same basis.
Various computa t ions were made to determine the gross p remium income, insurance in force, and reserves and increase in reserves for a model office based upon various mor ta l i t y tables and interest rates.
Appendix B gives the detai ls of the results of two of these computat ions .
Usual ly the repor ted earnings for ord inary insurance, for example, are re la ted to the premium income to determine the earnings as a per-
centage of premium. I t would be helpful, therefore, to have some measure
of the change in repor ted earnings each year as the result of a change in d is t r ibut ion and pers is tency and rates of increased product ion.
LIFE INSURANCE COMPANY EQUITY VALUES 291
Table 9 shows the reserve increase as a per cent of gross premium for various parameters for distributions 2, 3, and 4 (see Appendix A).
Table 10 shows the ratio of 4 per cent reserve increase to the 2½ per cent reserve increase. This table indicates that the rule of thumb, which states that ½ per cent increase in reserve interest rate will decrease reserves by 5 per cent, should vary for various plan mixes, withdrawal rates, and in- crease in production of new business. The more nearly a point of maturi ty is reached, the more nearly is the rule of thumb validated.
The withdrawal rate creates virtually no difference in the relationship between the reserve increase on 4 per cent and 2½ per cent for any given distribution.
TABLE 9*
RESERVE INCREASE AS PERCENTAGE GROSS PREMIUMS 1958 CSO N.L. AT INTEREST RATE SHOWN
* See Appendix A for model-office structure and assumptions.
292 LIFE INSURANCE COMPANY EQUITY VALUES
C O N C L U S I O N S
The growth rate in life insurance company earnings per share is sig- nificantly affected by (a) the deceleration in the increase of investment yield, due principally to the leveling of new money rates, and (b) the basis used for computing policy reserves. Since a price-earnings ratio is dependent upon growth rate in earnings, it is important that careful appraisal be made of those forces which affect growth rates.
The actuary must remain alert to the need for sound analysis and interpretation of earnings trends and to his obligation to provide both the analysis and the interpretation.
TABLE 10"
RATIO OF RESERVE INCREASE OF 4 PER CENT RESERVE TO 24 PER CENT RESERVE
1958 CSO NETLEVEL
DISTRI- WITH- BUTION DRAWAL
INCREASE IN PRO- DUCTION
0 7½
15
0 7½
15
0 7~
15
0 7½
15
83 83 83
83 83 83
80 80 80
80 80 80
YEAR
85 85 85
85 85 85
82 81 81
82 81 81
10
86 86 85
86 86 85
84 83 83
84 83 82
15
87 86 86
87 86 85
86 84 83
86 84 83
20 25 30
89 88 89 87 86 87 86 86 86
89 87 89 86 86 86 85 85 85
88 84 86 85 84 84 84 83 83
88 84 86 84 83 83 83 83 83
35 4O
90 91 87 87 86 86
90 91 86 86 85 85
88 89 84 84 83 83
87 89 83 83 83 83
* See Appendix A for model-ofllce structure and assumptions.
L I F E I N S U R A N C E C O M P A N Y E Q U I T Y V A L U E S 293
A P P E N D I X A
M O D E L - O F F I C E S T R U C T U R E
RELATIVE AMOUNTS OF ISSUES BY PLAN AND AGE
DISTRI- BUTION
PLAN OF ORDINARY INSUaANCE
15 Y.T. W.L. 20 P.L. 20 Y.E.
To ta l a t age
15 Y.T. W.L. 20 P.L. 20 Y.E.
To ta l a t age
15 Y.T. W.L. 20 P,L. 20 Y.E.
Tota l a t age
15 Y.T. W.L. 20 P.L. 20 Y.E.
To ta l at age
ACE AT ISSUE
15
.0200
.0500 •0150 .0150
• 1 0 0 0
.0100 •0250 .0075 .0075
.0500
.0100
.0450
.0250 •0200
.1000
.0050
.0225 •0125 .0100
.0500
30
.2300
.2750
.0175 •0175
.5400
.1560
.2000
.0150
.0150
• 3860
•1182 .2475 .1050 .0775
.5482
.0825
.1800
.0775
.0575
.3975
45
.1100
.1250
.0125
.0125
• 2600
.1540
.1750
.0175
.0175
• 3640
.0518
.1125
.0500 •0375
•2518
.0725
.1575
.0700 •0525
.3525
60*
.0400
.0500
.0050
.0050
.1000
.0800
.1000
.0100
.0100
.2000
.0200
.0450 •0200 •0150
• 1 0 0 0
.0400
.0900
.0400
.0300
.2000
TOTAL
• 4000 • 5000 • 0500 • 0500
1. 0000
.4000
.5000
.0500
.0500
1.0000
• 2000 • 4500 • 2000 • 1500
1.0000
•2000 .4500 .2000 .1500
1.0000
* Age 50 for 15 Y.T.
.Reserves: (Te rmina l )
Bas i s : N e t Leve l (N.L. )
C o m m i s s i o n e r s R e s e r v e Va l ua t i on M e t h o d ( C R V M )
I n t e r e s t : 2½ Pe r C e n t
3 P e r C e n t
4 P e r C e n t
M o r t a l i t y : 1941 CSO
1958 CSO
294 L I F E I N S U R A N C E COMIPANY E Q U I T Y V A L U E S
Mortality: O r d i n a r y Select 1950-54 M o r t a l i t y ( f ive-year se lect per iod)
Withdrawal Rates: All t e r m i n a t i o n s occur a t e n d of po l icy yea r
DISTRIBUTION 3---15 PER CENT INCREASE IN PRODUCTION 1958 CSO N.L. 21 PER CENT RESERVES
(ooo's) WITHDRAWAL B
i I Reserve In- Gross Increase crease as Issued In Force Premiums Reserve Year Reserve Per Cent during Year End Year during Year End Year during Year Gross
This is an !nteresting and valuable paper. I t is, I believe, the first to appear in our Transactions dealing with this topic--a topic, as pointed out by the authors, of substantial interest to actuaries. Whether or not the actuary can assume, as the authors suggest, "a pre-eminent position in advising the investment community on life company equity values," they have performed a valuable service in bringing actuarial techniques to bear on the problems involved.
The paper includes a useful discussion of the theoretical basis for de- termining price-earnings ratio. This discussion underscores the fact that price-earnings ratios underlying current market prices must rely heavily upon the expectation of continued growth in the rate of earnings of in- surance companies. The paper also includes a word of caution concerning the difficulty of forecasting such growth because of the variety of forces which may affect the future earnings of stock life insurance companies. This word of caution should be heavily underscored.
The analysis in this paper is geared to the approach used by the in- vestor or analyst who must place primary reliance on published figures. As such, it is concerned with earnings which are determined on an aggre- gate basis. A sophisticated investor with access to full information con- cerning a company's operations will be more concerned with an analysis, of earnings by "class" of business, with due regard to all the factors which have influenced such earnings in the past and changes in those factors which may alter the picture in the future, together with the past and probable future mix of business by class which will give rise to ex- pected future earnings. With such information he can determine a price per share which would, yield a rate of return commensurate with the risk involved.
The outsider has great difficulty in measuring earnings in this manner. This obviously increases the risk, from the standpoint of such an in- vestor, of realizing the rate of growth in earnings which he may choose to assume for the future. I t is appropriate, therefore, for such an investor - -o r an actuary who is "advising the investment community on life com- pany equity values"=-to exercise .due caution in estimating rates of growth in earnings. I t is also appropriate to recognize the interrelation- ship which should exist between the investor's expected rate of return and the degree of confidence which can be placed in estimates of rates
297
298 L I F E I N S U R A N C E C O ~ A N ~ E Q U I T Y V A L U E S
of growth in earnings which are based on the limited information avail- able from published figures.
The authors state that the term "adjusted earnings" does not have a meaning which is universally accepted by life stock analysts. They say that "it should refer to the arithmetic sum of the after-tax earnings re- ported in its annual statement convention blank filed with the insurance commissioner and an amount which adjusts for noncapitalization and nonamortization of the additional first-year expenses incurred in the acquisition of new business." Perhaps this would be suitable for some purposes. However, since the concept of adjusted earnings, in the present context, is simply a link in a process of arriving at total v a l u e - b y mul- tiplying by a price-earnings ratio---a somewhat different definition ap- pears to be more appropriate.
The noncapitalized, nonamortized expense approach is a measure of cost expended to develop future profits. If adjusted earnings are to be the base for arriving at the value of the stockholders' equity, should not the adjustment reflect the value of the business rather than its cost? In many cases, there will be little difference--in a well-managed company, at the point of issue, the value of a block of business (being the expected future profits discounted at a rate recognizing the degree of risk) will quite likely be something not much above or below the acquisition cost. But what about the extremes? First, consider the case of a poorly man- aged company spending much more for business than it is worth. Are we justified in giving it full credit for its acquisition cost? I t is clearly inappropriate to give such a company a greater adjustment in earnings than would be given in the case of a particularly efficient company that acquires its business at less than normal cost.
A direct approach to valuation of a company involves adding to its adjusted book value the value of the insurance in force--not its unamor- tized costmand adding, if warranted, the value of the agency organiza- tion. For consistency, an indirect approach through the projection of earnings would seem to require that the adjusted earnings also recognize increases in these same values.
JON D. SUTCLIFFE :
Mr. Bowles and Mr. Coughtry are to be commended for pointing the way toward a more meaningful analysis of the value of life company equities.
The low quality of the investment advice generally available to the public in this area has been largely attributable to the lack of suitable actuarial guidance. Some highly respected sources of investment informa-
DISCUSSION 299
tion have within the past few years put out literature on life equity values which totally ignored differences among companies on such items as
1. Level of the gross premium rates. 2. Age distribution of policyholders. 3. Commission and other expense rates. 4. Lapse experience. 5. Effect of group and individual accident and health lines. 6. Reserve methods used. 7. Underwriting experience. 8. Product mix. 9. Amount and effect of substandard business.
10. Amount and effect of deficiency reserves. 11. Value of expected amounts of future business. 12. Investment experience.
Admittedly, it is extremely difficult to assess all these and other "objec- tive" elements that affect the value of a life company equity and even more difficult to gauge the purely subjective ones, such as quality of management and effects of future competition. Nevertheless, an actuarial analysis, however tenuous the results, seems clearly preferable to the willy-nilly application of a few rules of thumb.
This paper will be of unquestioned usefulness to any actuary who engages in any analysis of the value of life company equities. I should like to take exception, however, to the implication that a gross premium valuation is not effective in determining a "going concern" value. With proper inclusion of anticipated new business, a gross premium valuation or projection can be an extremely powerful tool in ferreting out significant differences in earning potential between companies that seem almost identical. A gross premium projection technique can be used to produce a predicted "Summary of Operations" for future years. Such projections have the advantage of being readily understood and accepted by in- vestors.
ARTIKUR PEDOE :
I have been interested in this subject since---some years ago---I was professionally engaged in this work and little was known of the principles which should be followed. The present requirements of various states in the United States for actuarial projections of future financial needs for new companies or those seeking additional capital and surplus mean that the subject is of considerable current importance. We have had Melvin Gold's paper in TSA, Volume X I V (1962), and the most frank and en- lightening discussion on the subject by consulting actuaries in New York this spring (TSA, XVII , DT0-D75).
300 LIFE INSURANCE COMPANY EQUITY VALUES
Some of our members may not know of the chairman's address bearing on this subject delivered at the annual meeting of the Life Insurance Association of America in December last by one of our distinguished Fellows. Mr. Leland Kalmbach there stated that of the 1,570 new life insurance companies organized in the United States from 1950 to mid- 1964, 631 merged or reinsured their businesses, frequently because of a financially unsuccessful operation. The New York State Superintendent of Insurance stated in March of this year that at the end of 1964 more than 30 domestic life insurance stock companies were in the process of organization in New York State alone.
We do not have a problem of this magnitude in Canada, at least up to the present, but from 1956 to 1964 the number of provincially licensed companies in the life insurance business has doubled (from 13 to 27), and our provincial authorities are not all equipped to deal with the serious problems affecting new companies as outlined in the present paper and the others referred to.
The object of the paper being discussed is to encourage members of the Society to take an active part as "investment-analysts" in the evalu- ation of life insurance company stocks. I t would seem to me that the result of reading this paper and the discussion last spring might well warn off any of our members who have any consideration for their repu- tations or that of their profession.
Table 1 of the paper indicates that the "Price-Earnings Ratio" prac- tically doubled in the year 1960-61, and the authors express the opinion that this is not due to an increase in earnings even when these are "ad- justed" but "reflect the public's changing concept of the possibilities for future growth."
The authors state, "The actuary of a stock company is, after all, the employee and servant of the stockholders and, as such, must be respon- sive to their interests to the best of his ability." Does this mean that, whatever imaginative price the shareholders may have paid for the stock or consider as its value, the actuary has to justify that price?
The paper does well to emphasize, after examining the figures of fifty United States stock life companies, that the increase in adjusted earnings in the ten-year period 1954-63 was substantially the result of the increase in excess interest earnings and, if there is a deceleration in the rate at which the net rate earned is increasing, the major source of the increase in earnings will correspondingly diminish. Figures are given to indicate that this turning point may have arrived.
A book by a specialist in life insurance stocks, published in New York in 1963, states the following: "Under the conditions that have prevailed for the past twenty-five years, life insurance is such an incredibly profit-
DISCUSSION 30i
able business that many companies make money, not only 'without really trying,' but in spite of doing nearly everything wrong." t
I t should be emphasized--since they do not do so- - tha t the authors of the paper are referring to nonparticipating business. I would like to stress the essential mutuality of all life insurance and to point out that principles do not change. The following is a quotation from remarks that I made in May, 1931, in a discussion on a paper by James E. Hoskins ( T A S A , XXXII ) .
I t is impossible to determine exactly the rate for a life insurance contract which will extend over an indefinite period of time. When life insurance is transacted in the huge volume with which we are familiar today, the discrep- ancy between the calculated premium and the actual realization must in the aggregate amount to an enormous sum. In other words, there must be huge profits or huge losses.
Presumably investment analysts have decided that we are in a period of "huge profits" and that this extends into the indefinite future. The
• present situation is full of danger not only to the actuarial profession, which may get involved in this "crystal-ball game," but when the in- evitable happens great harm will be done to the life insurance industry.
In this same discussion in May, 1931, I stated:
The result of the War and the Influenza Epidemic immediately following was that almost every company reduced its dividends to participating policy- holders . . . . IT]he backwardness of the larger participating companies in ad- justing their premiums to the changing condition of a lower cost of insurance was a principal feature in aiding the development of nonparticipating life in- surance.
I t is possible that the great United States mutual life insurance com- panies are again not adjusting their practices to current trends and so have been responsible for the current trend to nonparticipating life in- surance.
FREDERICK S. TOWNSEND:
I t is a pleasure to be treated to a paper written by a member of the actuarial profession on the subject of life insurance company equity values--a field of study so abandoned by actuaries that life insurance company presidents must resort to quoting arbitrary rules of thumb used by investment houses rather than more exact analyses which could be, but are not, prepared by actuaries employed by these same com- panies.
The need for actuarial involvement in determining equity values has grown more demanding as a result of several stock market influences in
t Arthur Milton, Life Insurance Stocks: The Modern Gold Rush. (1963).
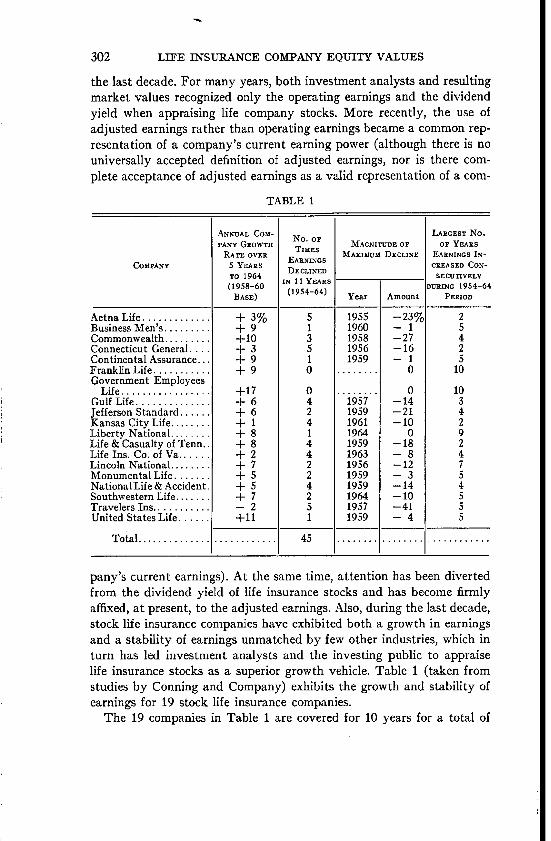
302 L£FE INSURANCE COMPANY EQUITY VALUES
the last decade. For many years, both investment analysts and resulting market values recognized only the operating earnings and the dividend yield when appraising life company stocks. More recently, the use of adjusted earnings rather than operating earnings became a common rep- resentation of a company's current earning power (although there is no universally accepted definition of adjusted earnings, nor is there com- plete acceptance of adjusted earnings as a valid representation of a c o m -
TABLE 1
COMPANY
Aetna Life . . . . . . . . . . . . . ! Business Men's . . . . . . . . . Commonwealth . . . . . . . . . Connecticut General . . . . Continental Assurance... Franklin Life . . . . . . . . . . . Government Employees
Life . . . . . . . . . . . . . . . . . i Gulf Life . . . . . . . . . . . . . . [ Jefferson Standard . . . . . . l Kansas City Life . . . . . . . . Liberty National . . . . . . . . Life & Casualty of Tenn.. Life Ins. Co. of Va . . . . . Lincoln National . . . . . . . Monumental Life . . . . . . NationalLife & Accident. Southwestern Life . . . . . . . ]['ravelers Ins . . . . . . . . . . . United States Life . . . . . .
pany ' s current earnings). At the same time, a t tent ion has been diverted from the dividend yield of life insurance stocks and has become firmly affixed, at present, to the adjusted earnings. Also, during the last decade, stock life insurance companies have exhibited both a growth in earnings and a stabil i ty of earnings unmatched by few other industries, which in tu rn has led inves tment analysts and the investing public to appraise life insurance stocks as a superior growth vehicle. Table 1 (taken from studies by Conning and Company) exhibits the growth and stabili ty of earnings for 19 stock life insurance companies.
The 19 companies in Table 1 are covered for 10 years for a total of
DISCUSSION 303
190 reported years. Out of the 190 years, 45 years showed a decline in earnings. However, of these 45 declines, the following were the causes which can be readily classified:
New tax bill . . . . . . . . . . . . . . . . . . . . . . . . . . . . . . . . . . . . . . . . 14 Declines in earnings due to accident and health results or
Total nonrecurring or outside of life business . . . . . . . . . . 35
Excluding these 35 declines, the total would be 10 out of 190 reported years, or about 5 per cent. I t should be pointed out that most of the significant declines in earnings took place before excess investment income became such a large proportion of total earnings.
In spite of the reappraisal of life insurance stocks which has resulted in a "mature" price-earnings level, I must dispute, for two reasons, the authors' claim that "In excess of 90 per cent of the increase in the market price of life company stocks since 1953 has been due to the increase in price-earnings ratio rather than to an increase in adjusted earnings." Table 2 (taken from studies by Conning and Company) indicates that the authors' claim would apply to only four of thirty-two major stock life companies and only under very unusual circumstances (purchasing stock at 1½ times adjusted earnings, heavy casualty losses in 1963 re- ducing total earnings below 1954 levels, etc.). For the companies included in this table, "two-thirds" would be an appropriate substitute for the "90 per cent" stated in the paper.
Second, I must caution the reader that, regardless of whatever figure between "67 per cent" and "90 per cent" is most representative of the increase in market price due to the increase in price-earnings ratio, this figure is a purely mathematical relationship and does not give a valid interpretation of the effect upon market price caused by a change in earnings. After all, the ratio of market price to earnings (the price-earn- ings ratio) represents the investor's valuation of the prospective growth rate (or decline) in the future earnings of the company. Therefore, it is invalid to state that a change in the price-earnings ratio is independent of the change in a company's earnings. Clearly, the latter affects the former. And it is my contention that the majority (over 50 per cent) of the increase in the market price of life insurance stocks over the last decade has been caused by the increase in the earnings of these com- panies. In other words, if earnings had remained level from 1954 to 1963, I do not believe that an increase in the price-earnings ratio would have accounted for even half the increase in market price experienced during this period.
304 LIFE INSURANCE COMPANY EQUITY VALUES
The authors' Table 4 also presents the reader with a misleading mathe- matical relationship. I t shows that "excess interest earnings" increased by $1.51 per share from 1953 to 1963, while adjusted earnings increased by only $1.12 per share. The implication is that in excess of 100 per cent of the increase in adjusted earnings of life company stocks since 1953 has been due to the increase in "excess interest earnings" rather than to an increase in underwriting earnings (i.e., noninvestment sources of earnings have declined since 1953). This is a contention which has wide support among investment analysts.
Excess investment income is the excess of a company's net investment income over the tabular interest required to maintain the company's reserves. I t should be kept in mind that the above definition of excess investment income arises from an a t tempt to separate the convention statement earnings into those sources from which it was derived--from interest, from mortality, and from loading. Actuaries and other persons familiar with life insurance statement accounting will often be quick to point out that excess investment income as defined above is not the company's " t rue" excess investment income.
Reserves for nonpar policies are based upon more conservative rates of interest and mortality than can be expected in future years. The level of mortality rates in a reserve standard is prescribed by law, but the choice of interest rates is left open to management, generally not to exceed 3½ per cent. The resulting effect is that the more conservative the interest rate chosen for reserve purposes, the lower the interest rate will be and the smaller the tabular interest requirement will be. As a result, for a given aggregate dollar amount of statement earnings, the smaller tabular interest requirement will tend to show greater excess investment income and a lower gain from underwriting or in some cases an under- writing loss. Since the nonpar gross premium rate is generally based upon a higher interest rate than that assumed for reserve standards, the " t rue" excess investment income will be less than that determined from a com- pany's annual statement by deducting tabular interest requirements from the net investment income.
Gains from interest, gains from mortality, and losses from loading were formerly shown in the annual statements of life insurance com- panies but were eliminated in 1939 because the insurance commissioners recognized that these were misleading terms.
On the other hand, arguments advanced to support the presentation of excess investment income figures from a company's annual statement include the following:
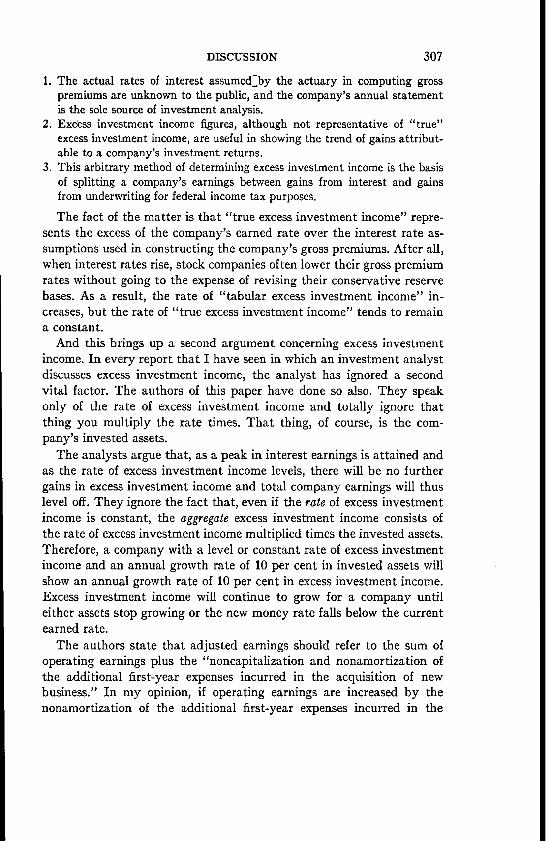
1. The actual rates of interest assumed~by the actuary in computing gross premiums are unknown to the public, and the company's annual statement is the sole source of investment analysis.
2. Excess investment income figures, although not representative of "true" excess investment income, are useful in showing the trend of gains attribut- able to a company's investment returns.
3. This arbitrary method of determining excess investment income is the basis of splitting a company's earnings between gains from interest and gains from underwriting for federal income tax purposes.
The fact of the matter is that "true excess investment income" repre- sents the excess of the company's earned rate over the interest rate as- sumptions used in constructing the company's gross premiums. After all, when interest rates rise, stock companies often lower their gross premium rates without going to the expense of revising their conservative reserve bases. As a result, the rate of "tabular excess investment income" in- creases, but the rate of "true excess investment income" tends to remain a constant.
And this brings up a second argument concerning excess investment income. In every report that I have seen in which an investment analyst discusses excess investment income, the analyst has ignored a second vital factor. The authors of this paper have done so also. They speak only of the rate of excess investment income and totally ignore that thing you multiply the rate times. That thing, of course, is the com- pany's invested assets.
The analysts argue that, as a peak in interest earnings is attained and as the rate of excess investment income levels, there will be no further gains in excess investment income and total company earnings will thus level off. They ignore the fact that, even if the rate of excess investment income is constant, the aggregate excess investment income consists of the rate of excess investment income multiplied times the invested assets. Therefore, a company with a level or constant rate of excess investment income and an annual growth rate of 10 per cent in invested assets will show an annual growth rate of 10 per cent in excess investment income. Excess investment income will continue to grow for a company until either assets stop growing or the new money rate falls below the current earned rate.
The authors state that adjusted earnings should refer to the sum of operating earnings plus the "noncapitalization and nonamortization of the additional first-year expenses incurred in the acquisition of new business." In my opinion, if operating earnings are increased by the nonamortization of the additional first-year expenses incurred in the
308 LIYE INSURANCE COMPAN'Y EQUITY VALUES
acquisition of new business, then such earnings should also be reduced by the amortization of the additional first-year expenses incurred by renewal business. For example, if n represents the amortization period, then
The paper refers to two principal adverse trends in earnings, one of which is "a substantial reduction in rate levels." Since the reduction in rate levels is not covered by the paper the following is an example of the portent of reduced rate levels. I compiled the ordinary life, $10,000 face amount, issue age 35, gross premium rates for the ten largest stock life
• companies (ranked by total 1964 in force) for the period 1935-55 and then examined their ordinary life operating earnings for the decade 1954-63. The company (National Life and Accident) with the consist- ently lowest gross premium rates over most of 1935-55 showed a secular decline in earnings from 1956 to 1963 (from $0.92 to $0.55 per share). The company (Connecticut General) with the consistently highest gross premium rates over most of 1935-55 increased their earnings 1½-fold from 1954 to 1963 (from $1.22 to $3.00 per share). The difference in premium rate for these two companies averaged $1.13 per thousand per year.
To confirm the preceding example of the effect of rate levels upon earnings, refer to Table 3 of Mr. Stein's paper. For the specified policy, face amount, and issue age, a gross premium rate of $27.17 per thousand will reach the break-even point in 6 years, but a gross premium rate of $26.17 per thousand will reach the break-even point in 24 years.
I t should be mentioned that a reduction in rate levels is not an adverse trend in itself; rather, the development of an adverse trend depends upon whether or not the change in rate levels is accompanied by reductions in profit margins. One of the prime questions that investment analysts would like to have answered is, "What is the relative profit margin built into $1,000 of new business going onto the books as opposed to $1,000 of old business in force?"
Inasmuch as the market price of life insurance stocks showed a sharp decline from the spring of 1964 to August of 1965, I would be inclined to alter the authors' definition of "maturi ty" to state that the price-
DISCUSSION 309
earnings ratio had increased above (rather than to) that level which could be justified by the growth rate of adjusted earnings.
The reader should note that the word "mature" applies only to the price-earnings ratio of the industry and is not descriptive of the growth rate in earnings per share. A "mature" price-earnings ratio today will tend to slow future growth in market values but will have no effect upon the future growth in earnings.
The authors' Table 1 is said to be "Based upon a published life stock index"; perhaps the authors could enlighten the readers with regard to which life stock index they used.
The authors state that a future growth rate of earnings per share must be "known" in order to determine a price-earnings ratio. Future growth rates are judgment items and must be "estimated." Nor is the market price "automatically determined" once the future growth rate in earn- ings is estimated. In the field of investment analysis, a price-earnings ratio is dependent not only upon the estimated future growth rate in earnings but also upon the stability of such earnings. If a public utility stock and an auto manufacturer's stock each had the same estimated future growth rate in earnings, it is likely that the stability in earnings would command a higher price-earnings ratio for the public utility stock than for the auto manufacturer's stock.
The rules of thumb developed by the authors to illustrate relative reserve liabilities are applicable to the company's surplus only and cannot be used to interpret earning power. I t should be noted that the rules of thumb are applicable only if the insurance written account is increasing at a constant growth rate. The ratios shown in Tables 5 through 7 will decrease as the proportion of new business to renewal business increases, and vice versa.
The authors state that "the reserve basis does not determine the ulti- mate earnings on a policy." I would alter this to read, "the reserve basis does not determine the ultimate surplus generated by a policy, but re- serves can be used to alter a company's earnings as reported in the sum- mary of operations." A conservative reserve basis, as contrasted to a more realistic reserve basis, will show a larger charge to earnings in the first policy year and lesser charges in renewal policy years. In order to maximize reported earnings, some companies establish a CRVM reserve on new business through the earnings account and immediately strengthen to net level reserves through the surplus account. Thus the company might charge earnings with $2 per $1,000 for the CRVM reserve, charge surplus with $20 per thousand to establish a net level reserve of $22 per thousand, and then, upon lapse for nonpayment of the second year's premium, release $22 of reserves through the earnings account. This
310 LIFE INSURANCE COI~iPANY EQUITY VALUES
choice of reserve method would overstate a company's reported earnings by $20 per thousand for every policy lapsed at the end of the first policy year.
The authors discuss the relative effect of net level and CRVM reserves upon surplus but do not discuss their relative effect upon earnings. Such a discussion is necessary to fully realize "the impact on reported earnings of the reserve basis used by the company."
Reserves have an indirect effect upon ultimate earnings through their relationship to cash values. If cash values grade into reserves, the choice of reserve method affects aggregate surrender liabilities. Where cash values are either minimum cash values or are based upon an interest rate higher than the reserve interest rate, a substantial amount of surplus funds may be hidden in the company's reserve account. In those com- panies which do carry a reserve liability in excess of their cash surrender value liability, reported earnings often decrease if the company experi- ences improved persistency, and vice versa. The relationship of reserves to cash values has a sharp influence on the incidence of earnings.
The authors speak of the "relationship between the annual increase in reserve and gross premiums collected." I am unconvinced that a precise relationship exists between the two, because as a block of permanent in- surance matures the investment income upon the reserves becomes larger in proportion to the reserve net premiums which are being accumulated. Thus, the gross premium has a diminishing relationship to the increase in aggregate reserve as a block of in force ages.
Another relationship with virtually no meaning is that for fifty large stock life companies the reported 1963 earnings before income tax amount- ed to approximately 40 per cent of the increase in reserves. Thus the authors conclude that "For these companies a decrease in reserves of 5 per cent of the reserves would have the effect of increasing before tax earnings by 12.5 per cent." Yet Table 8 is a direct contradiction of the relationship the authors are attempting to establish. If pretax earnings are 40 per cent of the increase in reserves, the model company with 2{ per cent reserves would have pretax earnings equal to 18 per cent of the gross premiums. Application of the 40 per cent relationship indicates a reduction in pretax earnings of 2.8 per cent of gross premiums, while Table 8 states that pretax earnings should be increased by 7 per cent.
Admittedly, earnings are usually related to premium income, and this may be a satisfactory measure for model office studies. However, in real life, the leverage factor which is inherent in a company's interest earn- ings should call for a different measure---perhaps earnings related to the sum of premium income plus investment income.
DISCUSSION 311
I t should be emphasized that, although the basis for computing re- serves and the rate of change in investment yield both affect the growth rate in earnings per share, there are several other significant factors re- ferred to in the paper. The degree of significance of each factor is un- known, and one should not arbitrarily assume that the choice of reserve bases and changing interest yields distinctly outweigh all other factors in degree of significance.
The analysis of life insurance stocks raises many questions and receives few definitive answers. As a result, a wide difference of opinion exists among insurance analysts. Because of the lack of knowledge in this field, and because of the actuary's understanding of the technical aspects of life insurance, I hope that the members of the Society of Actuaries will develop an interest in contributing future articles on this subject.
N. DOUGLAS CAMPBELL:
I think the authors are to be commended for their Actuarial Note, which deals with a very interesting and current subject. I would like to point out, however, that no formula can take into account all the factors involved in determining equity values for life insurance companies. Fac- tors additional to those mentioned in the paper and which have an im- portant influence on equity values are the recent rate of growth of a company; the experience and competence of management; the stock- holders' share of profits from participating business as compared with those from nonparticipating business; the various tax considerations. Numerous investment analysts have made studies of life insurance stocks. Recently some have become quite expert, but many others are not really aware of all the factors which affect a company's future progress. Just one example of a factor which is not widely known is that the federal income tax of life insurance companies in Canada is quite different from that of companies in the United States. I believe that actuaries can make a worthwhile contribution toward a better understanding of life insurance operations and that they should be encouraged to do so. I t is a fact that life insurance stocks have caught the public fancy in recent years, as evidenced by the widespread interest in the new companies which have been formed.
(AUTHORS' R]~VIEW OF DISCUSSION)
TI~OM~AS P. BOWLES, JR., AND LLOYD S. COUGHTRY:
The authors thank each of the persons who discussed their paper. Their discussion enhances the value of the paper, which covers a subject heretofore not formally presented in the proceedings of the Society.
312 LIFE INSURANCE COMPANY EQUITY VALUES
Mr. Milliman's suggested alternate definition of adjusted earnings ignores certain pertinent basic economic facts. If a manufacturing con- cern pays too high a price for a machine, as measured by profits derived from its production, the higher depreciation charge for that machine will reduce earnings below what they would have been had a lower price been paid. So, in the life company, amortized higher acquisition costs reduce future profits. The term "amortization" as used in the paper has the same meaning as depreciation.
We agree that the blind acceptance of either total reported earnings or adjusted earnings will not satisfy the sophisticated analyst. Analysis will reflect profit margins inherent in a rate structure, mix of business, cost of acquisition of new business, and so forth. I t is interesting to note a comment that Mr. Pedoe made in a paper presented to the Society in 1952, entitled "Trend of Life Insurance Company Expenses," in which he states, "New business expenses are comparable to the capital expend- itures by a manufacturing concern. In the very nature of life insurance the first year costs must be spread, to a great extent, over the premium- paying period of the policy."
Mr. Milliman's statement, "In many cases, there will be little differ- ence--in a well-managed, company, at the point of issue, the value of a block of business (being the expected future profits discounted at a rate recognizing the degree of risk) will quite likely be something not much above or below the acquisition cost," raises certain questions. How can the investor be expected to determine the varying degrees of risk? Will the discounted value of future profits be equal to the surplus drain during the first year, which drain includes reserve charge? If it is related to actually paid expenses, it would exclude the reserve. If reported earnings are increased by the value of the business acquired and if the analyst seeks to determine earnings for the year, he must be sure that the "value" is not greater than the "cost." The general technique of valuation used by brokerage houses is to add to reported earnings the value of the in- crease in the in force, not the value of new business produced, as suggested by Mr. Milliman. Neither method, however, satisfies the authors, prin- cipally because over a period of years the aggregate of earnings so ad- justed is greater than real earnings. Over a period of time the book value equation
n n
1 1
where B V x -- book value at end of year x, E~ = earnings during year x, and S, = cash payments to stockholders during year x, if acquisition
DISCUSSION 313
costs have been added to reported earnings, unless there be an amortiza- tion of cost of acquisition of new business.
This formula is an oversimplification of the general assumption that book value at the beginning of the period plus earnings less payments in cash to stockholders should equal book value at the end of the period. This must be modified for certain obvious reasons for the life company because of reserve strengthening, change in nonadmitted assets, capital gains, and so forth.
Mr. Milliman also refers to the "direct approach" to valuation. The paper did not concern itself with the "value of the company" determined as a static value--sometimes referred to either as the liquidation value or the "adjusted book value," so frequently referred to by the analysts. Mr. Milliman's suggestion of adding an amount to represent the value of the agency organization attempts in part to bridge the gap between static and dynamic values or between adjusted book and market values. If earnings are adjusted in the manner suggested by the authors, the productive capacity of the agency organization will be reflected in the growth of earnings. Furthermore, measurement of the value of man- power, that is, the agency organization, does not easily lend itself to measurement either by actuaries or the investment analyst.
Mr. Sutcliffe points out that "quality of management and effects of future competition" are subjective and vital. No analysis can realistically reflect value unless it recognizes, among others, these two areas--neither of which lends itself to precise measurement or projection. Mr. Sutcliffe and the authors again become involved in semantics. A "gross premium valuation" can mean many things. A valuation of business in force is not complete unless recognition is given to "gross premium" levels. A traditional definition suggests that a gross premium valuation is the determination of the discounted value of future profits on business in force on the valuation date based on realistic assumptions as to mor- tality, interest, expenses, and on existing scales of gross premiums. The authors call this a static valuation. Mr. Sutcliffe has expanded this defi- nition to make it encompass earnings from future business, presumably future rate levels, and so forth. Here again is revealed the need for stand- ardization of terms. If two reasonably sophisticated actuaries use the term "gross premium valuation" and are not talking about the same thing, how does the actuary expect the investment community to under- stand what he is talking about?
Mr. Pedoe misquoted the authors when he stated that they indicated that the doubling of the price-earnings ratio in 1960-61 did "reflect the public's changing concept of the possibilities for future growth." The
314 LIFE INSURANCE COMPANY EQUITY VALUES
increase in the P / E ratio to the point of maturi ty as defined, that is, to the level justified by earnings and growth rate and, more specifically, the nearly doubling of that ratio in 1961, was not due to the public's changed appraisal of earnings growth rate but to a sudden awareness of a "sleeper," as evidenced by the fact that life equities were selling at considerably less than that amount justified by the facts. The Sleeping Beauty was awakened in 1961 by the Prince Charming stockbroker. Hence the increased price-earnings ratio resulted more from this awaken- ing, in our opinion, than from a change in the public's appraisal of growth rate.
Mr. Townsend states that "the majority (over 50 per cent) of the in- crease in the market price of life insurance stocks over the last decade has been caused by the increase in the earnings of these companies." The authors, as stated above, do not believe that the facts support this contention.
The responsibility of the actuary, as prophet or seer, is to speak the hour of doom as well as of ecstacy. We share Mr. Pedoe's concern for the future. I t is for this reason that the actuary should not "give" a stock company a set of premium rates. The consultant's job is to counsel with management on the elements of price structure and to guide in the re- sulting management decision process. Management must assume ulti- mately the responsibility for decisions based upon these future contin- gencies which will, as Mr. Pedoe states, lead to "losses or huge profits." The actuary, contrary to the sometimes assumption of the actuary, is not clairvoyant. The intellectually honest actuary admits, for example, that he does not know what interest rate should be the basis of settlement options. His employer should be aware of this inadequacy, and within this framework they together can make intelligent decisions founded on sound economic, social, and even actuarial principles.
Mr. Townsend states that not even "adjusted" earnings are a valid representation of a company's current earnings. The authors believe that actuaries can no longer seek refuge in their esoteric doctrines and refuse to define terms because things are too obscure. This is a weakness of our profession. We must communicate effectively to the nonactuary. The table Mr. Townsend produces shows that only about 67 per cent of the increase in market value resulted from an increase in price-earnings ratio in contrast to our 90 per cent. The per cent developed will depend upon the companies selected and the method used to compute adjusted earn- ings. The authors do not state that "the price-earnings ratio is inde- pendent of a change in a company's earnings." The market responds not only to earnings per share but to the anticipated growth rate in earnings
DISCUSSION 315
per share. The study made by the authors indicates that the adjusted earnings of the life insurance companies reviewed by them have increased at about 7½ per cent per year.
The authors intended to use general terms in the paper so as to avoid controversy, since the purpose of the paper was to focus the actuary's attention upon his need to become involved in analysis and interpreta- tion. I t is for this reason that, in the paragraph that accompanies Table 4, the authors were careful to point out "even though part of the increase in excess interest earnings per share reflects the decline in the rate of interest required on policy reserves . . . . " The underlining of the word "par t" is the recognition of the point Mr. Townsend makes in his dis- cussion. Excess interest earnings must also be related to the assumption used in constructing gross premium rates. Only part of the increase in excess interest reflects the decline in the rate of interest required on policy reserves. The authors have not ignored the impact of increasing assets on increasing interest earnings. A review of Table 4 indicates that the adjusted earnings per share include the increase in investment earnings on increasing assets. The conclusion, contrary to what Mr. Townsend states, can be drawn that, even with the increase in assets, the adjusted earnings per share would probably not have increased unless there had been an increase in the interest rate earned. Therefore, the authors have not ignored the fact that "even if the rate of excess investment income is constant, the aggregate investment income" will continue to increase per share. The combination of all these factors indicates the adjusted earnings would not have increased had there not been the increase in interest earnings.
Mr. Townsend and the authors again face a problem in semantics. The authors stated that reported earnings should be adjusted for the "noncapitalization and nonamortization of additional expenses incurred in the acquisition of new business." This means that the adjustment requires the capitalization of the acquisition expense and amortization of those expenses, as Mr. Townsend suggests in his formulas.
Mr. Townsend indulges himself in specious reasoning when he implies that conclusions can be drawn by relating the "secular decline in earnings" of one life company to its consistently having the lowest gross premium rates and, contrariwise, the increase in earnings of another company to its consistently having the highest gross premium rates.
Mr. Townsend's relating the authors' statement of the ratio of the actual reserve increases for fifty selected large stock life companies to their pretax earnings to the model office shown in Table 8 of the paper is not valid.
316 LiFE INSURANCE COMPANY EQUITY VALUES
The published life stock index referred t~) in the authors' paper is an index developed and published periodically by Bowles & Tillinghast, Inc.
Mr. Campbell properly points out the need for caution in applying United States technique to Canadian companies because of the difference in federal income tax. The other pertinent factors tested by Mr. Camp- bell, not the least of which are experience and competence of manage- ment, are vital to an acceptable analysis.
Analysis of life insurance stocks raises many questions and has re- ceived practically no definitive answers from actuaries. As a result, the investment community, being less sophisticated in the fundamentals of the business, has been floundering while the actuaries have done nothing but sit on the sidelines and take pot shots at the investment analyst. The actuary should take the position of leadership in this area and'bring light into abysmal darkness, even though he may necessarily start only with a candle. Perhaps, if the members of the Society would add their collective thinking to this sorely neglected subject, the candle might become a star.
The authors wish to acknowledge the assistance of Clint E. Edwards, A.S.A., in establishing the structure of the model office projections;