NIST Special Publication 260-197 Certification of Standard Reference Material ® 2193b Calcium Carbonate [used as saturated Ca(OH) 2 solution] Regina A. Easley Jason F. Waters William F. Guthrie This publication is available free of charge from: https://doi.org/10.6028/NIST.SP.260-197
Transcript
NIST Special Publication 260-197
Certification of Standard Reference Material® 2193b Calcium Carbonate [used as saturated Ca(OH)2 solution]
Regina A. Easley Jason F. Waters
William F. Guthrie
This publication is available free of charge from: https://doi.org/10.6028/NIST.SP.260-197
Certain commercial entities, equipment, or materials may be identified in this document to describe an experimental procedure or concept adequately.
Such identification is not intended to imply recommendation or endorsement by the National Institute of Standards and Technology, nor is it intended to imply that the entities, materials, or equipment are necessarily the best available for the purpose.
National Institute of Standards and Technology Special Publication 260-197 Natl. Inst. Stand. Technol. Spec. Publ. 260-197, 36 pages (May 2019)
CODEN: NSPUE2
This publication is available free of charge from: https://doi.org/10.6028/NIST.SP.260-197
Abstract This publication documents the production, analytical methods, and statistical evaluations involved in production of this SRM.
Keywords Calcium carbonate, CaCO3
Calcium hydroxide, Ca(OH)2 pH
Standard Reference Material (SRM)
Technical Information Contact for this SRM Please address technical questions about this SRM to [email protected] where they will be assigned to the appropriate Technical Project Leader responsible for support of this material. For sales and customer service inquiries, please contact [email protected].
______________________________________________________________________________________________________ This publication is available free of charge from
Table of Contents Purpose and Description ........................................................................................................... 1 Storage ...................................................................................................................................... 1 Preparation and Use .................................................................................................................. 1 History and Background ........................................................................................................... 2 Solution and Electrode Preparation .......................................................................................... 3
Homogeneity Assessment ......................................................................................................... 5 Table 1. Bottles Used in the Homogeneity Assessment .................................................... 6 Table 2. Results of Homogeneity Assessment for SRM 2193b ........................................ 6
Certification of pH(S) ............................................................................................................... 7 Randomization Protocol ........................................................................................................ 7
Table 3. Solution Randomization Protocol for Certification Measurements a .................. 7 Harned Cells and Measurement Preparations ....................................................................... 8 Measurement of Cell Potentials ............................................................................................ 8
Table 4. Temperature-Dependent Parameters Used in the Determination of pH(S) ......... 9 Table 5. E°, uA(E°), and uA[p(aHγCl)°] Values as a Function of Temperature .................. 9
Calculation of pH(S) ............................................................................................................. 9 Certification Values ............................................................................................................. 11
Calculation of Uncertainties ................................................................................................... 13 Table 8. Summary of Uncertainty Components .............................................................. 13
Calculation of uc(meas), kmeas, and U(meas) ....................................................................... 14 Calculation of Values for kcert and U(cert) .......................................................................... 16
Certificate of Analysis ............................................................................................................ 17 References ............................................................................................................................... 18 Appendix A: Heterogeneity Analysis of SRM 2193b ............................................................ 19 Appendix B: Uncertainty Component Details, 5 °C to 50 °C ................................................ 23 Appendix C: Calculation of uc(bHCl) ....................................................................................... 29
______________________________________________________________________________________________________ This publication is available free of charge from
: https://doi.org/10.6028/NIST.SP.260-197
iii
Table of Tables Table 1. Bottles Used in the Homogeneity Assessment ........................................................... 6 Table 2. Results of Homogeneity Assessment for SRM 2193b ................................................ 6 Table 3. Solution Randomization Protocol for Certification Measurements a ......................... 7 Table 4. Temperature-Dependent Parameters Used in the Determination of pH(S) ................ 9 Table 5. E°, uA(E°), and uA[p(aHγCl)°] Values as a Function of Temperature .......................... 9 Table 6. NIST Certification Results ....................................................................................... 11 Table 7. Certification Results Excluding uB-G. ....................................................................... 12 Table 8. Summary of Uncertainty Components ..................................................................... 13 Table A-1: Data for Analysis of Variability from Different Sources in SRM 2193b............. 18 Table A 2: Output from Models with Different Priors ........................................................... 20 Table A-3: Summary Statistics for a New Bottle of SRM 2193b .......................................... 21 Table B 1. Detail of Uncertainty Components for SRM 2193b, 5 °C .................................... 22 Table B 2. Detail of Uncertainty Components for SRM 2193b, 10 °C .................................. 22 Table B 3. Detail of Uncertainty Components for SRM 2193b, 15 °C .................................. 23 Table B 4. Detail of Uncertainty Components for SRM 2193b, 20 °C .................................. 23 Table B 5. Detail of Uncertainty Components for SRM 2193b, 25 °C .................................. 24 Table B 6. Detail of Uncertainty Components for SRM 2193b, 30 °C .................................. 24 Table B 7. Detail of Uncertainty Components for SRM 2193b, 35 °C .................................. 25 Table B 8. Detail of Uncertainty Components for SRM 2193b, 37 °C .................................. 25 Table B 9. Detail of Uncertainty Components for SRM 2193b, 40 °C .................................. 26 Table B 10. Detail of Uncertainty Components for SRM 2193b, 45 °C ................................ 26 Table B 11. Detail of Uncertainty Components for SRM 2193b, 50 °C ................................ 27
Table of Figures Figure 1: Sales History of SRM 2193 and 2193a ..................................................................... 2 Figure A 1: ∆pH values plotted in measurement, run, and bottle order ................................. 19
______________________________________________________________________________________________________ This publication is available free of charge from
: https://doi.org/10.6028/NIST.SP.260-197
Page 1 of 28
Purpose and Description This Standard Reference Material (SRM) is intended for use in preparing solutions for calibrating electrodes for pH measuring systems at pH values above 11.0. SRM 2193b Calcium Carbonate (CaCO3) was selected for its low level of alkali metal impurities and prepared to ensure high purity and uniformity. However, this SRM is certified ONLY as a pH standard [pH(S)], not as a pure substance. A unit of SRM 2193b consists of 30 g of calcium carbonate.
Storage SRM 2193b is stable when stored in its original container, with the cap tightly closed, in a dry environment, under normal laboratory temperatures, and protected from acid fumes. The saturated solution of Ca(OH)2, prepared as described below, should be freshly filtered before use in pH calibrations.
Preparation and Use The water used for preparation of the SRM 2193b buffer solution should be protected from atmospheric carbon dioxide. This water must be prepared either by (1) boiling of distilled water (conductivity < 2 μS cm-1) for 10 min and guarding it with a soda-lime tube while cooling or (2) dispensing water directly from a deionization-based point-of-use system into the vessel used to prepare the buffer solutions (resistivity > 17 MΩ cm, conductivity < 0.06 μS cm-1). Prepared solutions must be protected against evaporation and contamination. Put 7.5 g SRM 2193b into a platinum or fused silica (Vycor) crucible or dish, heat slowly in a muffle furnace to 950 °C to 1000 °C and ignite for 1 hour at this temperature. Immediately transfer the product (CaO) to a desiccator and allow to cool. After cooling, gently crush any lumps and add slowly to 100 cm3 carbon dioxide-free water while stirring. Heat the resulting Ca(OH)2 suspension to boiling for 15 minutes, cool, and filter on a sintered-glass funnel of medium porosity. Dry the resulting solid Ca(OH)2 in an oven for 2 h at 110 °C and crush in a mortar and pestle to a fine powder. Put the obtained Ca(OH)2 (approximately 5 g) into a 1 dm3 plastic bottle, add approximately 1 kg carbon dioxide-free water and shake the bottle periodically (nominally every 2 h, four times per day). Between periods of shaking, maintain the bottle at 25 °C in a thermostated water bath. By this procedure, approximately 1 week is required to obtain a truly saturated solution (0.0203 mol kg-1 [5]). After 1 day of mixing the excess Ca(OH)2 with water, the solution pH is lower than that of the saturated solution by approximately 0.02 pH units. After two days, the difference decreases to approximately 0.01 pH units. Immediately before use, filter a portion of the saturated Ca(OH)2 solution – a syringe feeding a 0.45 μm in-line filter works well. Use the fresh filtrate as the pH standard. The filtered saturated Ca(OH)2 solution will develop a CaCO3 film on its surface in a few minutes. Although the pH of this filtered solution changes only slightly in 1 h, it is preferable to use a fresh filtered solution for each measurement. Provided that excess Ca(OH)2 is present, the stock saturated solution maintains its pH value when stored in the thermostated water bath.
______________________________________________________________________________________________________ This publication is available free of charge from
: https://doi.org/10.6028/NIST.SP.260-197
Page 2 of 28
For the pH measurement of highly alkaline solutions (> 11), a 2-point calibration is suggested. Prepare and use 0.01 mol kg-1 borax (SRM 187f or current renewal) as the first standard and adjust the pH meter accordingly. Then use the freshly filtered, saturated Ca(OH)2 solution prepared from SRM 2193b as the second standard and adjust the temperature compensation to set the pH reading to the certified value. Notice: For pH measurements in highly alkaline solutions using commercial glass-reference electrode systems, larger uncertainties are to be expected. The sources of this uncertainty are: (1) changing liquid junction potential with increasing concentration of the highly mobile OH- ions; (2) non-ideal performance of glass electrodes, including poorer reproducibility, sluggish response, and “sodium error”; and (3) higher sensitivity of pH to temperature changes. An uncertainty of 0.05 pH is not uncommon and is reasonable for pH measurements in highly alkaline solutions.
History and Background SRM 2193b is the third member of the SRM 2193 Calcium Carbonate series. The supply of the previous material, SRM 2293a, was exhausted in 2016. Figure 1 displays the sales history of the previous members of the series.
Figure 1: Sales History of SRM 2193 and 2193a
The lines trace the sale of the SRM 2193 and SRM 2193a units over time. The magenta labels state the average yearly sales rate for these materials.
2193
2193
a
050
100
150
200
250
15.6 units/year
9.5 units/year
1992 1997 2002 2007 2012 2017
Uni
ts S
old
Calendar Year
Calcium Carbonate, pHSRM 2193
______________________________________________________________________________________________________ This publication is available free of charge from
: https://doi.org/10.6028/NIST.SP.260-197
Page 3 of 28
SRM 2193b is supplied in solid form as calcium carbonate, CaCO3. To prepare the buffer, the SRM material is converted first to calcium oxide, CaO, and then to calcium hydroxide,Ca(OH)2. The buffer comprises an aqueous solution saturated at 25 °C with Ca(OH)2. Samples from 12 stratified-random-selected bottles of candidate SRM 2193b were checked for homogeneity using glass electrode measurements. The certification value was then assigned based on primary pH measurements in Harned cells, using a composite sample from the same bottles. The assigned uncertainty incorporates the results of both sets of measurements. Certification pH(S) values presented in this report are valid only for renewal SRM 2193b and do not apply to other renewals (e.g., SRM 2193a).
Solution and Electrode Preparation Homogeneity buffer solution preparation The homogeneity assessment was performed prior to certification, using buffers independently prepared from each of the 12 individual bottles of the candidate SRM 2193b and one bottle of SRM 2193a (previous issue used as the calibrant for the homogeneity assessment). Preparation of the Ca(OH)2 buffer solution followed the procedure given in the certificate for SRM 2193a [1]. Ultrapure reagent grade (resistivity > 18 MΩ cm), filtered (0.22 µm) water was used to prepare all solutions. A nominal mass of 7.5 g was taken from each bottle. Samples of SRM 2193a and SRM 2193b were ignited in Vycor crucibles for 1 h at 950 °C to 1000 °C in a muffle furnace. Each CaO sample was slowly added to 100 cm3 water and the suspension was boiled on a hot plate for 15 min. After the suspension cooled, it was filtered on a medium-porosity glass filter, and the collected solid Ca(OH)2 was dried in an oven for 2 h at 110 °C and ground in a mortar and pestle to a fine powder. The powdered Ca(OH)2 (4.38 to 6.34 g recovered) was added to 400 cm3 (nominal) water and was saturated at 25 °C in a Techne S1500 Orbital Incubator/Shaker for at least one week with constant shaking.
Harned cell buffer solution preparation The SRM 2193b buffer solution for the certification was prepared from a composite sample consisting of nominally equal masses from each individual bottle (7.1 g to 7.5 g) to yield 63.39 g of solid Ca(OH)2. The composite buffer was prepared in a single carboy and saturated in a temperature bath at 25 °C in 9.438 kg water for at least a week with periodic (nominally every 24 h) shaking. From this stock solution, 12 buffer solutions containing added sodium chloride (NaCl) were prepared in four sets by adding filtered Ca(OH)2 solution to weighed amounts of NaCl. Each set contained one solution at each molality (bNaCl): (0.005, 0.01, or 0.015) mol kg-1. The NaCl (Merck Suprapur, stated Br level <10 µg g-1) was dried for 4 h at 110 °C and stored in a desiccator before use. The exact value of bNaCl was calculated from the measured masses of buffer and NaCl used to prepare each solution. Each buffer solution was designated by a code giving the chloride molality in mmol kg-1 and stock buffer solution (e.g., 10B represents the solution with bNaCl = 0.010 mol kg-1 prepared from
______________________________________________________________________________________________________ This publication is available free of charge from
: https://doi.org/10.6028/NIST.SP.260-197
Page 4 of 28
stock solution B). Solutions were stored in sealed Mylar bags until use. Certification measurements were performed within 10 days of the buffer preparation. Hydrochloric acid solution preparation Analytical reagent-grade hydrochloric acid (HCl) (Mallinckrodt AR, stated Br level <0.005 %) was used for the measurements of the standard redox potential, E°, of the Ag|AgCl electrodes. A 19 L batch of HCl with a nominal molality of 0.01 mol kg-1 was previously prepared and stored in a glass bottle fitted with a trap to minimize evaporation of the solution on storage. The molality of HCl was assayed by coulometric acidimetry using a 1 mol kg-1 potassium chloride (KCl) supporting electrolyte [2,3]. The mean of twelve coulometric titrations, performed prior to, concurrent with, and after the Harned cell measurements, was used in the pH(S) calculations. The coulometrically-determined value of the HCl molality (determined as H+) was 0.010 009 50 mol kg-1; its uncertainty is discussed below (see: Calculation of Uncertainties). Electrode preparation The Pt electrodes consisted of Pt black on a Pt substrate (platinized Pt) and are referred to hereafter as Pt electrodes (Pt|H2 in Harned cells). The electrodes were replatinized in 2004 for the certification of SRM 187e (borax pH SRM) [4]. Pt flags approximately 0.5 cm by 1.5 cm in size were spot-welded to Pt wire. Prior to platinization, the Pt flags were cleaned of Pt black by immersion in heated 4 mol L-1 HCl + 2 mol L-1 HNO3 (“50 % aqua regia”). Each was platinized for 5 min at a constant current of 100 mA in a U-tube filled with 2 % Pt(II) in 2 mol L-1 HCl with 0.005 % Pb(C2H3O2) added. During the deposition, the solution in the U-tube was agitated, yielding electrodes that were uniform black in color. A Pt wire was the anode. Following platinization, the Pt electrodes were rinsed in a stream of water and stored in deionized water between uses. Individual Pt electrodes were “paired” with specified Ag|AgCl electrodes for all measurements. The thermal electrolytic Ag|AgCl electrodes (“Batch F”) were previously prepared using high-purity 1 mm Ag wire (Puratronic, 99.999 %) and Ag2O [5] and were stored in 0.01 mol kg-1 HCl since their preparation. The Ag|AgCl electrodes were equilibrated overnight (14 h) in the respective solution for the next day’s Harned cell measurement. The Ag|AgCl electrodes were stored in 0.01 mol·kg-1 HCl if the time to the next analysis was more than a day. At the start and conclusion of the certification measurements, the potentials of each of the six Ag|AgCl electrodes were compared in the 0.01 mol kg-1 HCl storage solution against a single reference Ag|AgCl electrode from a previous electrode batch which was not exposed to the alkaline buffer. The maximum deviation among the six electrodes used in the Harned cells prior to the certification was 50 µV and post certification was 32 µV. The average offset electrode potential, as compared to the single reference Ag|AgCl electrode, prior to certification was 327 µV and the average post certification (after exposure to the alkaline buffer) was 126 µV. The average shift in electrode potential over the duration of the measurements of -200.8 µV was intrinsically factored into the overall uncertainty budget of the E° determination, uA(E°).
______________________________________________________________________________________________________ This publication is available free of charge from
: https://doi.org/10.6028/NIST.SP.260-197
Page 5 of 28
Homogeneity Assessment
Measurement of pH was performed with a Keithley model 6514 electrometer connected to a Thermo Scientific Orion micro combination pH electrode (glass electrode + Ag|AgCl internal reference electrode). Samples were stored at 25 °C in a Techne S1500 Orbital Incubator/Shaker until use and were then thermostated in a GeneMate digital dry bath, the temperature of which remained within a ±0.05 °C range for all runs. The meter/electrode assembly was calibrated with standard buffers of SRM 187e prepared according to certification instructions [9] and SRM 2193a. The SRM 2193b test samples were prepared as stated above. The pH electrode response (slope factor) was determined with two, freshly prepared standard buffers (SRM 187e and SRM 2193a). The pH electrode was equilibrated for approximately 30 min in the SRM 2193a solution prior to the start of the homogeneity assessment. For each measurement, the pH electrode was placed in the sample (contained in 2 cm3 microcentrifuge tubes) and the solution was stirred with the electrode for 30 s. The glass electrode potential (vs. the Ag|AgCl reference electrode) was measured in the quiescent solution after an additional 30 s. The SRM 187e borate buffer was measured at the start and end of each run to determine the practical pH electrode response (slope) factor, k′, while minimizing any memory effects on the liquid junction potential within the set of calcium hydroxide measurements. Before and after each sample measurement, an aliquot of the SRM 2193a calibrant was measured using this same protocol. Each potential reading was recorded to 0.01 mV (corresponding to roughly 0.0002 pH units). The protocol corrected for small drifts in the pH electrode response by measuring the difference in pH (∆pH) obtained from the mean of the two bracketing aliquots of the SRM 2193a calibrant measured immediately preceding and following the SRM 2193b sample. The ∆pH between the SRM 2193a calibrant and each sample for the ith sample, ∆pHi, was calculated by Eq. 1 where EA and EA′ are the potentials recorded for the bracketing SRM 2193a calibrant aliquots A and A′, and Ei is the potential recorded for the SRM 2193b sample:
∆pHi = Ei-EA+EA’
2 k'⁄ (1)
Following each measurement of EA′, the difference EA- EA′ was calculated. If EA- EA′ was greater than 0.25 mV (corresponding to roughly 0.004 pH units), the preceding three measurements (EA, Ei, and EA′) were repeated. This protocol eliminated bias in cases where sudden shifts or high drift rates were present, while preserving the experimental design. The homogeneity assessment used a nested experimental design, based on a hierarchical variance components model. The design yielded two ∆pHi values for three SRM units in each run; the set of 12 SRM units was measured in the four runs over two days. Values are reported as ΔpHi to emphasize that they are used for homogeneity assessment only and not for assignment of the pH(S) value of the SRM. Values of ΔpHi were analyzed using a random effects statistical model based on the experimental design. The model was fit using Bayesian methods to determine a probability distribution for the value of the bottle-to-bottle standard deviation. The bottle-to-bottle standard deviation was shown to not depend heavily on assumed prior probability distributions incorporated in the fit of ΔpHi to the model. See Appendix A for details of this analysis.
______________________________________________________________________________________________________ This publication is available free of charge from
: https://doi.org/10.6028/NIST.SP.260-197
Page 6 of 28
Table 1 details the bottle numbers of the SRM 2193b units used the homogeneity assessment. Table 2 summarizes the results of the homogeneity assessment.
Table 1. Bottles Used in the Homogeneity Assessment Set 1 Set 2 Set 3 Set 4
a Provided by NIST Statistical Engineering Division analysis. Based on the results of the homogeneity assessment, a minimum of 7.5 g of SRM 2193b should be used to prepare pH(S) buffer solutions as described above, yielding ca. 130 g of solution. Use of smaller mass of SRM 2193b may increase the uncertainty of pH(S) of the prepared solution, if the material is heterogeneous at that level.
______________________________________________________________________________________________________ This publication is available free of charge from
: https://doi.org/10.6028/NIST.SP.260-197
Page 7 of 28
Certification of pH(S) The following subsections present the procedure for the primary measurements for certification of pH(S). Randomization Protocol The certification procedure for pH SRMs entails measurements in six Harned cells filled either with buffer solution or with 0.01 mol kg-1 HCl according to the randomization protocol outlined in Table 3. Cells containing buffer yield corrected cell potentials, EI. Cells containing HCl yield corrected cell potentials, EII. The EII values are used in the determination of the E° values of the respective Ag|AgCl electrodes.
Table 3. Solution Randomization Protocol for Certification Measurements Run 1A/1B Run 2A/2B Run 3A/3B Cell
Subsets of each run are denoted by the A and B following the run number. Twelve buffer solutions were randomized among three measurement sets, subject to the following conditions:
1. Four buffer solutions and two 0.01 mol kg-1 HCl solutions were measured in each run. 2. Each of the 12 buffer solutions was measured once at each temperature. 3. In each run, EI values were measured for solutions with each value of bNaCl. 4. In each run, EI values were measured for one pair of solutions having the same
nominal value of bNaCl, but from separate source buffers as described in Harned cell buffer solution preparation, above.
5. In the whole set of measurements, each Harned cell was used for EI measurements with two different values of bNaCl, plus its EII (HCl) measurement.
Each measurement set (designated 1, 2, and 3) was composed of two subsets, designated by A or B following the set number (1A, 1B, . . ., 3A, 3B). Each set took two successive workdays. Subset A of each set consisted of measurements performed at (25, 5, 10, 15, 20, and 25) °C and were performed on the first day for sets 2 and 3 and second day for set 1. Subset B consisted of measurements performed at (25, 30, 35, 37, 40, 45, 50, and 25) °C and were performed on the first day for set 1 and on the second day for sets 2 and 3. In each subset, the concluding measurement at 25 °C, denoted by “recheck”, was performed to evaluate the uncertainty component associated with the given series of measurements. The ordering of the solutions in subsets A and B of each run (with respect to the cell and electrode numbers) was identical. The order of the measurement temperatures in the “staircase” was selected to expedite the measurements and to minimize the use of ice,
______________________________________________________________________________________________________ This publication is available free of charge from
: https://doi.org/10.6028/NIST.SP.260-197
Page 8 of 28
required for the 25 °C to 5 °C transition in subset A and 50 °C to 25 °C transition in subset B. The entire series of measurements (subsets 1A through 3B) was performed in six workdays. This randomization protocol permits direct, simultaneous comparisons of two pairs of cells containing identical solutions (two buffer, two HCl) at all times within every run, yet it preserves the overall randomization of the set of measurements yielding a given pH(S) value. These features are significant in providing quality assurance to the primary pH measurement. Harned Cells and Measurement Preparations The six Harned cells used in this work each consisted of a single glass unit comprised of three humidification tubes in series connected to a two-compartment electrochemical cell of ca. 30 cm-3 volume. No frit was used in any of the humidification tubes, nor at the H2 inlet to the electrochemical cell. The cells were thermostated in a water bath (Fluke Corporation, Model 7009) to a precision of ±0.002 °C for all measurements. Temperature of the water bath was measured with a platinum resistance thermometer (Hart Scientific, Model 5628) and digital temperature readout (Hart Scientific, Model 1502a). Each Ag|AgCl electrode was pre-equilibrated overnight (> 14 h) in a test tube containing a separate aliquot of the solution to be measured on the following day. After each Ag|AgCl electrode was transferred to its scheduled Harned cell, the remaining aliquot in the test tube was used to rinse the corresponding Pt|H2 electrode before insertion into the given Harned cell. Measurement of Cell Potentials Measured cell potentials, Emeas, were obtained at atmospheric pressure, patm. Each Emeas value was corrected to the standard pressure for the H2 gas, p° = 101 325 Pa, yielding the corrected cell potential, Ecell:
°
−−=
ppp
FRTEE OHatm
meascell2log10ln5.0
(2)
where R is the gas constant (8.314 4598 J mol-1 K-1 [6] ), T is the thermodynamic temperature of the bath (and cells), F is the Faraday constant (96 485.332 89 C mol-1[6]), and pH2O is the vapor pressure [7] of water at T. The term RT ln 10/F is designated as k, which has dimensions of V. Values of T and patm used in Equation 2 were noted at the specific time that the Emeas values were recorded for each sample. The input to the digital voltmeter was nulled to zero immediately before recording each set of Emeas values to correct for thermal contact offsets. At each temperature, Emeas for each cell was recorded at 5 min intervals until all six values were stable [drift rate less than 1 µV min-1 (10 µV in 10 min)]. Typically, a period of 40 min at the given temperature was required to meet this condition. A minimum of 120 min was used before the initial 25°C measurements in each run to ensure quantitative purging of O2 from the Harned cells and saturation of Pt electrode surface with H2.
______________________________________________________________________________________________________ This publication is available free of charge from
: https://doi.org/10.6028/NIST.SP.260-197
Page 9 of 28
A flow rate of 0.35 cm3 s-1 to 0.53 cm3 s-1 of H2 was used depending on the given cell. Three series-connected humidification chambers of total volume ca. 50 cm3 (when totally filled) supplied H2 saturated with H2O vapor to the H2 nozzle of the chamber of the electrochemical cell containing the Pt|H2 electrode. Table 4 reports the temperature-dependent parameters used to determine pH(S). Values for E°, uA(E°), the standard potential of the Ag|AgCl electrodes and the Type A uncertainty [8] of the extrapolation, uA[p(aHγCl)°] are listed in Table 5 for each temperature.
Table 4. Temperature-Dependent Parameters Used in the Determination of pH(S) T/°C pH2O/kPa [7] γ±HCl [9] Ibuffer [10] AD [10,11]
a Type A uncertainty for a single extrapolation to p(aHγCl)°. Calculation of pH(S)
______________________________________________________________________________________________________ This publication is available free of charge from
: https://doi.org/10.6028/NIST.SP.260-197
Page 10 of 28
Values of Ecell for cells I and II below are referred to hereafter as EI and EII. The term “measurement” incorporates the recording of patm and subsequent correction to yield Ecell at the standard pressure, p° = 101 325 Pa. Measurements of EI for cell I,
were obtained for the 12 buffer solutions. Measurements of EII for cell II,
Pt|H2(g, p°)|HCl(bHCl)|AgCl|Ag (II)
were simultaneously performed using the coulometrically-standardized HCl to determine the E° values of the Ag|AgCl reference electrodes. Values of E° were calculated from each EII according to Equation 3:
°−=° ±
bbkEE HClHCl
II log2 γ
(3)
where γ±HCl is the mean activity coefficient of HCl at molality bHCl and b° = 1 mol·kg-1. Values for γ±HCl are taken from [12] for each temperature. Measurement of EII and subsequent calculation of E° is referred to below as the “determination of E°.” Values for the acidity function, p(aHγCl), were calculated for each measured EI value using Equation 4, where the operator p represents −log10:
°
+°−
=b
bk
EEa NaClIClH log)()p( γ (4)
The value of E° used in Equation 4 was the mean of the set of six determinations of E° performed at the given temperature. The least-squares line of the 12 values for p(aHγCl) was then extrapolated to bNaCl = 0 to yield p(aHγCl)° at the given temperature. The value for the pH, paH, was calculated from this p(aHγCl)° value using Equation 5: paH = paHγCl°+ log γCl° (5) where log γCl° is the trace activity coefficient of the Cl- ion at the ionic strength, I (SI unit: mol kg-1), of the buffer. The value of log γCl° was obtained from the Debye-Hückel function using the Bates-Guggenheim convention [11]:
log γCl° = - AD√I 1+1.5√I . (6) Values for the Debye-Hückel constant AD were taken from [5,12] for each temperature. Values for I include the effect of the dissociation of the buffer [10]. Following the calculation of paH at each temperature, the final recommended standard pH value at each temperature, pH(S), was obtained by performing a polynomial curve fit [5] of the entire set of 12 experimental paH values using Equation 7, where A, B, C, and D are the parameters of the curve fit; numeric values of the curve fit parameters are given in the
______________________________________________________________________________________________________ This publication is available free of charge from
: https://doi.org/10.6028/NIST.SP.260-197
Page 11 of 28
footnote of Table 6. The paH value determined at 25 °C (“25 °C down” and “25 °C up”) was entered as one point in the curve fit
pH(S) = A + B KT
- C TK
+ D T2
K2. (7) Certification Values Table 6 lists the certification pH(S) values for SRM 2193b from T = 5 °C to T = 50 °C at 5 °C intervals, plus at T = 37 °C along with summary of the combined standard uncertainties, uc(cert), and the certified 95 % expanded uncertainties, U(cert). The equation for the polynomial curve fit is listed as a footnote.
Table 6. NIST Certification Result t/°C pH(S)a uc(cert)b kcert
a Equation for determining pH(S): pH(S) = 2.64915 + 3664.76 KT
- 0.023670 TK
+ 5.14012x10⁻⁵ T2
K2 b Combined standard uncertainties, including uB-G, for the certified pH(S) values c Coverage factors for the certified pH(S) values d Approximate 95 % expanded uncertainties for the certified pH(S) values
______________________________________________________________________________________________________ This publication is available free of charge from
: https://doi.org/10.6028/NIST.SP.260-197
Page 12 of 28
Table 7 lists uc(meas), the combined standard uncertainty of the measurement; kmeas, the coverage factor of the measurement; and U(meas), the expanded uncertainty of the measurement proper. Values of uc(meas) and U(meas) include all known instrumental factors pertaining to this primary pH measurement [8] but exclude the contribution from the inherent uncertainty of the Bates-Guggenheim convention [11].
a Values of pH(S) are the same as in Table 6, but are reported to the number of decimal places corresponding to two significant figures for uc(meas).
b Includes all components of the pH(S) measurement and homogeneity assessment but excludes the estimated uncertainty of the Bates-Guggenheim convention.
______________________________________________________________________________________________________ This publication is available free of charge from
: https://doi.org/10.6028/NIST.SP.260-197
Page 13 of 28
Calculation of Uncertainties The basis for each source of uncertainty is summarized in Table 8. Detailed values for each certification temperature are given in Appendix B.
Table 8. Summary of Uncertainty Components Component Type Basis for u(xi)a
pH(S) curve fit A Standard deviation, at certification temperature, of polynomial curve fit obtained from set of experimental paH values (see Eq 8).
uA, for Ag|AgCl electrode standard potential, E° A
Standard deviation of mean of 6 E° determinations performed concurrently with buffer measurements.
SRM homogeneity A
Fit using Bayesian methods implemented via Markov Chain Monte Carlo simulation using a random effects statistical model based on the experimental design.
HCl molality, [uc(bHCl)] A+B Combined standard uncertainty, uc, of coulometric determination. Includes Type A and Type B components (see text below).
Measured cell potential, Emeas, in EI measurements
(digital voltmeter, DVM) B
Calibration [28], 21.4 µV V-1 relative. DVM verified each day by check of Weston cell and zeroed before each measurement.
Activity coefficient, γ±HCl B 0.0002 (uniform distribution) by evaluation of literature sources.
Emeas for E° (EII) measurements (DVM) B Calibration, verified as above.
NaCl molality, uc(bNaCl) B Combined standard uncertainties of weighings and of molar mass [13]
Temperature, T (combined for EI and EII cells, assumed
correlated) B
uc of Pt resistance thermometer (0.005 K, 95 % confidence interval), bridge display (0.005 K, 95 % confidence interval), and observed stability of bath (0.008 K).
Gas constant, R B CODATA uc [6]. Pressure, patm B 0.01% of digital barometer reading.
Faraday constant, F B CODATA uc [6].
Temperature cycling, u(T cycling) B
Absolute value of difference in p(aHγCl)° values for “25 °C” and “25 °C recheck” sets (as applicable), taken as uniform distribution.
a Except as noted, numerical uncertainties, ai, or relative half-widths, ai/xi, of a rectangular (uniform) distribution of possible values of the input quantity, xi. See Tables 3a through 3k for the corresponding normalized u(xi).
______________________________________________________________________________________________________ This publication is available free of charge from
: https://doi.org/10.6028/NIST.SP.260-197
Page 14 of 28
Calculation of uc(meas), kmeas, and U(meas) The values of ci (sensitivity factor), u(xi) (standard uncertainty), ui(y) (component of the combined standard uncertainty), and vi (degrees of freedom of u(xi)) are calculated for the ith component. Unless otherwise noted, the u(xi) for each Type B component to the uncertainty was treated as having a uniform probability distribution. All values of ui(y) associated with the pH(S) measurement are summed in quadrature to obtain the combined standard uncertainty of the measurement, uc(meas), which has veff(meas) degrees of freedom. For the determination of E°, the combined Type A uncertainty components, uA(E°); and the combined Type B uncertainty components, uB(E°), are tabulated separately. The value of U(meas) of the pH(S) measurement is calculated by multiplying uc(meas) by kmeas. The value of kmeas corresponds to approximately 95 % confidence, based on the value of veff (meas) calculated from the Welch-Satterthwaite equation [14,15]. The values of ci, u(xi), ui(y), vi, uc(meas), veff (meas), kmeas, and U(meas) are calculated following ISO guidelines [8].
The Type A uncertainty of the measurement was obtained by combining the uncertainties of the curve fit to obtain pH(S), the Type A uncertainty of E°, the homogeneity assessment of the SRM 2193b source material, and the coulometric determination of bHCl. The Type A uncertainty of the curve fit to obtain pH(S) from the paH values includes the Type A component, uA[p(aHγCl)°], associated with the extrapolation of the p(aHγCl) values at different bNaCl to obtain p(aHγCl). The uA (curve fit) values (see Appendix B) are somewhat smaller than the uA[p(aHγCl)°] values calculated using solely the extrapolation at the corresponding temperature. In effect, the curve fit “leverages” the entire set of measurements at all temperatures to obtain a lower uncertainty at each component temperature. The Type A uncertainty of the E° determination, uA(E°), is estimated from the standard deviation of the mean of all six determinations of E° at the given temperature. The uncertainty of the Ag|AgCl electrode drift due to the high alkaline environment was inherently included in the uA(E°). For the measurements at 25 °C, the values of uA[p(aHγCl)°] and uA(E°) used to calculate uc(meas) were determined using the set of respective measurements obtained in the “25 °C” data, not including the recheck measurements. Table 7 reports values of uA(E°) for each set of measurements (including the “25 °C recheck” runs). The uncertainty associated with the homogeneity of the SRM material was obtained from the statistical analysis of the measured ΔpHi values and was used as the Type A uncertainty. This estimate includes the inherent resolution of the measurement of ∆pHi and allows for different levels of random variation between runs, bottles and measurements. All random errors were assumed to be mutually independent and normally distributed. No unit-to-unit differences were apparent. The combined standard uncertainty in the molality of the HCl [uc(bHCl) = 1.83×10⁻⁶ mol kg-1 with veff = 70.88] is calculated using the model developed from knowledge gained in CCQM-K73 [16]. Additional details on the calculations used in estimation of the HCl assay uncertainty are provided in Appendix C.
______________________________________________________________________________________________________ This publication is available free of charge from
: https://doi.org/10.6028/NIST.SP.260-197
Page 15 of 28
The Type B uncertainty of the acidity function was obtained by combining the uncertainty components for Emeas for the buffer and E° measurements, γ±HCl, bNaCl, T, R, patm, F, and the uncertainty for T cycling. Values not referred to NIST calibrations below were taken from the instruction manuals for the respective instruments. The “manual values” were taken as uniform uncertainty intervals and have been treated as described above. A Solartron 7071 voltmeter was used to determine Emeas. The Type B uncertainty was treated as a uniform uncertainty interval [u(Emeas) = 0.0012 % Emeas/√3]. Verification checks performed daily against a saturated Weston cell were in accordance with this uncertainty. Separate sources are listed for the determination of Emeas for the Harned cells containing buffer (EI) and those containing 0.01 mol kg-1 HCl. The uncertainty of γ±HCl was an assumed value [17], treated as a uniform uncertainty [u(γ±HCl) = 0.0002/√3], as the literature [27] gives no estimate of uncertainty. The value of γ±HCl was taken as the value at bHCl = 0.01 mol kg-1. The correction for γ±HCl (since bHCl was not exactly 0.01 mol kg-1) and the uncertainty of this correction are each negligible. The platinum thermometer was calibrated by the manufacturer. The calibration at the other temperatures of interest was obtained by a polynomial curve fit from these points. The uncertainty in temperature [u(T) = 0.0055 K] was obtained from the Type B calibration uncertainty and the observed drift in bath temperature during the certification measurements. The uncertainty in bNaCl, u(bNaCl), is based on the uncertainties in the mass (m) measurements associated with the addition of NaCl to the buffer solution. The uncertainty in the mass measurements are based on the uncertainties given in the balance manuals and are treated as uniform probability distributions. The microbalance calibration certificate, used for the NaCl additions, verified the performance agreed with the manufacturer specifications. The uncertainty in mNaCl, u(mNaCl), is calculated using an uncertainty of 2.9 µg for the tare mass of the Pt weighing boat and for the mass of the boat containing the NaCl. The uncertainty in the mass of the buffer solution, mbuffer, u(mbuffer), is calculated using an uncertainty of 2.9 mg for the tare mass of the bottle and for the weighing of the bottle containing the buffer solution. The Type B uncertainty associated with the cycling of temperature T, u(T cycling), is obtained from the deviation between the respective 25 °C paH value and the corresponding “25 °C recheck” paH value obtained for the measurements performed at 25 °C at the end of the given run. The deviation in paH for the “25 °C up” and 25 °C up recheck” runs is treated as a uniform probability distribution and divided by √3 to obtain the u(xi) attributable to temperature cycling in the “25 °C up” measurements. The value of u(T cycling) is included as an uncertainty component in uc(meas) for T ≤ 25 °C. This component is included in uc(meas) for T = 25 °C to cover any possible change between the filling of the cell and the initial 25 °C measurements. The u(T cycling) values incorporate several factors. Small changes in Ecell result from changes in bHCl (or bNaCl in the buffer solutions) associated with two separate physical effects. First, incomplete equilibration of H2 with pH2O in the humidification tubes increases bHCl (and bNaCl in the buffer solutions) via evaporation, decreasing Ecell. Evaporation occurs to some
______________________________________________________________________________________________________ This publication is available free of charge from
: https://doi.org/10.6028/NIST.SP.260-197
Page 16 of 28
extent at all temperatures, but it is negligible below 25 °C. Second, reflux of condensate H2O from the H2 outlet back into the Harned cells decreases bHCl (or bNaCl), thus increasing Ecell. Reflux only occurs at bath temperatures well above the laboratory ambient temperature, where condensation occurs in the H2 exit tubes, i.e., above 35 °C in the “25 °C up” subsets. In addition to these physical processes, slow re-equilibration with the Ag|AgCl electrodes [presumably of the solubility equilibrium AgCl(s) = Ag+(aq) + Cl-(aq)] can also occur during temperature cycling. These three effects combine to yield net apparent changes in EII [hence, E°] and EI [hence, p(aHγCl)] in the respective Harned cells. For all temperatures, the major sources of uncertainty for the primary pH(S) measurements, uc(y), which excludes the uncertainty contributed by the material heterogeneity and the uncertainty of the Bates-Guggenheim convention, are u(T cycling), uA(curve fit), and uA(E°).
1. For measurements at temperatures > 25 °C, the estimated variance of T cycling, u2(T cycling), contributes 93 % to 98 % of the total combined variance for the primary pH(S) determination, uc
2(y). 2. For measurements at temperatures ≤ 25 °C, u2(T cycling) represents 52 % to 75 % of
uc2(y). The uA
2(curve fit) contributes 17 % to 43 % to uc2(y) and uA
2(E°) contributes 2 % to 7 % to uc
2(y). The remaining component uncertainty sources contribute less than 1 % to uc
2(y). The uc(meas), kmeas, and Umeas values reported in Table 7 include all known instrumental and batch-related (homogeneity) factors pertaining to SRM 2193b but do not include the contribution from the inherent uncertainty of the Bates-Guggenheim convention (UB-G). These respective values thus may be used as a basis for traceability to the measurement of this renewal, SRM 2193b. Any bias resulting from the deviation of the Bates-Guggenheim convention from the “true” (but immeasurable) value of log γCl will be identical for all renewals of a given SRM buffer [or corresponding certified reference material (CRM) from another national metrological institute (NMI)], since the ionic composition of each solution is nominally identical. Hence, traceability from one SRM renewal to another or between NMI’s is reflected by the uncertainties reported in Table 7 and the uncertainty of the SRM or CRM. Calculation of Values for kcert and U(cert) To attain traceability to the SI (rather than to the measurement of the renewal of this pH SRM), it is necessary to include the contribution attributable to the inherent uncertainty of the Bates-Guggenheim convention [11] . Current expert opinion [18,19] has assessed UB-G as 0.010 pH (95 % confidence interval). Dividing this value by 2 yields uB-G = 0.005. The value of vi for uB-G is taken as 60, which is the approximate number of degrees of freedom for k = 2 at 95 % confidence. This contribution must be included if traceability to the SI is required. Values of the certification combined standard uncertainty, uc(cert), are obtained at each temperature by summing the corresponding uc(meas) value and uB-G in quadrature. A new coverage factor, kcert, is calculated by reapplication of the Welch-Satterthwaite equation using uc(meas), veff(meas), and uc(cert). The certification expanded uncertainty, U(cert), is obtained by Equation 8: U(cert) = kcert uc(cert) (8)
______________________________________________________________________________________________________ This publication is available free of charge from
: https://doi.org/10.6028/NIST.SP.260-197
Page 17 of 28
Certificate of Analysis In accordance with ISO Guide 31: 2000, a NIST SRM certificate is a document containing the name, description, and intended purpose of the material, the logo of the U.S. Department of Commerce, the name of NIST as a certifying body, instructions for proper use and storage of the material, certified property value(s) with associated uncertainty(ies), method(s) used to obtain property values, the period of validity, if appropriate, and any other technical information deemed necessary for its proper use. A Certificate is issued for an SRM certified for one or more specific physical or engineering performance properties and may contain NIST reference, information, or both values in addition to certified values. A Certificate of Analysis is issued for an SRM certified for one or more specific chemical properties. Note: ISO Guide 31 is updated periodically; check with ISO for the latest version. [https://www.nist.gov/srm/srm-definitions] For the most current version of the Certificate of Analysis for NIST SRM 2193b Calcium Carbonate [used as saturated Ca(OH)2 solution], please visit: https://www-s.nist.gov/srmors/view_cert.cfm?srm=2193b
______________________________________________________________________________________________________ This publication is available free of charge from
1 NIST Certificate of Analysis Standard Reference Material 2193a, Calcium Carbonate pH Standard [used as saturated Ca(OH)2 solution], September 30, 2015.
2 Pratt KW. Automated, high-precision coulometric titrimetry Part I. Engineering and implementation. Analytica Chimica Acta 1994;289: 125-134.
3 Pratt KW. Automated, high-precision coulometric titrimetry Part II. Strong and weak acids and bases. Analytica Chimica Acta 1994;289: 135-142.
4 NIST Certificate of Analysis Standard Reference Material 187e Sodium Tetraborate Decahydrate (Borax) pH Standard, May 30, 20014.
5 Bates RG. Determination of pH: Theory and Practice. 2 ed. 1973, New York: John Wiley & Sons. 6 Mohr PJ, Newell DB, Taylor BN. CODATA recommended values of the fundamental physical
constants: 2014. Reviews of Modern Physics 2012;88(3);035009(73). 7 Haar JL, Gallagher JS, Kell GS. NBS/NRC Steam Tables, in CRC Handbook of Chemistry and
Physics, 80th Edition, D.R. Lide, Editor. 1984, Hemisphere Publishing Corp.: New York. p. 6-10. 8 Joint Committee for Guides in Metrology, Guide to the Expression of Uncertainty in
Measurement (ISO GUM 1995 with Minor Corrections). 2008: Sevres Cedex, France. 9 Bates R. Robinson RA. Standardization of silver-silver chloride electrodes from 0 to 60°C.
Journal of Solution Chemistry 1980;9(7): 455-456. 10 Organisation Internationale de Metrologie Legal, Bureau International de Metrologie Legale,
International Recommendation No. 54, pH Scale for Aqueous Solutions. 1981: Paris, France 11 Bates RG, Guggenheim EA. Report on the standardization of pH and related terminology. Pure
and Applied Chemistry 1960;1(1):163-168. 12 Bates RG. Revised Standard Values for pH Measurements from 0 to 95 °C. Journal of Research
of the National Bureau of Standards - A. Physics and Chemistry, 1962;66A(2):179-184. 13 Meija J, et al. Atomic weights of the elements 2013 (IUPAC Technical Report). Pure and Applied
Chemistry, 2016;88(3):265-291. 14 Satterthwaite FE. An Approximate Distribution of Estimates of Variance Components. Biometric
Bulletin. 1946;2:110-114. 15 Welch BL. The generalization of "Student’s" problem when several different population variances
are involved. Biometrika 1947;34:28-35. 16 Pratt KW, et al. Final report on key comparison CCQM-K73: Amount content of H+ in
hydrochloric acid (0.1 mol kg−1). Metrologia 2013;50(1A). 17 Schwabe K. pH-Messtechnik. 1963, Dresden/Leipzig: Verlag Theodor Steinkopff. 18 Buck RP, et al. Measurement of pH. Definition, standards, and procedures (IUPAC
Recommendations 2002). Pure and Applied Chemistry 2002;74(11):2169-2200. 19 Baucke FG. New IUPAC recommendations on the measurement of pH – background and
essentials. Analytical and Bioanalytical Chemistry 2002;374(5):772-777.
______________________________________________________________________________________________________ This publication is available free of charge from
: https://doi.org/10.6028/NIST.SP.260-197
Page 19 of 28
Appendix A: Heterogeneity Analysis of SRM 2193b This report summarizes the analysis of bottle-to-bottle heterogeneity for SRM 2193b. The data used for this analysis were collected using a nested design with measurements made in five measurement runs, with two bottles of the candidate SRM measured in some runs and three bottles measured in others. Twelve bottles of the material were measured in all. Two measurements were made on material drawn from each of the bottles measured in each run. The bottles were randomly sampled from the population of bottles of prepared materials, bottles were randomly assigned to measurement runs, and the run order of the measurements each day was randomized. With this design a hierarchical variance components model can be fit to the data to assess random variability associated with runs, bottles, and measurements. Results derived from the raw data were recorded for one quantity, ∆pH, the measured difference in pH for the candidate material versus the previous generation of this material, SRM 2193a. This quantity is measured using a secondary method for pH because the primary method, used for most of the certification measurements, is too time consuming to use for heterogeneity assessment. The secondary method is calibrated using the previous generation of each pH SRM to correct for instrument drift within each run. This should also correct for drift between runs, though the variance component analysis alone could also do that when there is no drift within runs. Because the purpose of these measurements it to assess material heterogeneity, the mean of these measurements is not important to this analysis. The primary requirement of this measurement is that it allow variability in the true pH between bottles to be assessed on the pH scale. The data used in this analysis are shown in Table A-1.
Table A-1: Data for Analysis of Variability from Different Sources in SRM 2193b Day Bottle Measurement Order rBottle ∆pH
______________________________________________________________________________________________________ This publication is available free of charge from
: https://doi.org/10.6028/NIST.SP.260-197
Page 20 of 28
The first step in the analysis of the data was an exploratory analysis. In this analysis plots of the data were examined for evidence of uncorrected measurement drift, outliers, factor effects, and any other features that might impact further analysis for certification. These plots are shown in Figure A-1; they were made using the software package R [A1]. None of the exploratory plots suggested anything unexpected or unusual, so all data were used in subsequent analyses, as originally planned. Measurement Run Bottle
Figure A-1: ∆pH values plotted in measurement, run, and bottle order
Based on the experiment design and the exploratory plots, a hierarchical variance components model was then fit to the data. This model assumes a single, unknown mean, µ, for each observation, yijk, but allows for different levels of random variation between runs, bottles, and measurements. The random errors associated with each run are denoted by ρi, the random errors associated with each bottle are denoted by β(i)j, and the random errors associated with each measurement are denoted by ε(ij)k. The variances associated with each source of random error, run, bottle, and measurement, are denoted σR
2 , σB2 , and σM
2 , respectively. All random errors are assumed to be mutually independent of one another and normally distributed. The statistical model in mathematical notation is:
yijk = μ + ρi+ β(i)j+ ε(ij)k; i = 1,…,5; j = 1,2 or j = 1,2,3; k = 1,2;
ρi = N0,σR2; β(i)j = N0,σB
2; ε(ij)k = N0,σM2
The model was fit using Bayesian modeling methods via Markov Chain Monte Carlo simulation as implemented in the software package OpenBUGS [A2, A3]. A Bayesian model was used because it provides uncertainty estimates that have a clear statistical interpretation, are not based asymptotic theory or other approximations, and are always positive. To fit the Bayesian model, prior assessments of the values of each parameter in the model must be provided. The prior assessment for each parameter is specified as probability distribution for the parameter’s unknown value. These distributions are called prior distributions because they are specified independently of the data (i.e., before the data are observed or used). For this analysis, essentially non-informative prior distributions were used. Such distributions are relatively flat and have relatively large variances so that they will not provide much quantitative information about the values of the parameters. In this case shifted and scaled beta distributions with hyper-parameters αH = 1 and βH = 1 were used (i.e. shifted and scaled uniform
______________________________________________________________________________________________________ This publication is available free of charge from
: https://doi.org/10.6028/NIST.SP.260-197
Page 21 of 28
distributions). The ranges and locations of the prior distributions for each parameter were set so that they greatly exceeded all practical parameter values possible. Fitting the model with a range of different prior distributions confirmed that the results were insensitive to the parameters chosen for the prior distributions. The check on prior sensitivity also was carried out using shifted and scaled beta distributions, but for different combinations of the hyper-parameters, with 0.8, 1.2
iHα ∈ and 0.8, 1.2iHβ ∈ . The same shifting and scaling
values used in the original model fit with uniform priors were used throughout the prior sensitivity check. The two hyper-parameter values used for each of the four primary parameters in the model, µ, σR, σR, σM, were assigned using a supersaturated UE(s2) optimal experiment design [A4] to study the combined effects of eight factors in four runs. The alternative prior specifications and the associated results from the fit of each model are shown in Table A-2.
Table A-2: Output from Models with Different Priors
Model Parameter Prior Posterior
Mean
Posterior Standard Deviation
1
mu 4*Beta(1.0,1.0) -0.07390 0.3126 sigma.R 4*Beta(1.0,1.0) 0.4066 0.3954 sigma.B 4*Beta(1.0,1.0) 0.5154 0.2047 sigma.M 4*Beta(1.0,1.0) 0.3993 0.09724 mu.nb NA 0.0000 0.001108
2
mu 4*Beta(1.2,1.2) -0.07368 0.3488 sigma.R 4*Beta(1.2,0.8) 0.4927 0.4680 sigma.B 4*Beta(0.8,0.8) 0.5016 0.2110 sigma.M 4*Beta(0.8,1.2) 0.3985 0.09779 mu.nb NA 0.0000 0.001081
3
mu 4*Beta(1.2,0.8) -0.0679 0.2862 sigma.R 4*Beta(0.8,0.8) 0.3496 0.3682 sigma.B 4*Beta(0.8,1.2) 0.4924 0.2037 sigma.M 4*Beta(1.2,0.8) 0.4091 0.1029 mu.nb NA 0.0000 0.001070
4
mu 4*Beta(0.8,1.2) -0.08369 0.2769 sigma.R 4*Beta(0.8,1.2) 0.3345 0.3418 sigma.B 4*Beta(0.8,1.2) 0.5013 0.2012 sigma.M 4*Beta(0.8,1.2) 0.3978 0.09764 mu.nb NA 0.0000 0.001081
5
mu 4*Beta(0.8,0.8) -0.07211 0.3348 sigma.R 4*Beta(1.2,1.2) 0.4623 0.4191 sigma.B 4*Beta(0.8,0.8) 0.4957 0.2105 sigma.M 4*Beta(1.2,0.8) 0.4084 0.1021 mu.nb NA 0.0000 0.001073
The results for the four primary parameters are relative as the data were rescaled for the computations. The data transformation is ∆pHS = ∆pH·500. Besides the primary parameters with individual priors, results for prediction of ∆pH for a new bottle, mu.nb, are also shown. The posterior standard deviation of mu.nb from Model 1 is the heterogeneity uncertainty to be combined with results from the primary pH measurement method. Values of mu.nb are assumed to be normally distributed.
______________________________________________________________________________________________________ This publication is available free of charge from
: https://doi.org/10.6028/NIST.SP.260-197
Page 22 of 28
A probability distribution for each measurement, conditional on the values of the parameters in the model, is also specified. In this case the random errors associated with each factor were modeled as following normal distributions. Then, based on the model and the observed data, the prior distributions for each parameter are updated using Bayes’ Theorem to obtain new distributions for each parameter given the information in the data. These new distributions, called posterior distributions, are then used to obtain uncertainty intervals about each quantity of interest. Diagnostic plots showed that the Markov Chains had converged by the 10 000th iteration of the simulation. Then 10000 additional iterations were run for each of six parallel Markov chains for model validation and to estimate the parameter values. Box plots of the posterior predictive residuals from the model for each data point indicated that the models fit the data reasonably well. Assuming the hierarchical model provides an adequate description of the measurement process, a proposed value of the heterogeneity standard uncertainty in SRM 2193 pH was determined from the predictive ∆pH distribution for a randomly selected unit of this material. The predictive distribution is used because the uncertainty obtained accounts for both the inherent variability between ∆pH values from different units and the uncertainty arising from the different levels of sampling variation that impacts our knowledge of the heterogeneity standard deviation. Proposed values for the heterogeneity standard uncertainty for SRM 2193b and associated effective degrees of freedom are given in Table A-3.
Table A-3: Summary Statistics for a New Bottle of SRM 2193b
∆pH Standard
Uncertainty Effective Degrees
of Freedom 0.0000 0.001108 27.37
The effective degrees of freedom are provided for use in any further uncertainty computations carried out using the methods of the GUM and were approximated by computing an average coverage factor from the 95 % expanded uncertainty interval from the Bayesian analysis and then numerically solving for degrees of freedom as if the coverage factor was obtained from a Student’s t distribution. References A1 R Development Core Team, R: A Language and Environment for Statistical Computing. R
Foundation for Statistical Computing, Vienna, Austria, 2011, http://www.R-project.org. A2 OpenBUGS website, http://www.openbugs.net. A3 Lunn, D., Spiegelhalter, D., Thomas, A. and Best, N. (2009) “The BUGS Project: Evolution,
Critique and Future Directions (with discussion)”, Statistics in Medicine, pp 3049-3082. A4 Jones, B. and Majumdar, D. (2014) “Optimal Supersaturated Designs”, Journal of the
American Statistical Association, 109, 508, pp 1592-1600. http://dx.doi.org/10.1080/01621459.2014.938810.
______________________________________________________________________________________________________ This publication is available free of charge from
Appendix B: Uncertainty Component Details, 5 °C to 50 °C
Table B-1. Detail of Uncertainty Components for SRM 2193b, 5 °C Component Type Estimate xi u(xi) units Distribution |ci| units ui(meas)/1 νi
pH(S) curve fit A 13.2176 1.6E-03 1 Gaussian 1 1 1.6E-03 10 uA for E° A 0.234018 2.2E-05 V Gaussian 18.1 V-1 4.1E-04 5
SRM homogeneity A 1 1.1E-03 1 Uniform 1.0 1 1.1E-03 27.37 HCl molality [uc(bHCl)] A + B 0.01000950 7.8E-07 mol·kg-1 Combined std. 86.78 kg·mol-1 6.8E-05 71
Emeas (DVM) B 1.083361 1.3E-05 V Uniform 18.1 V-1 2.4E-04 60 γ±(HCl) B 0.9074 1.2E-04 1 Uniform 0.957 1 1.1E-04 60
Emeas for E° (DVM) B 0.459394 5.7E-06 V Uniform 18.1 V-1 1.0E-04 60 NaCl molality [uc(bNaCl)] B 0.005000 3.0E-07 mol·kg-1 Uniform 86.9 kg·mol-1 2.6E-05 60
T B 278.150 5.5E-03 K Combined std. 4.22E-02 K-1 2.3E-04 60 R B 8.314460 4.8E-06 J·mol-1·K-1 Combined std. 1.41E+00 mol·K·J-1 6.8E-06 60
patm B 100532 5.8E+00 Pa Uniform 4.88E-09 Pa-1 2.8E-08 60 F B 96485.3329 5.9E-04 C·mol-1 Combined std. 1.22E-04 mol·C-1 7.2E-08 60
T cycling B --- 1.8E-03 1 Uniform 1 1 1.8E-03 60 Combined standard uncertainty of the measurement, uc(meas); νeff shown in right column 2.7E-03 58.63
Table B-2. Detail of Uncertainty Components for SRM 2193b, 10 °C
Component Type Estimate xi u(xi) units Distribution |ci| units ui(meas)/1 νi pH(S) curve fit A 13.0109 9.8E-04 1 Gaussian 1 1 9.8E-04 10
uA for E° A 0.231369 3.3E-05 V Gaussian 17.8 V-1 5.8E-04 5 SRM homogeneity A 1 1.1E-03 1 Uniform 1.0 1 1.1E-03 27.37
HCl molality [uc(bHCl)] A + B 0.01000950 7.8E-07 mol·kg-1 Combined std. 86.78 kg·mol-1 6.8E-05 71 Emeas (DVM) B 1.084529 1.3E-05 V Uniform 17.8 V-1 2.4E-04 60 γ±(HCl) B 0.9067 1.2E-04 1 Uniform 0.958 1 1.1E-04 60
Emeas for E° (DVM) B 0.460834 5.7E-06 V Uniform 17.8 V-1 1.0E-04 60 NaCl molality [uc(bNaCl)] B 0.005000 3.0E-07 mol·kg-1 Uniform 86.9 kg·mol-1 2.6E-05 60
T B 283.150 5.5E-03 K Combined std. 4.07E-02 K-1 2.3E-04 60 R B 8.314460 4.8E-06 J·mol-1·K-1 Combined std. 1.39E+00 mol·K·J-1 6.7E-06 60
patm B 100485 5.8E+00 Pa Uniform 4.75E-09 Pa-1 2.8E-08 60 F B 96485.3329 5.9E-04 C·mol-1 Combined std. 1.19E-04 mol·C-1 7.0E-08 60
T cycling B --- 1.8E-03 1 Uniform 1 1 1.8E-03 60 Combined standard uncertainty of the measurement, uc(meas); νeff shown in right column 2.4E-03 100.83
______________________________________________________________________________________________________ This publication is available free of charge from
: https://doi.org/10.6028/NIST.SP.260-197
Page 24 of 28
Table B-3. Detail of Uncertainty Components for SRM 2193b, 15 °C Component Type Estimate xi u(xi) units Distribution |ci| units ui(meas)/1 νi
pH(S) curve fit A 12.8148 1.0E-03 1 Gaussian 1 1 1.0E-03 10 uA for E° A 0.228564 2.3E-05 V Gaussian 17.5 V-1 3.9E-04 5
SRM homogeneity A 1 1.1E-03 1 Uniform 1.0 1 1.1E-03 27.37 HCl molality [uc(bHCl)] A + B 0.01000950 7.8E-07 mol·kg-1 Combined std. 86.78 kg·mol-1 6.8E-05 71
Emeas (DVM) B 1.085809 1.3E-05 V Uniform 17.5 V-1 2.3E-04 60 γ±(HCl) B 0.906 1.2E-04 1 Uniform 0.959 1 1.1E-04 60
Emeas for E° (DVM) B 0.462119 5.7E-06 V Uniform 17.5 V-1 1.0E-04 60 NaCl molality [uc(bNaCl)] B 0.005000 3.0E-07 mol·kg-1 Uniform 86.9 kg·mol-1 2.6E-05 60
T B 288.150 5.5E-03 K Combined std. 3.93E-02 K-1 2.2E-04 60 R B 8.314460 4.8E-06 J·mol-1·K-1 Combined std. 1.36E+00 mol·K·J-1 6.5E-06 60
patm B 100458 5.8E+00 Pa Uniform 4.65E-09 Pa-1 2.7E-08 60 F B 96485.3329 5.9E-04 C·mol-1 Combined std. 1.17E-04 mol·C-1 6.9E-08 60
T cycling B --- 1.8E-03 1 Uniform 1 1 1.8E-03 60 Combined standard uncertainty of the measurement, uc(meas); νeff shown in right column 2.4E-03 97.56
Table B-4. Detail of Uncertainty Components for SRM 2193b, 20 °C
Component Type Estimate xi u(xi) units Distribution |ci| units ui(meas)/1 νi pH(S) curve fit A 12.6289 9.8E-04 1 Gaussian 1 1 9.8E-04 10
uA for E° A 0.225591 1.8E-05 V Gaussian 17.2 V-1 3.1E-04 5 SRM homogeneity A 1 1.1E-03 1 Uniform 1.0 1 1.1E-03 27.37
HCl molality [uc(bHCl)] A + B 0.01000950 7.8E-07 mol·kg-1 Combined std. 86.78 kg·mol-1 6.8E-05 71 Emeas (DVM) B 1.087170 1.3E-05 V Uniform 17.2 V-1 2.3E-04 60 γ±(HCl) B 0.9051 1.2E-04 1 Uniform 0.960 1 1.1E-04 60
Emeas for E° (DVM) B 0.463249 5.7E-06 V Uniform 17.2 V-1 9.8E-05 60 NaCl molality [uc(bNaCl)] B 0.005000 3.0E-07 mol·kg-1 Uniform 86.9 kg·mol-1 2.6E-05 60
T B 293.150 5.5E-03 K Combined std. 3.80E-02 K-1 2.1E-04 60 R B 8.314460 4.8E-06 J·mol-1·K-1 Combined std. 1.34E+00 mol·K·J-1 6.4E-06 60
patm B 100407 5.8E+00 Pa Uniform 4.43E-09 Pa-1 2.6E-08 60 F B 96485.3329 5.9E-04 C·mol-1 Combined std. 1.16E-04 mol·C-1 6.8E-08 60
T cycling B --- 1.8E-03 1 Uniform 1 1 1.8E-03 60 Combined standard uncertainty of the measurement, uc(meas); νeff shown in right column 2.4E-03 98.09
______________________________________________________________________________________________________ This publication is available free of charge from
: https://doi.org/10.6028/NIST.SP.260-197
Page 25 of 28
Table B-5. Detail of Uncertainty Components for SRM 2193b, 25 °C Component Type Estimate xi u(xi) units Distribution |ci| units ui(meas)/1 νi
pH(S) curve fit A 12.4529 8.5E-04 1 Gaussian 1 1 8.5E-04 10 uA for E° A 0.222406 2.9E-05 V Gaussian 16.9 V-1 4.9E-04 5
SRM homogeneity A 1 1.1E-03 1 Uniform 1.0 1 1.1E-03 27.37 HCl molality [uc(bHCl)] A + B 0.01000950 1.6E-06 mol·kg-1 Combined std. 86.78 kg·mol-1 1.4E-04 71
Emeas (DVM) B 1.090238 1.3E-05 V Uniform 16.9 V-1 2.3E-04 60 γ±(HCl) B 0.9042 1.2E-04 1 Uniform 0.961 1 1.1E-04 60
Emeas for E° (DVM) B 0.464170 5.7E-06 V Uniform 16.9 V-1 9.7E-05 60 NaCl molality [uc(bNaCl)] B 0.005000 3.0E-07 mol·kg-1 Uniform 86.9 kg·mol-1 2.6E-05 60
T B 298.150 5.5E-03 K Combined std. 3.68E-02 K-1 2.0E-04 60 R B 8.314460 4.8E-06 J·mol-1·K-1 Combined std. 1.32E+00 mol·K·J-1 6.3E-06 60
patm B 100631 5.8E+00 Pa Uniform 3.40E-09 Pa-1 2.0E-08 60 F B 96485.3329 5.9E-04 C·mol-1 Combined std. 1.14E-04 mol·C-1 6.7E-08 60
T cycling B --- 1.8E-03 1 Uniform 1 1 1.8E-03 60 Combined standard uncertainty of the measurement, uc(meas); νeff shown in right column 2.4E-03 105.45
Table B-6. Detail of Uncertainty Components for SRM 2193b, 30 °C
Component Type Estimate xi u(xi) units Distribution |ci| units ui(meas)/1 νi pH(S) curve fit A 12.2863 8.0E-04 1 Gaussian 1 1 8.0E-04 10
uA for E° A 0.219161 2.2E-05 V Gaussian 16.6 V-1 3.7E-04 5 SRM homogeneity A 1 1.1E-03 1 Uniform 1.0 1 1.1E-03 27.37
HCl molality [uc(bHCl)] A + B 0.01000950 7.8E-07 mol·kg-1 Combined std. 86.78 kg·mol-1 6.8E-05 71 Emeas (DVM) B 1.089973 1.3E-05 V Uniform 16.6 V-1 2.2E-04 60 γ±(HCl) B 0.9033 1.2E-04 1 Uniform 0.962 1 1.1E-04 60
Emeas for E° (DVM) B 0.465030 5.7E-06 V Uniform 16.6 V-1 9.6E-05 60 NaCl molality [uc(bNaCl)] B 0.005000 3.0E-07 mol·kg-1 Uniform 86.9 kg·mol-1 2.6E-05 60
T B 303.150 5.5E-03 K Combined std. 3.56E-02 K-1 2.0E-04 60 R B 8.314460 4.8E-06 J·mol-1·K-1 Combined std. 1.30E+00 mol·K·J-1 6.2E-06 60
patm B 100694 5.8E+00 Pa Uniform 1.68E-10 Pa-1 9.8E-10 60 F B 96485.3329 5.9E-04 C·mol-1 Combined std. 1.12E-04 mol·C-1 6.6E-08 60
T cycling B --- 5.9E-03 1 Uniform 1 1 5.9E-03 60 Combined standard uncertainty of the measurement, uc(meas); νeff shown in right column 6.1E-03 67.27
______________________________________________________________________________________________________ This publication is available free of charge from
: https://doi.org/10.6028/NIST.SP.260-197
Page 26 of 28
Table B-7. Detail of Uncertainty Components for SRM 2193b, 35 °C Component Type Estimate xi u(xi) units Distribution |ci| units ui(meas)/1 νi
pH(S) curve fit A 12.1289 8.6E-04 1 Gaussian 1 1 8.6E-04 10 uA for E° A 0.215726 3.9E-05 V Gaussian 16.4 V-1 6.3E-04 5
SRM homogeneity A 1 1.1E-03 1 Uniform 1.0 1 1.1E-03 27.37 HCl molality [uc(bHCl)] A + B 0.01000950 7.8E-07 mol·kg-1 Combined std. 86.78 kg·mol-1 6.8E-05 71
Emeas (DVM) B 1.091323 1.3E-05 V Uniform 16.4 V-1 2.2E-04 60 γ±(HCl) B 0.9024 1.2E-04 1 Uniform 0.963 1 1.1E-04 60
Emeas for E° (DVM) B 0.465704 5.8E-06 V Uniform 16.4 V-1 9.4E-05 60 NaCl molality [uc(bNaCl)] B 0.005000 3.0E-07 mol·kg-1 Uniform 86.9 kg·mol-1 2.6E-05 60
T B 308.150 5.5E-03 K Combined std. 3.45E-02 K-1 1.9E-04 60 R B 8.314460 4.8E-06 J·mol-1·K-1 Combined std. 1.28E+00 mol·K·J-1 6.1E-06 60
patm B 100645 5.8E+00 Pa Uniform 2.72E-10 Pa-1 1.6E-09 60 F B 96485.3329 5.9E-04 C·mol-1 Combined std. 1.10E-04 mol·C-1 6.5E-08 60
T cycling B --- 5.9E-03 1 Uniform 1 1 5.9E-03 60 Combined standard uncertainty of the measurement, uc(meas); νeff shown in right column 6.1E-03 68.45
Table B-8. Detail of Uncertainty Components for SRM 2193b, 37 °C
Component Type Estimate xi u(xi) units Distribution |ci| units ui(meas)/1 νi pH(S) curve fit A 12.0684 8.8E-04 1 Gaussian 1 1 8.8E-04 10
uA for E° A 0.214256 4.4E-05 V Gaussian 16.2 V-1 7.2E-04 5 SRM homogeneity A 1 1.1E-03 1 Uniform 1.0 1 1.1E-03 27.37
HCl molality [uc(bHCl)] A + B 0.01000950 7.8E-07 mol·kg-1 Combined std. 86.78 kg·mol-1 6.8E-05 71 Emeas (DVM) B 1.091866 1.3E-05 V Uniform 16.2 V-1 2.2E-04 60 γ±(HCl) B 0.902 1.2E-04 1 Uniform 0.963 1 1.1E-04 60
Emeas for E° (DVM) B 0.465880 5.8E-06 V Uniform 16.2 V-1 9.4E-05 60 NaCl molality [uc(bNaCl)] B 0.005000 3.0E-07 mol·kg-1 Uniform 86.9 kg·mol-1 2.6E-05 60
T B 310.150 5.5E-03 K Combined std. 3.41E-02 K-1 1.9E-04 60 R B 8.314460 4.8E-06 J·mol-1·K-1 Combined std. 1.27E+00 mol·K·J-1 6.1E-06 60
patm B 100586 5.8E+00 Pa Uniform 1.59E-11 Pa-1 9.3E-11 60 F B 96485.3329 5.9E-04 C·mol-1 Combined std. 1.10E-04 mol·C-1 6.5E-08 60
T cycling B --- 5.9E-03 1 Uniform 1 1 5.9E-03 60 Combined standard uncertainty of the measurement, uc(meas); νeff shown in right column 6.1E-03 68.89
______________________________________________________________________________________________________ This publication is available free of charge from
: https://doi.org/10.6028/NIST.SP.260-197
Page 27 of 28
Table B-9. Detail of Uncertainty Components for SRM 2193b, 40 °C Component Type Estimate xi u(xi) units Distribution |ci| units ui(meas)/1 νi
pH(S) curve fit A 11.9804 8.0E-04 1 Gaussian 1 1 8.0E-04 10 uA for E° A 0.212104 5.2E-05 V Gaussian 16.1 V-1 8.4E-04 5
SRM homogeneity A 1 1.1E-03 1 Uniform 1.0 1 1.1E-03 27.37 HCl molality [uc(bHCl)] A + B 0.01000950 7.8E-07 mol·kg-1 Combined std. 86.78 kg·mol-1 6.8E-05 71
Emeas (DVM) B 1.092684 1.4E-05 V Uniform 16.1 V-1 2.2E-04 60 γ±(HCl) B 0.9014 1.2E-04 1 Uniform 0.964 1 1.1E-04 60
Emeas for E° (DVM) B 0.466198 5.8E-06 V Uniform 16.1 V-1 9.3E-05 60 NaCl molality [uc(bNaCl)] B 0.005000 3.0E-07 mol·kg-1 Uniform 86.9 kg·mol-1 2.6E-05 60
T B 313.150 5.5E-03 K Combined std. 3.35E-02 K-1 1.9E-04 60 R B 8.314460 4.8E-06 J·mol-1·K-1 Combined std. 1.26E+00 mol·K·J-1 6.1E-06 60
patm B 100558 5.8E+00 Pa Uniform 1.16E-10 Pa-1 6.7E-10 60 F B 96485.3329 5.9E-04 C·mol-1 Combined std. 1.09E-04 mol·C-1 6.4E-08 60
T cycling B --- 5.9E-03 1 Uniform 1 1 5.9E-03 60 Combined standard uncertainty of the measurement, uc(meas); νeff shown in right column 6.1E-03 69.00
Table B-10. Detail of Uncertainty Components for SRM 2193b, 45 °C
Component Type Estimate xi u(xi) units Distribution |ci| units ui(meas)/1 νi pH(S) curve fit A 11.8403 8.6E-04 1 Gaussian 1 1 8.6E-04 10
uA for E° A 0.208302 5.1E-05 V Gaussian 15.8 V-1 8.1E-04 5 SRM homogeneity A 1 1.1E-03 1 Uniform 1.0 1 1.1E-03 27.37
HCl molality [uc(bHCl)] A + B 0.01000950 7.8E-07 mol·kg-1 Combined std. 86.78 kg·mol-1 6.8E-05 71 Emeas (DVM) B 1.094109 1.4E-05 V Uniform 15.8 V-1 2.1E-04 60 γ±(HCl) B 0.9003 1.2E-04 1 Uniform 0.965 1 1.1E-04 60
Emeas for E° (DVM) B 0.466520 5.8E-06 V Uniform 15.8 V-1 9.1E-05 60 NaCl molality [uc(bNaCl)] B 0.005000 3.0E-07 mol·kg-1 Uniform 86.9 kg·mol-1 2.6E-05 60
T B 318.150 5.5E-03 K Combined std. 3.25E-02 K-1 1.8E-04 60 R B 8.314460 4.8E-06 J·mol-1·K-1 Combined std. 1.25E+00 mol·K·J-1 6.0E-06 60
patm B 100492 5.8E+00 Pa Uniform 2.88E-10 Pa-1 1.7E-09 60 F B 96485.3329 5.9E-04 C·mol-1 Combined std. 1.07E-04 mol·C-1 6.3E-08 60
T cycling B --- 5.9E-03 1 Uniform 1 1 5.9E-03 60 Combined standard uncertainty of the measurement, uc(meas); νeff shown in right column 6.1E-03 69.19
______________________________________________________________________________________________________ This publication is available free of charge from
: https://doi.org/10.6028/NIST.SP.260-197
Page 28 of 28
Table B-11. Detail of Uncertainty Components for SRM 2193b, 50 °C Component Type Estimate xi u(xi) units Distribution |ci| units ui(meas)/1 νi
pH(S) curve fit A 11.7086 8.8E-04 1 Gaussian 1 1 8.8E-04 10 uA for E° A 0.204369 8.0E-05 V Gaussian 15.6 V-1 1.2E-03 5
SRM homogeneity A 1 1.1E-03 1 Uniform 1.0 1 1.1E-03 27.37 HCl molality [uc(bHCl)] A + B 0.01000950 7.8E-07 mol·kg-1 Combined std. 86.78 kg·mol-1 6.8E-05 71
Emeas (DVM) B 1.095499 1.4E-05 V Uniform 15.6 V-1 2.1E-04 60 γ±(HCl) B 0.8992 1.2E-04 1 Uniform 0.966 1 1.1E-04 60
Emeas for E° (DVM) B 0.466713 5.8E-06 V Uniform 15.6 V-1 9.0E-05 60 NaCl molality [uc(bNaCl)] B 0.005000 3.0E-07 mol·kg-1 Uniform 86.9 kg·mol-1 2.6E-05 60
T B 323.150 5.5E-03 K Combined std. 3.16E-02 K-1 1.8E-04 60 R B 8.314460 4.8E-06 J·mol-1·K-1 Combined std. 1.23E+00 mol·K·J-1 5.9E-06 60
patm B 100499 5.8E+00 Pa Uniform 1.41E-10 Pa-1 8.2E-10 60 F B 96485.3329 5.9E-04 C·mol-1 Combined std. 1.06E-04 mol·C-1 6.3E-08 60
T cycling B --- 5.9E-03 1 Uniform 1 1 5.9E-03 60 Combined standard uncertainty of the measurement, uc(meas); νeff shown in right column 6.2E-03 71.24
______________________________________________________________________________________________________ This publication is available free of charge from
: https://doi.org/10.6028/NIST.SP.260-197
Page 29 of 28
Appendix C: Calculation of uc(bHCl) The uncertainty of the HCl assay includes the Type A standard deviation of the mean of 12 coulometric HCl titrations and Type B estimates connected with the interference from incompletely removed dissolved CO2, the HCl weighing and air buoyancy correction, the electrical and time parameters associated with the coulometric titration, and the Faraday constant. The basis and detailed values for each source uncertainty considered in the calculation of uc(bHCl) are given in Table C-1. The value of uc(bHCl) is somewhat larger than in previous renewals of SRM 2193b, owing to an increased value for the estimated Type B uncertainty associated with incomplete removal of CO2. The uncertainty associated with the residual CO2 is estimated by assuming the incomplete removal of CO2 for an electrolyte solution saturated with ambient atmospheric CO2. The Henry’s law constant for CO2 in 1 mol kg-1 sodium chloride (NaCl) [C1], KH(CO2), was assumed for a solution of 1 mol kg-1 KCl. Neglecting a correction1 for the increase in CO2 solubility after dilution of the supporting electrolyte with the HCl sample, the relative molality of CO2 with respect to the HCl sample, r(CO2), is
r(CO2) = KH(CO2) patm x(CO2)bHCl
, where patm is ambient atmospheric pressure and x(CO2) is the fraction of CO2 in air. Assuming a 75 % CO2 removal efficiency, the estimated residual amount of CO2 in solution is residual CO2 = r(CO2) (1 - 0.75) . No correction to the determined bHCl is made for the estimated amount of CO2 remaining after the N2 aeration of the supporting electrolyte, but the residual CO2 estimated uncertainty is included in calculation of uc(bHCl). The component uncertainty for CO2 interference is modeled using a uniform distribution. References C1 Harned HS, Davis R. The ionization constant of carbonic acid in water and solubility of
carbon dioxide in water and aqueous salt solutions from 0 to 50 °C. Journal of the American Chemical Society 1943; 60(10): 2030-2037.
1 Dilution of the supporting electrolyte (60 cm3 of 1 mol kg-1 KCl) with the HCl sample (25 g of 0.01 mol kg-1 HCl) will lead to an increase in the solubility of CO2 in the solution. However, on the short time scale (10 to 20 minutes) between the HCl sample addition and the N2 aeration, it is not probable that a significant amount of ambient atmospheric CO2 will diffuse into the coulometric cell headspace, which is continuously flushed with 99.999 % N2, and become dissolved in the diluted electrolyte mixture.
______________________________________________________________________________________________________ This publication is available free of charge from
: https://doi.org/10.6028/NIST.SP.260-197
Page 30 of 28
Table C-1. Summary of Uncertainty Components in the Coulometric Assay of HCl
Source or input quantity Type Estimate, xi u(xi) units distribution |ci| units ui(bHCl) / mol·kg-1 vi
CO2 interference B 0 1.65E-04 (mol kg-1) / (mol kg-1) Uniform 1.00E-02 mol·kg-1 1.65E-06 60 Meas. replication of bHCl A 0.0100095 7.83E-07 mol·kg-1 Gaussian 1 1 7.83E-07 11 mHCl B 0.0245 1.21E-07 kg Uniform 4.09E-01 (mol·kg-1)/kg 4.95E-08 60 ρair B 1.18108 6.82E-03 kg·m-3 Uniform 8.77E-06 (mol·kg-1)/(kg·m-3) 5.98E-08 60 Rstd B 9.999602 3.50E-05 Ω 95% C.I. 1.00E-03 (mol·kg-1)/Ω 3.50E-08 60 Imain drift B 0.1018250 1.18E-07 A Uniform 9.83E-02 (mol·kg-1)/A 1.16E-08 60 Estd B 1.0182097 1.00E-06 V 95% C.I. 9.83E-03 (mol·kg-1)/V 9.83E-09 60 ρHCl B 998.0 5.76E-01 kg·m-3 Uniform 1.19E-08 (mol·kg-1)/(kg·m-3) 6.83E-09 60 Cathode side-rxns B 0 2.89E-07 (mol kg-1) / (mol kg-1) Uniform 1.00E-02 mol·kg-1 2.89E-09 60 F B 96485.3329 5.90E-04 C·mol-1 uc 1.04E-07 (mol kg-1)/(C mol-1) 6.12E-11 60 t B 1009.61 1.01E-06 s Uniform 4.31E-05 (mol·kg-1)/s 4.35E-11 60 Combined standard uncertainty, uc(bHCl), left column; effective degrees of freedom, νeff, right column 1.83E-06 70.88
______________________________________________________________________________________________________ This publication is available free of charge from


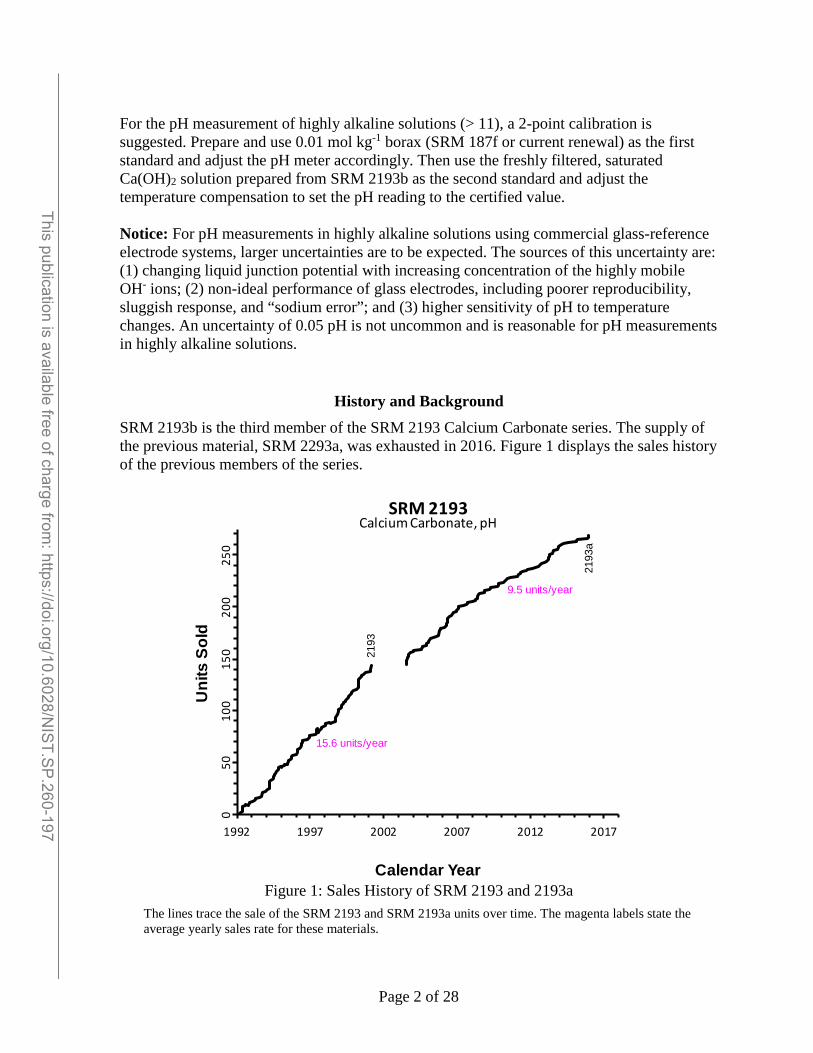


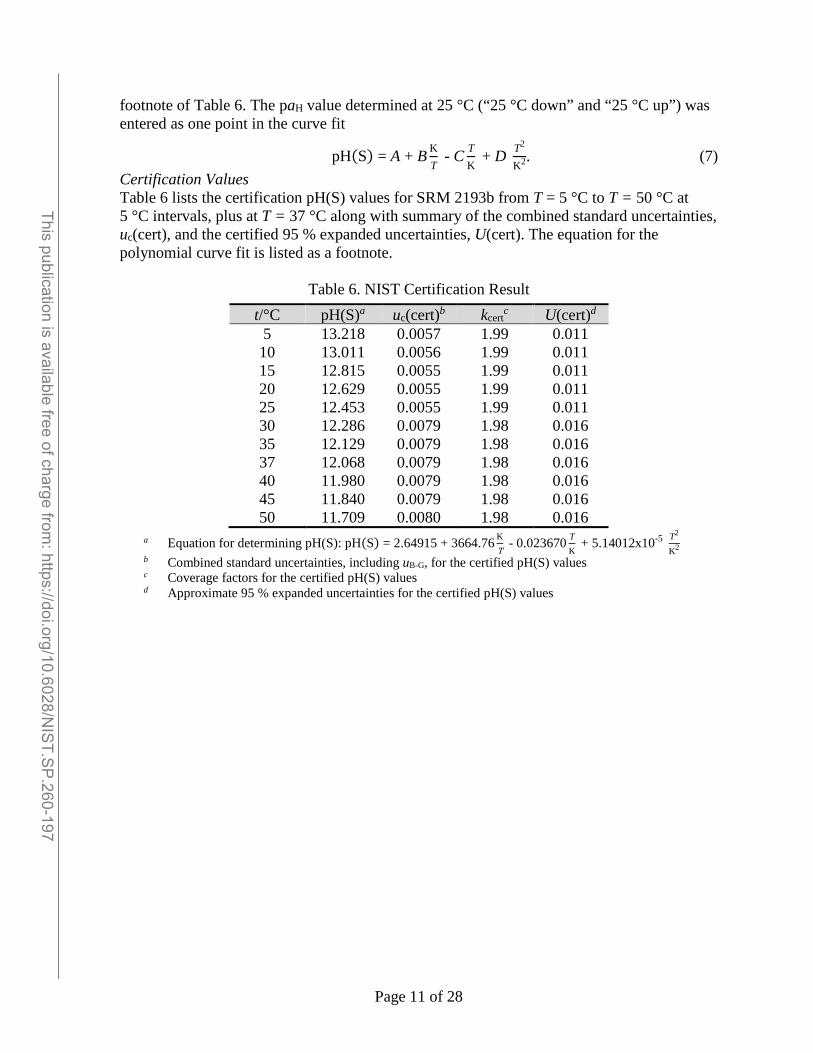


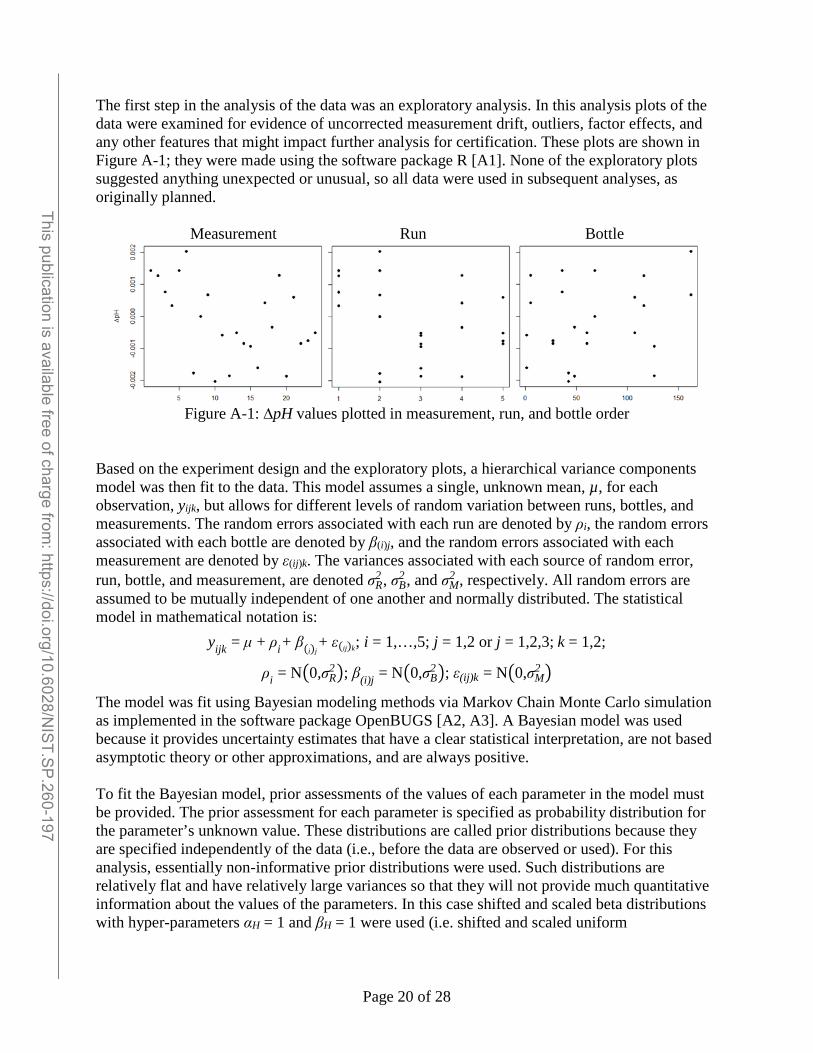


![B1 07.pptx [Lecture seule]Disinfectant efficacy Cleaning Validation Complete EM program (including continuous particle monitoring) Solution preparation VBI Solution preparation VBIV](https://static.documents.pub/doc/80x56/60f54591f984e451ab6d12a7/b1-07pptx-lecture-seule-disinfectant-efficacy-cleaning-validation-complete-em.jpg)


