25
Quarter One 2018 www.cevalogistics.com CEVA Holdings LLC (predecessor entity to CEVA Logistics AG following legal merger)

Quarter One 2018
www.cevalogistics.com
CEVA Holdings LLC(predecessor entity to CEVA Logistics AG following legal merger)
CEVA Holdings LLC (predecessor entity to CEVA Logistics AG following legal merger) Quarter One, 2018 Interim Financial Statements
1
Table of Contents Principal Activities .......................................................................................................................................................................... 2
Key Financial Results ...................................................................................................................................................................... 2
Operating and Financial Review ..................................................................................................................................................... 3
CEVA Holdings LLC – Unaudited Condensed Consolidated Three Months Income Statement ...................................................... 7
CEVA Holdings LLC – Unaudited Condensed Consolidated Statement of Comprehensive Income ............................................... 8
CEVA Holdings LLC – Unaudited Condensed Consolidated Balance Sheet..................................................................................... 9
CEVA Holdings LLC – Unaudited Condensed Consolidated Statement of Cash Flows ................................................................. 10
CEVA Holdings LLC – Unaudited Condensed Consolidated Statement of Changes in Equity ....................................................... 11
Notes to the Unaudited Condensed Consolidated Interim Financial Statements ....................................................................... 12
Cautionary statement: The operating and financial review and certain other sections of this document contain forward looking statements which are subject to risk factors associated with, amongst others, the economic and business circumstances occurring from time to time in the countries and markets in which the Group (as defined below) operates. It is believed that the expectations reflected in these statements are reasonable but they may be affected by a wide range of variables, which could cause actual results to differ materially from those currently anticipated.

CEVA Holdings LLC – Quarter One 2018 Interim Financial Statements
2
On 3 May 2018 CEVA Holdings LLC legally merged with CEVA Logistics AG (formerly a newly formed wholly owned subsidiary incorporated in Switzerland), with CEVA Logistics AG being the surviving entity that then listed on the Swiss Stock Exchange. These Quarter One Interim Financial statements therefore set out the results of CEVA Holdings LLC, which is the predecessor to CEVA Logistics AG.
Principal Activities
CEVA Holdings LLC (the “Company”) and its subsidiaries (collectively, the “Group” or “CEVA”) is one of the world’s leading third-party logistics companies, offering a broad spectrum of services in both Contract Logistics and Freight Management. CEVA designs, implements and operates complete supply chain solutions for multinational and small and medium sized companies on a national, regional and global level. CEVA operates a non-asset based model across all of its business units, with third parties providing the majority of the physical transportation and warehousing assets that CEVA manages and uses for the benefit of its customers. CEVA’s integrated service offerings span the entire supply chain. CEVA’s Freight Management services include international air, ocean and ground freight forwarding, customs brokerage and other value-added services and its Contract Logistics services include inbound logistics, manufacturing support, outbound/distribution logistics and aftermarket/reverse logistics. As of 31 December 2017, CEVA’s combined global network comprised about 1,000 locations, utilizing a total of approximately 8 million square meters of warehousing space in over 160 countries, supported by more than 40,000 employees. CEVA has built leading market positions by understanding its target industry sectors and applying extensive expertise to design and implement customized logistics solutions that address industry-specific supply chain requirements. CEVA has deep expertise in a range of industries, including automotive, technology, industrial and aerospace, consumer and retail, energy and healthcare. CEVA’s knowledge of customers’ supply chain functions and sector expertise allows CEVA to develop more cost-effective solutions for them, creates competitive advantages for its customers, and puts CEVA in a strong position to grow its business.
Key Financial Results
The table below shows the Group’s key consolidated financial metrics for the three months ended 31 March 2018 and 2017:
¹ Includes the Group’s share of EBITDA from joint ventures, and excludes specific items and non-cash share based compensation costs (“SBC”) 2 Capital expenditure excluding finance leases The table below shows the Group’s key other financial metrics as at 31 March 2018, 31 December 2017 and 31 March 2017:
1 Refer to cumulative revenue over the last twelve months 2 Refer to cumulative net capital expenditure over the last twelve months 3 As of 1 January 2018 - refer to note 3 for details
THREE MONTHS ENDED 31 MARCH2018 2017 2017
$ millions In actual currency In constant currency In actual currency
Revenue 1,790 1,699 1,596 Revenue growth 12.2%Adjusted EBITDA¹ 66 55 54 Profit/(Loss) for the period (67) (59) (57)Net capital expenditure2 20 25 Cash used for operations (67) (60)Free cash flow (130) (133)
AS AT 31 MARCH AS AT 31 DECEMBER AS AT 31 MARCH$ millions 2018 2017 2017
Net working capital3 (172) (255) (83)Cash and cash equivalents 203 295 239 Net debt 2,228 2,089 2,056 Headroom 502 578 479 Total assets3 3,631 3,557 3,276 Total Group equity3 (700) (675) (560)Capital employed / LTM revenue1 8.1% 8.1% 8.1%LTM Net capital expenditure2 / LTM Revenue1 1.3% 1.4% 1.2%Net working capital intensity (as % of LTM revenue 1) (2.4%) (3.6%) (1.2%)
CEVA Holdings LLC – Quarter One 2018 Interim Financial Statements
3
Operating and Financial Review
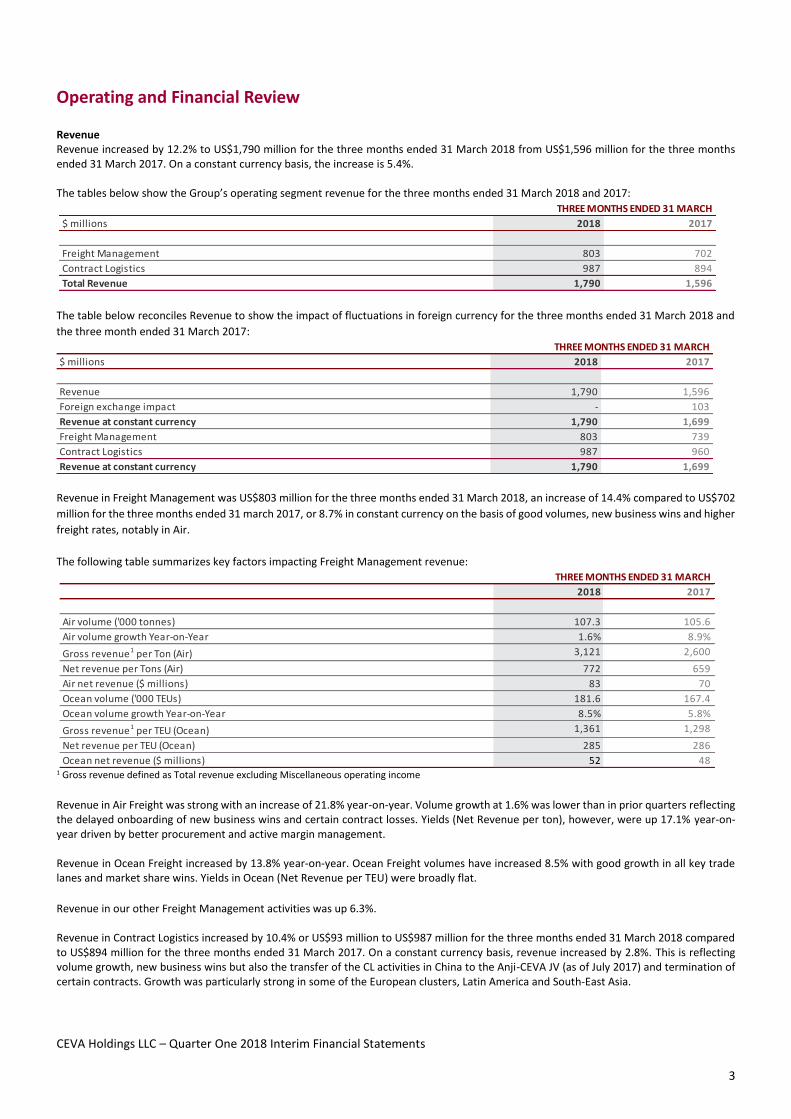
Revenue Revenue increased by 12.2% to US$1,790 million for the three months ended 31 March 2018 from US$1,596 million for the three months ended 31 March 2017. On a constant currency basis, the increase is 5.4%. The tables below show the Group’s operating segment revenue for the three months ended 31 March 2018 and 2017:
The table below reconciles Revenue to show the impact of fluctuations in foreign currency for the three months ended 31 March 2018 and the three month ended 31 March 2017:
Revenue in Freight Management was US$803 million for the three months ended 31 March 2018, an increase of 14.4% compared to US$702 million for the three months ended 31 march 2017, or 8.7% in constant currency on the basis of good volumes, new business wins and higher freight rates, notably in Air. The following table summarizes key factors impacting Freight Management revenue:
1 Gross revenue defined as Total revenue excluding Miscellaneous operating income Revenue in Air Freight was strong with an increase of 21.8% year-on-year. Volume growth at 1.6% was lower than in prior quarters reflecting the delayed onboarding of new business wins and certain contract losses. Yields (Net Revenue per ton), however, were up 17.1% year-on-year driven by better procurement and active margin management. Revenue in Ocean Freight increased by 13.8% year-on-year. Ocean Freight volumes have increased 8.5% with good growth in all key trade lanes and market share wins. Yields in Ocean (Net Revenue per TEU) were broadly flat. Revenue in our other Freight Management activities was up 6.3%. Revenue in Contract Logistics increased by 10.4% or US$93 million to US$987 million for the three months ended 31 March 2018 compared to US$894 million for the three months ended 31 March 2017. On a constant currency basis, revenue increased by 2.8%. This is reflecting volume growth, new business wins but also the transfer of the CL activities in China to the Anji-CEVA JV (as of July 2017) and termination of certain contracts. Growth was particularly strong in some of the European clusters, Latin America and South-East Asia.
THREE MONTHS ENDED 31 MARCH$ millions 2018 2017
Freight Management 803 702 Contract Logistics 987 894 Total Revenue 1,790 1,596
THREE MONTHS ENDED 31 MARCH$ millions 2018 2017
Revenue 1,790 1,596 Foreign exchange impact - 103 Revenue at constant currency 1,790 1,699 Freight Management 803 739 Contract Logistics 987 960 Revenue at constant currency 1,790 1,699
THREE MONTHS ENDED 31 MARCH2018 2017
Air volume ('000 tonnes) 107.3 105.6 Air volume growth Year-on-Year 1.6% 8.9%Gross revenue1 per Ton (Air) 3,121 2,600 Net revenue per Tons (Air) 772 659 Air net revenue ($ millions) 83 70 Ocean volume ('000 TEUs) 181.6 167.4 Ocean volume growth Year-on-Year 8.5% 5.8%Gross revenue1 per TEU (Ocean) 1,361 1,298 Net revenue per TEU (Ocean) 285 286 Ocean net revenue ($ millions) 52 48
CEVA Holdings LLC – Quarter One 2018 Interim Financial Statements
4
Net Revenue Net revenue is defined as revenue less work contracted out (being purchased transportation and related services, including contracted motor carrier, rail, ocean, air, and other costs). Net revenue is not a measurement of performance or liquidity under IFRS and should not be considered as a substitute for revenue or any other performance measures derived in accordance with IFRS. Net revenue increased by 10.6% or US$88 million to US$915 million for the three months ended 31 March 2018 compared to US$827 million for the three months ended 31 March 2017. On a constant currency basis, net revenue increased by 3.6%. Net revenue in Freight Management increased by 10.3% to US$224 million for the three months ended 31 March 2018. On a constant currency basis, net revenue in Freight Management increased by 5.7%. Within Freight Management, yields in Air Freight (Net revenue per ton) were up 17.1% year-on-year driven by active margin management and contracting at higher rate levels. Yields in Ocean (net revenue per TEU) were broadly flat.
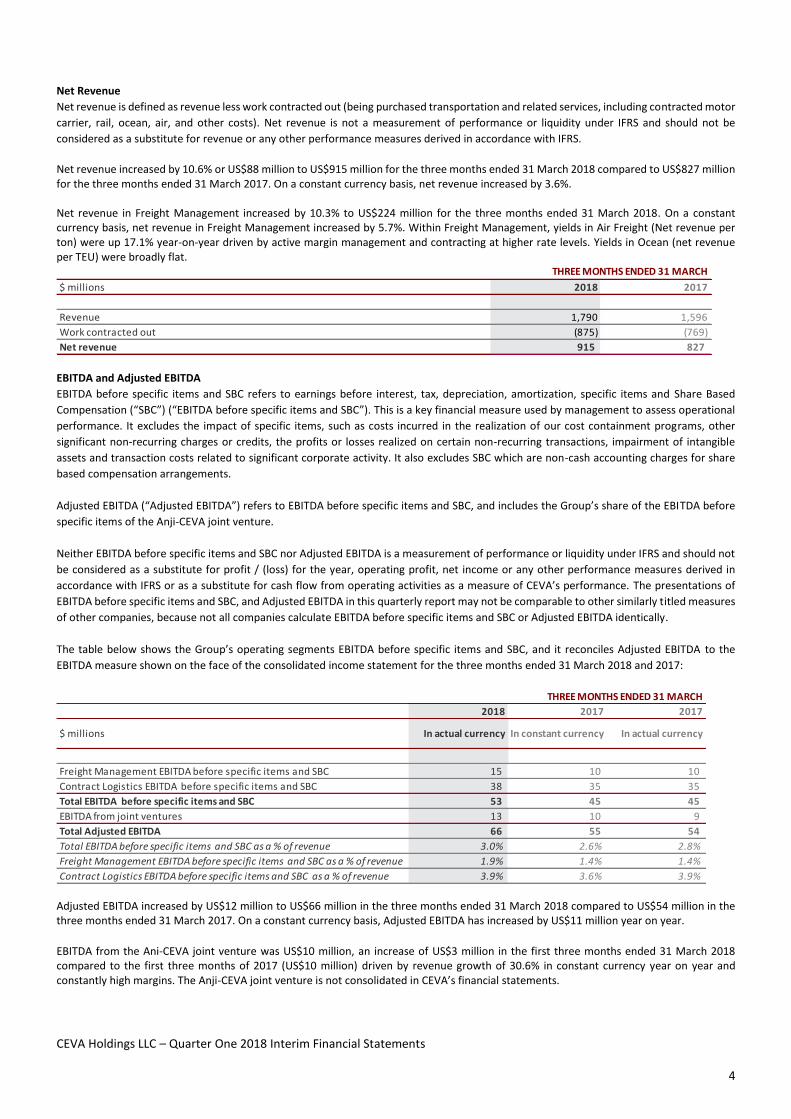
EBITDA and Adjusted EBITDA EBITDA before specific items and SBC refers to earnings before interest, tax, depreciation, amortization, specific items and Share Based Compensation (“SBC”) (“EBITDA before specific items and SBC”). This is a key financial measure used by management to assess operational performance. It excludes the impact of specific items, such as costs incurred in the realization of our cost containment programs, other significant non-recurring charges or credits, the profits or losses realized on certain non-recurring transactions, impairment of intangible assets and transaction costs related to significant corporate activity. It also excludes SBC which are non-cash accounting charges for share based compensation arrangements. Adjusted EBITDA (“Adjusted EBITDA”) refers to EBITDA before specific items and SBC, and includes the Group’s share of the EBITDA before specific items of the Anji-CEVA joint venture. Neither EBITDA before specific items and SBC nor Adjusted EBITDA is a measurement of performance or liquidity under IFRS and should not be considered as a substitute for profit / (loss) for the year, operating profit, net income or any other performance measures derived in accordance with IFRS or as a substitute for cash flow from operating activities as a measure of CEVA’s performance. The presentations of EBITDA before specific items and SBC, and Adjusted EBITDA in this quarterly report may not be comparable to other similarly titled measures of other companies, because not all companies calculate EBITDA before specific items and SBC or Adjusted EBITDA identically. The table below shows the Group’s operating segments EBITDA before specific items and SBC, and it reconciles Adjusted EBITDA to the EBITDA measure shown on the face of the consolidated income statement for the three months ended 31 March 2018 and 2017:
Adjusted EBITDA increased by US$12 million to US$66 million in the three months ended 31 March 2018 compared to US$54 million in the three months ended 31 March 2017. On a constant currency basis, Adjusted EBITDA has increased by US$11 million year on year. EBITDA from the Ani-CEVA joint venture was US$10 million, an increase of US$3 million in the first three months ended 31 March 2018 compared to the first three months of 2017 (US$10 million) driven by revenue growth of 30.6% in constant currency year on year and constantly high margins. The Anji-CEVA joint venture is not consolidated in CEVA’s financial statements.
THREE MONTHS ENDED 31 MARCH$ millions 2018 2017
Revenue 1,790 1,596 Work contracted out (875) (769)Net revenue 915 827
THREE MONTHS ENDED 31 MARCH2018 2017 2017
$ millions In actual currency In constant currency In actual currency
Freight Management EBITDA before specific items and SBC 15 10 10 Contract Logistics EBITDA before specific items and SBC 38 35 35 Total EBITDA before specific items and SBC 53 45 45 EBITDA from joint ventures 13 10 9 Total Adjusted EBITDA 66 55 54 Total EBITDA before specific items and SBC as a % of revenue 3.0% 2.6% 2.8%
Freight Management EBITDA before specific items and SBC as a % of revenue 1.9% 1.4% 1.4%
Contract Logistics EBITDA before specific items and SBC as a % of revenue 3.9% 3.6% 3.9%

CEVA Holdings LLC – Quarter One 2018 Interim Financial Statements
5
The table below reconciles Adjusted EBITDA to show the impact of fluctuations in foreign currency for the months ended 31 March 2018 and 2017:
Freight Management EBITDA before specific items increased by US$5 million or 50% to US$15 million in the three months ended 31 March 2018 compared to US$10 million for the three months ended 31 March 2017. This was supported by yield improvements, continued productivity increases and efficiencies. Contract Logistics EBITDA before specific items increased by US$3 million to US$38 million in the three months ended 31 March 2018 compared to US$35 million for the three months ended 31 March 2017. The focused improvement initiatives at key operations are showing good results. Specific items and SBC Specific items and SBC for the three months ended 31 March 2018 are US$7 million (31 March 2017: US$11 million), reflecting lower restructuring costs, lower legacy litigation and tax charges partially offset by advisory cost incurred in relation to the IPO (see note 7 for more details). Depreciation, Amortization and Impairment Depreciation, amortization and impairment are US$36 million for the first three months of 2018 compared to US$26 million for the first three months of 2017. The increase is driven by increased capital expenditure in 2017, accelerated amortization of customer relationships and accelerated depreciation of certain assets. Net finance income/expense Net finance expense for the three months ended 31 March 2018 was US$76 million (expense for the three months ended 31 March 2017: US$53 million), and was impacted by an unrealized foreign exchange loss of US$18 million for the three months ended 31 March 2018 (three months ended 31 March 2017: unrealized foreign exchange loss of US$7 million). Interest expenses and other finance charges, were US$59 million for the first quarter of 2018 (three months ended 31 March 2017: US$47 million), the increase is primarily due to increased US Dollar interest rates in the period and from the April 2017 debt exchange. Income Tax The income tax for the three months ended 31 March 2018 was an expense of US$6 million (expense for the three months ended 31 March 2017: US16 million). The lower income tax expense versus prior year period is primarily due to a change in the calculation methodology, whereby the tax charge is now calculated reflecting entity specific forecasted effective tax rates and quarterly profits relative to forecasted full year profits rather than a straight-line approach for the consolidated group. The change in methodology only affects quarterly results but does have no impact on annual tax charge and was already implemented during 2017. Loss for the period Our loss for the period was U$S67 million for the three months ended 31 March 2018 (three months ended 31 March 2017: US$57 million). The main drivers of the difference are the increase in finance expenses and higher depreciation and amortization. Net capital expenditure Our net capital expenditure was US$20 million for the three months ended 31 March 2018 (three months ended 31 March 2017: US$25 million), which represented 1.1% of revenue for the three months ended 31 March 2018 (1.6% for the three months ended 31 March 2017). Net working capital Our net working capital was US$(172) million as at 31 March 2018 (31 March 2017: US$(83) million) reflecting continued working capital improvements, foreign exchange, partially offset by the impact of the strong revenue growth. Cash flow Cash used for operations during the three months ended 31 March 2018 amounted to US$67 million outflow (three months ended 31 March 2017: US$60 million outflow). Free cash flow for the three months ended 31 March 2018 was US$(130) million, US$3 million better than for the three months ended 31 March 2017). Whilst there was a higher cash outflow from net working capital, lower outflows from provisions, capital expenditure and tax, and higher EBITDA for the period more than offset this. Cash and cash equivalents As at 31 March 2018 the Group had US$203 million (31 December 2017: US$295 million) of cash and cash equivalents on its balance sheet. The decrease in the period reflects normal seasonal outflows. With undrawn central facilities of US$299 million available at 31 March 2018 (31 December 2017: US$283 million), we therefore had headroom of US$502 million at 31 March 2018 (31 December 2017: US$578 million).
THREE MONTHS ENDED 31 MARCH$ millions 2018 2017
Adjusted EBITDA 66 54 Foreign exchange impact - 1 Adjusted EBITDA at constant currency 66 55

CEVA Holdings LLC – Quarter One 2018 Interim Financial Statements
6
Net debt Net debt, defined as total borrowings less cash and cash equivalents, was US$2,228 million as at 31 March 2018 (31 December 2017: US$2,089 million and 31 March 2017: US$2,056 million). The increase in net debt of US$139 million in the first three months of 2018 is primarily due to the seasonality in the business and in line with prior year. Risk factors CEVA is impacted by a number of risk factors, some of which are not within our control. Many of the risk factors affecting CEVA are macroeconomic and generally affect all companies, whereas others are more particular to CEVA. The principal risk factors faced by CEVA are unchanged from those identified in the 2017 annual financial statements of CEVA Holdings LLC.
CEVA Holdings LLC – Quarter One 2018 Interim Financial Statements
7
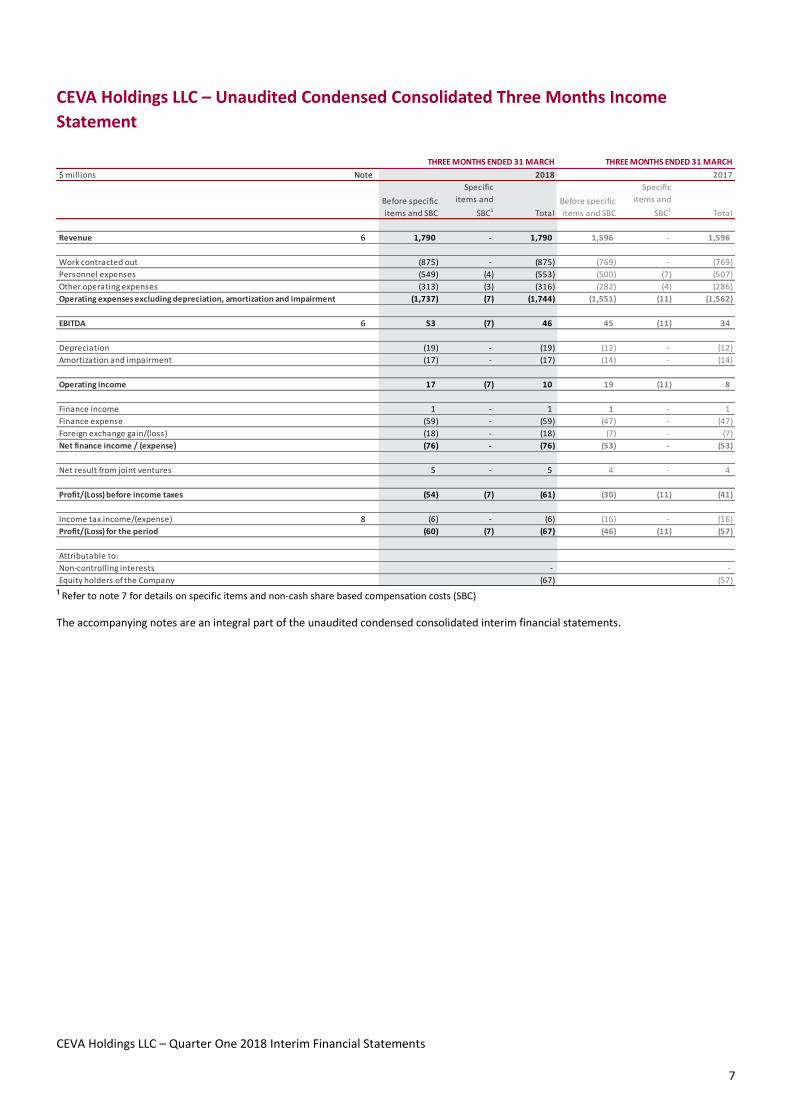
CEVA Holdings LLC – Unaudited Condensed Consolidated Three Months Income Statement
¹ Refer to note 7 for details on specific items and non-cash share based compensation costs (SBC) The accompanying notes are an integral part of the unaudited condensed consolidated interim financial statements.
THREE MONTHS ENDED 31 MARCH THREE MONTHS ENDED 31 MARCH$ millions Note 2018 2017
Before specific items and SBC
Specific items and
SBC1 TotalBefore specific items and SBC
Specific items and
SBC1 Total
Revenue 6 1,790 - 1,790 1,596 - 1,596
Work contracted out (875) - (875) (769) - (769) Personnel expenses (549) (4) (553) (500) (7) (507) Other operating expenses (313) (3) (316) (282) (4) (286) Operating expenses excluding depreciation, amortization and impairment (1,737) (7) (1,744) (1,551) (11) (1,562)
EBITDA 6 53 (7) 46 45 (11) 34
Depreciation (19) - (19) (12) - (12) Amortization and impairment (17) - (17) (14) - (14)
Operating income 17 (7) 10 19 (11) 8
Finance income 1 - 1 1 - 1 Finance expense (59) - (59) (47) - (47) Foreign exchange gain/(loss) (18) - (18) (7) - (7) Net finance income / (expense) (76) - (76) (53) - (53)
Net result from joint ventures 5 - 5 4 - 4
Profit/(Loss) before income taxes (54) (7) (61) (30) (11) (41)
Income tax income/(expense) 8 (6) - (6) (16) - (16) Profit/(Loss) for the period (60) (7) (67) (46) (11) (57)
Attributable to:Non-controlling interests - - Equity holders of the Company (67) (57)
CEVA Holdings LLC – Quarter One 2018 Interim Financial Statements
8
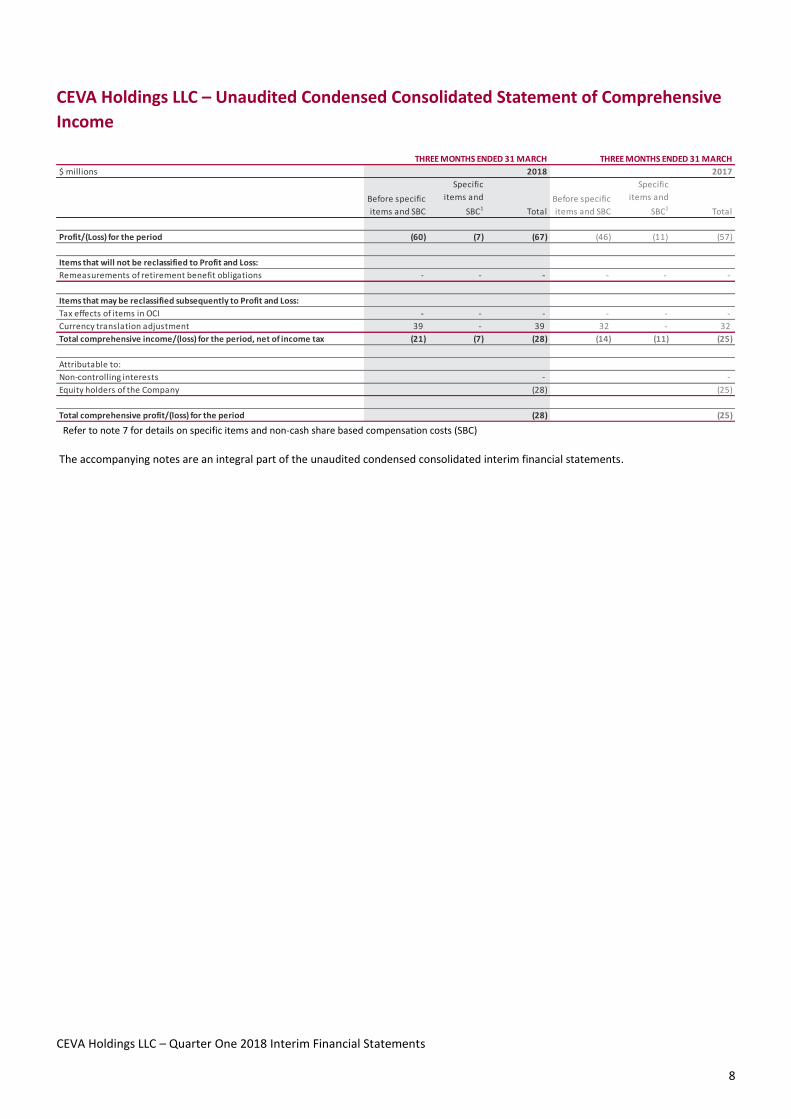
CEVA Holdings LLC – Unaudited Condensed Consolidated Statement of Comprehensive Income
Refer to note 7 for details on specific items and non-cash share based compensation costs (SBC) The accompanying notes are an integral part of the unaudited condensed consolidated interim financial statements.
THREE MONTHS ENDED 31 MARCH THREE MONTHS ENDED 31 MARCH$ millions 2018 2017
Before specific items and SBC
Specific items and
SBC1 TotalBefore specific items and SBC
Specific items and
SBC1 Total
Profit/(Loss) for the period (60) (7) (67) (46) (11) (57)
Items that will not be reclassified to Profit and Loss:Remeasurements of retirement benefit obligations - - - - - -
Items that may be reclassified subsequently to Profit and Loss:Tax effects of items in OCI - - - - - - Currency translation adjustment 39 - 39 32 - 32 Total comprehensive income/(loss) for the period, net of income tax (21) (7) (28) (14) (11) (25)
Attributable to:Non-controlling interests - - Equity holders of the Company (28) (25)
Total comprehensive profit/(loss) for the period (28) (25)
CEVA Holdings LLC – Quarter One 2018 Interim Financial Statements
9
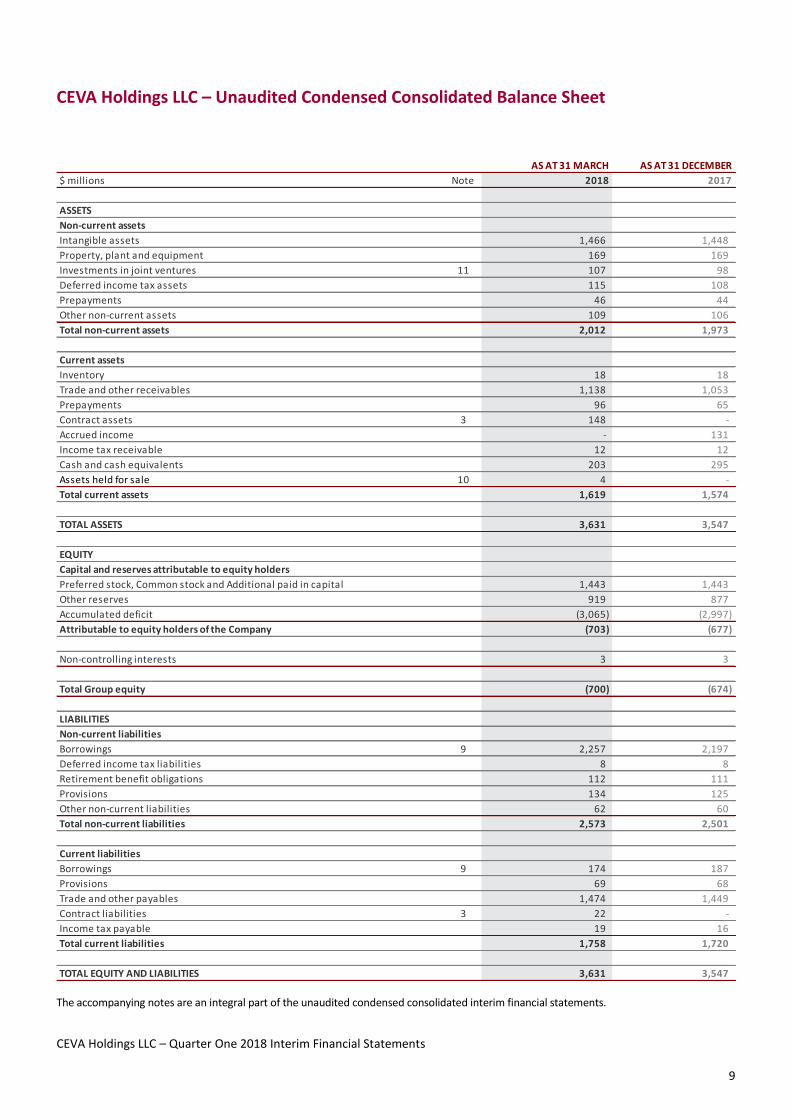
CEVA Holdings LLC – Unaudited Condensed Consolidated Balance Sheet
The accompanying notes are an integral part of the unaudited condensed consolidated interim financial statements.
AS AT 31 MARCH AS AT 31 DECEMBER$ millions Note 2018 2017
ASSETSNon-current assetsIntangible assets 1,466 1,448 Property, plant and equipment 169 169 Investments in joint ventures 11 107 98 Deferred income tax assets 115 108 Prepayments 46 44 Other non-current assets 109 106 Total non-current assets 2,012 1,973
Current assetsInventory 18 18 Trade and other receivables 1,138 1,053 Prepayments 96 65 Contract assets 3 148 - Accrued income - 131 Income tax receivable 12 12 Cash and cash equivalents 203 295 Assets held for sale 10 4 - Total current assets 1,619 1,574
TOTAL ASSETS 3,631 3,547
EQUITYCapital and reserves attributable to equity holdersPreferred stock, Common stock and Additional paid in capital 1,443 1,443 Other reserves 919 877 Accumulated deficit (3,065) (2,997) Attributable to equity holders of the Company (703) (677)
Non-controlling interests 3 3
Total Group equity (700) (674)
LIABILITIESNon-current liabilitiesBorrowings 9 2,257 2,197 Deferred income tax liabilities 8 8 Retirement benefit obligations 112 111 Provisions 134 125 Other non-current liabilities 62 60 Total non-current liabilities 2,573 2,501
Current liabilitiesBorrowings 9 174 187 Provisions 69 68 Trade and other payables 1,474 1,449 Contract liabilities 3 22 - Income tax payable 19 16 Total current liabilities 1,758 1,720
TOTAL EQUITY AND LIABILITIES 3,631 3,547
CEVA Holdings LLC – Quarter One 2018 Interim Financial Statements
10
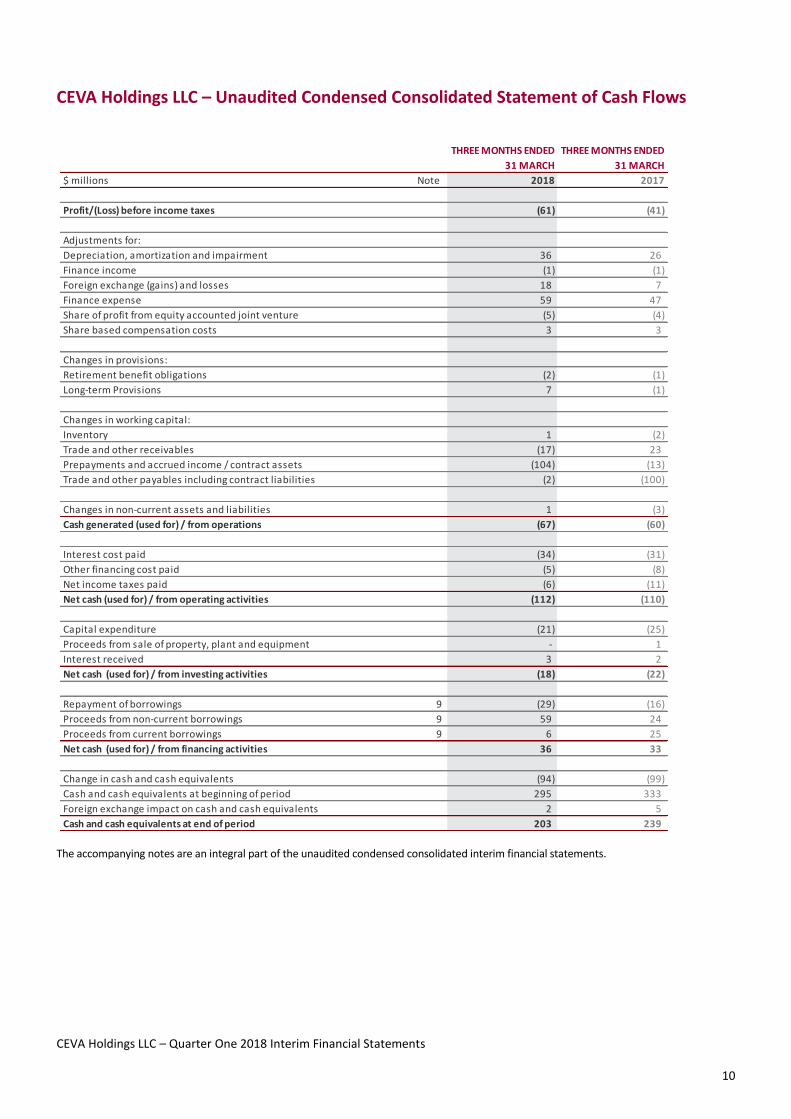
CEVA Holdings LLC – Unaudited Condensed Consolidated Statement of Cash Flows
The accompanying notes are an integral part of the unaudited condensed consolidated interim financial statements.
THREE MONTHS ENDED 31 MARCH
THREE MONTHS ENDED 31 MARCH
$ millions Note 2018 2017
Profit/(Loss) before income taxes (61) (41)
Adjustments for:Depreciation, amortization and impairment 36 26 Finance income (1) (1) Foreign exchange (gains) and losses 18 7 Finance expense 59 47 Share of profit from equity accounted joint venture (5) (4) Share based compensation costs 3 3
Changes in provisions:Retirement benefit obligations (2) (1) Long-term Provisions 7 (1)
Changes in working capital:Inventory 1 (2) Trade and other receivables (17) 23 Prepayments and accrued income / contract assets (104) (13) Trade and other payables including contract liabilities (2) (100)
Changes in non-current assets and liabilities 1 (3) Cash generated (used for) / from operations (67) (60)
Interest cost paid (34) (31) Other financing cost paid (5) (8) Net income taxes paid (6) (11) Net cash (used for) / from operating activities (112) (110)
Capital expenditure (21) (25) Proceeds from sale of property, plant and equipment - 1 Interest received 3 2 Net cash (used for) / from investing activities (18) (22)
Repayment of borrowings 9 (29) (16) Proceeds from non-current borrowings 9 59 24 Proceeds from current borrowings 9 6 25 Net cash (used for) / from financing activities 36 33
Change in cash and cash equivalents (94) (99) Cash and cash equivalents at beginning of period 295 333 Foreign exchange impact on cash and cash equivalents 2 5 Cash and cash equivalents at end of period 203 239

CEVA Holdings LLC – Quarter One 2018 Interim Financial Statements
11
CEVA Holdings LLC – Unaudited Condensed Consolidated Statement of Changes in Equity
1 Refer to Note 3 for details on restatement The accompanying notes are an integral part of the unaudited condensed consolidated interim financial statements.
$ millions
Preferred stock, common stock and Additional paid in capital
Other reserves
Accumulated deficit
Attributableto equity
holders of theCompany
Non- controlling
interestTotal Group
equityBalance at 1 January 2017 1,443 816 (2,800) (541) 3 (538) Currency translation adjustment - 32 - 32 - 32 Share based compensation reserve - 3 - 3 - 3 Loss attributable to equity holders for the period - - (57) (57) - (57) Balance at 31 March 2017 1,443 851 (2,857) (563) 3 (560)
Restated as at 1 January 20181 1,443 877 (2,998) (678) 3 (675) Currency translation adjustment - 39 - 39 - 39 Share based compensation reserve - 3 - 3 - 3 Loss attributable to equity holders for the period - - (67) (67) - (67) Profit attributable to non-controlling interest - - - - - - Balance at 31 March 2018 1,443 919 (3,065) (703) 3 (700)

CEVA Holdings LLC – Quarter One 2018 Interim Financial Statements
12
Notes to the Unaudited Condensed Consolidated Interim Financial Statements
1. General Information
On 3 May 2018 CEVA Holdings LLC legally merged with CEVA Logistics AG (formerly a newly formed wholly owned subsidiary incorporated in Switzerland), with CEVA Logistics AG being the surviving entity that then listed on the Swiss Stock Exchange. These Quarter One Interim Financial statements therefore set out the results of CEVA Holdings LLC, which is the predecessor to CEVA Logistics AG.
CEVA Holdings LLC (the “Company”) and its subsidiaries (collectively, the “Group” or “CEVA”) design, implement and operate complete end-to-end Freight Management and Contract Logistics solutions for multinational and small and medium sized companies on a local, regional and global level. CEVA Holdings LLC was incorporated on 28 March 2013 in the Republic of the Marshall Islands. The address of its registered office is c/o The Trust Company of the Marshall Islands, Inc., Trust Company Complex, Ajeltake Road, Ajeltake Island, Majuro, MH96960, Marshall Islands. CEVA Holdings LLC is the immediate parent of CEVA Group Plc, a company incorporated on 9 August 2006 in England and Wales as a UK public company with limited liability. Pursuant to the LLC Agreement, Apollo Global Management LLC (“Apollo”) and its affiliates hold a majority of the voting power of the Company and have the right to elect a majority of the respective boards of the Company and CEVA Group Plc. Certain major corporate actions by the Company’s Board require approval of a majority of the Managers not designated by Apollo. On 3 May 2018 CEVA Holdings LLC as transferring entity merged with CEVA Logistics AG with CEVA Logistics AG being the surviving entity. Further, subsequent to the merger CEVA Logistics AG increased its share capital in connection with the initial public offering and the listing of its shares on the SIX Swiss Exchange. As a result of the merger and the capital increase of CEVA Logistics AG, which was completed on 3 May 2018, neither Apollo nor its affiliates hold a majority of the voting power of CEVA Logistics AG. Refer to note 16 for changes subsequent to the balance sheet. These unaudited condensed consolidated interim financial statements were approved and authorized for issue by the Board of Directors of CEVA Logistics AG on 15 May 2018.
2. Basis of Preparation
The unaudited condensed consolidated interim financial information for the three months ended 31 March 2018 has been prepared on a going concern basis and in accordance with IAS 34, ‘Interim financial reporting’. The unaudited condensed consolidated interim financial information should be read in conjunction with the annual financial statements of CEVA Holdings LLC for the year ended 31 December 2017, which have been prepared in accordance with International Financial Reporting Standards (IFRS) as adopted by the European Union and in accordance with IFRIC interpretations.
3. Accounting Policies
The accounting policies applied are consistent with those applied in the consolidated financial statements of CEVA Holdings LLC as at and for the year ended 31 December 2017, and as described in those consolidated financial statements which can be found at www.cevalogistics.com, except as described above. New and amended standards adopted by the Group The Group has applied the following standards and amendments for the first time for the financial year beginning on 1 January 2018: x IFRS 2, “Share Based Payments” – Clarifies the standard in relation to the accounting for cash-settled share-based payment transactions that
include a performance condition, the classification of share-based payment transactions with net settlement features, and the accounting for modifications of share-based payment transactions from cash-settled to equity-settled. This standard does not have any material impact on the financial statements.
x IFRS 9, “Financial Instruments” – Addresses the classification, measurement and recognition of financial assets and financial liabilities. IFRS 9 was issued in November 2009 and October 2010, and further amended in July 2014. It replaces the parts of IAS 39 that relate to the classification and measurement of financial instruments. IFRS 9 requires financial assets to be classified into two measurement categories: those measured as at fair value and those measured at amortized cost. The determination is made at initial recognition. The classification depends on the entity’s business model for managing its financial instruments and the contractual cash flow characteristics of the instrument. For financial liabilities, the standard retains most of the IAS 39 requirements. The main change is that, in cases where the fair value option is taken for financial liabilities, the part of a fair value change due to an entity’s own credit risk is recorded in other comprehensive income rather than the income statement, unless this creates an accounting mismatch. IFRS 9 relaxes the requirements for hedge effectiveness by replacing the bright line hedge effectiveness tests. It requires an economic relationship between the hedged item and hedging instrument and for the ‘hedged ratio’ to be the same as the one management actually use for risk management purposes. Contemporaneous documentation is still required but is different to that currently prepared under IAS 39. IFRS 9 also introduces a single impairment model and removes the need for a triggering event to be necessary for recognition of impairment losses. The group concluded that the classification and measurement basis for its financial assets and liabilities will be largely unchanged by adoption of IFRS 9. The main impact of adopting IFRS 9 arose from the implementation of the expected loss model regarding trade debtors. The
CEVA Holdings LLC – Quarter One 2018 Interim Financial Statements
13
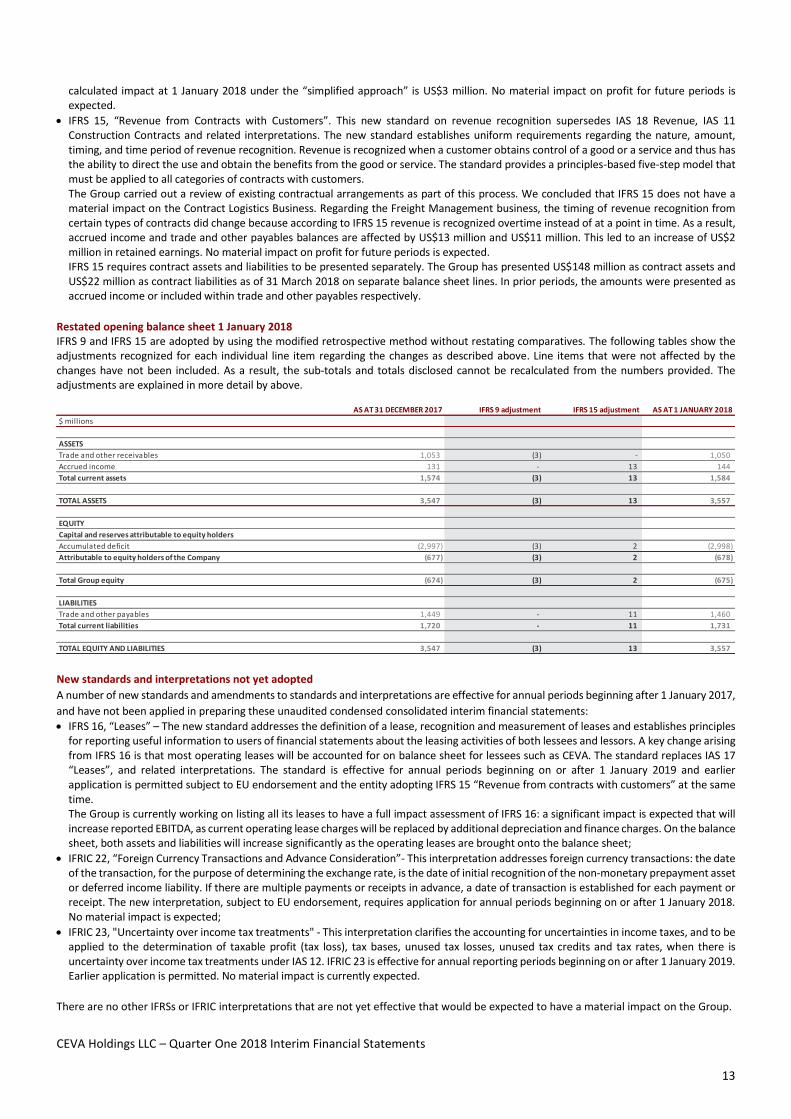
calculated impact at 1 January 2018 under the “simplified approach” is US$3 million. No material impact on profit for future periods is expected.
x IFRS 15, “Revenue from Contracts with Customers”. This new standard on revenue recognition supersedes IAS 18 Revenue, IAS 11 Construction Contracts and related interpretations. The new standard establishes uniform requirements regarding the nature, amount, timing, and time period of revenue recognition. Revenue is recognized when a customer obtains control of a good or a service and thus has the ability to direct the use and obtain the benefits from the good or service. The standard provides a principles-based five-step model that must be applied to all categories of contracts with customers. The Group carried out a review of existing contractual arrangements as part of this process. We concluded that IFRS 15 does not have a material impact on the Contract Logistics Business. Regarding the Freight Management business, the timing of revenue recognition from certain types of contracts did change because according to IFRS 15 revenue is recognized overtime instead of at a point in time. As a result, accrued income and trade and other payables balances are affected by US$13 million and US$11 million. This led to an increase of US$2 million in retained earnings. No material impact on profit for future periods is expected. IFRS 15 requires contract assets and liabilities to be presented separately. The Group has presented US$148 million as contract assets and US$22 million as contract liabilities as of 31 March 2018 on separate balance sheet lines. In prior periods, the amounts were presented as accrued income or included within trade and other payables respectively.
Restated opening balance sheet 1 January 2018 IFRS 9 and IFRS 15 are adopted by using the modified retrospective method without restating comparatives. The following tables show the adjustments recognized for each individual line item regarding the changes as described above. Line items that were not affected by the changes have not been included. As a result, the sub-totals and totals disclosed cannot be recalculated from the numbers provided. The adjustments are explained in more detail by above.
New standards and interpretations not yet adopted A number of new standards and amendments to standards and interpretations are effective for annual periods beginning after 1 January 2017, and have not been applied in preparing these unaudited condensed consolidated interim financial statements: x IFRS 16, “Leases” – The new standard addresses the definition of a lease, recognition and measurement of leases and establishes principles
for reporting useful information to users of financial statements about the leasing activities of both lessees and lessors. A key change arising from IFRS 16 is that most operating leases will be accounted for on balance sheet for lessees such as CEVA. The standard replaces IAS 17 “Leases”, and related interpretations. The standard is effective for annual periods beginning on or after 1 January 2019 and earlier application is permitted subject to EU endorsement and the entity adopting IFRS 15 “Revenue from contracts with customers” at the same time. The Group is currently working on listing all its leases to have a full impact assessment of IFRS 16: a significant impact is expected that will increase reported EBITDA, as current operating lease charges will be replaced by additional depreciation and finance charges. On the balance sheet, both assets and liabilities will increase significantly as the operating leases are brought onto the balance sheet;
x IFRIC 22, “Foreign Currency Transactions and Advance Consideration”- This interpretation addresses foreign currency transactions: the date of the transaction, for the purpose of determining the exchange rate, is the date of initial recognition of the non-monetary prepayment asset or deferred income liability. If there are multiple payments or receipts in advance, a date of transaction is established for each payment or receipt. The new interpretation, subject to EU endorsement, requires application for annual periods beginning on or after 1 January 2018. No material impact is expected;
x IFRIC 23, "Uncertainty over income tax treatments" - This interpretation clarifies the accounting for uncertainties in income taxes, and to be applied to the determination of taxable profit (tax loss), tax bases, unused tax losses, unused tax credits and tax rates, when there is uncertainty over income tax treatments under IAS 12. IFRIC 23 is effective for annual reporting periods beginning on or after 1 January 2019. Earlier application is permitted. No material impact is currently expected.
There are no other IFRSs or IFRIC interpretations that are not yet effective that would be expected to have a material impact on the Group.
AS AT 31 DECEMBER 2017 IFRS 9 adjustment IFRS 15 adjustment AS AT 1 JANUARY 2018$ millions
ASSETSTrade and other receivables 1,053 (3) - 1,050 Accrued income 131 - 13 144 Total current assets 1,574 (3) 13 1,584
TOTAL ASSETS 3,547 (3) 13 3,557
EQUITYCapital and reserves attributable to equity holdersAccumulated deficit (2,997) (3) 2 (2,998) Attributable to equity holders of the Company (677) (3) 2 (678)
Total Group equity (674) (3) 2 (675)
LIABILITIESTrade and other payables 1,449 - 11 1,460 Total current liabilities 1,720 - 11 1,731
TOTAL EQUITY AND LIABILITIES 3,547 (3) 13 3,557

CEVA Holdings LLC – Quarter One 2018 Interim Financial Statements
14
4. Critical Accounting Estimates and Judgments
The preparation of financial statements in accordance with generally accepted accounting principles under IFRS requires the Group to make estimates, judgments and assumptions that may affect the reported amounts of assets, liabilities, revenue and expenses and the disclosure of contingent assets and liabilities in the financial statements. Estimates and judgments are continually evaluated and are based on historical experience and other factors, including expectations of future events that are believed to be reasonable under the circumstances. The resulting accounting estimates will, by definition, rarely equal the related actual results. Actual results may differ significantly from these estimates, the effect of which is recognized in the period in which the facts that give rise to the revision, become known. In preparing these unaudited condensed consolidated interim financial statements, the significant judgments made by management in applying the Group’s accounting policies and the key sources of estimation uncertainty, were the same (being impairment of goodwill, income taxes, retirement benefits, provisions for onerous contracts, provisions and contingent liabilities) as those that applied to the consolidated financial statements of CEVA Holdings LLC as at, and for, the year ended 31 December 2017.
5. Financial Risk Management
The Group’s operations and financial results are subject to various risks and uncertainties that could adversely affect our business, financial position, results of operations and cash flows. The Group’s risk management objectives and policies are consistent with those disclosed in the consolidated financial statements as at, and for, the year ended 31 December 2017. The Group operates internationally and generates foreign currency exchange risks arising from future commercial transactions, recognized assets and liabilities, investments and divestments in foreign currencies other than the US dollar, the Group’s reporting currency. The main exchange rates are shown below:
As a result of our global operations, our business, results of operations and financial condition may be materially adversely affected by fluctuations in currency exchange rates. For example, we are subject to currency risks because our revenues may be generated in different currencies from the currencies in which our related costs are incurred, and because our cash flow may be generated in currencies that do not match our debt service obligations. In addition, our reporting currency is the U.S. dollar, and therefore our reporting results are subject to translational risks relating to currency exchange rate fluctuations. Given the volatility of exchange rates, our failure to effectively hedge or otherwise manage such currency risks effectively may materially adversely affect our financial condition and results of operations.
6. Segment Information
The Group’s operating and reporting segments are its Freight Management and Contract Logistics businesses which are the main focus of the Group’s chief operating decision maker (“CODM”), the Executive Board of the Group (the “Executive Board”). This is the primary way in which the CODM is provided with financial information. The Group’s internal organization and management structure is also aligned to the two businesses. All reporting to the CODM analyses performance by Freight Management and Contract Logistics business activity, and resources are allocated on this basis. Disclosure has been included in the segment note to reflect these operating segments. As additional information the Group has also provided geographical information on its results. The Executive Board considers the operations from a business perspective. In addition, information from a geographical perspective has also been presented, which reflects the cluster basis on which the Company administers the operations of its business. Operating segments
x Freight Management, which includes the provision of international air, ocean, ground, customs brokerage, deferred air and pickup and delivery, and other value-added services; and
x Contract Logistics, which includes the provision of inbound logistics, manufacturing support, outbound/distribution logistics and aftermarket logistics.
Additional geographical information The Group is operating on a worldwide basis in the following geographical areas:
x Americas – comprising North America; Central America; and South America clusters; x Asia Pacific – comprising South East Asia; Mekong; India sub-continent; Australia and New Zealand; Greater China; and North Asia
clusters; x Europe – comprising UK, Ireland and Nordics; Benelux; France; Germany; Central and Eastern Europe; Italy; Iberia; and BAMECA
(includes the Balkans, the Middle East and Africa) clusters.
2018 2017March closing Three Month Average March closing Three Month Average
British pound 0.7135 0.7196 0.7971 0.8052Euro 0.8116 0.8147 0.9391 0.9390Chinese yuan 6.2726 6.3629 6.8832 6.8930
CEVA Holdings LLC – Quarter One 2018 Interim Financial Statements
15
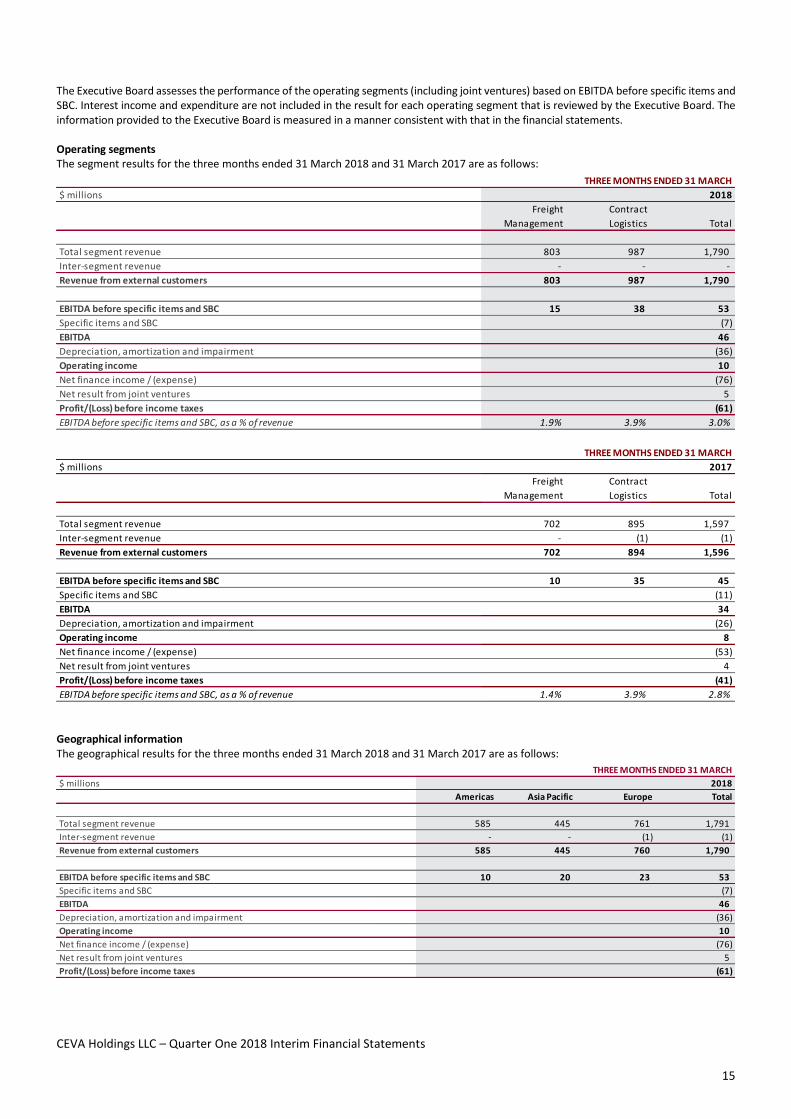
The Executive Board assesses the performance of the operating segments (including joint ventures) based on EBITDA before specific items and SBC. Interest income and expenditure are not included in the result for each operating segment that is reviewed by the Executive Board. The information provided to the Executive Board is measured in a manner consistent with that in the financial statements. Operating segments The segment results for the three months ended 31 March 2018 and 31 March 2017 are as follows:
Geographical information The geographical results for the three months ended 31 March 2018 and 31 March 2017 are as follows:
THREE MONTHS ENDED 31 MARCH$ millions
FreightManagement
ContractLogistics Total
Total segment revenue 803 987 1,790Inter-segment revenue - - -Revenue from external customers 803 987 1,790
EBITDA before specific items and SBC 15 38 53Specific items and SBC (7)EBITDA 46Depreciation, amortization and impairment (36)Operating income 10Net finance income / (expense) (76)Net result from joint ventures 5Profit/(Loss) before income taxes (61)EBITDA before specific items and SBC, as a % of revenue 1.9% 3.9% 3.0%
2018
THREE MONTHS ENDED 31 MARCH$ millions
FreightManagement
ContractLogistics Total
Total segment revenue 702 895 1,597Inter-segment revenue - (1) (1)Revenue from external customers 702 894 1,596
EBITDA before specific items and SBC 10 35 45Specific items and SBC (11)EBITDA 34Depreciation, amortization and impairment (26)Operating income 8Net finance income / (expense) (53)Net result from joint ventures 4Profit/(Loss) before income taxes (41)EBITDA before specific items and SBC, as a % of revenue 1.4% 3.9% 2.8%
2017
$ millionsAmericas Asia Pacific Europe Total
Total segment revenue 585 445 761 1,791Inter-segment revenue - - (1) (1)Revenue from external customers 585 445 760 1,790
EBITDA before specific items and SBC 10 20 23 53Specific items and SBC (7)EBITDA 46Depreciation, amortization and impairment (36)Operating income 10Net finance income / (expense) (76)Net result from joint ventures 5Profit/(Loss) before income taxes (61)
2018THREE MONTHS ENDED 31 MARCH
CEVA Holdings LLC – Quarter One 2018 Interim Financial Statements
16
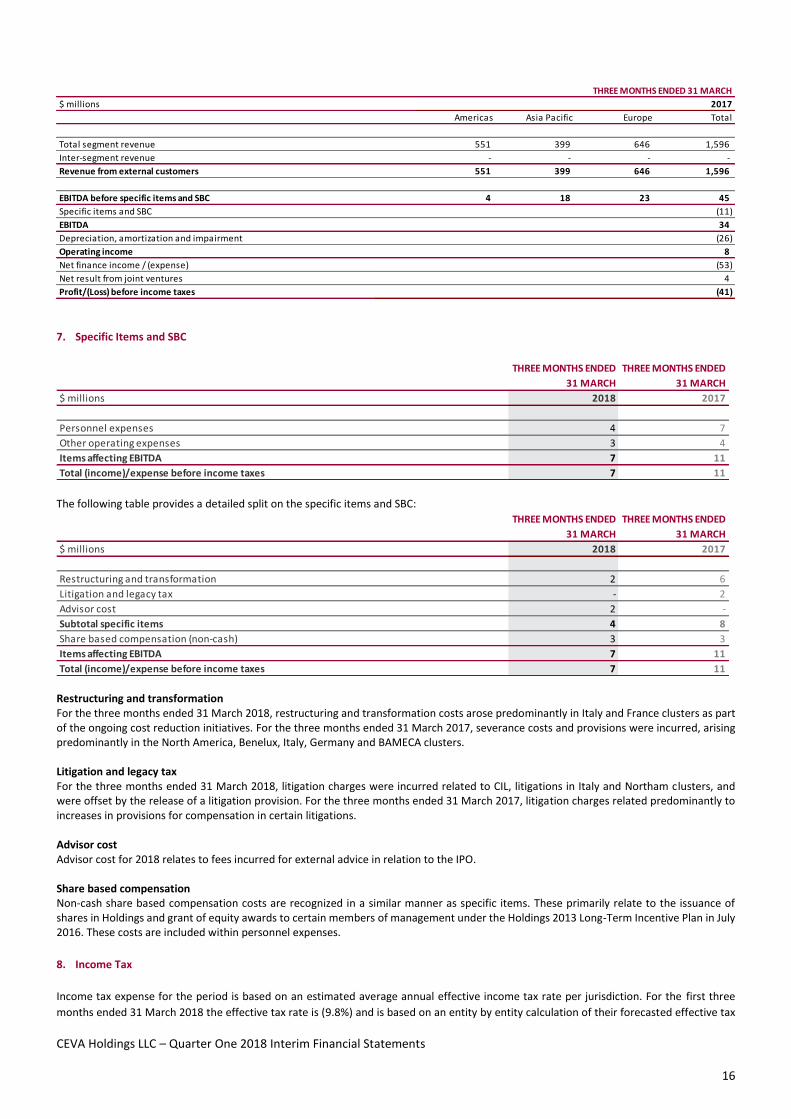
7. Specific Items and SBC
The following table provides a detailed split on the specific items and SBC:
Restructuring and transformation For the three months ended 31 March 2018, restructuring and transformation costs arose predominantly in Italy and France clusters as part of the ongoing cost reduction initiatives. For the three months ended 31 March 2017, severance costs and provisions were incurred, arising predominantly in the North America, Benelux, Italy, Germany and BAMECA clusters. Litigation and legacy tax For the three months ended 31 March 2018, litigation charges were incurred related to CIL, litigations in Italy and Northam clusters, and were offset by the release of a litigation provision. For the three months ended 31 March 2017, litigation charges related predominantly to increases in provisions for compensation in certain litigations. Advisor cost Advisor cost for 2018 relates to fees incurred for external advice in relation to the IPO. Share based compensation Non-cash share based compensation costs are recognized in a similar manner as specific items. These primarily relate to the issuance of shares in Holdings and grant of equity awards to certain members of management under the Holdings 2013 Long-Term Incentive Plan in July 2016. These costs are included within personnel expenses.
8. Income Tax
Income tax expense for the period is based on an estimated average annual effective income tax rate per jurisdiction. For the first three months ended 31 March 2018 the effective tax rate is (9.8%) and is based on an entity by entity calculation of their forecasted effective tax
$ millions
Americas Asia Pacific Europe Total
Total segment revenue 551 399 646 1,596Inter-segment revenue - - - -Revenue from external customers 551 399 646 1,596
EBITDA before specific items and SBC 4 18 23 45Specific items and SBC (11)EBITDA 34Depreciation, amortization and impairment (26)Operating income 8Net finance income / (expense) (53)Net result from joint ventures 4Profit/(Loss) before income taxes (41)
THREE MONTHS ENDED 31 MARCH2017
THREE MONTHS ENDED 31 MARCH
THREE MONTHS ENDED 31 MARCH
$ millions 2018 2017
Personnel expenses 4 7 Other operating expenses 3 4 Items affecting EBITDA 7 11 Total (income)/expense before income taxes 7 11
THREE MONTHS ENDED 31 MARCH
THREE MONTHS ENDED 31 MARCH
$ millions 2018 2017
Restructuring and transformation 2 6 Litigation and legacy tax - 2 Advisor cost 2 - Subtotal specific items 4 8 Share based compensation (non-cash) 3 3 Items affecting EBITDA 7 11 Total (income)/expense before income taxes 7 11
CEVA Holdings LLC – Quarter One 2018 Interim Financial Statements
17
rates for the full year. The effective tax rate for the first three months ended 31 March 2017 (39.0)% was based on the forecasted effective tax rate for the consolidated group.
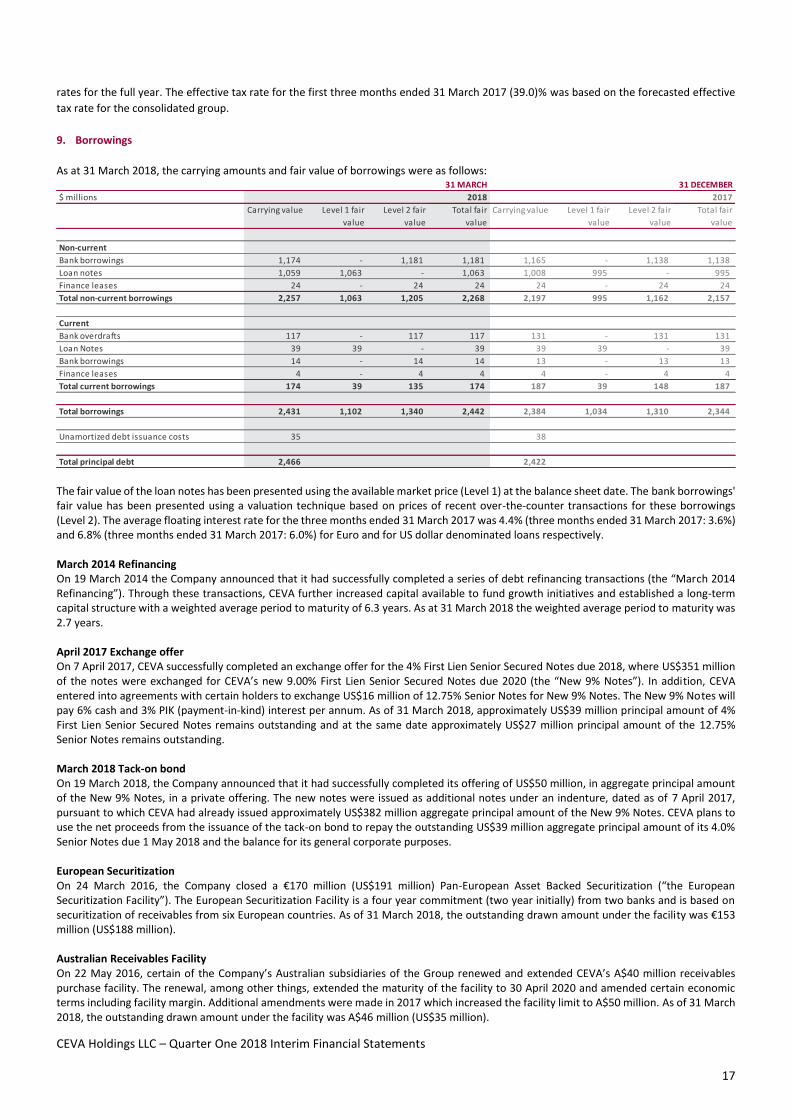
9. Borrowings
As at 31 March 2018, the carrying amounts and fair value of borrowings were as follows:
The fair value of the loan notes has been presented using the available market price (Level 1) at the balance sheet date. The bank borrowings' fair value has been presented using a valuation technique based on prices of recent over-the-counter transactions for these borrowings (Level 2). The average floating interest rate for the three months ended 31 March 2017 was 4.4% (three months ended 31 March 2017: 3.6%) and 6.8% (three months ended 31 March 2017: 6.0%) for Euro and for US dollar denominated loans respectively. March 2014 Refinancing On 19 March 2014 the Company announced that it had successfully completed a series of debt refinancing transactions (the “March 2014 Refinancing”). Through these transactions, CEVA further increased capital available to fund growth initiatives and established a long-term capital structure with a weighted average period to maturity of 6.3 years. As at 31 March 2018 the weighted average period to maturity was 2.7 years. April 2017 Exchange offer On 7 April 2017, CEVA successfully completed an exchange offer for the 4% First Lien Senior Secured Notes due 2018, where US$351 million of the notes were exchanged for CEVA’s new 9.00% First Lien Senior Secured Notes due 2020 (the “New 9% Notes”). In addition, CEVA entered into agreements with certain holders to exchange US$16 million of 12.75% Senior Notes for New 9% Notes. The New 9% Notes will pay 6% cash and 3% PIK (payment-in-kind) interest per annum. As of 31 March 2018, approximately US$39 million principal amount of 4% First Lien Senior Secured Notes remains outstanding and at the same date approximately US$27 million principal amount of the 12.75% Senior Notes remains outstanding. March 2018 Tack-on bond On 19 March 2018, the Company announced that it had successfully completed its offering of US$50 million, in aggregate principal amount of the New 9% Notes, in a private offering. The new notes were issued as additional notes under an indenture, dated as of 7 April 2017, pursuant to which CEVA had already issued approximately US$382 million aggregate principal amount of the New 9% Notes. CEVA plans to use the net proceeds from the issuance of the tack-on bond to repay the outstanding US$39 million aggregate principal amount of its 4.0% Senior Notes due 1 May 2018 and the balance for its general corporate purposes. European Securitization On 24 March 2016, the Company closed a €170 million (US$191 million) Pan-European Asset Backed Securitization (“the European Securitization Facility”). The European Securitization Facility is a four year commitment (two year initially) from two banks and is based on securitization of receivables from six European countries. As of 31 March 2018, the outstanding drawn amount under the facility was €153 million (US$188 million). Australian Receivables Facility On 22 May 2016, certain of the Company’s Australian subsidiaries of the Group renewed and extended CEVA’s A$40 million receivables purchase facility. The renewal, among other things, extended the maturity of the facility to 30 April 2020 and amended certain economic terms including facility margin. Additional amendments were made in 2017 which increased the facility limit to A$50 million. As of 31 March 2018, the outstanding drawn amount under the facility was A$46 million (US$35 million).
31 MARCH 31 DECEMBER$ millions 2018 2017
Carrying value Level 1 fair value
Level 2 fair value
Total fair value
Carrying value Level 1 fair value
Level 2 fair value
Total fair value
Non-currentBank borrowings 1,174 - 1,181 1,181 1,165 - 1,138 1,138 Loan notes 1,059 1,063 - 1,063 1,008 995 - 995 Finance leases 24 - 24 24 24 - 24 24 Total non-current borrowings 2,257 1,063 1,205 2,268 2,197 995 1,162 2,157
CurrentBank overdrafts 117 - 117 117 131 - 131 131 Loan Notes 39 39 - 39 39 39 - 39 Bank borrowings 14 - 14 14 13 - 13 13 Finance leases 4 - 4 4 4 - 4 4 Total current borrowings 174 39 135 174 187 39 148 187
Total borrowings 2,431 1,102 1,340 2,442 2,384 1,034 1,310 2,344
Unamortized debt issuance costs 35 38
Total principal debt 2,466 2,422
CEVA Holdings LLC – Quarter One 2018 Interim Financial Statements
18
US ABL facility due 2020 On 19 November 2010, certain US subsidiaries of the Group (“the Originators”) and a new subsidiary, CEVA US Receivables, LLC (the “Unrestricted Subsidiary”), entered into agreements establishing an Asset Backed Loan (ABL) Facility with an initial commitment amount of US$200 million (the “ABL Facility”). On 30 November 2010, the committed amount of the ABL Facility was increased to US$250 million. The ABL Facility was scheduled to mature on 31 December 2018, but was amended in November 2017 and now matures on 1 August 2020. The commitment amount for the facility has been reduced to US$225 million. As at 31 March 2018, the outstanding drawn amount of the ABL Facility was US$193 million. Covenants At the end of the quarter, if the outstanding amount under our US$250 million revolving credit facility exceeds 30% of the total facility, our senior secured credit facilities require us to maintain a maximum ratio of secured first lien net debt to covenant EBITDA of 5.35 to 1.0, calculated for the trailing four quarters (as determined under our senior secured credit facility agreement). As at 31 March 2018 there was no debt outstanding under this facility. The Group is in compliance with the covenants set forth in the documents governing its existing borrowings and believes that it has sufficient liquidity to service its operating activities and continued growth ambitions for the foreseeable future.
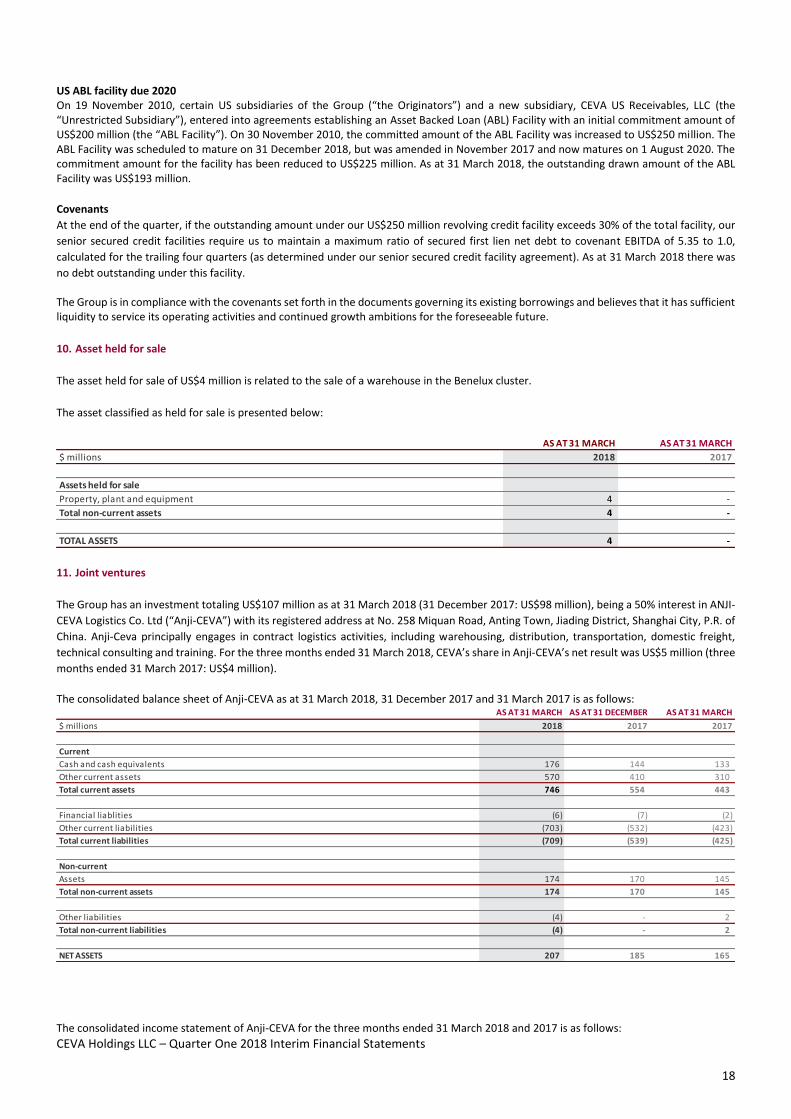
10. Asset held for sale
The asset held for sale of US$4 million is related to the sale of a warehouse in the Benelux cluster.
The asset classified as held for sale is presented below:
11. Joint ventures
The Group has an investment totaling US$107 million as at 31 March 2018 (31 December 2017: US$98 million), being a 50% interest in ANJI-CEVA Logistics Co. Ltd (“Anji-CEVA”) with its registered address at No. 258 Miquan Road, Anting Town, Jiading District, Shanghai City, P.R. of China. Anji-Ceva principally engages in contract logistics activities, including warehousing, distribution, transportation, domestic freight, technical consulting and training. For the three months ended 31 March 2018, CEVA’s share in Anji-CEVA’s net result was US$5 million (three months ended 31 March 2017: US$4 million).
The consolidated balance sheet of Anji-CEVA as at 31 March 2018, 31 December 2017 and 31 March 2017 is as follows:
The consolidated income statement of Anji-CEVA for the three months ended 31 March 2018 and 2017 is as follows:
AS AT 31 MARCH AS AT 31 MARCH$ millions 2018 2017
Assets held for saleProperty, plant and equipment 4 - Total non-current assets 4 -
TOTAL ASSETS 4 -
AS AT 31 MARCH AS AT 31 DECEMBER AS AT 31 MARCH$ millions 2018 2017 2017
CurrentCash and cash equivalents 176 144 133 Other current assets 570 410 310 Total current assets 746 554 443
Financial liablities (6) (7) (2) Other current liabilities (703) (532) (423) Total current liabilities (709) (539) (425)
Non-currentAssets 174 170 145 Total non-current assets 174 170 145
Other liabilities (4) - 2 Total non-current liabilities (4) - 2
NET ASSETS 207 185 165

CEVA Holdings LLC – Quarter One 2018 Interim Financial Statements
19
The reconciliation from the net asset value to the carrying value of the joint ventures for the period ending 31 March 2018 and 2017 is as follows:
The Company had no contingent liabilities towards the joint venture as at 31 March 2018 (31 December 2017: nil). There are no significant restrictions on the ability of joint ventures to transfer funds to the Company in the form of cash dividends, or to repay loans or advances made by the Company.
12. Commitments
Operating lease commitments The Group leases various offices and warehouses under non-cancellable operating lease agreements. The lease terms are generally between one and six years and the majority of lease agreements are renewable at the end of the lease period at market rates. The Group also leases various motor vehicles, office and computer equipment under operating lease agreements. During the three months ended 31 March 2018, US$90 million was recognized as an expense in the income statement in respect of operating lease rentals (three months ended 31 March 2017: US$81 million).
$ millions 2018 2017
Revenue 346 245
Operating expenses excluding depreciation, amortization and impairment (321) (226)
EBITDA 25 19
Depreciation,amortization and impairment (7) (4)
Operating income 18 15
Net finance income/(expense) (including foreign exchange movements) - -
Profit/(Loss) before income taxes 18 15
Income tax (expense) / Income (5) (4) Profit/(Loss) for the period 13 11
Attributable to:Non-controlling interests 3 2 Equity holders of the Company 10 9
YEAR ENDED 31 MARCH
$ millions 2018 2017
Opening net assets - 1 January 185 149 Allocated to non-controlling interest (41) (35)Adjusted opening net assets - 1 January 144 114 Profit for the period 13 11 Non-controlling interest (3) (2) Dividend paid by joint ventures - - Foreign exchange impact 5 2 Closing net assets - 31 March 159 125 Interest in joint ventures at 50% 80 63 Goodwill in joint ventures 27 25 Carrying value 31 March 107 88
YEAR ENDED 31 MARCH
CEVA Holdings LLC – Quarter One 2018 Interim Financial Statements
20
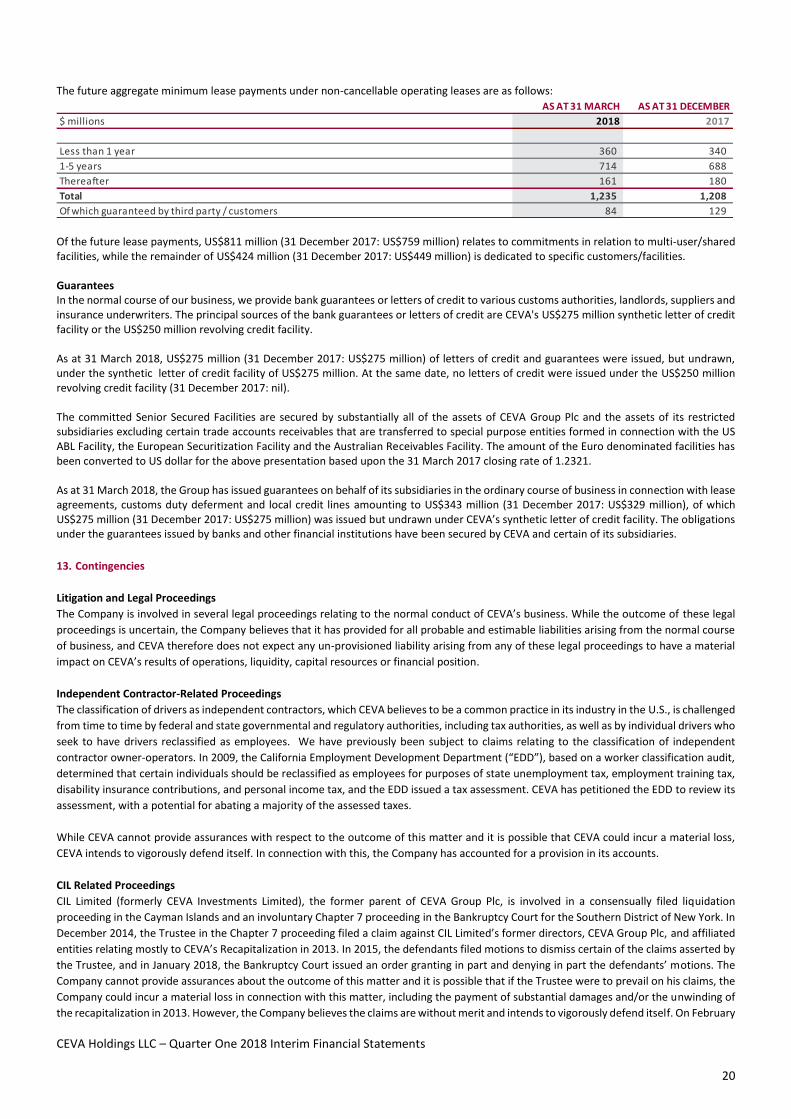
The future aggregate minimum lease payments under non-cancellable operating leases are as follows:
Of the future lease payments, US$811 million (31 December 2017: US$759 million) relates to commitments in relation to multi-user/shared facilities, while the remainder of US$424 million (31 December 2017: US$449 million) is dedicated to specific customers/facilities. Guarantees In the normal course of our business, we provide bank guarantees or letters of credit to various customs authorities, landlords, suppliers and insurance underwriters. The principal sources of the bank guarantees or letters of credit are CEVA's US$275 million synthetic letter of credit facility or the US$250 million revolving credit facility. As at 31 March 2018, US$275 million (31 December 2017: US$275 million) of letters of credit and guarantees were issued, but undrawn, under the synthetic letter of credit facility of US$275 million. At the same date, no letters of credit were issued under the US$250 million revolving credit facility (31 December 2017: nil). The committed Senior Secured Facilities are secured by substantially all of the assets of CEVA Group Plc and the assets of its restricted subsidiaries excluding certain trade accounts receivables that are transferred to special purpose entities formed in connection with the US ABL Facility, the European Securitization Facility and the Australian Receivables Facility. The amount of the Euro denominated facilities has been converted to US dollar for the above presentation based upon the 31 March 2017 closing rate of 1.2321. As at 31 March 2018, the Group has issued guarantees on behalf of its subsidiaries in the ordinary course of business in connection with lease agreements, customs duty deferment and local credit lines amounting to US$343 million (31 December 2017: US$329 million), of which US$275 million (31 December 2017: US$275 million) was issued but undrawn under CEVA’s synthetic letter of credit facility. The obligations under the guarantees issued by banks and other financial institutions have been secured by CEVA and certain of its subsidiaries.
13. Contingencies
Litigation and Legal Proceedings The Company is involved in several legal proceedings relating to the normal conduct of CEVA’s business. While the outcome of these legal proceedings is uncertain, the Company believes that it has provided for all probable and estimable liabilities arising from the normal course of business, and CEVA therefore does not expect any un-provisioned liability arising from any of these legal proceedings to have a material impact on CEVA’s results of operations, liquidity, capital resources or financial position. Independent Contractor-Related Proceedings The classification of drivers as independent contractors, which CEVA believes to be a common practice in its industry in the U.S., is challenged from time to time by federal and state governmental and regulatory authorities, including tax authorities, as well as by individual drivers who seek to have drivers reclassified as employees. We have previously been subject to claims relating to the classification of independent contractor owner-operators. In 2009, the California Employment Development Department (“EDD”), based on a worker classification audit, determined that certain individuals should be reclassified as employees for purposes of state unemployment tax, employment training tax, disability insurance contributions, and personal income tax, and the EDD issued a tax assessment. CEVA has petitioned the EDD to review its assessment, with a potential for abating a majority of the assessed taxes. While CEVA cannot provide assurances with respect to the outcome of this matter and it is possible that CEVA could incur a material loss, CEVA intends to vigorously defend itself. In connection with this, the Company has accounted for a provision in its accounts. CIL Related Proceedings CIL Limited (formerly CEVA Investments Limited), the former parent of CEVA Group Plc, is involved in a consensually filed liquidation proceeding in the Cayman Islands and an involuntary Chapter 7 proceeding in the Bankruptcy Court for the Southern District of New York. In December 2014, the Trustee in the Chapter 7 proceeding filed a claim against CIL Limited’s former directors, CEVA Group Plc, and affiliated entities relating mostly to CEVA’s Recapitalization in 2013. In 2015, the defendants filed motions to dismiss certain of the claims asserted by the Trustee, and in January 2018, the Bankruptcy Court issued an order granting in part and denying in part the defendants’ motions. The Company cannot provide assurances about the outcome of this matter and it is possible that if the Trustee were to prevail on his claims, the Company could incur a material loss in connection with this matter, including the payment of substantial damages and/or the unwinding of the recapitalization in 2013. However, the Company believes the claims are without merit and intends to vigorously defend itself. On February
AS AT 31 MARCH AS AT 31 DECEMBER$ millions 2018 2017
Less than 1 year 360 340 1-5 years 714 688 Thereafter 161 180 Total 1,235 1,208 Of which guaranteed by third party / customers 84 129
CEVA Holdings LLC – Quarter One 2018 Interim Financial Statements
21
6, 2018, the Trustee filed a motion seeking (i) reconsideration of the Court’s “with prejudice” dismissal of his fraudulent transfer claims under U.S. law and (ii) leave to file an amended complaint that would purportedly plead facts sufficient to render the fraudulent transfer domestic in nature. CEVA will oppose this motion. Tax Proceedings CEVA is involved in tax audits in various jurisdictions relating to the normal conduct of its business. While the outcome of these audits is uncertain and can lead to litigation involving material amounts, CEVA believes that it has provided for all probable and estimable tax liabilities arising from the normal course of business, and CEVA therefore does not expect any liability arising from these audits to have a material impact on its results of operations, liquidity, capital resources, or financial position. Other Proceedings From time to time, CEVA is involved in a variety of legal proceedings and disputes arising in the ordinary course of business. For example, CEVA has been and is currently subject to numerous labor and employment proceedings and disputes in both Italy and Brazil alleging various causes of action and raising other legal challenges to CEVA’s labor and employment practices. Such proceedings sometimes include individual claims and lawsuits, disputes with unions, class action claims, and governmental or quasi-governmental investigations. While the outcome of these legal proceedings is sometimes uncertain and may not be capable of estimation, CEVA believes that resolution of these matters and the incurrence of their related costs and expenses should not have a material adverse effect on CEVA’s results of operations, liquidity, capital resources, or financial position.
14. Related Party Transactions
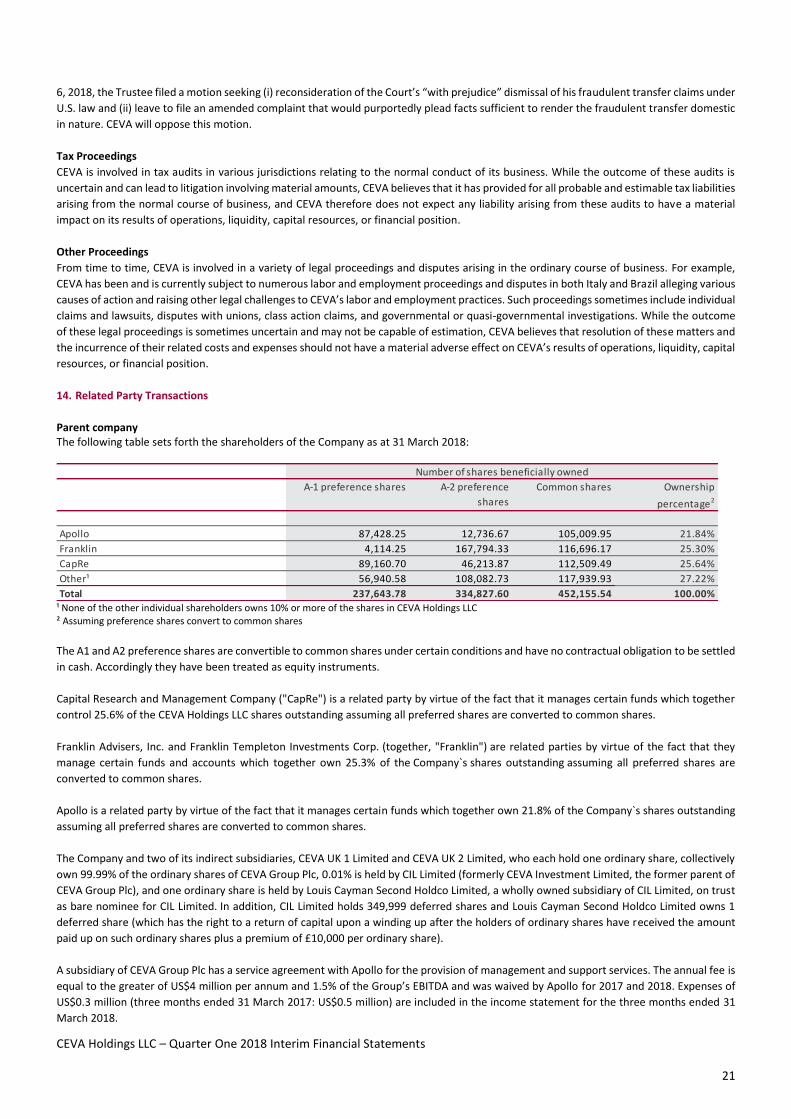
Parent company The following table sets forth the shareholders of the Company as at 31 March 2018:
¹ None of the other individual shareholders owns 10% or more of the shares in CEVA Holdings LLC ² Assuming preference shares convert to common shares The A1 and A2 preference shares are convertible to common shares under certain conditions and have no contractual obligation to be settled in cash. Accordingly they have been treated as equity instruments. Capital Research and Management Company ("CapRe") is a related party by virtue of the fact that it manages certain funds which together control 25.6% of the CEVA Holdings LLC shares outstanding assuming all preferred shares are converted to common shares. Franklin Advisers, Inc. and Franklin Templeton Investments Corp. (together, "Franklin") are related parties by virtue of the fact that they manage certain funds and accounts which together own 25.3% of the Company`s shares outstanding assuming all preferred shares are converted to common shares. Apollo is a related party by virtue of the fact that it manages certain funds which together own 21.8% of the Company`s shares outstanding assuming all preferred shares are converted to common shares. The Company and two of its indirect subsidiaries, CEVA UK 1 Limited and CEVA UK 2 Limited, who each hold one ordinary share, collectively own 99.99% of the ordinary shares of CEVA Group Plc, 0.01% is held by CIL Limited (formerly CEVA Investment Limited, the former parent of CEVA Group Plc), and one ordinary share is held by Louis Cayman Second Holdco Limited, a wholly owned subsidiary of CIL Limited, on trust as bare nominee for CIL Limited. In addition, CIL Limited holds 349,999 deferred shares and Louis Cayman Second Holdco Limited owns 1 deferred share (which has the right to a return of capital upon a winding up after the holders of ordinary shares have received the amount paid up on such ordinary shares plus a premium of £10,000 per ordinary share). A subsidiary of CEVA Group Plc has a service agreement with Apollo for the provision of management and support services. The annual fee is equal to the greater of US$4 million per annum and 1.5% of the Group’s EBITDA and was waived by Apollo for 2017 and 2018. Expenses of US$0.3 million (three months ended 31 March 2017: US$0.5 million) are included in the income statement for the three months ended 31 March 2018.
A-1 preference shares A-2 preference shares
Common shares Ownership percentage2
Apollo 87,428.25 12,736.67 105,009.95 21.84%Franklin 4,114.25 167,794.33 116,696.17 25.30%CapRe 89,160.70 46,213.87 112,509.49 25.64%Other¹ 56,940.58 108,082.73 117,939.93 27.22%Total 237,643.78 334,827.60 452,155.54 100.00%
Number of shares beneficially owned

CEVA Holdings LLC – Quarter One 2018 Interim Financial Statements
22
Marvin Schlanger, Michael Jupiter, Samuel Feinstein, Thomas White, Xavier Urbain, Alan Miller, Emanuel Pearlman, John Smith and Thomas Stallkamp are Managers of the Company. The Managers of the Company are also the Directors of CEVA Group Plc. Marvin Schlanger, Michael Jupiter and Samuel Feinstein also hold senior positions at Apollo or Apollo portfolio companies. Apollo appointed Marvin Schlanger, Michael Jupiter, Samuel Feinstein, Thomas White and Xavier Urbain as Managers of the Company. CapRe and Franklin jointly appointed Alan Miller, Emanuel Pearlman, John Smith and Thomas Stallkamp as Managers of the Company. At 31 March 2018 the Group has booked a net payable, which is disputed (see note 12 “Contingencies”) by the Group both as to validity and amount, to CIL Limited, amounting to US$16 million (31 December 2017: US$15 million). This mainly relates to intercompany cash pooling arrangements and is included within trade and other payables in the Condensed Consolidated Balance Sheet. CIL Limited was the former parent company of CEVA Group Plc and was placed in liquidation proceedings in connection with the Recapitalization. CIL Limited is involved in an official liquidation proceeding in the Republic of the Cayman Islands and a Chapter 7 proceeding in the Bankruptcy Court for the Southern District of New York. CEVA has agreed to indemnify Managers employed by or affiliated with Apollo for losses relating to the services contemplated by the management agreement with Apollo. In addition, the LLC Agreement indemnifies the Managers and Apollo, Franklin and CapRe against losses arising from services contemplated by the agreement. Trading transactions During the three months ended 31 March 2017 and 2018, Group entities entered into the following trading transactions with related parties that are not members of the Group:
CEVA has a trading relationship with three customers, McGraw-Hill, Rackspace and Aleris Corporation which are owned by Apollo Investment Corp, an affiliate of Apollo. The value of the transactions with these customers is immaterial. Financing From time to time, depending upon market, pricing and other conditions, as well as CEVA’s cash balances and liquidity, CEVA or its affiliates, including CEVA’s shareholders or funds affiliated with or managed by CEVA’s shareholders, may seek to acquire or sell notes or other indebtedness of CEVA through open market purchases or sales, privately negotiated transactions, tender offers, redemption or otherwise, upon such terms and at such prices as CEVA or its affiliates may determine (or as may be provided for in the indentures or other documents governing the Notes or other indebtedness), for cash or other consideration. In addition, CEVA has considered and will continue to evaluate potential transactions to reduce CEVA’s outstanding debt (such as debt for equity exchanges and other similar transactions), to extend its debt maturities or enter into alternative financing arrangements, as well as potential transactions pursuant to which third parties, including CEVA’s shareholders or funds affiliated with or managed by CEVA’s shareholders may provide equity or debt financing to CEVA (which may include a potential public offering of equity on a European Stock Exchange and redomiciliation) or otherwise engage in transactions to provide liquidity to CEVA. There can be no assurance as to which, if any, of these alternatives or combinations thereof CEVA or its affiliates may choose to pursue in the future as the pursuit of any alternative will depend upon numerous factors such as market conditions, CEVA’s financial performance and the limitations applicable to such transactions under its financing documents. At 31 March 2018 funds managed by CapRe held US$47.7 million par value of CEVA’s term loan due 2021, US$6.3 million par value of CEVA’s 7.00% First Lien Senior Secured Notes due 2021 and US$18.5 million par value of CEVA`s 9.0% Senior Secured Notes due to 2021. At 31 March 2018, funds and accounts managed by Franklin Advisers, Inc. and Franklin Templeton Investment Corporation held approximately (i) US$178.8 million of CEVA's 9% First Lien Senior Secured Notes due 2020, (ii) US$24.3 million of CEVA's Tranche B Pre-Funded Letter of Credit, (iii) US$24.6 million of CEVA’s 6.50% Dutch BV Term Loan, (iv) US$4.3 million of CEVA’s 6.50% Canadian Term Loan, and (v) US$34.0 million of CEVA’s 6.50% US Term Loan.
THREE MONTHS ENDED 31 MARCH THREE MONTHS ENDED 31 MARCH$ millions 2018 2017
Sales of goodsPurchases of
goods Sales of goodsPurchases of
goods
Joint ventures 2 3 1 2
AS AT 31 MARCH AS AT 31 MARCH$ millions 2018 2017
Amounts owed by related parties
Amounts owed to related parties
Amounts owed by related parties
Amounts owed to related parties
Joint ventures 4 3 4 -
CEVA Holdings LLC – Quarter One 2018 Interim Financial Statements
23
Ultimate controlling party The ultimate controlling party of the Company is Apollo in accordance with the terms of the LLC Agreement. Other related party transactions The total expense for share options granted to key management personnel for the three months ended 31 March 2018 was US$3 million (31 March 2017: US$3 million).
15. Seasonality of Operations
Our intra-year results are subject to seasonal trends, due to holiday seasons, consumer demand, weather and other intra-year variations. The Freight Management results are generally stronger in the final two quarters of the calendar year, which is partly offset by Contract Logistics results, which are often weighted to the first half of the year. The Company’s seasonality is also offset to some extent by its sector diversification, as well as the global nature of its business; however, overall the Company’s first quarter is generally the weakest.
16. Events After Balance Sheet Date
On 19 April 2018, CEVA Group Plc, a wholly owned subsidiary, entered into a commitment letter with Deutsche Bank AG for a new term loan facility of US$250 million, which would replace the existing US$250 million Revolver that matures in March 2019. CEVA Group Plc has sole discretion until 19 July 2018 to decide whether it will exercise its right under the commitment letter to enter into the new term loan. If exercised, the new term loan would have a term of 5 years. CEVA Group plc has terminated the commitment letter on 8 May 2018 following the successful IPO (see below). On 3 May 2018, CEVA Holdings LLC and CEVA Logistics AG (previously a newly formed wholly owned subsidiary incorporated in Switzerland) legally merged, with CEVA Logistics AG being the surviving entity. On 8 May 2018, CEVA Logistics AG successfully completed an IPO on the SIX Swiss stock exchange with gross proceeds of CHF 821 million (excluding the over-allotment option) and has issued 29,856,537 new registered shares with a nominal value of CHF 0.10 each. At the same time, CEVA Logistics AG sold mandatory convertible securities to CMA-CGM Group in the amount of CHF 379 million equivalent to US$ 379 million, pursuant to the terms of a subscription agreement between CEVA Logistics AG and CMA-CGM Group dated 19 April, 2018. These convertible securities, which will be accounted for as equity, will mandatorily convert into 13,779,827 new registered shares once certain regulatory approvals are obtained. The gross proceeds from the two operations amount to CHF 1.2 billion and could further increase if the over-allotment is exercised by the Bookrunners. The net proceeds will be primarily be used to repay debt. On 8 May 2018, CEVA Logistics AG received 5,402 million newly issued shares from CEVA Group Plc for the settlement of the intercompany 10% Second Lien PIK Notes which have been extinguished.