Page 1
TWO SECTIONS —SECTION TWO
CHRONICLE BUILDING
RAILWAY EARNINGSSECTION OF THE
COMMERCIAL & FINANCIAL CHRONICLECopyrighted in 1912 according to Act of Congress, by WILLIAM B. DANA COMPANY, in office of Librarian of Congress, Washington, D. C.
VOL. 94. NEW YORK, MAY 18, 1912. NO. 2447.
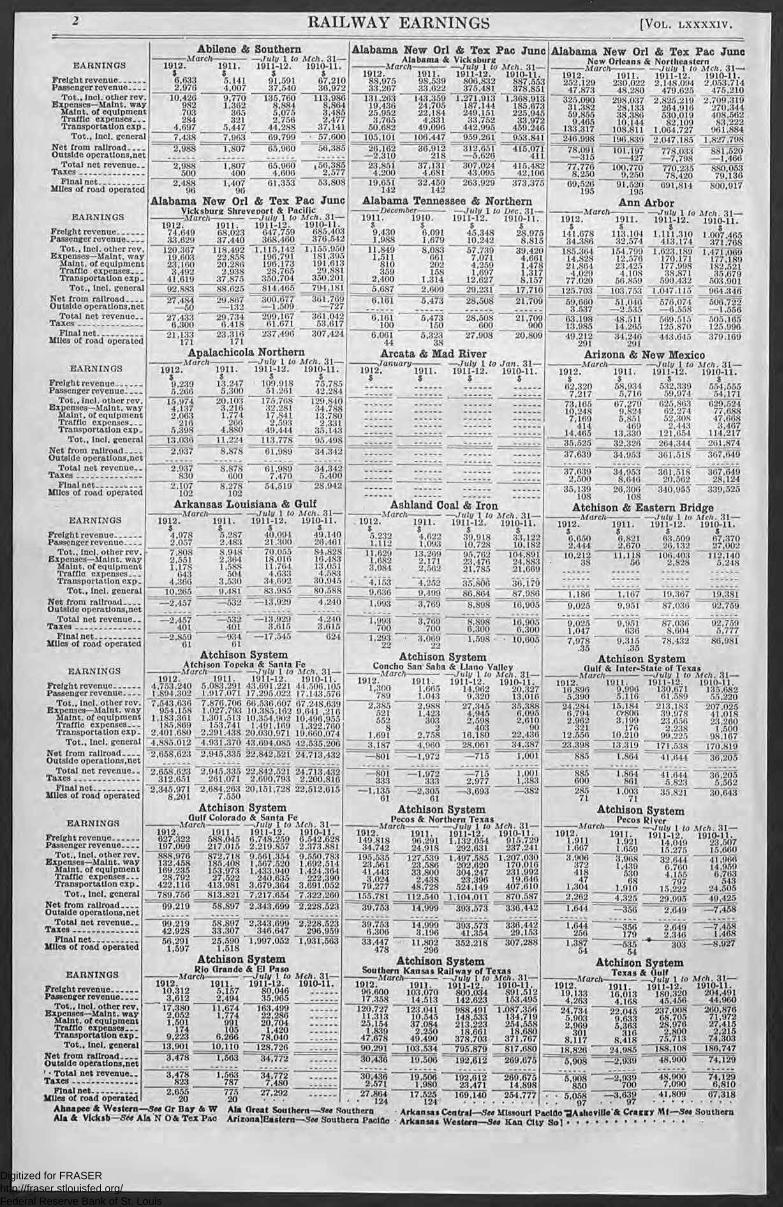
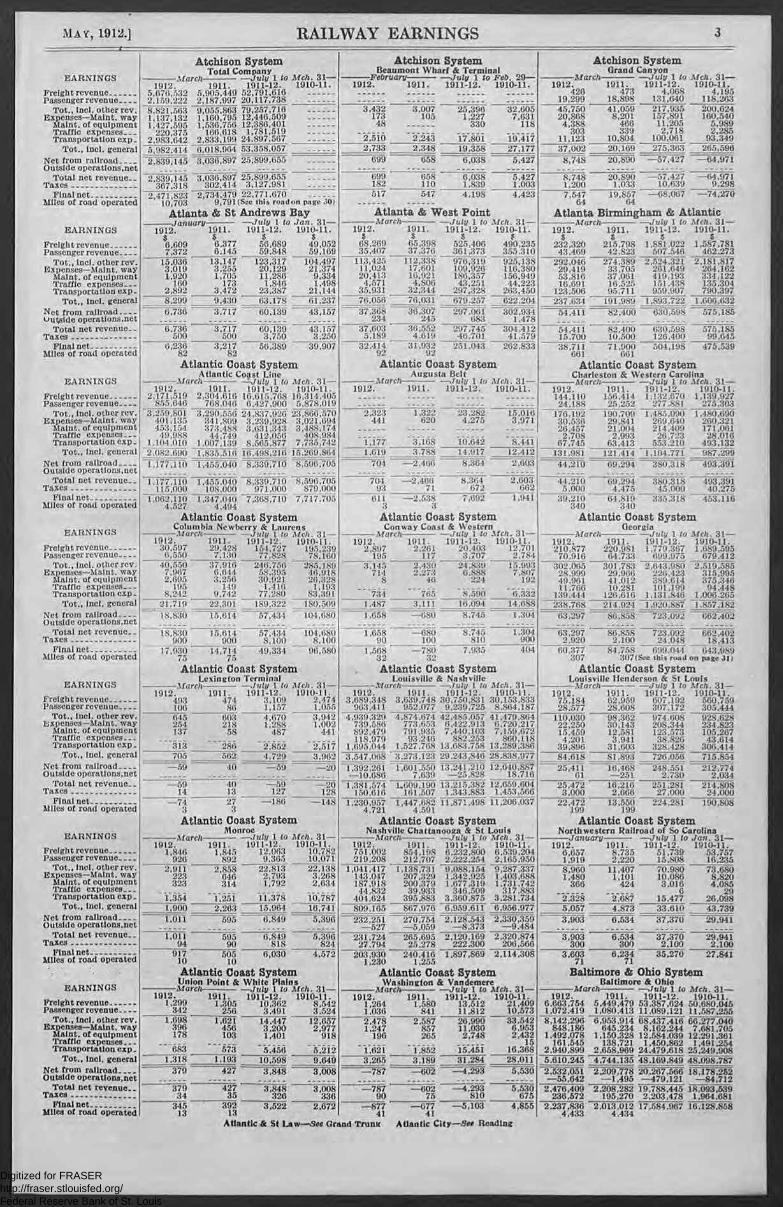
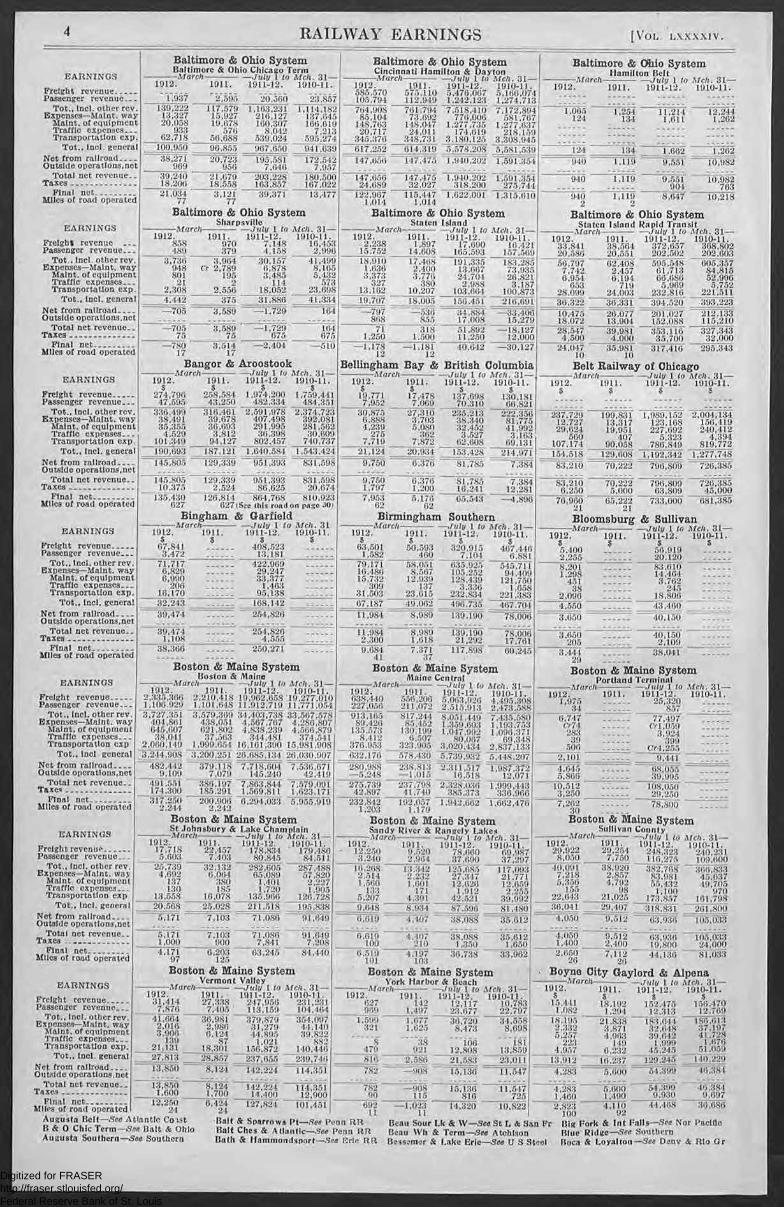
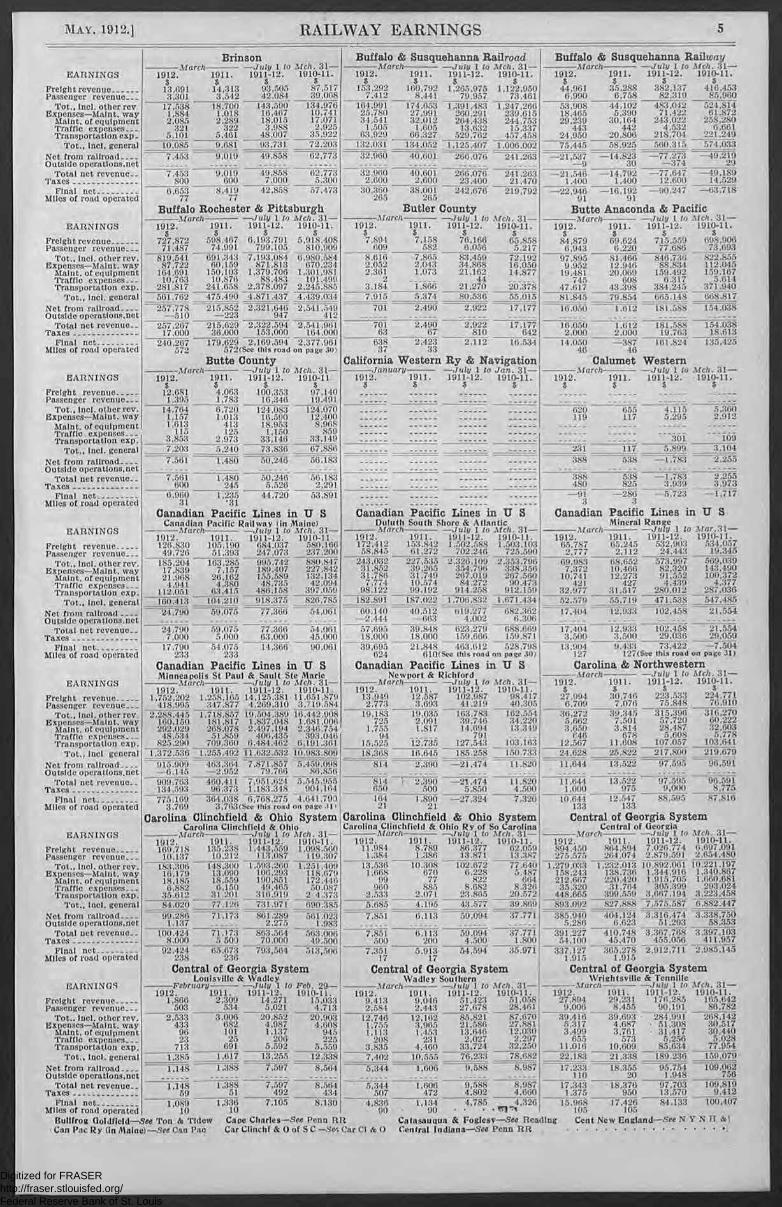
THIS entire publication is devoted to a presentation of the reports of earnings and ex-penses of United States railroads for the latest month (March) and for the fiscalyear to date, including said month. The table embraces every steam operatingrailroad in the country which is obliged to make monthly reports to the Inter-State
Commerce Commission at Washington. Up to Jan. 1 1912 the Commission required monthlyreturns from every road, no matter how small its earnings. Since that date roads earningless than $100,000 per annum have been relieved from the necessity of filing returns exceptwhere they are controlled by other common carriers. Leased lines not operating theirown road do not make returns.
Sworn Returns. The figures are a transcript of the sworn returns on file at Washington.They have the further advantage of uniformity of method and classi-
fication. Every company is obliged to make up its return on the same basis and in thesame way as every other company.
Earnings The "Chronicle" has always made a specialty of weekly and monthly
Our Specialty, reports of railroad earnings, and for over forty-five years its weeklyand monthly summaries have been everywhere accepted as authorita-
tive. The present publication is in continuation of this work and to aid the Inter-StateCommerce Commission in .the one direction in which lies its chief usefulness—the fieldof publicity.
These Inter-State Commerce returns also make it possible for us toFull Details. present full details of both the revenues and the expenses. Besidesreporting total gross earnings, we show separately the passenger and the freight revenues.In the case of the expenditures we report the outlays for both maintenance of way andmaintenance of equipment as well as the traffic and transportation expenses. We alsoshow the net revenue from outside operations. Lastly, we give the taxes and the miles ofroad on which earnings are based.
•
Cents Discarded. The cents we have necessarily been obliged to discard altogether, andif in any case the results should happen to vary a dollar, one way or:the
other, from exact proof, the reason for the variance will be found in that circumstance.
Company Returns To make this publication absolutely complete we add several pages at
Also Given, the end to show also the figures issued by the companies themselves,where they are Made up on a basis different from that of the Commerce
returns, or where they give fixed charges in addition to earnings, or where they have aseparate and distinct fiscal year.
The matter contained in this extra and novel publication is entirelyFormer Returns additional to the comprehensive reports of earnings we furnish in theto be Continued. "Chronicle" from week to week. All the returns of the leading roads,and also all weekly figures of gross earnings, are printed regularly and promptly in the"Chronicle" as, soon as received. But in addition we issue once a month—say about the20th—this special publication, furnishing a sort of compendium of earnings in which we bringtogether all the returns for the latest month for which the statistics are available.
Only for As in the case of our numerous other Supplements or "Sections," all of
cri bers. which are expensive publications, the "Railway Earnings Section"Su bs will be furnished only to "Chronicle" subscribers. These will receiveit free of charge, one copy going with each subscription. It will be impossible to obtaincopies in any other way, as none will be printed for general sale.
WILLIAM B. DANA COMPANY, PUBLISHERS,NEW YORK
FRONT, PINE & DEPEYSTER STREETS
Digitized for FRASER http://fraser.stlouisfed.org/ Federal Reserve Bank of St. Louis
Page 2
2 RAILWAY EARNINGS [VoL. Lxxxxiv.
EARNINGS
Freight revenue Passenger revenue_ _ _ _
Tot., incl. other rev.Expenses-Maint. wayMaint. of equipmentTraffic expenses_ _ _Transportation exp
Tot., incl. generalNet from railroad_ _ _ _Outside operations.net
Total net revenue Taxes
Final net Miles of road operated
EARNINGS
Freight revenue Passenger revenue.._- _
Tot., incl. other rev.Expenses-Maint. wayMaint. of equipmentTraffic expenses_ _ _Transportation exp _
Tot.. incl. generalNet from railroad_ _ _ _Outside operations,net
Total net revenue_ _Taxes
Final net Miles of road operated
EARNINGS
Freight revenue Passenger revenue_ _ - -
Tot., incl. other rev.Expenses-Maint. way
Maint. of equipmentTraffic
expenses_. _
Transportation exp _Tot., incl. general
Net from railroad_ _ _ _Outside operations.netTotal net revenue
Taxes Final net
Miles of road operated
EARNINGS
Freight revenue Passenger revenue_ _ _ _
Tot., incl. other rev.Expenses-Maint. way
Maint. of equipmentTraffic expenses_ _ _Transportation exp..
Tot., incl. generalNet from railroad_ _ _ _Outside operations.netTotal net revenue.
TaxesFinal net
Miles of road operated
EARNINGS
Freight revenue Passenger revenue_ _ _ _
Tot., incl. other rev.Expenses-Maint. way
Maint. of equipmentTraffic expenses_ _ _Transportation exp _
Tot., incl. general
Net from railroad_ _Outside operations.net
Total net revenue Taxes
Final net Miles of road operated
EARNINGS
Freight revenue Passenger revenue_ _ _ _
Tot., incl. other rev.Expenses-Maint. way
/faint. of equipmentTraffic expenses_ Transportation exp _
Tot., incl. generalNet from railroad _ _ _ _Outside operations.net
Total net revenue Taxes
Final net Miles of road operated
EARNINGS
Freight revenue Passenger revenue_ _ _ _
Tot.. Incl. other rev.Expenses-Maint. way
Maint. of equipmentTraffic expenses_ _ _Transportation exp _
Tot.. Incl. generalNet from raliroad.._ _ _Outside operations,net• Total net revenue__Taxes
Final net 2,655Miles of road operated 20Ahnapee & Western-See Gr Bay 8. WAla & Vicksb -See Ala N 04.1"elVio
Abilene & Southern March *lulu 1 to Mch. 31-1912. 1911. 1911-12. 1910-11.
6,633 5,141 91,591 67,2102,976 4,007 37,540 36,97210,426
982703284
4,697
9,7701,362365321
5,447
135,7608,8845,0752,75644,288
113,9868,8643,4852,477
37,1417,438 7,963 69,799 • 57,600
2,988 1,807 65,960 56,385
2,988 1,807 65.960 156,385500 400 4,606 2,577
2,488 1,407 61,353 53,80896 96
Alabama New On & Tex Pac JunoVicksburg Shreveport & Pacific March July 1 to Mch. 31-
1912. 1911. 1911-12. 1910-11.74,649 68,023 647,759 685,40333,629 37,440 368,460 376,542
120,36719,60323,1603,492
41,619
118,492 1,115,142 1,155,95022,858 196,791 181,39520,286 196,173 191,6132,938 28,765 29,881
37,875 350,704 350,201
92,883 88,625 814,465 794,181
27,484 29,867 300,677 361,769-132 -1.509. -727-50
27,433 29,734 299.167 361,0426,300 6,418 61,671 53,61721,133 23,316 237,496 307,424
171 171Apalachicola Northern
March July 1 to Mch. 31-1912. 1911. 1911-12. 1910-11.$ $ $ $9,239 13,247 109,918 75,7855,266 5,300 51.261 42,28415,9744,1372,063216
5,398
20,1033,2161,774266
4.880
175,76832,28117,8412,593
49,444
129,84034,78813,7802,331
35,14313,036 11,224 113,778 95,4982,937 8,878 61,989 34,342
2,937 8,878 61,989 34,342830 600 7,470 5,400
2,107 8,278 54,519 28,942102 102
Arkansas Louisiana & Gulf March July 1 to Mch. 31-1912. 1911. 1911-12. 1910-11.* b $ $4,978 5,287 40,094 49,1402,057 2,483 21.300 26,4617,808 8,948 70,055 84,8282,551 2,364 18,016 16,4831,178 1,588 11,764 13,051643 504 4,633 4,583
4,366 3,530 34.692 30.94510.265 9,481 83,985 80,588
-2,457 --532 --13,929 4,240
-2,457 -532 -13,929 4,240401 401 3,615 3,615
-2,859 -934 -17,545 62461 61
Atchison SystemAtchison Topeka & Santa Fe
March j4111 1 to Mch. 31-1912. 1911. 1911-12. 1910-11.
4,753,240 5,083,291 43,691,221 44,506,1051,894,302 1.917.071 17,295,022 17,143,5767,543,636 7,876,706 66,536,607 67.248,639954,158 1,027,793 10,385,162 9,641 ,216
1,183,361 1,301,513 10,354,902 10,496,955185,869 153,741 1,491,169 1,322,760
2,401,680 2,291.438 20,030,971 19,660,0744,885,012 4,931,370 43,694.085 42,535,2062,658,623 2,945,335 22.842,521 24,713,432
2,658,623 2,945,335 22,842,521 24,713,432312,651 261,071 2,690,793 2,200,816
2,345,971 2,684,263 20,151,728 22,512,6158,201 7,550
Atchison SystemGulf Colorado & Santa Fe
March July 1 to Mch. 311912. 1911. 1911-12. 1910-11.627,322 588,045 6,748,259 6,542,628197.099 217,015 2,219,857 2,373,881888,976 872,718 9,561,354 9,550,783132,458 185,408 1,567,520 1,692,514169.235 153,973 1.433,940 1,424,36428,792 27,522 240,635 222,390
422.116 413,981 3,679,364 3,691,052789,756 813,821 7.217.654 7,322,26099,219 58,897 2,343,699 2,228,523
99,219 58,897 2,343,699 2,228.52342,928 33,307 346,647 296,95956,291 25,590 1,997,052 1,931.5631,597 1,518
Atchison SystemRio Grande & El Paso
March July 1 to Mch. 311912. 1911. 1911-12. 1910-11.10,312 5,157 80,0463.612 2,494 35,965 17,380 11,674 163,4992,052 1,774 22,2861,501 991 20,704174 105 1,420
9,223 6,266 78,040 13.901 10.110 128,7263,478 1,563 34,772
3,478 1,563 34,772823 787 7,480
Alabama New On & Tex Pao JunoAlabama & Vicksburg
March July 1 to Mch. 31-1912. 1911. 1911-12. 1910-11.88,975 98,539 806,832 887.55333,267 33,622 375,481 378,851131,26319,43625,9523,765
50,682
143.359 1,271,913 1,368,91324,705 187,144 185,67322.184 249,151 225.9454,331 33,752 33,972
49,096 442,995 459.246105,101 106.447 959,261 953,84126,162 36,912 312,651 415,071-2,310 218 -5,626 41123,851 37,131 307.024 415.4824,200 4.681 43.095 42.10619,651 32,450 263,929 373,375
142 142
Alabama Tennessee & Northern December July 1 to Dec. 311911. 1910. 1911-12. 1910-11.$ $ $ $9,430 6,091 45,348 28,9751.988 1,679 10,242 8,815
11,8491.511810359
2,400
8.083661202158
1,314
57.7397,0714,2591,697
12,6275,687 2.609 29,2310.161 5,473 28,508
6,161 5,473 28.508100 150 600
39,4204,6611,4781,3178,157
Alabama New On & Tex Pac JunoNew Orleans & Northeastern
March- July 1 to Mch. 31-1912. 1911. 1911-12. 1910-11.252,129 230,022 2,148,094 2,053.71447,873 48,280 479,625 475,210
325,090 298,037 2,825,219 2,709,31931,382 28,133 264,916 270,34459,855 38,386 530,019 408.5629,465 10,144 82,109 83,222
133,317 108,811 1,064,727 961,884246,998 196,83g 2,047,185 1,827,79878,091 101,197 778,033 881,520--315 --427 --7,798 --1,46677,776 100,770 770,235 880,0538,250 9,250 78,420 79,136
69,526 91,520 691,814 800,917195 195
Ann Arbor March July 1 to Mch. 31-1912. 1911. 1911-12. 1910-11.$ $ $ $
141.678 113,104 1,111,310 1.007.46534.386 32,574 413,174 371,768185,36414,82821,8644,029
77,020
154.799 1,623.189 1,471,06912,576 170.171 177,18923,425 177,998 182,5214,108 38,871 35,679
56,859 590,432 503.90117,710 125.703 103.753 1.047.115 964.34621,709
21.709900
6,061 5,323 27,908 20,80944 38
Arcata & Mad River-January -July 1 to Jan. 31-
1912. 1911. 1911-12. 1910-11.* $ I $
Ashland Coal & I'llm March July 1 to Mch. 31, 1912. 1911. 1911-12. 1910-11.
$ $ $ $5,232 4,622 39,918 33,1221,112 1,093 10,728 10,182
11,629 13,2691,682 2,1713,084 . 2,562
• 4,153 4,2529,636 9,4991,993 3,769
1,993 3,769700 700
95,76223,47621,785
104,89124,88321,669
35,806 36,17986,864 87,9868,898 16,905
8,898 16,9056,300 6,300
1,293 • 3,069 1,598 • • 10,60522 22
AtchisonConcho San Saba March 1912. 1911.
1,300 1,665789 1,043
2,3855215528
1,691
2,9881,4233032
2,7583.187 4,960--801 --1,972
--801 --1,972333 333
System& Llano ValleyJuly 1 to Mch. 31-1911-12. 1910-11.
14,962 20,3279,320 13,016
27,3454,9452,598403
16,180
35,3886,0952,610
9022,436
28,061 34,387
59,660 51,046 576,074 506,7223.537 -2.535 -6.558 -1.556
63,198 48,511 569,515 505.16513,985 14,265 125,870 125,996 49,212 34,246 443,645 379.169
291 - 291
Arizona & New Mexico March July 1 to Mch. 31-1912. 1911. 1911-12. 1910-11.$ $ $ $62,320 58,934 532,339 554,5557,217 5,716 59,974 54,171
73,165 67,279 625,863 629,52410,248 9,824 62,274 77,6887,169 5,851 52,308 47,668414 469 2,443 3,467
14,465 13,330 121,654 114,21735,525 32,326 264,344 261,87437,639 34,953 361,518 367,649
37,639 34,953 361,518 367.6492,500 8,646 20,562 28,124
35,139 26,306 340,955 339,525108 108
Atchison & Eastern Bridge March-- July 1 to Mch. 31-1912. 1911. 1911-12. 1910-11.$ $ $ $6,650 6,821 63,509 67,3702,444 2,670 26,132 27,00210,212 11,118 106,403 112,140
• 38 56 2,828 5,248
1,186 1,167 19,367 19,3819,025 9,951 87,036 92,759
9,025 9,951 87,036 92,7591,047 636 8,604 5,7777,978 9,315 78,432 86,981
.35 .35Atchison System
Gulf & Inter-State of Texas March July 1 to Mch. 31-1912. 1911. 1911-12. 1910-11.16,896 9,996 130,671 135,6825,390 5,116 61,589 55,220
24,284 15,184 213,183 207,0256,794 Cr806 39,978 41,0182,962 3,199 23,656 23,260321 176 2,238 1,500
12.556 10,210 99,225 98,16723,398 13,319 171,538 170,819
-715 1,001
-715 1,0012,977 1,383
-4,135 --2,305 --3,69361 61
Atchison SystemPecos & Northern Texas
March July 1 to Mch. 311912. 1911. 1911-12. 1910-11.140,818 96,291 1,132,054 015,72934.742 24,918 292,631 237,241195,53523,56141,4433,024
79,277155.781
-382
127,539 1,497.585 1,207,03023,586 202,620 170,01633,800 304,247 231,9922,438 23,396 19.646
48.728 524,149 407,610112.540 1,104.011 870.587
39,753 14,999
39.753 14,9996,306 3,196
393,573 336,442
393,573 336,44241.354 29,153
33,447 11,802 352,218 307,288478 296
Atchison SystemSouthern Kansas Railway of TexasMarch- -July 1 to Mch. 31-
1912. 1911. 1911-12. 1910-11.96,600 103,070 800,034 891,51217,358 14,513 142.623 153,495
120,72711.31325,1541,839
47,678
123,04110,54537.0842.250
49.49090.291 103.53430.436 19,506
988.491 1.087,356148.533 134,719213,223 254,55818,661 18,680
378,703 371,767795,879 817.680192,612 269.675
885 1,864 41,644 36,205
885 1.864 41,644 36,205600 861 5.823 5,56227185 1,003 35,821
71
Atchison SystemPecos River
30,643
March-------- --July 1 to Mch. 31-
1912,611 1911. 1911-12. 1910.11.
1 1,667
1,921 14,049 23,5071.659 15.275 15,660
3,006 3,968 32,644 41,966372 1,439 6,760 14,959418 530 4,155 6,76347 68 797 543
1,304 1,910 15.222 24,5052,262 4,325 29,995 49,4251,644 -356 2,649 -7,458
1,644 -356 2,649 -7,458256 179 2,346 1.468
1,387 -535 ........._______
303 -8.92754 54
Atchison SystemTexas & Gulf
March July 1 to Mch. 31-1911. 1911-12. 1910-11.
10,133 16,013 180,320 204,4914,263 4,168 45,456 44,96024,734 22,045 237,008 260,8765,903 9,633 68,705 71,9722,969 5,363 28,976 27,415301 316 2,800 2,215
8,117 8.418 75.713 74.303
18,826 24,985 188,108 186,747
5,908 -2,939 48,900 74,129
30,436 19,506 192.612 269.675 5,908 -2,939 48,900 74,129 2,571 1.980 23.471 14.898 850 700 7.090 6,810
775 27,292 27.864 17,525 169,140 254,777 • • 5,058 -3,639 41,809 67,318• • 124 124 97 • • 97
Ala Great Southern-See Southern Arkansas Central-See MIsionr1 1 aolao.;ASheVilleilit Craggy hit--See SouthernAtizoaarnastern--See Southern Pacillo Arkansas Western-See Kan City So]
Digitized for FRASER http://fraser.stlouisfed.org/ Federal Reserve Bank of St. Louis
Page 3
MAT, 1912.] RAILWAY EARNINGS 3
EARNINGS
Freight revenue Passenger revenue__ _ _
Tot., incl. other rev.Expenses-Maint. wayMaint. of equipmentTraffic expenses__ _Transportation exp _
Tot., incl. generalNet from railroad.. _Outside operations,net
Total net revenue....Taxes
Final net Miles of road operated
EARNINGS
Freight revenue Passenger revenue_ _
Tot., incl. other rev.Expenses-Maint. wayMaint. of equipmentTraffic
expenses_. -
Transportation exp -Tot., incl. general
Net from railroad _ _ _uuolde operations,net
Total net revenue_ _Taxes
Final net Miles of road operated
•
EARNINGS
Freight revenue Passenger revenue__
Tot., incl. other rev.Expenses-Maint. wayMaint. of equipmentTraffic expenses_ _ _Transportation exp..
Tot., incl. general
Net from railroad _ _ _Outside operations,netTotal net revenue
Taxes Final net
Miles of road operated
EARNINGS
Freight revenue Passenger revenue_ _
Tot., Incl. other rev.Expenses-Maint. wayMaint. of equipmentTraffic expenses-- -Transportation exp _
Tot., incl. general
Net from railroad_ __ _Outside operations,netTotal net revenue_ _
Taxes Final net
Miles of road operated
EARNINGS
Freight revenue Passenger revenue..__ _Tot., inol. other rev.
Expenses-Maint; wayMaint. of equipmentTraffic expenses__ _Transportation exp _
Tot., Incl. general
Net from railroad_ _ _Outside operations,net
Total net revenue_Taxes
Final net Miles of road operated
EARNINGS
Freight revenue Passenger revenue_ _ _
Tot., Incl. other rev.Expenses-Maint. wayMaint. of equipmentTraffic
expenses_. _
Transportation exp.Tot., Incl. general
Net from railroad..Outside operations,net
Total net revenue_ _Taxes
Final net Miles of road operated
• .• •
EARNINGS
Freight revenue Passenger revenue- -
Tot.. Incl. other rev.Expenses-Maint. way
Maint. of equipmentTraffic expenses.._ -Transportation exp.
Tot.. incl. generalNet from railroad_ _ _ _Outside operations,net
Total net revenue_Taxes
Final net Mlles of road operated
Atchison SystemTotal Company
March-- -July 1 to MM. 311912. 1911. 1911-12. 1910-11.
5,676,532 5,905,449 52,791,6162,159,222 2,187,997 20,117,738 8,821,563 9,055,863 79,257,7161,137,132 1,160,795 12,446,5091,427,595 1,536,756 12,386,401220,375 166,618 1,781,519
2,983,642 2,833,199 24,897,567 5,982,414 6,018,964 53,358,057
2,839,145 3,036,897 25;899,655
2,839,145 3,036,897 25,899,655367,318 302,414 3,127,981
2,471,823 2,734,479 22,771,67010,703 9,791(Seethisroadon page 30)
Atlanta & St Andrews Bay January- -July 110 Jan. 311912. 1911. 1911-12. 1910-11.$ $ $(3,609 $6,377 56,689 49,0527,372 6,145 59,848 59,16915,0363,0191,920160
2,892
13,1473,2551,705173
3.472
123,31720,12911,2861,846
23,387
Atchison SystemBeaumont Wharf & Terminal
February -July 1 to Feb. 29-1912. 1911. 1911-12. 1910-11.
3,43217348
3,007 25.396105 1,227
330
32,6057,631118
2,510 2,243 17,801 19,4172,733 2,348 19,358 27,177699 658 6,038 5,427
699 658 ' 6,038182 110 1.839517 547 4,198
5,4271,0034,423
Atlanta & West Point March- July 1 to Mch. 31-1912. 1911. 1911-12. 1910-11.$ $ $ $68,269 65,398 525,406 490,23535,407 37,376 361,373 355.310
104,49721,3749,3341,498
21,1448,299 9,430 63,178 61,237
11.3,42511,02420,4134,57135,931
112,33817,60116,9214,80632,344
976,319109,926186,35743,251297,328
925,138116,380156,94944,223263,450
7(3,056 76,031 679.257 622,2046.736 3,717 60,139 43,157
6.736 3,717 60,139 43,157500 500 3,750 3,250
6,236 3,217 56,389 39,90782 82Atlantic Coast System
Atlantic Coast Line----March 'July 1 to Mch. 31
1912. 1911. 1911-12. 1910-11.2,171,519 2,304.616 16,615.768 16,314,405855,646 768,046 6.427,900 5,878,019
3,259,801 3,290,556 24,837,926 23,866,570401,135 341,809 3,239,928 3,021,694453,154 373,488 3,631,343 3,488,17449,988 44,749 412,056 408,984
1,104,010 1,007,139 8,565,877 7,735,7422,082,690 1,835,516 16,498,216 15,269,864
Atchison SystemGrand Canyon
March- -July 1 to Mch. 31-1912. 1911. 1911-12. 1910-11.
426 473 4,068 4,19519,299 18,898 131,640 118,26345,750 41,059 217,935 200,62420,868 8,201 157,891 160,5404,388 466 11,205 5,989303 339 2,718 2,285
11,123 10,804 100,061 93,34937,002 20,169 275,363 265,596
8,748 20,890 -57,427 -64.971
8,748 20,890 -57,427 -64,9711,200 1,033 10,639 9,2987,547 19,857 --68,067 --74,270
64 64
37,368 36,307 297,061 302,934234 245 683 1,478
37,603 36.552 297.745 304.4125.189 4.619 46.701 41,57932.414 31,932 251.043 262,833
92 92
Atlantic Coast SystemAugusta Belt
March -July 1 to Mch. 31-1912. 1911. 1911-12. 1910-11.
2,323 1,322 23.282 15,016441 620 4,275 3,971
1,177,110 1,455,040 8,339,710 8,596,705
1,177,110 1,455,040 8,339,710 8,596,705115,000 108,000 971,000 879,000
1,177 3,168 10.642 8,4411,619 3,788 14,917 12,412
704 -2,466 8,364 2,603
704 -2,466 8,364 2,60393 71 672 662
1,062,110 1,347,040 7,368,710 7,717,7054,527 4,494
Atlantic Coast SystemColumbia Newberry & Laurens March July 1 to Mch. 31-1912. 1911. 1911-12. 1910-11.30,597 29,428 154,727 195,2396,550 7,130 77,828 78,16040,550 37,9167,967 6,6442,695 3,256195 149
8,242 9,742
246,75658,39530,9211,416
77,280
611 -2,538 7,692 1,9413 3
Atlantic Coast SystemConway Coast & Western
March- July 1 to Mch. 31-1912. 1911. 1911-12. 1910-11.
2,897 2,261 20,403 12,701195 117 3.707 2,784
285,18946,91826,3281,193
83,39121,719 22,301 189,322 180,509
18,830 15,614 57434 104,680
18,830 15,614 57,434 104,680900 900 8,100 8,100
17,930 14,714 •19,334 96,58075 75
Atlantic Coast SystemLexington Terminal
March July 1 to MM. 31-1912. 1911. 1911-12. 1910-11.
493 474 3,109 2,474106 86 1,157 1,055645254137
60321858
4,6701,288487
3,9421,002441
313 286 2,852 2,517
3.1457148
2,4302.273
46
24,8396,888224
15.9937.807192
734 765 8.500 6.3321,487 3.111 16.094 14,688
1,658 -680 8,745 1.304
1,658 -680 8,745 1,30490 100 810 900
1,568 -78032 32
Atlantic Coast SystemLouisville & Nashville
March July 1 to Mch. 31-1912. 1911. 1911-12. 1910-11.
3.689,348 3.639,748 30,750,831 30,153,833963.411 952,077 9,239,725 8.864,187
7,935 404
4,939,329 4.874,674 42.485,057 41,479,864739,586 773,653 6,422,913 6,720,217892,479 791,935 7,440,103 7,159.672118,979 93,246 882,253 860,118
1,695,044 1.527,768 13,683.758 13,280,386705 562 4,729 3,962 3,547,068 3,273,123 29.243.846 28,838,977-59 40 --59
--59 4014 13
-20
-59 -20127 128
--74 27 -1863 3
Atlantic Coast SystemMonroe
March July 1 to Mch. 31-1912. 1911. 1911-12. 1910-11.
1,846 1,845 12,063 10,782926 892 9,365 10,071
2,911 2,858 22,813 22,138223 646 2,793 3,268323 314 1,792 2,634
1,354 1,251 11,378 10,7871,900 2,263 15,964 16,7411,011 595 6,849 5,396
1,011 595 6,849 5,39694 90 818 824917 505 6,03010 10
Atlantic Coast SystemUnion Point & White Plains
March July 1 to Mch. 31-1912. 1911. 1911-12. 1910-11.
1,299 1,305 10,362 8,542342 256 3,491 3,524
1,392,261 1,601,550 13,241,210 12.640,887-10,686 7,639 -25,828 18,7161,381,574 1.609,190 13,215,382 12,659,604150,616 161,507 1.343,883 1,453,566
-148 1,230,957 1,117,682 11,871,498 11,206,0374,721 4,591
Atlantic Coast SystemNashville Chattanooga & St Louis March- July 1 VI Mai. 31-1912. 1911. 1911-12. 1910-11.751,002 854.198 6,232,800 6,539,204219,208 212,707 2.222,254 2,165,950
1,041,417 1,138,731 9,088.154 9.287,337143,047 207,329 1.342.925 1,403,688187,918 200,379 1,677.319 1,731,74244,832 39,933 346,509 317,883
404,624 395,883 3.360.875 3,281.734809,165 867,976 6,959,611 6.956,977
232,251 270,754 2,128,543 2,330.359-527 -5,059 -8,373 -9.484
231,724 265,695 2,120.169 2.320,87427,794 25,278 222.300 206.566
4,572 203,930 240,416 1,897,869 2,114,3081,230 1,255
Atlantic Coast SystemWashington & Vandemere
March- -July 1 to MM. 311912. 1911. 1911-12. 1910-11.
1,264 1.580 13,512 21,4091,036 841 11.812 10.573
1,698 1,621 14,447 12,657 2,478 2,587 26,990 33,542396 456 3,200 2,977 1,247 857 11,030 6,953178 103 1,401 918 196 265 2,748 2,432
15683 573 5.456 5,212 1,621 1,852 15,451 16,368
1,318 1.193 10,598 9,649 3,265 3.189 31.284 28,011 379 427 3.848 3,008 -787 -602 -4.293 5,530
379 427 3,848 3,008 -787 -602 -4,293 5,53034 35 326 336 90 75 810 675345 392 3,522 2,672 --877 --677 --5.103 4,85513 13 41 41
Atlantic & St Law--See Grand Truffle Atlantic City-See Reading
Atlanta Birmingham & Atlantic March -July 1 to Mch. 31-1912. 1911. 1911-12. 1910-11.$ $ $ $
232,320 215,798 1,881,022 1.587,78143,469 42,823 507,546 462,273292,046 274,389 2,524.321 2,181.81729,419 33,705 261.649 264.16253,816 37.061 419,193 334,12216,691 16,525 151,438 135.304
123,506 95,711 959,907 790.397237,634 191,989 1.893.722 1.606,632
54,411 82,400 630,598 575,185
54,411 82,400 630,598 575,18515,700 10,500 126,400 99,64538,711 71,900 504,198 475,539
661 661
Atlantic Coast SystemCharleston & Western Carolina March,- -July 1 to Mch. 31-
1912. 1911. 1911-12. 1910-11.144,110 156.414 1,132,670 1,139,92724,188 25,252 277,881 275,303
176,192 190,709 1.485,090 1.480,69030,536 29,841 269,640 260.32126,457 21,004 214,409 171,0612,708 2,993 26,723 28,016
67.745 63,413 553.210 493,132131.981 121,414 1,104,771 987.299
44,210 69.294 380,318 493,391
44,210 69,294 380,318 493,3915.000 4.475 45,000 40,27539,210 64,819 335,318 453,116
340 340
Atlantic Coast SystemGeorgia
--March- July 1 to Mch. 31-1912. 1911. 1911-12. 1910-11.210,877 220,981 1,779,367 1,689.59570,916 64,733 699,975 679,412302,065 301,783 2,643,980 2,519.58528,999 29,966 226.423 315,99549,961 41,012 389,614 375.34611,766 10,281 101,199 94,448
139.444 126,616 1,131.846 1,006.265238.768 214,924 1,920,887 1,857,18263,297 86.858 723,092 662.402
63.297 86,858 723.092 662,4022,920 2,100 24,048 18.413
60,377 84,758 699,044 643,989307 307(See this road on page 31)Atlantic Coast System
Louisville Henderson & St Louis March -July 1 to Melt. 31-
1912. 1911. 1911-12. 1910-11.75,184 62,959 607,192 560,75928,577 28,608 307,172 305,444110.030 98,362 974.608 928,62822,250 30,143 208,344 234,82315,459 12,581 123,573 105.2674,201 3,941 38.826 43,614
39.896 31.603 328.428 306,41484,618 81.893 726,056 715,85425,411 16,468 248,551 212.774
61 -251 2,730 2.03425,472 16,216 251,281 214,8083,000 2,666 27.000 24.00022,472 13,550 224,281 190,808
199 199
Atlantic Coast SystemNorthwestern Railroad of So Carolina January
1912. 1911.-July 1 to Jan. 31-1911-12. 1910-11.
6.657 8,735 51,739 53.7571,919 2,220 15.808 16,2358.960 11,407 70.980 73.6801,480 1,101 10.086 8.820366 424 3,016 4,085
6 292,328 2,687 15.477 26.0985,057 4.873 33.610 43,739
3,903 6,534 37,370 29.941
3.903 6,534 37.370 29.941300 300 2,100 2.100
3.603 6.234 35,270 27.84171 71
Baltimore & Ohio System• Baltimore & Ohio Marde*--- -July 1 to Melt. 31-1912. 1911. 1911-12. 1910-11.
6,663,754 5,449,479 53,387,624 50,680.0451,072,419 1,080,413 11,089,121 11.587,2558,142,296 6,953,914 68,437.416 66,277.040848,186 645,234 8,162,244 7,681,705
1.492,078 1,150,328 12,584.039 12,291.361161,545 138,721 1.450.862 1,491.254
2.940.899 2.658,969 24.479.618 25.219.9085.610.245 4,744.135 48.169.849 48.098.7872,532,051 2.209,778 20,267.566 18.178,252-55,642 -1,495 -479.121 -84,7122,476,409 2,208,282 19,788.445 18.093,539236,572 195.270 2,203.478 1J964.681
2.237,836 2,013.012 17,584,967 16,128.8584433 4,434
Digitized for FRASER http://fraser.stlouisfed.org/ Federal Reserve Bank of St. Louis
Page 4
4 RAILWAY EARNINGS Lxxxxiv.
EARNINGS
Freight revenue Passenger revenue_ _ _
Tot., incl, other rev.Expenses-Maint. wayMaint. of equipmentTraffic expenses__ _Transportation exp.
Tot.. incl. general
Net from railroad.. _ _ _Outside operations, net
Total net revenue Taxes
Final net Mlles of road operated
EARNINGS
Freight revenue ___Passenger revenue.._ _
Tot., incl. other rev.Expenses-Maint. wayMaint. of equipmentTraffic expenses.._ _Transportation exp.
Tot., incl. generalNet from railroad_ _ _ _Outside operations.netTotal net revenue_ _
Taxes Final net
Miles of road operated
EARNINGS
Freight revenue Passenger revenue.._ -
Tot., incl. other rev.Expenses-Maint. way
Maint. of equipmentTraffic expenses.._ _Transportation exp.
Tot., incl. general
Net from railroad..__ _Outside operations.netTotal net revenue.. _
Taxes Final net
Mlles of road operated
EARNINGS
Freight revenue Passenger revenue.. Tot.. Incl. other rev.
Expenses-Maint. wayMaint. of equipmentTraffic expenses.._ _Transportation exp.
Tot., Incl. generalNet from railroad_ _ _ _Outside operations.netTotal net revenue
Taxes Final net
Miles of road operated
EARNINGS
Freight revenue Passenger revenue..
Tot., incl. other rev.Expenses-Maint. wayMaint. of equipmentTraffic expenses.._ _Transportation cap
Tot.. Inol generalNet from rallroad.._ _Outside operationsmetTotal net revenue.._
Taxes Final net
Miles of road operated
EARNINGS
Freight revenue Passenger revenue ._ _
Tot., incl. other rev.Expenses-Maint. wayMaint. of equipmentTraffic expenses.._ _Transportation expTot.. Incl. general
Net from railroad.. _ _ _Outside operations.netTotal net revenue.._
Taxes Final net
Miles of road operated
EARNINGS
Freight revenue Passenger revenue__ _Tot., Incl. other rev. 41,664
Expenses-Maint. way 2,016Maint. of equipment 3,906Traffic
expenses..- _ 139
Transportation exp. 21,131 Tot.. inol. general 27,813
Net from railroad........ 13,850Outside operations,netTotal net revenue.... 13,850
Taxes 1,600Final net 12,250
Miles of road operated 24Augusta Belt-See Atlantic CoistB & 0 Chic Term-See Balt & OhioAugusta Southern-See Southern
Baltimore & Ohio SystemBaltimore & Ohio Chicago Term
March July 1 to Mch. 31-1912. 1911. 191142. 1910-11.
1,937 2,595 20,560 23,857139,222 117,579 1,163,231 1,114.18213,327 15,927 216,127 137,64520.058 19,678 160,307 166,619
933 576 8,042 7,21362,718 56,688 539,024 595,274100.950 96,855 967,650 941,63938,271 20,723 195,581 172,542
969 956 7,646 7,95739,240 21,679 203,228 180,50018,206 18,558 163,857 167,02221,034 3,121 39,371 13,477
77 77
Baltimore & Ohio SystemSharpsville
March July 1 to Mch. 31-1912. 1911. 1911-12. 1910-11.
858 970 7,148 16,453489 379 4,158 2,996
3,736 3,964 30.157 41,499948 Cr 2,789 6,878 8,165801 195 3,485 5,43221 2 114 573
2,308 2,556 18,052 23,6984,442 375 31,886 41,334
-705 3,589 --1,729 164
Baltimore & Ohio SystemCincinnati Hamilton & Dayton
March July 1 to Mch. 31-1912. 1911. 1911-12. 1910-11.585,570 575,110 5.476,067 5,166.074105,794 112,949 1,242,123 1,274.713764,90885,104148,76320,717
345,376
761,794 7,518.410 7.172,89473,692 776,006 581,767148,047 1,277,735 1,277,63724,011 174,619 218,159
348,731 3,180,125 3,308,945617,252 614,319 5,578,208 5,581.539147,656 147,475 1,940,202 1,591.354
147,656 147,475 1,940,202 1,591,35424,689 32.027 318,200 275.744122,967 115,447 1,622,001 1.315,610
1.014 1,014
Baltimore & Ohio SystemStaten Island
March- -July 1 to Mch. 31-1912. 1911. 1911-12. 1910-11.
2,238 1,897 17,690 16.42115,752 14,608 165,593 157,56918,910 17,468 191,335 183,2851.636 2,400 13,667 73,9353,373 3,776 24,704 26,821327 380 2,988 3,187
13,162 10,207 103,664 100,87319,707 18,005 156,451 216,691-797 -536868 855
-705 3,589 --1,729 16475 75 675 675
-780 3,514 -2,404 -51017 17Bangor & Aroostook
March -July 1 to Mch. 31-1912. 1911. 1911-12. 1910-11.$ $ $ $
274,796 258,584 1,974,200 1,759,44147,595- 43.250 482,334 484,351336,499 316,461 2,591,978 2.374,72338.491 39,678 407,498 392,08135,355 36,693 291,995 281.5624,529 3,812 36,398 30,609
101,349 94,127 802,457 740,737190,693 187,121 1,640,584 1,543,424
71 3181,250 1.500
Baltimore & Ohio SystemHamilton Belt
March July 1 to Mch. 31-1912. 1911. 1911-12. 1910-11.
1,065 1,254 11,214 12,244124 134 1,611 1,262
124 134 1,662 1,262940 1,119 9,551 10,982
940 1,119 9.551 10,982904 763
940 1,119 8,647 10,2182 2
Baltimore & Ohio SystemStaten Island Rapid Transit
March- -July 1 to Mch. 31-1912. 1911. 1911-12. 1910-11.33,841 38,564 372,657 368,80220,586 20,551 202,502 202,60356,7977,7426,954653
28,099
34,884 --33,40617,008 15,27951,892 -18,12711.250 12,000
--1,178 --1,181 40,642 ---30,12712 12
Bellingham Bay & British Columbia March July 1 to Mch. 31-
1912. 1911. 1911-12. 1910-11.$ $ $ $19,771 17,478 137,698 130,1817,952 7,069 70,310 66,821
30,8756,8884,239275
7,719
27,3103,7035,080362
7,872
235,21338,34032,4523.527
62,608
222,35681,77541,9923,163
69,13121,124 20,934 153,428 214.971
145,805 129,339 951,393 831,598
145,805 129,339 951,393 831.59810,375 2,524 86,625 20.674
135,430 126,814 864,768 810,923627 627 (Sc this road on page 30)
Bingham & Garfield- March July 1 to Mch. 31
1912. 1911. 1911-12. 1910-11.
67,841 408,5233,472 13,18171,7176,8296,990206
16,170
9,750 6,376
62,4082,4576,194719
24,003
595,54861,71366,6865,969
232,816
605,35784,81552,9965,752
221,51136,322 36,331 394,520 393.22310,475 26,077 201,027 212,13318,072 13,904 152,088 115,21028,547 39,981 353,116 327,3434,500 4,000 35,700 32,00024.047 35,981 317,416 295,343
10 lo
Belt Railway of Chicago March July 1 to Mch. 31-1912. 1911. 1911-12. 1910-11.; $ $ $
237,72912,72729,624
560107,174
199,831 1,989,152 2,004,13413,317 123,168 156,41919,951 227,692 240,412
407 5,323 4,39490,058 786,849 819,772
154,518 129,608 1,192,342 1,277,74881,785 7,384
9,750 6,376 81,785 7,3841,797 '1,200 16,241 12,2817,953 5,176 65,543 -4,896
62 62
Birmingham Southern -March -July 1 to Mch. 31-1912. 1911. 1911-12. 1910-11.$ $ $ $63,501 50.593 320.915 467.4461,582 460 7,104 6,881
422,96929,24733,3771,403
95,13832,243 168,142
79,171 58,051 635,925 545,71116,486 8.567 105,252 94.40915,732 12.939 128,439 121,750
309 137 3,336 1,65831,503 23,615 232,834 221,38367,187 49.062 496.735 467.704
39,474 254,826
39,474 254,8261,108 4,555
38,366 250,271
11,984 8,989 139,190 78,006
11,984 8.989 139.190 78,0062,300 1,618 21.292 17,761
13(xstcul & Maine SystemBoston & Maine
-March -July 1 to Mch. 31-1912. 1911. 1911-12. 1910-11.
2,335,366 2.210,418 19,962,658 '19,277,0101,106.929 1,101,648 11.912,719 11,771,0543,727,351 3,579,369 34.403,738 33,567,578404,861 438,051 4,567,767 4,286,807645,607 621,802 4,838,239 4,566,87938,041 37,563 344,481 374,541
2,060,149 1,999,654 16,161,390 15,981,9083.244,908 3.200,251 26,685,134 26,030,907482,442 379,118 7,718,604 7,536,671
9,109 7,079 145,240 42,419491,551174,300
386.197 7,863,844 7,579,091185,291 1,569,811 1,623,171
317,250 200,906 6,294,033 5,955,9192,244 2,242
Boston & Maine SystemSt Johnsbury & Lake Champlain March July 110 Mch. 31-1912. 1911. 1911-12. .1910-11.17,718 22,457 178,834 179,4865,603 7,403 80,845 84,51125,7394,692137130
13,55820,568
32,1326,064380185
16,07825,028
5,171 7,103
282,60565,0891,4011,720
135,966
9,684 7,371 117,898 60,24541 37
Boston & Maine SystemMaine Central
March July 1 to Mch. 31-1912. 1911. 1911-12. 1910-11.638,440 556,206 5,063,926 4,495,308227,056 211,072 2,515,913 2,473.588913,16589,426135,5738,412
376,953
817,244 8,051,449 7,435,58085,452 1,359,603 1,193,753130,199 1,047,992 1,090,3716,507 80,067 69,348
323.905 3,020,434 2,837.133
83,210 70,222 796,809 726,385
83,210 70,222 796,809 726,3856,250 5,000 63,809 45,00076,960 65,222 733,000 681,385
21 21
Bloomsburg & Sullivan March -July 1 to Mch. 31-1912. 1911. 1911-12. 1910-11.$ $ $ $5.400 56.9192,255 20,120 8,201 83.6101,298 14,464451 3,76238 245
2,096 18,8064,550 43,460
3.650 40,150
3,650 40,150205 2,109
3,444 38,04129
Boston & Maine SystemPortland Terminal
March July 1 to Mch. 31-1912. 1911. 1911-12. 1910-11.
1,975 25,32034 857
6,747Cr7428339506
632,176 578,430 5.739,932 5,448,207280,988 238,813 2.311,517 1,987,372-6,248 -1,015- 16,518 12,071
77,497Cr1,0593,924399
Cr4,2552,101 9,4414,645 68,0555,866 39,995
275,739 237,798 2.328,036 1,999,44342,897 41,740 385,373 336,966232,842 192.057 1,942,662 1,662.476
1,203 1,179
Boston & Maine System .Sandy River & Rangely Lakes March-- -July 1 to Mch. 31-1912. 1911. 1911-12. 1910-11.12,250 9.520 78,660 69,9873,240 2,964 37,690 37,297
287,48857,8202,2271,905
126,728211,518 195.83871,086 91,649
5,171 7,103 71,086 91,6491,000 900 7,841 7,208
16,2682.5141,560133
5,207
13,3422,2321,601171
4,391
125,68527,34712,6261,912
42,521
117,09321,77112,0592,255
39,9929,648 8.934 87.596 81.4806,619 4,407 38.088 35,612
6,619 4.407 38,088 35,612100 210 1,350 1.650
4,171 6,203 63,245 84,44097 125
Boston & Maine SystemVermont Valley
March July 1 to Mch. 31-1912. 1911. 1911-12. 1910-11.31,414 27,338 247,956 231,2317,870 7,405 ' 113,159 104,464
36,9812,9866,124
8718,301
379,87931,27944,8951,021
156,872
354,09744,14039,822
882140,446
28,857 237,655 239,746
6,519 4.197 36.738 33,962101 103
Boston & Maine SystemYork Harbor & Beach
March July 1 to Mch. 31-1912. 1911. 1911-12. 1910-11.
627 142 12,117 10,783969 1.497 23,677 22,797
1,599 1,677 36,720 34,558321 1,625 8,473 8,698
8 38 106 181479 921 12,808 13,859816 2,586 21,583 23,011
8,124 142,224 114,351 782 -908 15,136 11,547
10,512 108,0503,250 29,2507,262 78,800
30Boston & Maine System
Sullivan CountyMarch July 1 to Mch. 31-
1912. 1011. 1911-12. 1910-11.29,922 29.254 248,323 240,2318,050 7,750 116,275 109,600
40,0917,2185,356155
22,643
38,9202,8574,792
9821,025
382,76883,98155,4321,100
173,857
366,83345,63749,705
970161,798
36,041 29,407 318,831 261,8004,050 9,512 63,936 105,033
4,050 9,512 63,936 105,0331,400 2,400 19,800 24,0002,650 7,112 44,136 81,033
26 26Boyne City Gaylord & Alpena
_---Alarc14 July 1 to AIM. 31-1912. 1911. 1011-12. 1910-11.$ b $ $15,441 18,192 152.475 156,4701,082 1,294 12,313 12,769
18,195 21,838 183,644 186,6132,332 3,871 32,648 37,1975,257 4,963 39,042 41,728223 149 1,999 1.676
4,957 6,232 45,245 51.05913,912 16.237 129,245 140,229
4,283 5,600 54.399 46,384
8,124 142,224 114,351 782 -908 15,136 11,547 4,283 5.600 54,3991,700 14,400 12,900 90 115 816 725 1,460 1,490 9.9306,424 127,824 101,451 692 -1,023 14,320 10,822 2,823 4,110 44,468 36,686
24 11 11 100 92Bait & Sparrows Pt-See Penn RR Beau Sour Lk & NV-See St L & San Fr Big Fork & Int Falls-See Nor PaeltloBait Ches & Atlantic-See Penn RR Beau ‘Vh & Term-See Atchison Blue Ridge-See SouthernBath & tfammondsport-See Erie RR Bessemer & Lake Erie-See U S Steel Boca & Loyal ton -See De.nv & Rio Or
40,3849.697
Digitized for FRASER http://fraser.stlouisfed.org/ Federal Reserve Bank of St. Louis
Page 5
MAY. 1912.] RAILWAY EARNINGS
EARNINGS
Freight revenue Passenger revenue.._ _
Tot., incl. other revExpenses-Maint. wayMaint. of equipmentTraffic expenses.. Transportation exp_
Tot., Incl. general
Net from rallroad.._Outside operations,netTotal net revenue-
Taxes Final net
Miles of road operated
EARNINGS
Freight revenue Passenger revenue
Tot., incl. other rev.Expenses-Maint. wayMaint. of equipmentTraffic expenses . - -Transportation exp.
Tot., incl. general
Net from railroad_ _Outside operations,net
Total net revenue Taxes
Final net Miles of road operated
EARNINGS
Freight revenue Passenger revenue.-
Tot., Inel. other rev.Expenses-Maint. wayMaint. of equipmentTraffic expenses.._ _Transportation exp.
Tot., incl. general
Net from railroad.. _ _ _Outside operations,net
Total net revenue Taxes
Final net Miles of road operated
EARNINGS
Freight revenue Passenger revenue.._ _
Tot., Incl. other rev.Expenses-Maint. way
Maint. of equipmentTraffic expenses......Transportation exp.
Tot., Incl. generalNet from railroad _ _Outside operations,net
Total net revenue....Taxes
Final net Miles of road operated
EARNINGS
Freight revenue Passenger revenue
Tot., Incl. other rev.Expenses-Maint. way
Maint. of equipmentTraffic expenses......Transportation exp.
Tot., inel general
Net from railroad......_Outside operations,net
Total net revenue Taxes
Final net Miles of road operated
EARNINGS
Freight revenue Passenger revenue.._ _
Tot., Incl. other rev.Expenses-Maint. wayMaint. of equipmentTraffic expenses... _Transportation exp.
Tot.. Incl. general
Net from railroad...Outside operatIons,netTotal net revenue_
Taxes Final net
Miles of road operated
EARNINGS
Freight revenue Passenger revenue
Tot.. incl. other rev.Expenses-Maint. way
Maint. of equipmentTraffic) expenses__ _Transportation exp.
Tot., incl. general
Net from railroad. Outside operations,net
Total net revenue...Taxes
Final net Mlles of road operated
Bullfrog Goldfield-SeeCan Pac RY (in Mainc)-See
BrinsonMarch July 1 to Mch. 31-
Buffalo & Susquehanna RailroadMarch-
Buffalo & Susquehanna Railway
1912. 1911. 1911-12. 1910-11.$ $ $ $13,691 14,313 93,505 87,5173,301 3,542 42,084 39,008
-July 1 to Mch. 311912. 1911. 1911-12. 1910-11.$ $ $ s
153,292 160,792 1,265,975 1,122,9507,412 8,441 79,957 73,461
March July 1 to Mch. 31-1912. 1911. 1911-12. 1910-11.$ $ $ $44,961 35,288 382,137 416,4536,990 6.758 82,319 85,960
17,538 18,700 143,590 134,9761,884 1,018 16,467 10,7412,085 2,289 18,015 17,071321 322 3,988 2,925
5,101 5,461 48,007 35,922
164,991 174,653 1,391,483 1,247,26625,780 27,991 260,291 239,61534,541 32,012 264,438 244.7531,505 1,605 13,632 15,337
63,929 66,327 529,762 457,458
53,908 44,102 483,042' 524,81418,465 5,390 71,422 61,87229,239 30,164 243,022 258,280
443 442 4,532 6,66124,950 20,806 218,704 221,249
10,085 9,681 93,731 72,203 132,031 134,052 1,125.407 1,006.002 75,445 58.925 560,315 574,033
7,453 9,019 49,858 62,77-3- 32,960 40,601 266.076 241,263 -21,537 -14,823 --77,273 -49.21930 --374 29
7,453 9,019 49,858 62,773800 600 7,000 5.300
32,960 40,601 266,076 241,2632,600 2,600 23,400 21,470
--21,546 -14.792 --77,647 -49.1891,400 1,400 12,600 14,529
6,653 8,419 42,858 57,47377 77
Buffalo Rochester & Pittsburgh-July 1 to Mch. 31-
30,360 38,001 242,676 219,792265 265
Butler CountyMarch July 1
--22,946 --16,192 --90,247 -63,71891 91
Butte Anaconda & Pacific-March
1912. 1911. 1911-12. 1910-11.$ $ $
72$7,872 598,467 6,193,791 5,918,40871,487 74,991 799,105 810,909
to Mch. 311912. 1911. 1911-12. 1910-11.$ $ $ $
7 7,158 76,166 65.858
183 582 6,056 5,217
March-- -July 1 to Arch. 31-1912. 1911. 1911-12. 1910-11.
84,879 69,624 715,559 698,9066,943 6,220 77,686 73,693
819,541 691,343 7,193,0g 6,980,58487,722 60,159 871,813 670,234164,691 150,103 1,379,706 1,301,98110,763 10,876 88,483 101,499
281,817 241,658 2,378,097 2,245,885
8,616 • 7,865 83,459 72.1922,052 2,043 34,868 16,0502,361 1,073 21,162 14,877
2 443,184 1,866 21,270 20,378
97,895 81,466 846.736 822.8559.952 12.946 88.834 112.04519.481 20.069 159.492 159.167
745 608 6.317 5.61447.617 43.398 384.245 371.940
561,762 475,490 4,871.437 4,439.034 7,915 5,374 80.536 55,015 81.845 79.854 665.148 668.817
------ 257,778 215,852 2,321,646 2,541,549-510 -223 947 412
701 2,490 2,922 17,177 16.050 1.612 181.588 154.038
257,267 215,629 2,322,594 2,541,96117,000 36,000 153,000 164.000
701 2,490 2,922 17,17763 67" 810 642
16.050 1.612 181,588 154.0382.000 2.000 19,763 18,613
240,267 179,629 2,169,594 2,377,961572 572(See this road on page .36)
Butte CountyJuly 1 to Mch. 31-
638 2,423 2,112 16,53437 33
California Western Ry & NavigationJanuary
14,050 -387 161,824 135,42546 46
Calumet Western-March
1912. 1911. 1911-12. 1910-11.
12,681 4,063 100,353 97,1401,395 1,783 16,346 19,491
-July 1 to Jan. 311912. 1911. 1911-12. 1910-11.$ $ $ $
March--- -July 1 to Mch. 31-1912. 1911. 1911-12. 1910-11.
$
14,764 6,720 124,083 124,0701,157 1,013 16,590 12,4001,613 413 18,953 8,968115 125 1,150 859
3,853 2,973 33,146 33,149
620 655 4,115 5,360119 117 5,295 2.912
301 1097,203 5,240 73,836 67,886 231 117 5,899 3.104
7,561 1,480 50,246 56,183 388 538 --1.783 2.255
7,561 1,480 50,246 56,183600 245 5,526 2,291
388 538 --1,783 2,255480 825 3,939 3,973
6,960 1,235 44,720 53,89131 '31
Canadian Pacific Lines in U SCanadian Pacific Railway (in Maine)
March
Canadian Pacific Lines in U SDuluth South Shore & AtlanticMarch
-91. -286 -5,723 -1,7173 3
Canadian Pacific Lines in U SMineral Range
July 1 to Mar.31-- -July 1 to Mch. 311912. 1911. 1911-12. 1910-11.126,830 105,190 684,037 580,16649,726 51,393 247,073 237,200
July 1 to Mch. 31-1912. 1911. 1911-12. 1910-11.172,412 153,842 1,502,588 1,503.10358,845 61,272 702,246 725.590
March1912. 1911. 1911-12. 1910-11.65,787 65,245 532,903 534,0572,777 2,112 24,443 19,345
185,204 163,285 995,742 880,84717,839 7,157 189,407 227,84221,968 26,162 155,589 132,1344,041 4,380 48,735 42,094
112,051 63,415 486,158 397,059
243,032 227,535 2,326,109 2,353.79631,852 39,265 354,796 338,35631,786 31,749 267.019 267,5607,774 10.574 84.272 90.473
98.122 99.192 914.258 912.159
69,983 68,652 573,997 569,0397,372 10,466 82,320 143,49010,741 12,273 91,552 100,372
421 427 4,439 4,37732,977 31,517 280,012 287,036
160,413 104,210 918,375 826,785 182.891 187,022 1,706,832 1,671.434 52.579 55,719 471,538 547,485
24,790 59,075 77,366 54,061 60,140 40,512 619,277 682,362-2,444 -663 4,002 6.306
17,404 12,933 102.458 21,554
24,790 59,075 77,366 54,0617,000 5,000 63,000 45,000
57,695 39,848 623,279 688,66918,000 18,000 159,666 159,871
17,404 12,933 102,458 ' 21,5543,500 3,500 29,036 29,059
17,790 54,075 14,366 00,061233 233
Canadian Pacific Lines in U SMinneapolis St Paul & Sault Ste Marie
Mch.
39,695 21,848 463,612 528.798624 610(See this road on page 30)
Canadian Pacific Lines in U SNewport & Richford
March 1 Mch. 31-
13,904 9,433 73,422 --7,504127 127(See this road on page 31)
Carolina & Northwestern---March--- -July 1 to Arch. 31-
1912. 1911. 1911-12. 1910-11.$ $ $ a27,994 30,746 223,533 224,7716,709 7.076 75,848. 76.910
March July 1 to 31-1912. 1911. 1911-12. 1910-11.
1,752,202 1,258,165 14,125,381.11.651,879418.995 347,877 4,269,310 3.719,584
July to1912. 1911. 1911-12. 1910-11.13,949 12,587 102,987 98.4172,773 3,693 • 41,219 40,305
2,288,445 1.718,857 19,504,389 16,442,908160,150 181,817 1,837,048 1,681,006292,029 268,078 2,497,194 2,346,75448,534 .51,859 406,435 393,046
825,290 709,360 6,484.462 6,191.361
19,183 19,035 163.783 162,554725 2,091 39,746 34,220
1,755 . 1,817 14.694 13,34994 791
15,525 12,735 127,543 103,163
36,272 39,345 315,396 316,2705,662 7,501 57,720 60,2223,650 3,814 28,487 32,603646 678 5,608 5,778
12,567 11.608 107,057 103,6411,372,536 1.255.492 11,632,532 10,983.809 18,368 16,645 185,258 150.733 24,628 25.822 217,800 219,679
915,909 163,364 7,871,857 5,459,098-6,145 -2,952 79,766 . 86,856
814 2,390 -21,474 11,820 11,644 13,52-2 97,50- 96,591
909,763 460,411 7,951,624 5,545,955134,593 96,373 1,183,348 904,164
814 1 2,390 -21,474 11,820650 500 5.850 4,500
11,644 13,522 97,595 96,5911,000 975 9.000 8,775
-775,169 364,038 6,768,275 4.641,7903.769 3,763(See this road on page 311
Carolina Olinchfield & Ohio SystemCarolina Clinchfield & OhioMarch- -.July 1 to Arch. 31
164 1.890 -27,324 7,32021 21
Carolina Clinchfield & Ohio SystemCarolina Clinchfield 6c Ohio Ry of So Carolina
March July 1 to Mch.
10,644 12,547 88,595 87,816133 133
Central of Georgia SystemCentral of Georgia
1 to Mch. 31-1912. 1011. 1911-12. 1910-11.169,718 1351238 1,443,559 1,098,56010,137 10,212 113.087 119,307
31-1912. 1911. 1911-12. 1910-11.11.984 8.789 86.377 62,0591.384 1.386 13.871 13.387
March July1912. 1911. 1911-12. 1910-11.894,450 864.894 7,026,774 6.697,091275,575 264,074 2.879,591 2,654,480
183,306 148.300 1,593,260 1,251,40916,179 13,090 106,293 118,67918,185 18,559 190,851 172,4466,882 6,150 49,465 50.08735.612 31.201 316.919 2 4.373
13,536 10.308 102.672 77.6401,668 670 6,228 5.487
99 77 822 664960 885 8.682 8.326
2.533 2.071 23.865 20.572
1,279.033 1,232,013 10.892,061 10,221,197158,243 138,736 1,344,916 1,340,867212,667 220,420 1,915,705 1,660,68135,320 31,764 305,399 293,024
448.665 399,559 3,667,194 3,223,458
84.020 77.126 731.971 690.385 5.685 4.195 43.577 39,869 893.092 827,888 7,575,587 6,882.447
99.286 71.173 861.289 561.0211.137 2.275 1.983
7,851 6.113 59,094 37.771 •
385,940 404,124 3,316,474 3,338,7505,286 6,623 51.293 58,353
100.424 71.17-3 863.564 563.0068.000 5 500 70.000 49.500
7.851 6.113 59,094 37.771500 200 4.500 1.800
391,227 410,748 3,367,768 3,397,10354,100 45.470 455.056 411,957
92.424 65.673 793,564 513,506238 236
Central of Georgia SystemLouisville & Wadley
February July 1 to Feb. 29-
7.351 5,913 54,594 35.97117 17
Central of Georgia SystemWadley Southern
31-
337,127 365,278 2,912,711 2,985,1451,915 1,915
Central of Georgia SystemWrightsville & Tennille
July 1 Mch. 31-1912. 1911. 1911-12. 1910-11.
1,866 2,309 14,271 15,033503 534 5.021 4.713
March -,July 1 to Mch.1912. 1911. 1911-12. 1910-11.
9,413 9,046 51,423 51,0582,584 2,443 27,678 28.461
-March to1912. 1911. 1911-12. 1910-11.27,894 29,231 176,285 165,6429,006 8.455 90,191 86,782
2,533 3,006 20,852 20,903433 682 4,987 4,60896 101 1,137 94523 25 206 225713 691 5,592 5,559
12,746 12,162 85,821 87,6701,755 3,965 21,586 27.8811,113 1,453 13,646 12,030208 231 2,027 2,297
3,835 4,460 33,724 32,250
39,416 39,693 • 284,991 268,1425,317 4,687 • 51,308 30,5173,499 3,761 • 31,417 30,440655 573 5,256 5,028
.11,016 10,609 85,634 77,954
1,385 1.617 13,255 12,338 7,402 10,555 76,233 78,682 22,183 21,338 189.236 159.079.
1,148 1,388 7,597 8,564 5,344 1,606 9,588 8,987 17,233 18,355 95,754 109,062110 20 1,948 756
1,148 1,388 7,597 8,56459 51 492 434
• 5,344 1,606 9,588 8,987507 472 4,802 4,660
17,343 18,376 97.703 109,8191,375 950 13.570 9,412
1,089 1,336 7,105 8,13010 10
Ton & Tidew Cave Charles-See Penn RRCan Pao Car Clinchf & 0 of SC -Se4
4,836 1,134 4,785 4,326• 90 • • 00 • • • • RIVN
Ca tasauqua & Foglesv-See ReadingCar Cl & 0 Central Indiana-See Penn RR
15,968 17,426 84,133 100,407105 105Cent New England-See N Y N H ecl
, ,
Digitized for FRASER http://fraser.stlouisfed.org/ Federal Reserve Bank of St. Louis
Page 6
RAILWAY EARNINGS [VOL. Lxxxxi v.
EARNINGS
Freight revenue Passenger revenue.-- -
Tot.. Incl. other rev.Expenses-Maint. way
Maint. of equipmentTraffic expenses_ _ _Transportation exp _
Tot., incl. general
Net from railroad_ _ _ _Outside operations,netTotal net revenue_ _
Taxes Final net
Miles of road operated
EARNINGS
Freight revenue Passenger revenue_ -_ _
Tot., incl. other rev.Expenses-Maint. way
Maint. of equipmentTraffic expenses_ _ _Transportation exp_Tot., incl. general
Net from railroad _ _ _.Outside operations,net
Total net revenue_ _Taxes
Final net Miles of road operated
EARNINGS
'Freight revenue :Passenger revenue.. _ - _
Tot., incl. other rev.Expenses-Maint. way
Maint. of equipmentTraffic expenses_ _ _Transportation exp _Tot incl. general
Net from railroad_ _ _ _.Outside operations,net
Total net revenue_ _Taxes
Final net Miles of road operated
EARNINGS
Freight revenue Passenger revenue__ _ _
Tot., incl. other rev.Expenses-Matnt. way
Maint. of equipmentTraffic expenses_ _ _Transportation exp _
Tot., Inel. generalNet from railroad.. _ _ _Outside operations,net
Total net revenue Taxes
Final net Miles of road operated
t'EARNINGS
Freight revenue Passenger revenue_ _ _ -Tot., incl. other rev.
Expenses-Maint. wayMaint. of equipmentTraffic expenses__ _Transportation exp.
Tot., incl. generalNet from railroad.. _ _ _Outside operations,netTotal net revenue.. _
Taxes Final net
Mlles of road operated
EARNINGS
Freight revenue Passenger revenue_ - _ -
Tot., Incl. other rev.Expenses-Maint. way
Maint. of equipmentTraffic expenses__ _Transportation exp.
Tot., incl. generalNet from railroad _ _ -Outside operattons,netr Total net revenue_ _Taxes
Final net Miles of road operated
EARNINGS
Freight revenue Passenger revenue_ _ _
Tot., Incl. other rev.Expenses-Maint. way
Maint. of equipmentTraffic expenses_.. _Transportation exp.Tot incl. general
Centralia Eastern February July 1 to Feb. 29-1912. 1911. 1911-12. 1910-11.4 $ $ 41,816 2,555 13,516 18,441154 183 1.126 1,764
2.02027165
2.816 15.208453 2.28868 511
24494 530 4.155
20,7972,5264975
Charleston Terminal March July 1 to Mch. 31-1912. 1911. 1911-12. 1910-11.
10,4551.573443
11,1843,806421
94.16317,27310,810
94,28420.5704,592
4,138 6.282 4,057 49,386 40,626993 1.240 8,344 8,252 9.419 9,358 88.757 76.849
1.027 1,575 6.863 12,545
1,027 1,575 6,863 12,545
1,036 1,825 5,406 17.4345,420 4,898 2.631 9.743
Charlotte Harbor & NorthernMarch -July 1 to Mch. 31-
1912. 1911. 1911-12. 1910-11.$ $ $20,859 8,748 168,226 71,2713,980 2,092 24,562 15,631
39,83714,5254,381555
12,405
11,7938,3741,409948
3.769
317.77890,09829,8474,366
111,471
91,93949,23910,7614,52631,525
33,896 16.114 251,651 111,901
5,941 -4,320 66,127 -19,961
5 941 -4.320 66.127 -19.96180 70 640 720 1,400 1,400 12,600 11,700 1.243 542 14.881 5.547947 1,505 6,223 11,8259 9
Chattahochee Valley March -July 1 to Mch.31 -1912. 1911. 1911-12. 1910-11.4 $ $ $9,240 6.144 67.364 63.028860 1.159 14.312 13.039
10.347 7.414 83.502 78.1901.314 865 13.878 11.761300 813 3.709 10.701135 91 1.087 1.022
2.871 3.182 25.042 25.8685.191 5.378 48,480 54.569
5.156 2.036 35.022 23,620
5.156 2.036 35,022 23,620200 75 1.425 1,125
4.956 1.961 33,597 22,49532 32
Chicago & Illinois Western March July 1 to Mch. 31-1912. 1911. 1911-12. 1910-11.4 $ 4 $3,281 4,325 70,156 121,530
19 78 161 6233.395 4,592 72.236659 653 7,616
5,150 4.154 39,861111 145 811
1,864 2.014 21,9319,029 • 8,254 82,935 108,066
-5,633 -3,661 -10,698 18,378
6.457 6,724 8,038 27.178
5,057 5,324 -4,562 15,4781 1
Chesapeake & Ohio SystemChesapeake & Ohio
March-- -July 1 to Mch. 31-1912. 1911. 1911-12. 1910-11.
2,559,089 2.067,480 20,268,097 19.537,814398,989 398.015 4,106,783 4.199.002
3,071,885 2,574,547 25,455,814 24.777.023260.346 320.106 2.916.171 2.954.622690.496 568.092 5.083.294 4.725.80051.871 47.918 459.639 455.753
990.177 848.624 7.807.094 7.703.2592.059.839 1.853.061 16.832.596 16.430.101
1.012.046-6.626
721.486 8.623.217 8.346.9213.994 7.531 -12.642
1,005.420 725.480 8.630.749 8,334.27984.750 97.040 762.816 774.733920,670 628.440 7,867.932 7,559,545
2,280 2,232
Chicago & North Western SystemChicago & North Western
March July Ito Mch. 31-1912. 1911. 1911-12. 1910-11.
3,854,169 3,911.467 34,883,651 37.398,9201,384.704 1.405,358 14,942,844 14.581.915
126,444 8,845,116 5,884,169 55,356,169 57,042.00510,038 532,494 468,755 6,901,913 7,217,94441,634 768,893 803,554 7,499,872 7,059,7441,159 100,631 88.800 1,030,291 948,818
43,147 2,702,656 2,489,786 23,522,835 23,678,745
-5.633 -3,661 -10.698950 500 8.550
4,228,027 3.985.879 40,070,689 40,136,507
1,617,089 1,898,290 15,285,480 16,905,497-14,597 -11.632 .-44.475 -28.569
18,378 1,602,491 1,886,657 15,241,005 16,876,9284.500 305,000 260,000 2,505,000 2.382,000
-6,583 -4.161 -19.248 13.87814 14
Chicago & North Western SystemMacou pin County
March -July 1 to Mch. 31-1912. 1911. 1911-12. 1910-11.54,305 13.530 325.569 266,968
54.406 13,620 326.3781 823 Crl 253 28.6433.403 Cr2.255 23.489
268.16024.4160.2.261
8.095 3.687 57.346 51.55113.572 427 111.761 74.840
40.834 13.193 214.617 193.320
40.834 13.193 214.617585 585 5.265
1,297,491 1,626,657 12,736,005 14,494,9287.950 7,743(See this road on page 30)
Chicago & North Western SystemPierre & Ft Pierre Bridge
March July 1 to Mch. 31-1912. 1911. 1911-12. 1910-11.
2.501 3.337 36.596 35.1631.498 2.106 11.911 16.591
4.697 -4,862 51,246 -25,509101 95
Chesapeake & Ohio SystemHocking Valley
March- -July 1 to Mch. 31-1912. 1911. 1911-12. 1910-11.521.263 366,929 4,646.510 4.536.64762.031 60.889 668.980 670,608611.70852.53594,1048,232
197,937
452.751 5.635.180 5.541,13766.198 058,055 712,02881,398 885,296 896,3259,553 74.894 79,981
189,052 1.718,173 1,806.156367,477 365,812 3,479,941 3,649,325
244,231 86,939 2,155,239 1.891.812
244.231 86.939 2.155.239 1.891.81228.660 24.725 529.818 252.990
215.571 62,214 1.825.420 1,638,822352 350
Chicago & North Western SystemChicago St Paul Minneapolis & Omaha March -July 1 to Mch. 31-
1912. 1911. 1911-12. 1910-11.822,965 849,961 7,203,307 8,273,200322.121 320,308 3,500,299 3,473,563
1,226,497 1,259,559 11,517,393 12,557,62587,666 109,577 1,307,260 1,327,884163,795 105,470 1,392,840 1,431,80923,249 22,719 240,007 209,553
601.935 500,037 4,866,872 4,787,818
907.210 770.605 8,082,529 8,026,563
319.286 488,953 3,434,864 4,531,062-2.141 ---2,021 529 -12,558
317,145 486,932 3,435,394 4,518,50362,231 64,421 587.174 538,032254,913 422,510 2,848,219 3,980,470
1,743 1,743(See this road on page 30)
Chicago & North Western SystemPierre Rapid City & Northwestern March July 1 to Mch. 31-
1912. 1911. 1911-12. 1910-11.10.921 14.896 126.196 166.6389.504 15,607 108,858 170.151
4.074 5.530 49.295 52.610 23.458 33,328 261,682 364,26873 216 767 1.194 3,824 2,662 39,640 59,126990 311 2.898 1.780 996 1.408 18.809 19.12163 68 583 548 147 225 1,386 1,424
1.518 1.457 12.045 12.357 13,316 15,944 126,871 136,521 2.745 2.154 17.199 16.187 18.784 20,497 191,429 219,368
1.328 3.375 32.095 36.422 4,673 12,830 70,253 144,899
193.320 1,328 3,375 32.095 36.422 4,673 12,830 70,253 144.8995.265 1,250 825 11.250 11.605 5,000 3,750 37,500 30,430
40.249 12.608 209.352 188.05523 23
Chicago & North Western SystemWyoming & Northwestern
March July 1 to Mch. 31-1912. 1911. 1911-12. 1910-11.28,964 19,065 279.481 283,3834.540 5,125 58,704 71.25135,353 26,449 356,409 374,8223.204 Cr1,674 33,677 32,5852,673 2,969 23.605 16,028263 210 2,736 2,485
10,551 8,263 88,715 101,191 17.192 10,268 153,238 155,752
18,160 16,181 203.171 219,069
18,160 16,181 203,171 219.0693,350 3,000 27.150 24,00014,810 13,181 176,021 195,069
147 147
Chicago Burlington & Quincy SystemQuincy Omaha & Kansas City
March July 1 to Melt. 31-1912. 1911. 1911-12. 1910-11.59,051 34,180 475,125 349,97818,849 18,708 185,058 184,197
78 2.550 20.845 24.9172 2
Chicago & Western Indiana March -July 1 to Mch. 31-1912. 1911. 1911-12. 1910-11.$ $ $ $
9,812 8,466 80,396 73.12612,705 12,168 110,581 100,3971,026 577 9,629 9,0763,486 1,719 21,609 24,011218 193 1,821 1,560
10,037 9,374 81,691 81,44315,118 12,249 118,249 119,496
-2,413 -81 -7,667 -19,098
-2,413 -81 -7,667 -19,098840 450 6,479 3,452
-3,254 --531 --14,147 --22,55116 16
Chicago Great WesternMarch July 1 to Mch. 31-
1912. 1911. 1911-12. 1910-11.$
769,135 786.550 6,730,005 6,689,298198,719 206,961 2,190,795 2.156.557
82,828 58,228 709,080 584,512 1,051,712 1,070,865 9.676.372 9,562,96712,820 23,419 212,110 184,063 94,043 92,854 1,069,725 1.031,31713,924 11,934 116,692 114,149 179,341 157,649 1,466,130 1,441,5901,277 1.447 12,979 12,253 46.543 45,303 423,405 418,283
36,282 28,666 309,816 275,009 512,382 451,413 4.158.938 3.880.38866,469 68,011 671,928 609.425 866.721 783,078 7,432,286 7.091.960
16,359 -9,783 37.352 -24,912 184.991 287,786 2,244,085 2,471.007-328 -125 -696 1.722
16,359 -9,783 37,352 -24,9123,000 3.001) 24,201 25,14413,3h9 --12,783 13,151 --50056
262 262
Chicago Junction March July 1 to Mch. 31-1912. 1911. 1911-12. 1910-11.$ $ $ $
159.9406,67111,5801,274
75.767
142,445 1,372,838 1,339,53913,965 143,681 128,62916,166 110,668 107,554
926 11,102 9,42175,807 650.879 618,358
99,374 110,695Net from railroad_ _ _ _ 60,566Outside operations,net Total net revenue_ 60,566
Taxes 3,056Final net 57,510
Milesifof road operated 11Central RR of fk4J-See ReadingCentral Vermont-See Grand TrunkCham & St Law-See Grand Trunk
946.740 895,08631,749 426,098
184,663 287,661 2,243,389 2,472,72935,090 36,174 299.838 298.756149,573 251,486 1,943,551 2.173.973
1,496 1.495(See this road on page 30)Chicago Memphis & GulfDecember July Ito Dec. 31-
1912. 1911. 1911-12. 1910-11.
17,571 10.336 110,898 54.3025.173 2.736 29,560 11,47523.058 14.280 142,4595.941 1,390 28.240774 1,344 10,427
1745,318 4.884 27.562
72.72915.8747,775
4620.702
12.743 8.619 71,278 49.410444,452 10,314 5,661 71.180 23.318
31.749 426,098 444,452 10.3142.126 21.671 17,908 30029,622 404,426 426,543 10.014
11 52Charleston & West Car-See At! CoastChester & Del River-See ReadingChesterf & Lanc-See Seaboard
-326 9.080 32.753 114,469165 165
Chicago Burlington & Quincy SystemChicago Burlington & Quincy
----March July 1 to Mch. 31-1912. 1911. 1911-12. 1910-11.
5,166.621 4,640,519 44,490,322 44,752.0741.411,473 1.641,806 16,050,128 17,400,8687.211,043 6,863,026 66,462,035 67,904,905715,816 696,489 7,323,305 8,357,693
1,294,780 1,123,855 11,416,949 11,040,187131.311 126,415 1,156,145 1,195,008
2,789.140 2,336,692 21,940,104 22,069,057
5.122.603 4.478,701 43,533,262 44,347,882
2,088,440 2,384,325 22,928,772 23,557,023-10,866 -12,588 -92,202 -78,1492,077,574 2,371,736 22,836,570 23,478,873265,014 249,854 2.388,039 2,244,527
1,812.560 2,121,882 20,448,531 21,234,3469,074 9.091
Chicago Indianapolis & Louisville March- July 1 to Mch. 31-1912. 1911. 1911-12. 1910-11.$ $ $ $
365,573 340,106 3,212,331 :1,015,454119.960 126,757 1,224,547 1,179,443534,93574,40188,39916.565
222,391
512,880 4,886,028 4,597,77161,750 672,023 594,07476,481 709,058 655,42418,643 158,554 150,776
183,566 1,810,813 1,648,308416,154 357,296 3.480,921 3,183,676
118,781 155,584 1,405,107 -1,414,095
118,781 155,584 1,405,107 1,414,09522,652 22,500 208,466 202,50096.129 133,084 1,196,640 1,211,595
616 616
Chicago Milwaukee & Gary March July 1 to Mch. 31-1912. 1911. 1911-12. 1910-11.$ 1 $ $43,149 28,356 295,775 214,775
10 16 171 535
43,5664,9415.6061,299
19,764
28,4495,1814,5181.391
10,502
300,84554,82964,43313,432
139,640
219.62972,34542.79410,399
102,860
33,084 22,967 285,973 242,029
10,481 5,481 14,871 -22,400
5.661 71.180 23,318 10,481 5,481 14,871 -22,400157 1.800 942 2,000 2,222 18,000 19,999
5,504 69,380 22.378 8,481 3,259 - 3,128 -42,40031(See this road on page 30) 128 128
Chic & Alton-See To! S L & Western Chic Bet & Can 0 T Jc-See Grand TrChic & East 111-See St L & San Fran Chic Ind & So-See N Y CentralChicago & Erie-See Erie Chic Kai & Sag-See NY Central
Digitized for FRASER http://fraser.stlouisfed.org/ Federal Reserve Bank of St. Louis
Page 7
MAY, 1912.1 RAILWAY EARNINGS 7
EARNINGS
Freight revenue 'tfassenger revenue
Tot., lnel. other rev.Expenses-Maint. wayMaint. of equipmentTraffic expenses.._Transportation exp.
Tot.. Inel. generalNet from rallroad..._ _Outside operations.netTotal net revenue
Taxes Final net
Miles of road operated
EARNINGS
Freight revenue Passenger revenue...
Tot., incl. other rev.Expenses-Maint. wayMaint. of equipmentTraffic expenses_ - -Transportation exp.
Tot.. Inel. general
Net from railroad_Outside operations,net
Total net revenue_Taxes
Final net Miles of road operated
EARNINGS
Freight revenue Passenger revenue_ - -
Tot.. incl. other rev.Expenses-Maint. wayMaint. of equipmentTraffic, expenses.....Transportation exp.
Tot.. inel. general
Net from railroad_ _ _Outside operations.net
Total net revenue...Taxes
Final net Miles of road operated
EARNINGS
Freight revenue Passenger revenue...
Tot., inel. other rev.Expenses-Maint. wayMaint. of equipmentTraffic
expenses..- -
• Transportation exp.Tot., incl. general
Net from railroad........Outside operations,net
Total net revenue...Taxes
Final net Miles of road operated
• EARNINGS
Freight revenue Passenger revenue......P • Tot., incl. other rev.Expenses-Maint. wayMaint. of equipmentTraffic, expenses......Transportation exp.
Tot.. 1nel. generalNet from railroad ... _Outside operations,net
Total net revenue_ _Taxes
Final net Miles of road operated
EARNINGS
Freight revenue Passenger revenue
Tot., Inel. other rev.Expenses-Maint. way
Maint. of equipmentTraffic, expenses.... _Transportation exp.
Tot., Incl. general
Net from railroad........Outside operations,net
Total net revenue._Taxes
Final net Miles of road operated
EARNINGS
Freight revenue Passenger revenue_
Tot.. Inel. other rev.Expenses-Maint. way
Maint. of equipmentTraffic expenses_ _Transportation exp.
Tot., Inel. generalNet from railroad......Outside operations.net
Total net revenue...Taxes
Final net Mlles of road operated
-3,927266
Ch Mil & Pug Sd-See Ch & St PChic R I & Gulf-See Rook IslandChic R I & Pacific-See Rook Island
ahicmgolfilwatikeeds /RN:ultra=Chicago Milwaukee & St Paul
-March- -July 1 to Mch. 31-1912. 1911. 1911-12. 1910-11.
3.806,549 3,710,707 32.450,554 34.638,174985,722 1,049,440 10.505.336 10,740,256
5,300,658 5,238,606 47.804,879 49,981,290387,212 412,257 6,164,498 6,267,686854,744 648.863 7,216,960 6,993,835101,560 108,460 954,514 960.783
2,425,760 2.202,765 20,366.332 21,828,771
3.863,628 3,470,828 35,571.376 36,863,344
1,437,029 1.767,778 12,233,503 13.117,94534,025 9,136 2,858 129,647
1,471.055 1,776,914 12,236,361 13.247,592229,685 226,616 2,172,132 1,982,850
1,241,369 1.550,298 10,064,228 11,264,7417,511 7,511
Chicago Milwaukee & St Paul SystemTacoma Eastern
March- -July 1 to Mch. 31-1912. 1911. 1911-12. 1910-11.33,717 32,543 290,846 319,0288,789 8,485 90,107 96,68643,94312,3006,354600
14,559
43,29811,2898,213434
15,474
400,10377,68361,5377,416
149,189
440,29683,57346,9065,408
160,36035,202 37,081 310,181 311,365
8,740 6,216 89,922 128,731-243 -328 9,402 7,8758,497 5,888 99,324 136,8065,445 2,501 25,566 22,516
3,051 3,386 73.758 114,28991 91
Chicago River & Indiana
1911-12. 1910-11.--January-- -July 1 to Jan. 31-
1912. 1911. $ 4 3 $
Chicago West Pullman & Southern March July 1 to Mch. 31-
1912. 1911. 1911-12. 1910-11.
25,468429
2,980115
13,898
20,976, 195.502477 4.222
2,796 26,53169 841
10.419 101.489
190,7293,27725,091
724103,339
18,480 15.577 141,062 141.726
Chicago Milwaukee & St Paul SystemChicago Milwaukee & Puget Sound March -July 1 to Mch. 31-
1912. 1911. 1911-12. 1910-11.1,108,870 1,200,350 9.486,104 9.587,053171,980 127,548 1.913,165 1.075.778
1,317,504 1.355,346 11,815,798 10.950,18589,718 83,788 854.330 692,976146,337 120.610 1,336,788 1,139.46843,010 28.200 434,578 265.607
458,110 433,213 4.386,166 3,918,016757,258 683,444 7,200,057 6.142,783560,245 671,901 4,615,740 4.807,402-43,793 3,976 81.125 14,109516.451 675,877 4.696,866 4.821,51175.787 50.306 825,890 377.920
440,664 625,571 3.870,975 4,443,5902,058 2.004
Chicago Milwaukee & St Paul SystemWhite Sulphur Springs & Yellowstone Park March July 1 to Mch 31-
1912. 1911. 1911-12. 1910-11.1,859 633 23,637566 913 5,931
2,576 1,58410644
31,356194 3,919
715
1,090 874 9,8851,936 1,174 16,120
640 409 15,235
640 409 15,23590 150 597550 259 14,63822 22
Chicago Short Line March -July 1 to Mch. 31-1912. 1911. 1911-12. 1910-11.3 3 ; 11,468 1,260 12,294 20,845
Chicago Milwaukee &.St Paul SystemGallatin Valley
March -July 1 to Mch. 31-1912. 1911. 1911-12. 1910-11.8,711 il •, 3,518 64.2043.068 • 1,482 25,316
12,253 5,089 93,330501 564 6,667
• 113 89 4,06271 50 836
5,118 3,399 48,300
6.111 4,407 62,430
6,141 682 30,599
6,141 682 30,599520 570 3,615
5,621 112 26,98452 50
Chicago Peoria & St Louis of Illinois March -July 1 to Mch. 31-
1912. 1911. 1911-12. 1910-11.$ $ $ $
117.814 117,996 974,246 1,052,31723.704 20.709 260.292 235,565
148.34017.97725,7976,89774,388
145,166 1,301,598 1,352.65318.069 168,996 198,41030,589 256.574 288.5007.114 65,436 65,351
63.927 589,149 612,128
130,851 126,122 1,134,017 1,217,391
17.489 19,043 167,581 135,261
17,489 19.043 167,581 135,2614.300 4,500 38.700 40,50013,189 14,543 128.881 94,761
255 255
Chicago Terre Haute & Southeastern March- July 1 to Mch 31-
1912. 1911. 1911-12. 1910-11.$ $ 3 3
163,635 128,674 1,308,69114,334 15,731 153,690
8,263 7,669 76,708 106,529 182,337291 373 6,192 6,559 • 19,975
1,430 1,578 13,670 16.180 29,83574 71 745 638 3,905
3,439 3,772 31,495 • 51,129 61,299
145,786 1,496,19312,060 198,83824,131 240,3103,314 26,62144,247 470,716
5,871 6,464 58.160 81,130 121,175 91.593 1,003,722
2,392 1,205 18,547 25,398 61,162-506
2,392 1,205 18,547 25,398190 190 1,592 1,472
2,201 1,014 16,955 23,92611 11
Cincinnati Georgetown & Portsm'th March -July 1 to Mch. 31-
1912. 1911. 1911-12. 1910-11.3 $ $ 54,628 4,153 39.126 29.9616,913 7,036 79,838 76.78914,1472,7702.799173
6,652
13.952 139,920 129,4281,549 35.799 22.4364,037 20,444 12.018
9337.603 60,279 64,060
13,203 13,969 125,723 105.484
6.987 5,398 54,440 49.002
6,987 5.398 54,440 49,002491 95 2,588 860
6,490 5.303 01,851 48,14210 10
CM New Orleans & Tex Pac SystemCincinnati Burnside & Cumberland River
February-- -July 1 to Feb. 29-1912. 1911. 1911-12. 1910-11.
2,868 2.721 14,765 12,055
943 --16 14,197 23,844
943 -16 14,197 23.844464 464 4.182 4.182479 481 10.014 19,66253 53
CM New Orleans & Tex Pac SystemHarriman & Northeastern
March July 1 to Mch. 31-1912. 1911. 1911-12. 1910-11.
9,512 8,688 80,429 82,749338 448 4,071 4,187
3,292 3,253 16.354 14,148 10,113 9,745 92,053249 1,045 1,590 2,954 1,568 2,449 17,395100 77 606 1,161 572 1,019 11,25925 25 202 63 27952 817 6,556 5,657 2,271 2,318 19.951 17,661
1.389 2,018 9.481 10,044
1,902 1,234
1.902 1,234
6.873 4,104
6,873 4,10467 67 536 536
1,835 1,167 6,337 3,5681 1
Colorado & Southeastern-March July 1 to Mch. 31-
1912. 1911. 1911-12. 1910-11.
9,940 8,256 82,278 78,573
9.972 8,268 82.435 78.750778 1,344 6,972 15,358467 1,059 6,938 9,845215 266 1,982 2,427
3,067 2,805 23,626 26,6784,501 7.103 49.764 68,904
5,471 1,165 32,671 9,846
5,471 1.165 32,671 9,845135 130 1.215 1,170
5,336 1,035 31,456 8.67520 20
Colorado & Southern SystemWichita Valley
March July 1 to Mch. 31-1912. 1911. 1911-12. 1910-11.27.536 25.117 293,836 363,07912,039 17.766 161.425 206,69443,26910,2039,404670
21,59544,497
--1,2272.700
87,83614,7805,451
1
4,715 6,081 42,688 48.9565,398 3,663 45,148 43,097
5,398 3,663 45,148 43.097450 450 4.050 4.050
4,948 3,213 41,098 39,04719 19
Colorado & Southern SystemColorado & Southern
March July 1 to Mch. 31-1912. 1911. 1911-12. 1910-11.501.584 496,405 4.826.601 5,573.75079.884 97,807 1,048,105 1.198.844
626,24070.043136,494.15,110
236,859
641,169 6,305,110 7.166,60459,862 708.153 814.321138,139 1,225.162 1.391,79113,909 105,033 107,677
207,318 2,033.120 2.268.082481.232 443.252 4,277.367 4,783.334
145,008 197,916 2,027,743 2.383,269-1.701 -779 --10,425 --11.963143,307 197,137 2,017.317 2.371.30629,200 24,700 240.300 222.300114,107 172,437 1,777,017 2.149.006
1,074 1.173
Colorado & Southern SystemTotal Company
March- -July 1 to Mch. 31-1912. 1911. 1911-12. 1910-11.770,019 730,793 7,597,513 8,554.856180,745 230,455 2,330,196 2.690.380
49,000 491,328 613,518 1,019,813 1,042,334 10,583,418 11,874,8349,118 81,787 96,560 130,429 108,286 1,143,439 1,309,8416.971 63,968 59,664 220,792 213,179 1,891.698 2,115,924552 6.176 5,359 22.321 19,906 173,838 166.819
22,182 205.891 224,803 399,303 358,849 3,508,692 3,785.47741.425 379,749 408..4617,574 111,579 205,667
812,740 741,500 7.071,277 7.734.138
207,074 300,831 3,512,141 4.140,695-2.213 -1,923 -15.803 -23.823
7.574 111,579 205,057 204.860 298,908 3,496,336 4,116.8722,000 24.300 21,544 42,191 37,221 367,975 335.4095,574 87,279 183,512 162,668 261,686 3,118,361 3,781.461 -6,673 -18,181 289.831 119,5492561 • • • • • • 1,784 1.883 462 462Chc St P Minn & Om-See Chic & N W Cin Leb & Nor-See Penn RR Chi Sag & Mack-See Grand TrunkCin Burn & Cum Rlv-See CinN O&T P Cincinnati Northern--See N Y Central Choy Cin Chic & St 1-See N Y CentralCin Ham & Dayton-See Bait & Ohio
54,193 492,470-55 -1,389
60,656 54,138 491,0818.700 8,700 78.300
51.956 45,438 412.781351 350
CM New Orleans & Tex Pac SystemCincinnati New Orleans & Texas Pacific March -July 1 to Mch. 31-
1912. 1911. 1911-12. 1910-11.621,280 402.293 5,482,074 5,283,872139.065 126.387 1.356,151 1.294,265
806.720 573.033 7.206,185 6,928,48766.603 87,542 709,483 724,145207.034 160.393 1,589.647 1,383,35920 684 19.423 180.551 185 081250 834 240.085 2.095,235 2 017 057
565 901 526 247 4.744.408 4 470 967
240819 46,785 2,461,777 2 457 519608 --204 --5.416 --14 731
241 427 46.580 2,456.360 2 442 78721 800 21.800 196,200 195 216
219.627 24.780 2.260.160 2.247.571337 337
Coal & Coke March -July 1 to Mch. 31-
1912. 1911. 1911-12. 1910-11.$ $ $ $64.007 46.048 492,486 408,99916,184 12.939 137,032 131,750
83.361 61.259 fit 4,440 566,26912.781 10.393 107.930 101,56817.204 16.340 147.287 144.9191.410 878 10,612 9,311
21.943 16,400 177,898 158.488
55,452 46.482 463,704 434.498
27.909 14,777 190,740 131777-612.719 11,351 116.396 119,217
40.628 26.129 307.137 250,9873.500 3.500 31.500 31,500
37,128 22.629 275,637 219.487197 197
Colorado & Southern SystemFt Worth & Denver City
March--,- July 1 to Mch. 31-1912. 1911. 1914-12. 1910-11.240.899 209.271 2.477,076 2,618.02788.822 114.882 1,120,666 1.284.842350,30450.18374,8946,541
140.849
352,165 3.786,980 4,094,71239.306 353.499 398.96068.069 602,568 664.4695,445 62.629 53.783
129.349 1,269.681 1.292.592287,011 256.823 2,414,161 2.542.343
63.293 95.341 1,372,819 1.552.360--512 --1,144 --5378 --11.86062,780 94,197 1,367,440 1,540.50910,291 10.521 103,375 91,56552.488 83.675 1,264.065 1.448.943
454 454
Colorado & Southern SystemTrinity & Brazos Valley
March- -July 1 to Mch. 31-1912. 1911. 1911-12. 1910-11.162,977 96,687 1,703,657 1,269,38635.460 29,433 333.897 288.429
206,42159,23522,8309,457
107.082
131,628 2,106,264 1,620,22827.916 360,775 293,75024,260 262,176 266,0999,051 87.375 72,97774.073 963,075 734,715
209.595 146.309 1,777,094 1,467,993
•--3,173 -14,681 329,169 152,235
--3.173 --14,681 329.169 152,2343,500 3.500 39.338 32,685
Digitized for FRASER http://fraser.stlouisfed.org/ Federal Reserve Bank of St. Louis
Page 8
8 RAILWAY EARNINGS [VOL. Lxxxxiv.
EARNINGS
Freight revenue Passenger revenue_
Tot., inel. other rev.Expenses-Maint. way
Maint. of equipmentTraffic expenses_ _ _Transportation exp•
Tot.. inel. generalNet from railroad.. _ _ _Outside operations,net
Total net revenue Taxes
Final net Miles of road operated
EARNINGS
Freight revenue Passenger revenue.._ _
Tot., incl. other rev.Expenses-Maint. wayMaint. of equipmentTraffic expenses__ _Transportation exp.
Tot., inol. generalNet from railroad_ _ _ _Outside operations,netTotal net revenue
Taxes Final net
Miles of road operated
EARNINGS
Freight revenue Passenger revenue__ -
Tot., incl. other rev.Expenses-Maint. way
Maint. of equipmentTraffic expenses_ _ _Transportation exp.
Tot., incl. generalNet from railroad_ _ _ _Outside operations,net
Total net revenue Taxes
Final net Miles of road operated
EARNINGS
Freight revenue Passenger revenue_ - -
Tot.. incl. other rev.Expenses-Maint. wayMaint. of equipmentTraffic
expenses_- _
Transportation exp.Tot., incl. general
Net from railroad_ _ _ _Outside operations,net
Total net revenue Taxes
Final net Miles of road operated
EARNINGS
Freight revenue Passenger revenue__ _
Tot., incl, other rev.Expenses-Maint. way
Maint. of equipmentTraffic expenses__ _Transportation exp.
Tot., inel. generalNet from railroad_ _ _ _Outside operations,net
Total net revenue Taxes
Final net Miles of road operated
1. EARNINGS
Freight revenue Passenger revenue.._ _
Tot., inel. other rev.Expenses-Maint. way
Maint. of equipment• Traffic
expenses_- _
• Transportation exp.Tot., inel. general
Net from railroad_ _ _ -Outside operations.net
Total net revenue_ _Taxes
Colorado & WyomingMarch -July 1 to Mch. 31-
1912. 1911. 1911-12. 1910-11.$ *$28,710 28,142 26$6,420 259,5662,719 • 2,762 23,623 28,047
74,7725,3729,918107
25,039
72,4245,23412,704
38022,279
650,55565,778106.306
757208,790
638,93570,880100,7713,405
196,03842,600 42,435 403,903 387,87132,171 29,988 246,651 251,064
32,171 29,988 246.651 251,0642,700 1,700 15,900 13,837
29,471 28,288 230,751 237,22654 54
Connecting Terminal -March July 1 to Mch. 31-1912. 1911. 1911-12. 1910-11.$ $ 3 $
1,468 56,777 15,1641,468 56,777 15,164
1,102 984 9,920 8,862 5,004 3,000 45,055 46,955-1,102 483 46,856 6,301
3 3
Coudersport & Port Allegheny -March July 1 to Mch. 31-1912. 1911. 1911-12. 1910-11.$ $ $ $6,860 6,898 56,548 60,2813,606 4,083 33.476 33,123
Colorado Midland March July 1 to Mch. 31-1912. 1911. 1911-12. 1910-11.$ $ $ $90,309 97,033 1,096,298 1,077,08114,539 19,647 202,597 254,420
115,88715,86127,3656,626
64,689
125,506 1,431,886 1,500,04021,918 174,563 197,95734,321 266,358 325,7995,439 63,862 45,125
66.478 622,078 664,968
Uolumbia & Puget Sound March-- July 1 to Mch. 31-1912. 1911. 1911-12. 1910-11.$ $ $ S34,201 40,270 288,959 367.8913,963 4,613 39,062 43,418
44,420 50,720 382,536 462,23612,916 7,717 70,832 83,8836,356 6,367 57,596 73,602125 142 1,391 1,237
11,748 14,473 104,423 114,823119,741 133,337 1,175,388 1.284,241-3,854 -7,830 256,498 215,799-1,077 -1,101 -2,733 -5,005---4,932 ---8,932 253,764
8,000 8.500 72.000
32,363 29,929 244,418 284,15112,056 20,790 138,118 178,079
210,794 12,056 20,790 138,118 178,07974,882 3,246 2,416 24,239 26,276
-12,932 --17,432 181,764 135,912337 337 (See this road on page 30)
Copper Range March July 1 to Mch. 31-1912. 1911. 1911-12. 1910-11.
4$5,251 44,709 415,772 389,1239,872 8,488 94,887 94,60756,383 55,291 551,9856,470 9,712 91,7995,549 7,815 50.1461,696 1,741 14,824
20,965 20,393 178,891 37,109 42,201 357,301 19,273 13,090 194,684
8,809 18,374 113,878 151,80255 57
Cornwall -March July 1 to Mch. 31-1912. 1911. 1911-12. 1910-11.$ $ $15,113 10,381 11%.048 95,2581,425 1,573 16,373 18,024
521,367 17,906 12,739 145,43481,611 1,585 777 12,20150,483 1,857 2,769 16,56114,315 56 44 543
193,113 3,717 3,360 32,469360,649 8,260 7,745 70,253 66,250
121,82713,69015,158
69929,092
160,718 9,645 4,993 75,180 55,577
10,5333,098
37
11,0382,162404
92,01418,5171,808
95,31017,5933,247
4,238 3,341 30,376 29,3557,773 6,302 57,072 56,1542,760 4,736 34,941 39,155
2,760 4,736 34,941 39,155200 200 1,800 1,800
2,560 4,536 33,141 37,35539 39
Cumberland & Pennsylvania March July 1 to Mch. 31-1912. 1911. 1911-12. 1910-11.
• $ $ $ S.84,223 68,783 658,614 683,0053,258 2,198 29,990 20,281
89,5335,94314,527
20523,577
72,9495,04027,277
24922,333
706,801 721,52857,058 62,921204,120 215,036
1,665 2,055202,978 212,535
47,437 57.867 495,808 520,839
19,273 13,090 194,684 160,718
14,269 10,090 149,628 113,762133 132
Cripple Creek CentralFlorence & Cripple Creek
March July 1 to Mch. 31-1912. 1911. 1911-12. 1910-11.94,547 27,802 505,461 233,08713,548 6,008 111,202 72,261
9,645 4,993 75,180 55,577600 450 5,400 4,187
9,045 4,543 69,780 51,39012 12
Cripple Creek CentralMidland Terminal
March July 1 to Mch. 31-1912. 1911. 1911-12. 191041.
3,562 15,098 95,966 126,8242,584 3,352 39,196 40,271
109,905 34,630 631,063 313,319 6,573 18,894 139,560 171,3988,369 2,385 54,188 36,664 1,333 1,284 16,001 21,9999,292 3,304 57,439 32,615 1,484 1,802 13,736 18,0221,328 322 11,996 4,890 169 173 3,463 2,633
30,133 11.745 195,116 106,075 6,153 6,324 56,115 57,11752,810 18,876 346,698 191,536 9,912 10,234 95,918 106,04857,095 15,753 284,364 121,782 -3,338 8,660 43,641 65,350
57,095 15,753 284,364 122,7823,867 1,383, 22,685 12,22153,227 14,370 261,679 109,561
129 54Davenport Rock Island & Northw March -July 1 to Mch. 31-1912. 1911. 1911-12. 1910-11.$ 4 $ 4 .
42,096 15,082 210,992 200,68811 63 410 462
42,108 15,145 211,403 201.1504,200 5,000 30,048 32,07337.908 10,145 181,354 169,077
32 32Delaware & Hudson System
Delaware & Hudson March -July 1 to Mch. 31-1912. 1911. 1911-12. 1910-11.
1,529,418 1,583,727 13,601,057 12.892,002187,970 180,363 2,303,315 2,266,094
1,772,362 1,812,488 16,407,837 15,629.460164,563 116,524 1,185,659 1,177,660277,701 282,014 2,284,384 2,208,75020,881 20,080 199,913 197,945
684,837 669,750 5,655,397 5,514,8001,200,563 1,130,015 9,743,779 9.468,032571,798 682,473 6,664,057 6,161,42720,807 -1,185 5,833 -11
9,291 7,052 67,853 86,0242,335 2,372 20,132 23,5281,233 1,421 12,689 12,441
7.016 5.330 41,150 51,141 10,825 9.333 76,629 89,353
--4,534 ---2,280 ---8.775 ---3,329
-1,534 -2,280 -8,775 -3,3291,700 1,800 15,340 14.400
---3,234 ---4,080 ---24,115 -17.72949 49
Delaware & Hudson SystemCooperstown & Charlotte Valley March July 1 to Mch. 31-1912. 1911. 1911-12. 1910-11.
2,565 2,681 24,487 26,0581,185 1,395 19.240 19,2013.99642910251
2.537
4.324445113
2,539
46.9238.2432,169
7722,341
49,5444.9461,292
22.9473,320 3.298 34,707 30,986
675 1.025 12,216 18,577
592,606 681,287 6,669,891 6.161,41648,739 44,066 447.598 411,705543,866 637,221 6,222,293 5749.710
853 819(5eethisroad on page 30)
Delaware & Northern March July 1 to Mch. 31-1912. 1911. 1911-12. 1910-11.$ $ $ $7,049 28.1581,890 9,1349,3161.4111,159204
3,5697,1562,159
2,159833
39,4587,1955,605881
16,67834.624
675 1,025 12,216 18,577260 cr66 3.053 2,461414 1,092 9,162 16,09615 23
Delaware Lack & Western SystemDelaware Lackawanna & Western March July 1 to Mch. 31-1912. 1911. 1911-12. 1910-11.
2,237,948 2,058,139 20.267,216 19,361,283515,675 572,776 5,698,392 5.669,878
2,932,445 2,808,183 27,693,410 26,698,292250,704 189,543 3,020,549 2,771,698567,766 495,141 4,516,247 3,915,99163,377 59.558 595,572 533,405970.520 921.874 8,421,628 8,133,824
1.912,028 1,727,076 17,135,015 15.889.9914,833
4,8334,166
Final net 1,326 667Miles of road operated 45
Delaware Lack & Western SystemSussex
EARNINGS March July 1 to Mch. 31-1912. 1911. 1911-12. 1910-11.
Freight revenue 3,761 4,259 48,155 56,421Passenger revenue_ _ _ 4,294 4.503 48,614 50,930
Tot., inel, other rev. 11,080 11,890 122,494 134.081Expenses-Mint. way4 2,171 1,626 39,166 26,677Maint. of equipment 1,405 727 4,212 2,809Traffic expenses.. 274 224 2,433 2,049Transportation exp. 7,046 7,211 62,607 60,007
Tot., inel. general 11,212 10,111 111,481 94,592Net from railroad_ _ _ .. -132 1,778 11,013 39,489Outside operations,net Total net revenue.... -132 1,778 11,013 39,489
Taxes 2,000 1,338 14,028 10.840Final net -2,132
Miles of road operated 30Col Newb & Laur-See Atlantic CoastConcho S S & Llano Val-.See AtchisonConway Coast & West-See Atl Coast
1,020,417 1,081.106 10.558,394 10.808,30059.646 12,218 318,159 173.299
1,080,063 1,093.325 10,876,554 10,981,600168,940 138.028 1,507,820 1,221,108911,123 955,297 9,368,734 9,760,491
958 930Delaware Lack & Western System
Syracuse Binghamton & New York March July 1 to Mch. 31-1912. 1911. 1911-12. 1910-11.59,446 50,578 461,518 435,11928,151 27,409 304,094 294.65698,64613,3189,6192,983
39,304
88.3175,6425,8642,39434,761
870,094102,46063,30425,021324.735
-3,338 8,660 43,641 65,3501,517 744 8,808 6,580
-4,855 7,915 34,832 58.76929 29
Dayton & Union March July 1 to Mch. 31-1912. 1911. 1911-12. 1910-11.$ $ $ $4,441 6,079 33,917 33,8645,377 5,658 57,812 62,771 11,630 13,219 109,318 112,0721,674 1,976 17,116 17,0811,534 1,879 14,293 10,821122 126 1,955 4,100
6,083 5,152 49,340 45,6659,741 9,460 86,701 81.639
1,888 3,758 22,616 30,433
1,888 3,758 22,616 30,433845 666 7,178 5,243
1,042 3,091 15,438 25,18047 47
Delaware & Hudson SystemGreenwich ec Johnsonville
March -July 1 to Mch. 31-1912. 1911. 1911 12. 1910-11.
6,492 9,012 69,287 75.045966 1,087 9,678 12,525
7,687 10,463 81,348 90,9101,853 1,449 15,816 8,814272 170 6,532 3,00148 182 399 360
2,415 2,959 21,570 26,1274,690 4.917 45,238 39,0062,997 5,545 36.110 51.003
2,997 5,545 36,110336 242 3,156
51,0032,742
2,661 5,202 32,954 48,26021 31
Delaware Lack & Western SystemLackawanna Ec Montrose
March July 1 to Mch. 31-1912. 1911. 1911-12. 1910-11.
960 826 6,271 6,3761,327 1,311 15,914 16,0032,509 2,339 23.932421 281 4,315202 91 44755 44 486
1,429 1,448 12.3092.159 1,919 18,242350 420 5,689
350 420 5,68945 45 360
23,9945,164268409
12,31618,6805,313
5,313360
305 375 5,329 4,95310 10
Delray Connecting March July 1 to Mch. 31-1912. 1911. 1911-12. 1910-11.$ 1 $ $
829,53786,50347,14025,329
293,52267,377 51,100 536.345 476,43031,268 37,216 333,748 353.106
31.268 37.216 333,748 353,1066.820 6,220 57.780 57,855
440 -3.015 28,648 24,448 30,996 275,968 295,25030 80 80Cooperst & Char Val-See Del & Hud Corvallis & Eastern-See So PaoCoos Bay Roseb & E-See So Pao Cumberland-See SouthernCornwall & Lebanon-See Penn RR
10,5713,416673
10.648 97,6593,211 27,0851,015 10,463
93,52431,17810,198
5,597 5,376 43.287 44,18810.125 10,055 85,192 89,46t
445 592 12.466 4.062
445 592 12,466 .4.062364 348 3.020 3,13280 244 9,446 9302 2
Cumberland Valley-See Penn RR .:Danville & Western-See Southern
i
Digitized for FRASER http://fraser.stlouisfed.org/ Federal Reserve Bank of St. Louis
Page 9
MAY, 1912 ] RAILWAY EARNINGS 9
EARNINGS
Freight revenue Passenger revenue
Tot.. incl. other rev.Expenses-Maint. way
Maint. of equipmentTrafflo expenses Transportation exp.
Tot., incl. generalNet from railroad_ _Outside operations,net
Total net revenue_ _Taxes
Final net Miles of road operated
EARNINGS
Freight revenue Passenger revenue_
Tot., incl. other rev.Expenses-Maint. way
Maint. of equipmentTraffic expenses-- -Transportation exp.
Tot.. incl. general
Net from railroad_ _ _ _Outside operations.net
Total net revenue Taxes
Final net Miles of road operated
EARNINGS
Freight revenue Passenger revenue_
Tot., incl. other rev.Expenses-Maint. wayMaInt. of equipmentTraffic expenses_
- -Transportation exp.Tot., incl. general
Net from railroad_ _Outside operations,net
Total net revenue Taxes
Final net Miles of road operated
EARNINGS
Freight revenue Passenger revenue_
Tot., Incl. other rev.Expenses-Maint. way
MaInt, of equipmentTraffic expenses__ _Transportation exp.
Tot., Incl. generalNet from railroad_ _ _ _Outside operations,net
Total net revenue_ _Taxes
Final net Mlles of road operated
EARNINGS
Freight revenue Passenger revenue_ _ _
Tot., incl. other rev.Expenses-Maint. way
Maint. of equipmentTraffic
expenses_- _
Transportation exp.Tot., Incl. general
Net from railroad__ - _Outside operations.net
Total net revenue_ _Taxes
Final net Miles of road operated
EARNINGS
Freight revenue Passenger revenue__ _
Tot., incl. other rev.Expenses-Maint. way
Maint. of equipmentTraffic expenses__ -Transportation exp.
Tot., incl. generalNet from railroad.. _ _Outside operations,net
Total net revenue_ _Taxes
Final net Miles of road operated
EARNINGS
Freight revenue Passenger revenue_- -
Tot.. Incl, other rev.Expenses-Maint. WAY
Maint. of equipmentTraffic expenses_ -Transportation exp.
Tot., Incl. general
Denver & Rio Grande SystemDenver & Rio Grande
March- July 1 to Mch. 31-1912. 1911. 1911-12. 1910-11.
1,338,713 1,272,476 13,141,055 13,131,327300,798 341,332 3,718,318 3,884.445
1,717,730 1,687,224 17,029.097 17,797,063234,334 170,607 2,324,899 2,019,600382,857 350,290 3,230,629 3,135,67050,082 47,909 480,247 430,180
645,909 636,052 6,311,066 6,151,296
1.365,918 1,255.649 12,800,895 12,812,548
351,812--2,680349,131 426,934 4,810,768 5,587,39078,000 73,000 676,000 639,000
431,575 4,828,201 5,614,515-4,640 -17,433 -27,124
Denver & Rio Grande SystemBoca & Loyalton
March-- -July 1 to Mch. 31-1912. 1911. 1911-12. 1910-11.
1,290 3,305 68,824 82,074534 693 7,337 9,709
1,825 4,1801,061 3,3111,575 1,398
12,261 2,0455,357 7,178
271,131 353,934 4,134,768 4,948.3902,544 2,544(See this road on page 30)
Denver & Rio Grande SystemWestern Pacific
March -July 1 to Mch. 31-1912. 1911. 1911-12. 1910-11.215,483 2,966,54680,205 807,657308,55163,51938,55327,687164,423320,315-11,764-2,876-14,640
16,120
3,896,578734,394366,952250,023
1,642,7553,202,121 694,457
--30,904663.552135,419
-3,532 -2.997
--3,532 --2,997442 833
Denver & Rio Grande SystemRio Urande Southern
March-- --July 1 to Mch. 31-1912. 1911. 1911-12. 1910-11.23,845 26,252 280,539 313.1167,158 8,128 72,930 90538
80,012 96,660 33,505 37,322 379,466 433,81115,654 22,571 19,830 10,496 190,113 86,89214,326 17,445 3,374 3,906 28,753 36,057
85 134 146 237 1,690 1,49226,350 30,407 15,472 14,947 132,175 137.200
60,197 74,696 39,867 31,035 367,837 277.024
19,815 21,964 -6,361 6,286 11.628 156,787
19,815 21,964 -6,361 6,286 11,628 156,7874,355 7,240 3,350 3,050 26.850 24,750
-3,974 -3,831 15,460 14,72445 45
Denver Laramie & Northwestern March -July 1 to Mch. 31-1912. 1911. 1911-12. 1910-11.$ $ $ $4,119 5,069 50,986 50,4361,788 3,615 28.506 28,9826,361 9,212789 868
1,935 1,263791 1,011
6,541 4,65510,624 8,715
-30,761 528,132934
Des Moines Union March July 1 to Mch. 31-1912. 1911. 1911-12. 1910-11.
31,084 29,359 274,7602,367 2,550 23,891624 503 9,011
14,810 14,082 124,83419,042 18,116
12,041 11,242
12,041 11,2424,476 4,476
170,754
104,006
104,00640,284
283,59141,0978,056
126,560185,70497,886
97,88636,057
7,565 6,766 63,721 61,8295 5
Detroit River Tunnel Co. March July 1 to Mch. 31-1912. 1911. 1911-12. 1910-11.$ I $ I
107,8112,2602,765
53,330 1,016.4862,761 20,1883,068 26,793
8,650 10,38613,716
94,095
94,0956.000 3,550
16,216
37,114
--4,263 496
--4,263 496627 217
-9,711 3,236 --15,221 132.037179 179(See this road on page 32)
Denver Northwestern & Pacific March 1 to Mch. 31 -1912. 1911. 1911-12. 1910-11.
62,507 40,716 654,123 518,3528,706 10,827 234,706 247,057
84,278 86,210 75,491 56,350 930,681 812,1759,397 10,033 17,144 10,983 129,323 110,17314,810 8,117 15,126 15,120 147,959 128,1857,959 9,843 1,917 1,463 20,879 18,232
39,741 44,054 34,273 23,807 336,526 270.670
79,343 78.417 72.202 53,714 665,457 556,484
4,935 7,792 3,289 2,636 265.223 255,690
4,935 7,792 3,289 2,636 265.223 255,6905,716 1,957 3,500 3,000 29,500 27,000
-4,890 279 -781 5,83455 55
Detroit & Mackinac March July 1 to Mch. 311912. 1911. 1911-12. 1910-11.I $ $ $78,601 82,876 593,182 593,90723,359 24.364 253,284 241,862107,9548,15117,7582,314
36,781
113,19120,26820,4711,923
34,783
902,696148,150158,85721,680
301,41568,085 80.289 658,481
39,868 32.901 244,214-140 -131 1,33739,728 32,770 245,5528,250 8,109 76,709
890,547107,465151,92018,515
294,545
-210 -363 235.723 228,690214 214
Detroit & Toledo Shore Line March- -July 1 to Mch. 31-1912. 1911. 1911-12. 1910-11.
109,292 91,847 854,190 715,779
109,5709.5035,0431,073
32,345
92,04611,5595,3471,137
27,732
856,85377.34443,85410,088
244.279
717,98685,05138,80211.715
208,178596,897 50,029 47,913 393,101 360,400
293,6502.561
296,21177,291
31,478 24,660 168,842 218,920358 360
Detroit Terminal March -July 1 to Mch. 31-1912. 1911. 1911-12. 1910-11.
155.002 14.3906.911 6816,596 203
77,698 31,702 4,214
125,615 45,210 5,099
890,870 109,792 9,291
37,111 890,870 109,792 9,29139,951 9,100 1,255
88,095 33,564 850,918 100,6922 2
Detroit Toledo & Ironton SystemManistique & Lake Superior
February July 1 to Feb. 29-1912. 1911. 1911-12. 1910-11.11,334 8,619 59,722 41.428
524 587 6.349 6,28012.9051,06386637
3,532
11,2479535073
3.416
82,034'13,4768,259356
24,005
64,49911,1883,260
7220,728
5,941 5,476 50,359 42,282
6.963 5,770 31,674 22,217
6,963 5,770 31,674 22,217624 615 4,928 4,670
6,339 5,155 26,746 17,54668 68
Duluth & NortheasternJanuary July 1 to Jan. 31
1912. 1911. 1911-12. 1910-11.$ 4 $ I
East Broad Top RR & Coal -March July 1 to Mch. 31-1912. 1911. 1911-12. 1910-11.$ $ $ $26,327 20,555 210.355 163.9312,249 1,951 23.564 21,570
28,933 22,839 237.8751,543 1,957 21.4312,429 3,027 • 20,664
774,997 . 4,093 42,341
189,23515,07023,396
94 34,779
11,494 10.697 105,170 88,762Net from railroad__ - 17,439 12,141 132,705 100,473Outside operations,net
Total net revenue__ 17,439 12,141 132,705 100.473Taxes 400 300 3,600 2,700
Final net 17.039Miles of road operated 46Denison & Pac Sub-See Tex & PaoOct & Charlevoix-See N Y Central
10,9761,349
53
93.6869,003565
115 35.5651,522 45.142
9.454 48,543
9,454 48,543600 9,661
8.085 8,854 38.88113 13
Dry Fork March July 1 to Mch. 31-1912. 1911. 1911-12. 1910-11.$ 4 I $20,228 19,119 161,650 150,4552,189 2,128 20,871 20,790
22,7482,6321,474
21,5476,8121.064
185,96822.84911.541
174,69433,1908,368
5,107 4,247 41,643 44,17211,463 14,655 97,203 102,907
11,284 6,892 88,765 71,787
11,284 6,892 88,765 71,787385 305 3,089 3,006
10,898 6,586 85,676 68,78030 30
Duluth Rainy Lake & Winnipeg March July 1 to Mch. 311912. 1911. 1911-12. 1910-11.$ $ I 365,843 55,742 374,977 340,94113,748 10.875 126.628 91,486
70,69615,421
498
32,881
59,540 44,133
59.540 44,1334.663 3,480
463.751 357,586
463,751 357.58637,058 35.000
54,877 40,653 426,692 322,58278 76
Detroit Toledo & Ironton SystemDetroit Toledo & Ironton
March July 1 to Mch. 31-1912. 1911. 1911-12. 1910-11.140,876 96.080 1,167.116 1,175.07310.530 11.075 126,147 126,399
161.07425,79416,0902,709
83,387
123,465 1,389,204 1.419,54830,341 264,288 289.4845,588 167.804 205,5432.604 24.755 24,952
63,306 674,452 754,74448.806 133,430 107,834 1.180.187 1,325,827
21,889 27,643 15,630-10
209,016 93,720-33 --73
21,889 27,633 15,630 208,982 93,6474,700 5,000 6,712 53.583 60,408
17,189 22,633 8,918 155,399 33,239441 441
Duluth & Northern Minnesota March- -July 1 to Mch. 31-1912. 1911. 1911-12. 1910-11.$ $ $ $41,365 38,256 239.212 224,6094,297 4,318 29,688 32,20051,4084.5146,705
48,1723,8237,499
304,37067,24923.647
304,18763,35243.397
12,768 12,686 89.772 85,24725.507 26,673 198,757 215,10
25,900 21.498 105,613
25,900 21,498 105,6132,056 1,926 12,174
89,057
89,05712.167
23,844 19,572 93,438 76,890110 91
Durham & SouthernMarch- -July 1 to Mch. 31-
1912. 1911. 1911-12. 1910-11.
28,165 31,459 228,774 230,6332.268 1,655 21,922 19,057
81,509 68,237 517,871 445.733 • 31,681 34,612 258,983 258,7596,274 3,631 84,411 63,348 2,370 4,659 21,972 22,36613,546 10,334 81,766 72,360 2,003 2,272 17,110 15,499
174 496 3,585 3,410 502 580 4,358 5,09132,877 24.025 187,547 158,261 5,954 5,912 51,415 51.369
55,028 39,813 373.833 310,289 12,475 15,043 110,712 106,324
26,481 28,424 144,037 135,443 19,205 19,568 148,270 152,434
26,481 28,424 144,037 135,443 19,205 19,568 148,270 152,4343,260 2,729 20.714 18,569 904 720 11.985 6,180
23,221 25,695 123,322 116,87492 92
East Jersey Railroad & Terminal March -July 1 to Mch. 31-1912. 1911. 1911-12. 1910-11.$ $ $ $
3,022219416
2,230448413
27,6022,5205.356
22,7963.3044,296
1.427 1,366 11,706 11,0202,280 2,462 21,177 20.552
741 --232 6,425 2,2441,541 1.623 2,732 9.9212,282 1,390 9.157 12.165200 200 1,800 1,650
11,841' 129.105 97,773 2,08246 0.48Oct Or Hay & Milw-See Grand TrunkDonora Southern-See U S Steel
18,300 18,848 136,285 146,25458 58
East St Louis Connecting March July 1 to Mch. 31-1912. 1911. 1911-12. 1910-11.$ $ $ $
45,2434,0864,008222
20,162
37.5513,4053.441255
14,05130,251 23,291
14,992 14.260-15 70
14,976 14,330Cr1.478 2.457
332,17940,16634.3722,071
151,033245.622
400.28352,46435,0042.066
143,766250.368
86,557 149,915357 541
86,91420,547
150.45713.500
1,190 7,357 10,515 16,455 11,873 66,367 136,9560.48 3 3
Duluth & Iron Range-See U Steel Du: South Shore & AU-See Can Pao
Duluth Missa be & Nor-Sea U S Steel Dun Allegh Val & Pitts-See N Y Cent
Digitized for FRASER http://fraser.stlouisfed.org/ Federal Reserve Bank of St. Louis
Page 10
10 RAILWAY EARNINGS [VOL. =may.
EARNINGS
Freight revenue Passenger revenue_ _ _ _
Tot., incl. other rev.Expenses-Maint. wayMaint. of equipmentTraffic expenses_ _ _Transportation exp _
Tot., Incl. generalNet from railroad.. _ _ _Outside operations,netTotal net revenue
Taxes Final net
Mlles of road operated
EARNINGS
Freight revenue Passenger revenue_ _ _ _
Tot., incl. other rev.Expenses-Maint. way
Maint. of equipmentTraffic expenses.._ _Transportation exp _
Tot., incl. generalNet from railroad_ _ _ _Outside operations,netTotal net revenue
Taxes Final net
Miles of road operated
EARNINGS
Freight revenue Passenger revenue.. _ -.
Tot., incl. other rev.Expenses-Matnt. wayMaint. of equipmentTraffic expenses..- -Transportation exp.
Tot., incl. generalNet from railroad _ _ _Outside operations,net
Total net revenue_ _Taxes
Final net Miles of road operated
EARNINGS
Freight revenue Passenger revenue.. _ _
Tot., incl. other rev.Expenses-Maint. way
Maint. of equipmentTraffic expenses.. _ _Transportation exp..
Tot.. incl. generalNet from railroad.. _ _ _Outside operations,net
Total net revenue.. _Taxes
Final net Miles of road operated
EARNINGS
Freight revenue Passenger revenue.. _ - -
Tot., Incl. other rev.Expenses-Maint. way
Maint. of equipmentTraffic expenses.. _ _Transportation exp..
Tot.. Incl. generalNet from railroad_ ...-Outside operations,netTotal net revenue....
Taxes Final net
Mlles of road operated
EARNINGS
Freight revenue Passenger revenue.. _ _ _
Tot., incl. other rev.Expenses-Maint. way
Maint. of equipmentTraffic expenses......Transportation exp..
Tot.. Incl. generalNet from railroad_ _Outside operations,netTotal net revenue....
Taxes Final net
Miles of road operated
EARNINGS
Freight revenue Passenger revenue.. _ _ _' Tot., Inc . other rev.Expenses-Maint. wayMaint. of equipmentTraffic expenses......Transportation exp_
Tot.. Incl. generalNet from railroad........Outside operations,netTotal net revenue....
Taxes Final net -4,076
Mlles of road operated 53Eastern Texas-See St L SouthwElgin Joliet& Eastern-Sea U S SteelFarmers' (Jr & Ship Co-See Great Nor
Mist Tennessee & West North Caro March July 1 to Mch. 31-
1912. 1911. 1911-12. 1910-11.
13.498 17,176 142.349 131,3462,425 2,431 29,177 29,51516,373 20,188 176.494 166,0284,535 2,260 19,431 22,0012,184 3.718 18,979 22,041132 124 937 1,178
3,664 3,835 36,318 35,86211,462 11,050 86,670 91.0194,911 0,137 89,823 75,008
4,911 9,137 89,823 75,008483 450 4,506 3,773
4.427 8.687 85,316 71,23434 34
El Paso & Southwestern SystemMorenci Southern
February July 1 to Feb. 29-1912. 1911. 1911-12. 1910-11.
5,317 6,394 48,744 50,253709 527 5,727 5,836
Eastern Kentucky March -July 1 to Mch. 31-1912. 1911. 1911-12. 1910-11.$ 4 $ 43,338 3.911 28,819 26,011952 992 9.531 9,910
4,7012,127800
5,1862,096970
1,569 1,461
41,42327,9997,028
6614,704
4,916 5,062 53.630
38,97415,4667,886101
12,63840,147
--215 124 --12,207 --1,172
-215 124 -12,207 -1,172115 121 1,035 1,013
-330 2 -13,24236 36
Erie SystemErie
March-- July 1 to Mch. 31-1912. 1911. 1911-12. 1910-11.
3.201,149 3,020,380 27,846,298 26,924,676655,221 664,338 6.722,739 6,845,016
--2,185
6,665 7,516 59,588 61,194 4,168,156 3,968,120 37,387,531 36.421,214968 652 8,417 5,145 332,263 304,858 4,065,697 4,060,622799 1,763 10,805 13,024 774,051 645,593 6,448,479 6.127,71111 12 87 126 95,620 87.016 844,552 880,068
3,342 4,358 33,635 37,740 1,557,122 1.422,303 12,896,509 12,125,0615,760 7,472 58,350 61,375 2,849,835 2,564,296 25,061,513 23,931.239905 43 1.238 ---180 1,318,321 1,403,824 12,326,017 12,489,975
---61.176 --41,697 --156,777 ---202,901905 43 1,238198 253 1,258
-180 1,257,144 1.392,126 12,169,240 12,287,0731,912 163,025 120,630 1,390,622 1.051,465
706 -209 -19 -2,09317 17
Erie SystemTotal Company
March July 1 to Mch. 31-1912. 1911. 1911-12. 1910-11.
3,553,037 3,407,143 30,932,030 29,958,596701,692 720,501 7,241,648 7,447,981
4,608,250 4,449,014 41,367,746 40,404,339382,631 343,786 4,586,011 4,495,665867,618 734,498 7,216,451 6,949,632116,724 107,048 1,033,008 1,063,021
1.814,341 1,643,995 14,888,160 13,933,8433,282,431 2,944,016 28,625,936 27,266,8051,325,819 1,504,997 12,741,808 13,137,534--,61,176 -11,697 --156,777 -202,9011,264,642 1,493,299 12,585,031 12,934,632179,475 132,017 1,533,160 1,153,502
1,085,167 1,361,281 11,051,870 11,781,1292,264 2,264 • • •
Erie SystemNew York Susquehanna & Western March- July 1 to Mch. 31-1912.' 1911. 1911-12. 1910-11.177,397 191,217 1,563.422 1,512,24342,897 44.341 443,959 447,877
249,24617,08026,8322,421
103.457
262,677 2,256,993 2,201,37115,611 211,717 243,06024,398 210,861 205,9261,717 17,287 18,016
99,435 878,020 815,285156,924 • 144,803 1,363,994 1,319,600
-92,322 117,873 892.999• -3,008 3,832 -4,578
881,7715.074
1,094,118 1,271,495 10,778,617 11,235,6081,995 1,995
Erie SystemBath & Hammondsport
February July 1 to Feb. 29-1912. 1911. 1911-12. 1910-11.
2,288 1,599 17,948 17,877811 726 13,134 11,958
3,57827543118
1,475
2,73626123169
1,081
33,64415,1731,331952
12,3611,938 1,549 30.1831,640 1,187 3,460
1,640 1,187 3,460159 159 1.260
1,480 1,027 2.19910 10
Erie SystemWilkes-Barre & Eastern
March-- -July 1 to Mch. 31-1912. 1911. 1911-12. 1910-11.66,614 66,992 550,081 507,069
242 294 3.937 3,94667,004 67,344 555,423 511,8357,736 5,315 89,508 87,7386,951 6.541 66,298 59,824904 294 5,572 8,604
22.855 22,286 189,698 176.22939.955 35,302 361,277 340,25327,049 32,042 194,146 171,581
89.314 121,705 888,420 886,846 27,049 32,042 194.146 171,58117.873 11.771 160.862 105.486 547 415 4.927 3,72571,440 109,934 727,558 781,360
152 152(See this road on page 31)
Femwood & Gulf March July 1 to Alch. 31--1912. 1911. 1911-12. 1910-11.$ $ $ $7.698 8.447 64,011 65,9301,540 1,719 15.190 14,5029,835 10,708 84.0573,844 3,591 29,2051,854 1,788 16,282145 168 1,496
2.555 2.984 25.991
84,22829,17011,7131,39517 .328
26,502 31,626 189,219 167,82992 92
Florida East Coast March July 1 to Mch. 31-1912. 1911. 1911-12. 1910-11.S $ $ $
222,914 350,550 1,414,239 1,499,278295,830 273.587 1,320,185 1,127,325586,93357,48145,50510,298
197,278
707,065 3,128,956 2,992.03042,907 495,117 387,12558,701 425.220 411,43010,038 67,960 61,606
176,598 1,159,592 972,00910.834 9.683 98,241 71,491 327,137 296.029 2,237,026 1.902,255-999 1,025 -14,183 12,736
-999 1,025 -14,183 12,736213 128 1,417 1,174
-1,213 896 -15.600 . 11,56231 31
Ft Smith & Western SystemFort Smith & Western
March July 1 to Mch. 31-1912. 1911. 1911-12. 1910-11.37,160 35,752 447,528 453,71616,621 17.678 178,273 182.35258,11210,73413,1801,075
20,056
57,15715,15514,699
63419,406
48,129 52,8299,982 4,328
9,982 4,3283,800 3,800
659,868117,374118,3289,768
180,883
666,651128,309119,3909,305
188,202456,845 473.615203,023 193,035
259 -.109203,283 192,92639,100 39,600
6,182 528 164,183 153,326221 221
Franklin & Abbeville March July 1 to Mch. 31-1912. 1911. 1911-12. 1910-11.4 $ $ $1,315 1,418 107,753 57,954498 358 5,508 3,110
2,0462,600611282
1,9705.889
1,948791206308
2,248
115,90021,8487,8782,942
33.076
67.10014,0076,1872,413
24,7563.658 68,758 48.321
-3,843
--3,843
-1,710 47,141 18,778•
--1.710 47,141 18.778233 133 2,100 1,200
259,796 411,036 891.929 1.089,775-700 -2,080
250,096 411,036 889,849 1,089,77515,500 15,500 139,500 127,141
243,596 395,536 750,349 962,634629 583
Ft Smith & Western SystemSt Louis El Reno & Western
February July 1 to Feb. 29-1912. 1911. 1911-12. 1910-11.
3.930 2,423 26,829 39,570628 1,038 6,525 10,206
4,9441,0271.639229
2,597
3,9492,038320344
3,642
36.84412,9707,3651,957
17,8596.047 6.842 44,627
-1,103 -2,892 -7,783
--1,103 --2,892 --7,783135 600 4,170
54,14515,6053,2832,020
20,800
32,6285,4012,9551,762
11,250
El Paso & Southwestern SystemEl Paso & Southwestern Co
March July 1 to Mch. 31-1912. 1911. •532,017 488,74879,828 80,363
641,662 599,79285.570 72,38193,174 86,72612,667 10.977
185,338 177,678399,992 371,566241,669 228,225-1.592 -985240,077 227,24022,238 20,075
217,839 207,164901 901
1911-12. 1910-11.4,576,115 4,459,781721,354 729,633
5,580,701 5,458,240715,540 686,548772,891 730,449109,875 96,618
1,566.309 1,565,9723,371,473 3,284,753
2,209,227 2.173,486-17,002 -10,4342,192,225 2,163,051211.123 169,326
1,981,102 1,993.724
Erie SystemChicago & Erie
March July 1 to Mch. 31-1912. 1911. 1911-12. 1910-11.351,888 386,763 3,085,732 3,033,92046,471 56,163 518.909 602,965
440,09450,36893,56721,104
257,219
480,894 3,980,215 3,983,12538,928 520,314 435,04388,905 767,972 821,92120,032 188,456 182,953
221,692 1,991,651 1,808,782432,596 379,720 3,564,423 3,335,566
7,498 101,173 415,791 647,559
7,498 101,173 415,791 647,55916,450 11,387 142,538 102,037
-8,951 89,786 273,253 545,521269 269
Erie SystemNew Jersey & New York
March July 1 to Mch. 31-1912. 1911. 1911-12. 1910-11.13,930 11,755 126,793 120,685
.44,624 42,407 438,389 405,80860,7355,3694,130829
36,438
56,0406,1903,896485
28,668
592,21469,24031,95310,696
278,495
549,20793,53030,1919,733
238,82521.657 47,850 40,248 399,139 381,82710,971 12,885 15,792 193,074 167,379
10,971 12,885 15,792 193,074 167,3791,260 1,800 1,386 15,650 12,3409.710 11,085 14,405 177,424 155,038
47 47
Escanaba & Lake Superior March July 1 to Mch. 31-1912. 1911. 1911-12. 1910-11.$ $ $ $32,779 34,320 213,165 214,2711.652 1,946 15,315 17.062
36,077 37,941 259.745 266,5943,242 2,735 50,346 52,3713,564 4,145 29,999 21,905
9,489 9,527 62,848 64,72919,243 19,741 166,757 163,661
16.834 18,199 92,987 102,932
16,834 18,199 92,987 102,9321.631 1,220 10,963 10,980
15,202 16.979 82,023 91.952127 127
Fonda Johnstown & Gloversville March- July 1 to Mch. 31-1912. 1911. 1911-12. 1910-11.$ $ $ $25,755 23.568 184.569 180,74346.031 44,654 480,964 480,50274,2015,1215,026411
23,400
72,8465,0134,625450
20,047
704,09855,24139,0826,493
196,26739.509 34.905 344.171
701,44059,34135.6686,304
185,042332,688
34,691 37,941 359,927-390 -364 1,73934,301 37,576 361,6663,416 3,333 30.750
368,7521.359
370,11130,000
30,884 34.243 330,916 340,11188 86
Fort Worth Belt March July 1 to Mch. 31-1912. 1911. 1911-12. 1910-11.
21,588 9.040 96,792 89,566
13.6101.598250
11,1471,421244
119,32410,6452,488
8.850 8,484 81,916
111,52110,3193,949
81,48945.679 11,961 11.453 106,615 106,9158,525 1,648 -305 12,708 4.606
8,525 1,648 --305 12,708 4.6065,400 150 150 1,350 1,350
--1,238 --11,953 3.12542 . 42
Gainesville Midland March,------- -July 1 to Alch. 311912. 1911. 1911-12. 1910-11.
14,902 15,406 98.206 93,5533,003 2,490 30.986 33,14318,7172,6592,005368
6,412
18,5402,1321,073465
4,898
134,96821,16517,5223,34252,382
12.455 9,741 105,2236,261 8.799 29,744
6,261 8,799 29,744400 400 3.600
-1,843 45,041 17,578 5,86151 74Flor & Cripple Creek-See Crip Ck CentFt Worth & Denver City-See Col & SoFt Worth & Rio Or-See St L & San Fr
131,92216,39512,8462,665
48.11092,431
1,498 -455 11,358 3,25615 15
Galveston Houston & HendersonMarch -July 1 to Mch. 31-
1912. 1911. 1911-12. 1910-11.$ $ $ $16,544 15,365 199,782 183,4325,096 16,074 111,271 135,19025,917 34,274 343,554 345,0915,771 3,490 29,961 30,0522,214 2,440 21,548 19,2721,315 1,261 13,565 12,891
20,189 14,978 171,678 142,31731,048 23,326 249,782 216,323
39,490 -5,131 10,948 93,772 128,767
39,490 -5,131 10,948 93,772 128,7673,132 3,500 3,300 29,446 25,105
8.399 26,144 36,258 -8,631 7,648 64,325 103,66174 50 50
Fulton Chain-See N Y Central Georges Cr & Cumb-See Western INGallatin Val-See Chic ittlw & St PaulCialv Bar & San Antonio-See So Pao
Digitized for FRASER http://fraser.stlouisfed.org/ Federal Reserve Bank of St. Louis
Page 11
MAY, 1912.] RAILWAY EARNINGS 11
EARNINGS
Freight revenue Passenger revenue__ _ _
Tot., incl. other rev.Expenses-Maint. wayMaint. of equipmentTraffic expenses_ _ _Transportation exp..
Tot., incl. generalNet from railroad_ _ _ _Outside operations,netTotal net revenue_ _
Taxes Final net
Miles of road operated
EARNINGS
Freight revenue Passenger revenue.- -
Tot., incl. other rev.Expenses-Maint. way
Maint. of equipmentTraffic expenses_ - -Transportation exp-
Tot.. Incl. general
Net from railroad_ _ - -Outside operations,net
Total net revenue_ _Taxes
Final net Miles of road operated
EARNINGS
Freight revenue Passenger revenue_ _ _ _
Tot., incl. other rev.Expenses-Maint. way
Maint. of equipmentTraffic expenses_ _ _Transportation exp.
Tot.. lncl general
Net from railroad_ _ _ _Outside operations,net
Total net revenue Taxes
Final net Miles of road operated
EARNINGS
Freight revenue Passenger revenue..
Tot., incl. other rev.Expenses-Maint. way
Maint. of equipmentTraffic expenses.. _Transportation exp..
Tot., Incl. general
Net from railroad_ _ _ _Outside operations.net
Total net revenue_ _Taxes
Final net Miles of road operated
EARNINGS
Freight revenue Passenger revenue_ _ _•iTot., incl. other rev.Expenses-Maint. way
Maint. of equipmentTraffic expenses...Transportation exp.
Tot., incl. general
Net from railroad_ _ _ _Outside operations,net
Total net revenue..Taxes
Final net Miles of road operated
EARNINGS
Freight revenue Passenger revenue_ _ _
Tot., incl. other rev.Expenses-Maint. way
Maint. of equipmentTraffic expenses_ _ _Transportation exp.
Tot., incl. general
Net from railroad_ _ _Outside operations,net
Total net revenue..axes Final net
Miles of road operated
EARNINGS
Freight revenue Passenger revenue- - -
Tot., incl other rev Expenses-Maint. way
Maint, of equipmentTraffic expenses__Transportation exp.
Tot., incl. generalNet from railroad_ _ - _Outside operations,net
Total net revenue__Taxes
Final net Miles of road operated
Galveston Wharf March
1912. 1911.July 1 to Mch. 31-1911-12. 1910-11.
14,407 11,454 172,180 137,507
15,359 12,466 184,599 144,5212,142 913 19,259 17,8001,742 918 13,131 9,784294 1,184
9,445 6.330 89.375 62,120
14,218 8,387 129,643. 98,075
1,141 4,078' 54,955 46,445
1,141 4,078 54,955 46,4451,174 1,284 11,121 11,442
-33 2,794 43,834 35,00311 11
Georgia & FloridaMarch -July 1 to Mch. 31
1912. 1911. 1911-12. 1910-11.$ $ $ $58,479 45,930 396,709 321,03219,028 19.305 188,359 156,581
80,691 68,224 616,494 540,29213,385 6,724 96,358 62,48610,840 . 7,397 78,132 76,5323,151 2,407 27,591 21,88332,342 27,627 270,219 226,53465,630 49,079 522,893 429,456
15,060 19,145 93,601 110,836129 1,704
15,190 19,145 95,305 110,8363,641 2,512 29,195 19,05611,548 16,632 66,1 i 0 91,779
352 326
Georgia Southwestern & Gulf March1912. 1911.
July 1 to Mch. 31-1911-12. 1910-11.
i$$
$8,944 7,877 61 ,733 51,8462.962 2.390 32.884 30.98912.638 10.659 99.764 86,8861.881 1.402 10.606 8.817515 978 . 5,118 10,178345 633 3.238 2,820
3,867 3,434 31,550 30,1327,525 7.308 58.371 58.406
5.113 3.350 41.393 28.480
5.113 3.350 41.393 28,480423 380 4,102 3.615
4.689 2.970 37,200 24.86535 35
Grand Trunk Lines in II SCentral Vermont
March July 1 to Mch. 31-1912. 1911. 1911-12. 1910-11.247,553 260,524 1,994,705 1,932,09365,651 62,747 815,886 801,218
338,655 345,184 3,050,435 2,950,8054,977 28,897 315,981 350,759
52,423 33,425 491,090 427,9855,055 7,171 66,590 63,662
184,070 174,758 1,494,905 1,375,415
255,116 255,496 2,450,219 2,289,876
83,539 89,688 600,216 660,92963 296 3,662 4,891
83,602 89,984 603,878 665,82012,200 12,750 108,900 99,11671,402 77,234 494,978 566,703
411 411
Grand Trunk Lines in tr SCincinnati Saginaw & Mackinaw March July 1 to Mch. 31-1912. 1911. 1911-12. 1910-11.15,500 13,062 127,692 108,1955,000 3,378 47,308 32.57922.310 17,565 190,339 154,8372.664 3,924 34.552 37,8112,111 2,097 30,049 31,805715 695 10,270 6,527
16,628 10,746 138,289 91,61522,702 17,966 220,601 172,941-392 --401 -7=-30,262 --18,103
-392 -401 -30,262 -18,1031,045 1,315 9,406 11,835
--1,437 -1,716 --39,668 -29,93952 52
Grand Trunk Lines in II SLewiston 6c Auburn
March1912. 1911.
July 1 to Mch. 31-1911-12. 1910-11.
650 715 6,559 5,705912 837 8.569 8.752
1,669 1,717 17,037 16 365317 151 5.656 2.771101 130 1.638 3.8.37150 131 1.522 1.366
2.018 1,681 15.723 17.1962,661 2.204 26.098 26.347--992 --487 --9,060 --9,981
-992 -487 -9,060 -9,981268 253 2,413 2,282
-1,260 --741 -11,474 -12,2635 5
Grand Trunk Lines in II SSt Clair Tunnel
March July 1 to Mc4. 31-1912. 1911. 1911-12. 1910-11.
213.82822.187
25.555850
28.3631.161
218.5157.382
411 1,029 8.076 9,804
5,208 3.977 44,203 39.5776.470 6.169 59,710 71.618
19,084 g2,194 158,804 142,210
19,084 22,194 158,804 142,2102,452 2,415 22,070 21,73816,632 19,779 136.734 120,4722 2
aeorgia-3ee Atlant o CoastOzor.fia So Sc Florida-See Southern
Genesee & Wyoming March July 1 to Mch. 31-1912. 1911. 1911-12. 1910-11.$ * $ $7,577 6,475 73,274 70,170
82 73 732 7267,662584.721165
1,752
6,561227606130
1,574
74,1417,1015,6451,526
15,286
71,0595,9685,0782,03113,978
4,395 3.380 37,955 35,095
3,267 3,180 36,185 35,964
3,267 3,180 36,185 35,964268 215 2.185 2,085
2,999 2,965 34,000 33,87916 16
Georgia Florida & Alabama March July 1 to Mch. 31 -1912. 1911. 1911-12. 1910-11.$ $ $ $35,001 30,394 274,732 219,99812,110 10,642 125,633 116,68450,8959,3818,9401,54917,100
45,2037.3067,2701,384
16,105
433,97067,80569,60212,396
165,631
369,27157,49360,44911,846
127,25940,844 37,173 356,390 298,409
10,050 8,029 77,579 70,862-654 -622 -5,301 -4,6709,396 7,406 72,278 66,1922,000 1,595 18,000 15,6047,396 5,811 54,278 50,587192 192
Grafton & Upton--March-- -July 1 to Mch. 31-
1912. 1911 1911-12. 1910-11.
¶1,688 ¶1,298$ i
6,688 6.298 56,682 62,6751,237 1,183 14,043 13,8637,92906972
7,4841,122148
3,009 2,735
75,11718,2923,207
81,28611,5072,358
24,977 28,615
4,599 4.413 50.817 46,228
3,329 3,071
3,329 3,071126 54
24,299 35,058
24,299 35,058516 419
3,203 3,016 23,783 34,63919 19
Grand Trunk Lines in U SChamplain & St Lawrence
March July 1 to Mch. 31-1912. 1911. 1911-12. 1910-11.
1.245 514 8.131 3.497175 130 2.106 1.982
1.4879738536
2.084
6903112033
1.5882 633 1.824
10.9581,2121.511463
13.234
6.1701.0943.093246
13.51416.704 18.198
-1.1411 -1.134 -5,746 -12.027
-1,146 -1,134 -5,746 -12,02736 38 332 348
-1,182 -L17'2 -6.078 -12.3761 1
Grand Trunk Lines in U SDetroit Grand Haven & Milwaukee March July 1 to Mch. 31-1912. 1911. 1911-12. 1910-11.100,000 116,913 1,000,405 902,08441,500 34.174 476.128 419,173
164,300 170,779 1,702,225 1.531,52215,825 16,872 193.405 207.66223,786 30,345 235,606 203,4085,148 7,055 59,626 57,927
106,933 98.337 903,800 778,478155,947 157,22:1 1,433,332 1,288.538
8,352 13,556-14 --348,338 13,5212,879 3,009
268,892 242,984--456 --339
268,4.36 242,64425,918 27,081
5,458 19.512 242,517 215,563190 190
Grand Trunk Lines in II SMichigan Air Line
March July 1 to Mch. 31-1912. 1911. 1911-12. 1910-11.11,575 9,336 82.461 64,7463,000 . 3,057 33,128 29,72615,9853,1672,936835
10.537
14,4802,9791,4981,0178.601
129,78031.60630,5259,19782.730
110.06332.49427,0828.72972.296
18.185 14.810 161.237 147.260
--2,200 --329 --31.456 --37.196
-2.200 -329 -31.456 -37.196859 871 7.731 7.847
-3,059 -1,201 -39,187 -45,044105 105
Grand Trunk Lines in U SToledo Saginaw & Muskegon
March July 1 to Mch. 311912. 1911. 1911-12. 1910-11.
9,300 10,765 88,314 78,8572,200 2,353 26,359 25,360
12,870 14.350 126.916 115.8782.282 2.766 48.449 27.1902.053 1.327 21.691 22.445576 721 6.246 6.154
9.990 7.963 74,913 65.382
15,472 13,231 154,584 126.369
-2,602 1,118 -27,667 -10,491
Georgetown & WesternMarch July 1 to Mch. 31-
1912. 1911. 1911-12. 1910-11.$ $ $ $28,672 29,909 186,144 185,8104,033 3,590 35,617 33,789
34,2925,6605,792168
9,696
35,1626,6855,247173
9,197
234,457 232,30143,081 55,82248,699 41.9051,584 1,623
77,517 71,110
22,336 22,526 181,368
11,955 12,635 53,088
11,955 12,635 53,088500 710 4,426
180,492
51,809
51,8094.590
11,455 11,925 48,662 47,219101 • 101
Georgia Northern March -July 1 to Mch. 31-1912. 1911. 1911-12. 1910-11.
15,640 13,898 129,042 108,4214,990 4,552 53,934 48,786
22,2863,0573,539616
5,027
19,5582,4871,803619
3,902
197,15622,91320,0175,50448,471
14,974 12,067 121,168
7,312 7,490
7,312 7,490833 556
168,38621,07514,9215,24531.867102,113
75,988 66,273
75,988 66,27310.227 4.836
6,479 6,934 65,760 61,43668 68
Grand Trunk Lines in U SAtlantic & St Lawrence
March -July 1 to Mch. 31-1912. 1911. 1911-12. 1910-11.115,750 105,901 809,091 732,39725,615 23,120 235.645 222,996
154,23010,10722,9684,69897,270
142,889 1,149,199 1,054,24214.625 260,346 208,99922,822 194,341 199,7444,719 40.095 37,883
79,341 686,169 550.711
139,174
15.055
125,393 1.112,834 1,028,002
17,495 36,364 26,239
15.055 17,495 36,364 26,2396,658 8,452 59.928 76,071
8,396 9,043 -23,563 -49.831166 166
Grand Trunk Lines in U SChic Detroit & Can Grand Trk Junc March -July 1 to Mch. 31-1912. 1911. 1911-12. 1910-11.42.500 37,728 393.808 318.22814.500 10.788 165.817 141.298
69.80013,58911,7941,634
45.058
59.15510,23911,7891,853
38,44873.563
699,081105.298116.42316,959
340.660
552.96087.56194.89316.359
303.171
61,777 593,169 515.422
-3,763 -2,62-1 105,911 -37,537
-3,763 -2,621 105.911 37,5372,647 2,661 23,827 23.953
-6.411 -5,283 82,084 13,58360 60
Grand Trunk Lines in U SGrand Trunk Western
Mach July 1 to Mch. 31-1912. 1911. 1911-12. 1910-11.369,000 395,589 3,075,563 2,948,881138,000 113.546 1,600,606 1,427.379
540,71058,80678,14117.405
265,360
542,316 4,981,713 4,681,16854,995 487,406 462,49590,308 731,375 691,53318,756 171.698 163,891
243,077 2,087.655 2.025,338
433.870 419,439 3,601,791 3.460,094
106,839 122,876 1,379,922 1,221.073-1.841 -1,632 -10.647 -11.172
104,997 121,244 1,369,274 1,209,90031,635 31.697 284,715 255,275
73.362 89,546 1,084.559 924,625347 347
Grand Trunk Lines in II S •Pontiac Oxford & Northern
March July 1 to Mch. 31-1912. 1911. 1911-12. 1910-11.12.100 12,290 118.603 111.0586,500 5,321 63.281 56.363
20.220 19,203 198,849 181 .4532,961 3,294 43,827 45,2893,414 2.154 29,169 20,703960 932 10.027 9,184
12,062 8.151 96,857 72.691
20.001 15,027 185,592 152 967
218 4.175 13.256 28.486
218 4.175 13.256440 1.320 3.961
28.48611.885 •
-221 2.855 9.294 16.601100 100
Grand Trunk Lines in II SUnited States & Canada
March July 1 to Mch.‘31-1912. 1911. 1911-12. 1910-11.
2,760 2,544 27,316 25,760425 363 4,155 3.836
3,420699874473
2,759
3.168 .636511331
1,715
33.6998.8347.5492,67818,045
31.95411.2589,4081,81816,770
5,115 3,402 38,674 40,737
-1,695 -234 -4,975 -8,78g
-2,602 1,118 -27.667 -10,491 -1,695 -234 -4,975 -8,782945 949 8,511 8.546 271 297 2.442 2.678
-3,547 169 -36,178 -19,038 -1,96-6 -531 -7,417 -11,461116 116 22 22
Gettysburg & ifirrisb-See Reading Grand Riphis St 13J-See Penn RR Oreenw & Johnsonv-See Del & R
Grand Canyon-See Atchison (Irani Trunk Western-See Grand Trunk
Digitized for FRASER http://fraser.stlouisfed.org/ Federal Reserve Bank of St. Louis
Page 12
12 RAILWAY EARNINGS Lxxxxiv.
EARNINGS
Freight revenue Passenger revenue.._ _ _
Tot.. incl. other rev.Expenses-Maint. wayMaint. of equipmentTraffic expenses_ _ _Transportation exp_
Tot.. Incl. generalNet from railroad........Outside operations,net• Total net revenue.._Taxes
Final net Miles of road operated
EARNINGS
Freight revenue Passenger revenue_ .. _ _
Tot., incl. other rev.Expenses-Maint. wayMaint. of equipmentTraffic expenses.._ _Transportation exp.
Tot.. Incl. generalNet from railroad_ _ _ _Outside operations,net
Total net revenue_ _Taxes
Final net Mlles of road operated
EARNINGS
Freight revenue Passenger revenue..__
Tot., incl. other rev.Expenses-Maint. way
Maint. of equipmentTraffic ..
expenses_.-Transportation exp _Tot., incl. general
Net from railroad..Outside Outside operations,netTotal net revenue_ _
Taxes Final net
Miles of road operated
EARNINGS
Freight revenue Passenger revenue..
Tot.. Incl, other rev.Expenses-Maint. way
Maint. of equipmentTraffic expenses.. 'rransportation exp_
Tot.. incl. generalNet from railroad_ _ _ _Outside operations,netTotal net revenue._
Taxes Final net
Miles of road operated
EARNINGS
Freight revenue Passenger revenue..
Tot., incl. other rev.Expenses-Maint. way.Maint. of equipmentTraffic expenses Transportation exp.
'rot., incl. generalNet from railroad _ _•Outside operations,net
Total net revenue.. _Taxes
Fin I net Mlles of road operated
EARNINGS
Freight revenue Passenger revenue..1._ -
Tot.. Incl. other rev.Expenses-Maint. way
Maint. of equipmentTraffic
expenses...- _
Transportation exp..Tot., incl. general
Net from railroad__ _Outside operations,net
Total net revenue_' Taxes
• Final net Miles of road operated
EARNINGS
Freight revenue Passenger revenue....._
Tot., incl. other rev.Expenses-Maint. wayMaint. of equipmentTraffic expenses......Transportation exp..
Tot., Incl. general
Net from railroad......Outside operations,net
March 1912. 1911.$ $14.459 11,3073.358 2,92918,3393,2601,9681,0486,644
14,7062,5241.1951,0343.898
Great Northern SystemGreat Northern
March July 1 to Mch. 31-1912. 1911. 1911-12. 1910-11.
3,507,919 3,127,873 35,898,468 32,779,600956,240 951,035 10,212,806 9,981,965
4,847,167 4,429,957 49,593,924 46,111,370488,749 473,405 5,250,166 6,160,161708,384 694,478 5,805,959 5,865.87784,654 78,932 815,085 752,311
1,535,834 1,520.199 13,735.077 13,766,4752,910,195 2,857,770 26,499.892 27,406,945
1,936,971 1,572.187 23,094,032 18,704,424-4,993 -396 88,013 132,310
1,931,978 1,571,791 23,182,045 18,836,735274,330 255,020 2,498.377 2,412,016
Great Northern SystemFarmers Grain & Shipping
March July 1 to Mch. 311912. 1911. 1911-12. 1910-11.
4,436 2,483 51,762 20,8822,136 1,466 16,591 11,9947,4882,2061,134115
2,906
4,7311,6051,094
202,983
77,78111,7024,985605
24,046
40,9318,6644,091237
20,1306,631 6,218 46,731 36.267857 -1,486 31,050 4,663
857 -1,486 31,050 4,663850 968 7,531 6,716
1,657,647 1,316,770 20,683,668 16,424,7197.344 7,327
Green Bay & Western SystemGreen Bay Ec Western
March July 1 to Mch. 31-1912. 1911. 1911-12. 1910-11.55,821 37,898 386,828 319,88513,555 12,418 124,417 122,665
7 -2,454 23,519 -2,05366 66
Green Bay & Western SystemAhnapee Ec Western
March July 1 to Mch. 311912. 1911. 1911-12. 1910-11.
4,485 4,122 33,360 33,0153,153 3,161 32,787 31,683
73,929 54,711 558,223 490,909 8,351 7,926 73,487 71.9937,742 8,281 116,328 89,857 1,228 528 24,684 17,3736,942 6,187 58.504 65,459 375 497 5,430 4,841490 517 3,995 3,783 76 75 •
720. 754
19,572 16,755 164.578 159,277 2,154 2,023 20,697 19,61737,206 33,821 363.443 339,107 4,205 3,463 55,080 45,51536,722 . 20,890 194,779 151.802 4,146 4,462 18,407 26,477
36,722 2,19334,529 18.744 175,482 132,845
225 225
Green Bay & Western SystemKewaunee Green Bay & Western March July 1 to Mch. 31-1912. 1911. 1911-12. 1910-11.12.940 9.735 91.516 77,9913,132 3,176 31.416 29.658
Great Northern SystemMinneapolis Western
March July 1 to Mch. 31-1912. 1911. 1911-12. 1911-11.
2,570 3,089 29,714 33,9911,608 299 6,066 3,739373 490 3,822 3,185
1,603 1,798 17,465 19,0013,611 2.613 27,711 26,305
-1,040 476 2,003 7,685
-1,040 476 2,003 7,685102 123 1,176 1,250
-1,143 352 826 6,4342 2
20.890 194,779 151,802 4,146 4,462 18,407 26,4772.146 19,297 18,957 329 237 2,739 2,034
17,069 . 13,922 132.412 117,2631,207 693 13,158 11,0461,521 • 1,788 15,205 18,552138 76 837 902
3,670 3,304 32,520 30,2107,626 6.536 68,260 67,4919.443 7.382 64,151 49,772
9,443 .7,382 64,151 49,772632 475 4.749 4,128
8,810 6,907 59.04236 36
Gulf LineJuly 1 to Mch. 31-1911-12. 1910-11.
114,253 84,95533,667 30,737153,64219,57711,0317,730
44,086
3,817 4,224 15,668 24,44234 34
Gull & Sabine River--March July 1 to Mch. 31-
1912. 1911. 1911-12. 1910-11.4 $ $ $7,330 6,718 55,058 81,861461 502 3,054 3,817
8.7913,8004,550
34,418
7,0312,5212,582
33,246
09,11519,04624,617
5924,171
87,24515,27628,169
9724,222
13.856 9.408 78,209 76.859-5,064 -2,3113 -19,093 10,386
-5,064 -2.376 -19,093 10,386
45,643 -5,064 -2,376 -19,093 10,38625 20Hannibal Connecting
March July 1 to Mch. 31-1012. 1911. 1911-12. 1910-11.$ $ $ $4,433 6,128 45,929 50,453
120,90819,8629,2906,52931,639
14,594 10,013 96,026 77,721
3,744 4,692 57,615 43,186
3,744 4,692 57,615 43.186525 450 4.423 5.493
3,219 4,242 53,192 37,69397 77
Huntington & Bd Top Mt RR & Coal March July 1 to Mch. 31-
1912. 1911. 1911-12. 1910-11.$ $ $ $51,412 41,184 373,853 386,4215,051 4.758 48,898 53,995
8,5301,14366166
4,248
8,454234616115
2,514
72.5696,1526,975602
30,222
77,9245,3397,1363,47726,314
6,275 3,631 46,463 43,5012,254 4,822 26,106 34,422
2,254 4,822 26.106 34,42296 149 941 1,070
2.158 4,672 25,165 33,3526 6
Idaho & Washington Northern March - -July 1 to Mch. 31-1912. 1911. 1911-12. 1910-11.$ $
33, $ $
24,047 252 245,762 369,4137,084 14,099 84,416 146,924
58,228 47,066 437,128 453,641 32,951 4mil 31glig 533,4836,311 5,023 51,087 48,284 5,150 55,9366,476 4,262 51,237 45,068 10,646 9,911 64.626 84,518553 606 3,748 5,553 1,141 1,176 9,847 12,259
14,000 12,186 109.243 124,016 15,780 21.362 165.631 183,89730,677 25.332 246.406 254.612 35,486 40,644 309.646 355,571 27,551 21,734 190,721 199,028 -2,534 8,373 34,178 177,911
27,551 21,734 190,721 199,028 -2,534 8,373 34,178 177,9112.000 2,000 18,000 18,000 6,000 3,000 36.000 27,000
172,721 150,91125,551 19,73470 70
Illinois Central SystemIllinois Central
March July 1 to Mch. 31-1912. 1911. 1911-12. 1910-11.
3.487,480 3.382,611 28,464,096 31,035,728995,515 1,021,288 10,165,297 9,923,866
181,028
5,145,960 5,063,317 44,289,205 46,519,586453,218 558,138 5.816,156 5,574,052
1,172,479 1,005,204 10,559,223 9,312,289121,649 112,862 1,075.751 1,008,987
2,176,053 1,865,690 17,869,533 16,031,5394,044,761 3.685,724 36,474.535 32,924,709
-8,534 5,373 -1,821150 111
Illinois Central SystemYazoo & Mississippi Valley
March July 1 to Mch. 31-1912. 1911. 1911-12. 1910-11.609,985 632,573 5,174,453 5,833,266170,086 205,362 1,968,434 2.139,587850,984128,850123,41016,572
377,800
908,823 7,712,168 8.495,265156,685 1,399,691 1,494,524135,938 1,128,820 1,187,66414,719 145.491 134,659
315.984 3,065.744 2,630,426673,214 647,556 5.977.973 5.660.374
1.101,199 1,377,593 7,814,670 13,594.877--11,272 --7,901 --73.715 --32.5481,089,926 1,369,691 7,740,954 13,562,328210,279 238,122 2.036,538 1,968,469879,646 1.131.568 5,704,416 11,593.859
4,755 4.575(See this road on page 31)
Illinois Southern March July 1 to Mch. 31--1912. 1911. 1911-12. 1910-11.
$• 49,795 20,244 310,534 307,626
4,837 4,117 42,375 40.61256.1836,101
' 7.4021,321
20.981
25.719 307.8606.340 52.7126,534 53,4641.451 13,472
12.007 147.66038.272 28.475 291.521
361.00577,09857.89010.499126.078
177.770 261,266 1,734,195 2,834,8901,111 214 -1.074 -3,445
178,882 261,480 1,733.120 2,831,44537.000 36.050 339,886 306,098141,882 225,430 1.393,233 2,520,347
1,371 1,371
• Illinois Terminal March July Ito Mch. 311912. 1911. 1911-12. 1910-11.$ $ $ $23,381 17,485 167.628 135.320
191 281 2,781 2,46923,7402,4312,388412
5,921
18,2095.0042,852356
4.432
172,14836,42320,5013,698
43.008
144,96422,94518,6082.861
39.607295.631 12.098 20.639 113.481 104,380
17,910 -2,755 76,339 65.463
Total net revenue-- 17,910 -2.755 76,339 65,463Taxes 2,000 1,500 18,000 13,500• 'Final net 15.910 -4,255 58,339 51,963 11,263Mlles of road operated 136 136 18Gulf tc Inter-S of Tex--See Atchison Harr & Northeast-See Cin NO &TPGulf Colo Ec Santa Fe-See Atchison Hartwell-See Southerntiamilton Belt-See Bait 64 Ohio Hearne & Brazos Val-See So Pao
Green Bay & Western SystemIola & Northern
March July 1 to Mch. 31-1912. 1911. 1911-12. 1910-11.
811 728 5,272 5,251189 Dr. 82 1,294 1,200
1,036 704 6,944 6,91546 44 388 528
• 35 54 436 309
463 454 4,325 3,719649 650 5,608 4,864
386 54 1,335 2,050
386 54 1,335 2,05012 12 108 109
374 42 1,226 1,9404 4Gulf & Ship Island
March July 1 to Mch. 31-1912. 1911. 1911-12. 1910-11.$ $ $ $
120,227 136,142 1,068,572 1,108,39929.256 29,392 312,284 311,632160,547 176,580 1,499,738 1,524,85619,016 23,068 197,495 188,81731,094 30,482 268,686 266,4122,168 1,257 21,628 14,502
53,225 51,564 438,411 436,327114,406 114,742 1,001,593 977,725
46,140 61,837 498,145 547,130
46,140 61,837 498,145 547,1305.220 5,164 42,326 44,924
40,919 56,672 455,819 502,200307 307
Hoboken Manufacturers March1912. 1911.
-July 1 to Mch. 31-1911-12. 1910-11.
11,727 11,329 93,373 98,370469 638 5.493 4.594941 551 3.741 3.103153 312 2.547 2,718
8,178 7,934 08,172 71,30210.172 9,651 84.614 86,237
1,56S 1,677 8,759 12,133594 452 2.771 5,362
2,149 2,129 11,530 17,4951,373 1,357 12,362 12,215775 772 -832 5,280
I I
Idaho Northern Ry, Ltd March Julu 1 to Mch. 31-1912. 1911. 1911-12. 1910-11.$ $ $ $2,474 4,020 34,597 46,3012,996 2,874 33,130 25.4015,950 7,392 74,358 77,534674 1,834 27,839 18,813634 1,104 5.467 6,83968 690
2,071 2,22i 18,ig 19,2194.130 6.008 58,801 51,7201,819 1,384 15,556 25,814
1,819 1,384 15,556 25,814555 641 4,050 3.996
1,264 742 11.506 21,81757 58
Illinois Northern-March
1912.$
1911.$
July 1 to Mch. 31-1911-12. 1910-11.
$ $
27,165 22,130 206,279 181,438623 330 9,146 10,006
1.815 3,179 20,601 20,847190 189 2,001 1,739
11,163 11.568 95,370 99.86114,824 16,164 136,087 140,87912,341 5,965 70,191 40,558
12,341 5,965 70,191 40,5581,261 773 7,284 6,87111,079 5,192 62,907 34,686
5 5
International ez March 1912. 1911.
539,043160,972765,538115,258108,87221,607
385,974661,317
Great NorthernJuly 1 to Mch. 31-1911-12. 1910-11.
4,664.2051.233.3900,284.846655,761721,414150.165
2,429,2614,160.040
11,641 -2.429 58,667 40.584
11,641 -2,429 58,667 40,584378 332 3,402 2,989
94.221--72493,49-722,000
-2.761 55,264 37.59418
Hocking Valley-See Ches & OhioHouston & Shreveport-See So Pao
2,124.805-2,603
2,122,201192.500
71,497 1,929,7011,159Houston E & W Texas-See SoIberia & Vermilion-See So Pao
Pao
Houston & Texas Central-See So Pao Indiana Harbor Belt-See N Y Central
Digitized for FRASER http://fraser.stlouisfed.org/ Federal Reserve Bank of St. Louis
Page 13
MAY, 1919.1 RAILWAY EARNINGS 13
EARNINGS
Freight revenue Passenger revenue_ __ _Tot. Incl., other rev.
Expenses-Maint. wayMaint. of equipmentTraffic expenses__ _Transportation exp _
Tot., incl. general
Net from railroad_ _ _ _Outside operations,net
Total net revenue_ _Taxes
Final net Miles of road operated
EARNINGS
Freight revenue Passenger revenue_ _ _ _
Tot., incl. other rev.Expenses-Maint. way
Maint. of equipmentTraffic
expenses-- -
Transportation exp _
Tot., incl. general
Net from railroad__ _ _Outside operations,net
Total net revenue_ _Taxes
Final net Miles of road operated
EARNINGS
Freight revenue Passenger revenue_ _
Tot., incl. other rev.Expenses-Maint. way
MaInt. of equipmentTraffic expenses__ _Transportation exp _
Tot., inel. general
Net from railroad_ _ _ _Outside operations,net
Total net revenue_ _Taxes
Final net Miles of road operated
EARNINGS
Freight revenue Passenger revenue_ _ - _
Tot., incl. other rev.Expenses-Maint. wayMaint. of equipmentTraffic expenses_ _ _Transportation exp _
Tot., incl. general
Net from railroad_ _ _Outside operations,net
Total net revenue_ _Taxes
Final net Miles of road operated
EARNINGS•
Freight revenue Passenger revenue_ _ _ _
Tot., incl. other rev.Expenses-Maint. way
Maint. of equipmentTraffic expenses__ _Transportation cxp _
'rot., incl. general
Net from railroad__ - -Outside operations,net
Total net revenue_ _Taxes
Final net Miles of road operated
EARNINGS
Freight revenue Passenger revenue_ _ _ _
Tot., Incl. other rev.Expenses-Maint. wayMaint. of equipmentTraffic expenses_ _ _Transportation exp _
Tot., incl. general
Net from railroad_ _ _ _Outside operations,net
Total net revenue_ _Taxes
Final net Miles of road operated
EARNINGS
Freight revenue Passenger revenue- _ - -
Tot., incl. other rev.Expenses-Maint. way
Maint. of equipmentTraffic expenses__ -Transportation cap _
Tot., lnel. general
Ironton March July 1 to Mch. 311912. 1911. 1911-12. 1910-11.$ $ $ $15,114 22,926 168,994 226,025
267 408 2,615 3,67115,381 23,3341,369 1,5822,141 2,992284 282
5,121 7,751
171,61015,51421,9182,398
55,895
229,70716,65528,4012,394
75,891
10,529 14,221 110,340 137,755
Jonesboro Lake (1114, & Eastern March -July 1 to Mch. 31-1912. 1911. 1911-12. 1910-11.$ $ 5 $10,845 11,078 101,273 78,2795,276 4,878 52,627 48,96118,8453,2692,863269
6,431
17,6142,8122,238296
5,85314,399 12,639
179,00827,37628,3402,833
46,585
144,26313,16613,1852,952
45,679118,603 84,518
Joplin Union Depot February July 1 to Feb. 29-1912. 1911. 1911-12. 1910-11.
36f 3,0502
61 1,09665 1,134
4,852 9.112 61,270 91,951 4,445 4,975
4,852 9,112 61,270 91,951700 700 6,300 5,700
4,15-2 8,412 54,970 86,25112 12
Kalamazoo Lake Shore & Chicago February- July 1 to Feb. 29
1912. 1911. 1911-12. 1910-11.3 $ s 33,027 3,247 56,616 30,0942,739 3,243 44,616 41,897
6,381 7,068 107,597 76,9631,637 757 12,351 10,570957 813 8,270 7,881225 218 1,750 2,122
7,061 6,173 65,453 53,777
4,445 4,9751,117 982
60,404 59,745
60,404 59,74510,056 8,845
3,328 3,992 50,347 50,899100 83
Kanawha & Michigan March July 1 to Mch. 31-1912. 1911. 1911-12. 1910-11.$ 5 $ $
181,407 204,488 2,062,552 2,033,59124,400 26,365 259,409 269,229
211,06327,17444,4292,188
66,136
235,952 2,369,324 2,352,99020,620 277,289 242,44638,727 406,165 414,3952,193 20,106 20,550
68,754 713,594 654,424
296 1,915
296 1,915
296 1,915
Kansas City Clinton & Springfield March July 1 to Mch. 31-1912. 1911. 1911-12. 1910-11.$ $ 3 $12,833 18,282 142,634 145,63G10,998 9,828 108,646 97,32827,5314,8512,403876
13,03810,183 8,395 90,409 77,608 147,324 137,690 1,477,010 1,394,269
31,9048,3681,430356
9,526
286,17044,53523,4694,690
113,177
276,22649,42827,427'4,338.
99,88822,675 21,502 199,671 196,990
--3,802 --1,326 17,187 --644
--3,802 --1,326 17,187 =644422 396 3,448 3,534
-4,225 -1,723 13,738 -4,17854 54
Kansas City Mexico & Orientbruary July 1 to Feb. 29-
1911-12. 1910-111912. 1911.
96,480 107,782 900,819 942,55928,237 24,103 247,289 298,529132,95855,55423,8335,591
65,102
140,10427,97929,6557,915
70,129
1,215,801 1,314,110325,428 254,648235,744 264,12163,723 62,207560,419 596,847
63,738 98,261-15 22
• 63,723 98,2838,608 7,267
892,314 958,721--3 -67
892,310 958,65479,543 68,915
4,856 10,402 86,499 79,235
4,856 10,402 86,499 79,2352,000 2,000 18,000 18,000
55,114 91,016 812,767 889,738176 175
Kansas City Shrevep & Gulf Term--January July 1 to Jan. 31-
1912. 1911. 1911-12. 1910-11.*
163,854 143,728 1,261,353 1,240,330
-30,895 -3,624 -45,5a 73,780
-30,895 -3,624 -45,551 73,7807,750 6,835 47,437 38,861
-38,645 -10,459 -92,989 34,918868 740
Kansas City Southern SystemArkansas Western
March July 1 to Mch: 31-1912. 1911. 1911-12. 1910-11.
2,635 2,154 24,669 29,1961,540 1,508 13,820 13,660
4,52689555345
1,491
3,980
1,6893,183 2,742
41,495802 6,204
67945 449
11,945
45,79210,106
92407
13,62821,256 26,222
2,856 8,402 68,499 61,235154 154
Kansas City Southern SystemKansas City Southern
March-- July 1 to Mch. 31-1912. 1911. 1911-12. 1910-11.530,068 614,636 5,049,564 5,666,295118,076 129,894 1,204,686 1,258,140734,481 840,103 7,031,703 7,714,69493,011 88,479 741,618 778,603103,847 110,016 1,001,853 1,006,73126,519 24,410 241,028 • 238,514
303,212 275,531 2,508,499 2,595,890560,387 536,121 4,771,304 4,900.635
Kansas City Terminal March July 1 to Mch. 31-1912. 1911. 1911-12. 1910-11.
26,9792,7526,537
27,2102,5106,668
24,070 19,072
270.58722,75951,957
174,093 303,981 2,260,399 2,814,058
262,64032,84647,218
196,251 168,19434,357 29,283
1,342 1,237 20,238 19,570
1,342 1,237517 291
20,238 19,5704,968 4,275
824 946 15,27032 32
Kentucky & Tennessee March July 1 to Mch. 311912. 1911. 1911-12. 1910-11.$ $ $ $11,363 9,401 94,588 78,303
311 260 3,507 2,776
-7,378 -2,072
-7,378 -2,0725,506 5,493
280,323 257.618
174,093 303,981 2,260,399 2,814,05830,160 27,398 298,914 258.040143,933 276,582 1,961,484 2,556,018
827 827(See this road on page 31)Kansas Southwestern
February -July 1 to Feb. 29-1912. 1911. 1911-12. 1910-11.$ $ $ $4,918 1,796 24,791 21,854706 687 7,143 7,109
6,135 2,886 36,700 33,15-3-1,241 763 11,987 10,698424 210 2,396 3,27389 102 912 779
1,982 1,614 14.475 13.631
--9,735 5,022
4,006 3,009 31,964 30,6022,128 -/22 4,736 2,550
-9,735 5,02249.107 48.193
15,294 -12,885 -7,566 -58,842 -43,17110 10
Kentucky Highlands February July 1 to Feb. 29-1912. 1911. 1911-12. 1910-11.$ $ 3 $9,342 3,659 52,609 25,303441 463 5,432 3,812
11,782 9,815 100,4431,019 3,305 22,1461,765 256 13,130
2,050 1,535 17,8435,382 5,725 59,157
82,11012,47614,373
13,094
9.833360298
1,297
4,122 58,396464 3,68325 • 2,285
972 10,557
29,1152,381719
7.36345,590 2,180 1.710 18,383 12,164
6,399 4,090 41,286
2,128 -122 4,736 2,550535 460 4,604 3,263
1,593 -582 131 -71360 60
Kentwood & Eastern March -July 1 to Mch. 31-1912. 1911. 1911-12. 1910-11.$ $ 1 $18,524 19,175 152,470 160,076
905 1,153 9.144 11,82119,7653,1363,267
164,394
20,686 165,335 175,4573,232 29,979 37,1043,967 27,803 32,427
29 95 2134,527 37,747 44,481
11,547 12,949 102,619 121,20937,520 7,652 2,412 40.013 16,951
6,399 4,090 -41,286 -37,52020 20 180 180
6,379 4,070 11,106 :17,34010 10
Lackawanna & Wyoming ValleyMarch -July 1 to Mat. 31-
1912. 1911. 1911-12. 1910-11.5, $ $ $4,190 4,051 43,495 41,934
39,144 39,381 386,040 388,577-44,565 45,071 442,807 445,457
3,285 4,008 35,043 39,5236,854 6,386 52,712 55,474621 660 6,004 5,883
16,240 15,229 142,745 140,38328,323 27,658 248,858
8,218 77736 62,716 54,247
7,652 2,412 40,013 16,95135 23 280 184
7,617 2,389 39.732 16,7677 7
Lake Champlain & Moriah--March July 1 to Mch. 31-1912. 1911. 1911-12. 1910-11.$ S. $ $15,545 19,414 127,214 156,454
120 70 897 69518,6061,8392,736
22,5432,2792,724
150,25721,48128,964
188,69526,31027,281
3,849 5,680 37,249 51.406
8,218 7,736 62,716 54,247212 150 2,059 1,353
8,005 7,585 60.656 52,89454 54
Lake Superior & Ishpeming March -July 1 to Mch. 31-
1912. 1911. 1911-12. 1910-11.S $ $ $3,011 3,957 90,712 131,740215 149 3,440 3.106
3,4002,6068,035
943.031
253,284 8,790 11,080 92,999 109,49416,242 17,413-192 -22116,049 17,191
152
193,948 192,172-2,177 -2,323
5,9811,3646,445
953,012
98,60228,98964,8481,013
36,993
142,30739,63061.625
83247,960
14,734 12,274 146,264 162.2499,815 11,463 577258 79,200
191,771 189,8497,113 6,884
15,897 17,191 184,657 182,96522 22
Lakeside & Marblehead March July 1 to Mch. 31-1912. 1911. 1911-12. 1910-11.$ $ $ $12,479 10,632 90,659 88,648
170 165 1,522 1,51012,688 10,849 92,575 90,584
933 477 13,741 8,4771,358 481 8,362 6,383408 18 1,191 304
3,799 2.322 28,402 23,3607,077 4,470 54,487 41,528
-11,334 -6,292 -47,662 -19,942
9,815 11,463 57,258 79,200600 600 5,400 5,400
9,215 10,863 51.858 73.8007 7
Las Vegas & Tonopah March July 1 to Mch. 311912, 1911. 1911-12. 1910-11.$ $ $ $13,509 6,871 103,118 73,8562,278 2,589 26,293 29,30916,9903,3092,803788
6,940
10,6163,530a,3601,3335,709
139,86129,00621,9699,396
59,056
114,41628,68724,52411,40161,666
15,221 15,559 132,105 140.3435,610 6,379Net from railroad_ ___ 38,087 49,0551,768 -4,943 7,756 -25,926
Outside operations,net 41 41 375 379Total net revenue_ 5,610 6,379 38,087 49,055
Taxes 101 1,066 6,702 5,809 1,810 -4,901 8,131 -25,547
1,651 14,502 19.042Final net 5,312 31,385 43,246
1,6245,509 186 -6,553 -6,370 -44,590
Miles of road operated 6 6loin & Northern-See Gr Bay & West Kins-Car RR & Lum Co-See Non t So Lake Erie & Western-See N Y CentralKankakee & Seneca-See N Y Central Lack & Montrose-See Del Lack & W Lake Erie All & Wheel-See N Y CentKewau Or Bay & W-See Gr Bay & W Lake Charles & Nor-See So Pao Lake Shore & Mich So-See N Y Cent
--11.334 --6,292 --47,662 --19,9422,956 2,267 20.532 21,580
--13,951 --8,559 --68,195 --41,52224 24
Lawrenceville Branch March -July 1 to Mch. 31-1912. 1911. 1911-12. 1910-11.* $ 862 1l,447
$
245 3991,1842224220507
1,9613469459
1,022814 1,571369 390
369 390- 25 50
200 196344 3409
Lake Terminal-See U S SteelLewiston & Auburn-See Grand TrLexington Terminal-See At!
Digitized for FRASER http://fraser.stlouisfed.org/ Federal Reserve Bank of St. Louis
Page 14
14 RAILWAY EARNINGS [VOL. Lxxxxiv.
EARNINGSFreight revenue Passenger revenue_ _ _ _
Tot.. incl. other rev.Expenses-Maint. wayMaInt. of equipmentTraffic expenses Transportation exp.Tot.. Incl. general
Net from railroad_ _ -Outside operations.netTotal net revenue-Taxes Final net Miles of road operated
EARNINGSFreight revenue Passenger revenue_ _ _ _Tot., incl. other rev.Expenses-Maint. wayMaint. of equipmentTraffic expenses__ _Transportation exp..Tot.. incl. general
Net from railroad_ _ _ _Outside operations.netTotal net revenue_ _
Taxes Final net Miles of road operated
EARNINGSFreight revenue Passenger revenue- _- -Tot., inol. other rev.Expenses-Maint. wayMaInt. of equipmentTraffics expenses...Transportation exp..Tot., incl. general
Net from railroad_ _ _ _Outside operations,netTotal net revenue..Taxes Final net
Miles of road operated
EARNINGSFreight revenue Passenger revenue_ _ _ _Tot.. incl. other rev.
Expenses-Maint. wayMaint. of equipmentTraffic expenses_ _ _Transportation exp.
Tot., incl. generalNet from railroad_ _ _ _Outside operations,net
Total net revenue Taxes Final net
Miles of road operated
EARNINGSFreight revenue Passenger revenue_
Tot.. incl. other rev.Expenses-Maint. way, Maint. of equipment
Traffic expenses...• • Transportation exp.r • Tot., incl. generalNet from railroad.. _ _Outside operations,netTotal net revenue..Taxes Final net Mlles of road operated
EARNINGSFreight revenue Passenger revenue_ _ _ _
Tot., Incl. other rev.Expenses-Maint. wayMaint. of equipmentTraffic expenses__ _Transportation exp.
Tot.. Incl. generalNet from railroad.....Outside operatIons,netTotal net revenue..Taxes Final net Miles of road operated
EARNINGSFreight revenue Passenger revenue_ _ _ _Tot., incl. other rev.Expenses-Maint. wayMaint. of equipmentTraffic expenses_ _ _Transportation exp.
Leavenworth & TopekaFebruary---- July 1 to Feb. 29-
1912. 1911. 1911-12. 1910-11.$ $ $1
$,446 1.473 15,933 18,161941 911 9.781 9,745
3.2412.695990452.272
3,3882.348162252,078
35,40824.3392,03222017.579
38,97921,6232.835220
19,7186.152 4.775 45,455 45.682
-2.910 -1,386 -10,046 -6,702
Leavenworth Term Ity & BridgeJanuary July 1 to Jan. 31-
1912. 1911. 1911-12. 1910-11.
-2.910 --4,386 --10,046 -6,702540 465 4,784 3.253
-3.450 -1,851 -14.831 ---9,95556 56Lehigh & New England
March July 1 to Mch. 31-1912. 1911. 1911-12. 1910-11.$ $ $ ;75,046 69,279 600,350 615,910921 862 9,615 9.095
Lehigh Valley March -July 1 to Mch. 31-1912. 1911. 1911-12. 1910-11.$ 4 $ $2.958.479 2,665.556 24,534,070 22,982.021
299.173 287,395 3.531.668 3.364,56576,607 71.459 617,810 636,561 3,364,545 3,045,616 29.031,802 27,292,74512.239 10,351 96,131 81.619 300,802 234.424 3,223,812 2,712,86611,738 8,271 105,945 81,421 608.381 515,303 5.070,055 4,650,7121.274 918 10,568 9,053 84,905 76,036 727.027 736,783
22,796 19.689 186,121 178.262 1,175.714 997,006 9,854,007 8,968.47151,072 42,095 426,392 376.680 2,241.565 1,887.805 19.490.447 17,650,80525.536 29.364 191,417 259,880 -1.122,980 1,157,810 9.541.354 9,641,940 -23,352 -31.914 -223,593 -250,20925,535 29,364 191,417 259,880 1,099,627 1,125.896 9,317.761 9,391.7302.250 1.500 15,250 13.500 131.000 101.300 1,063,700 864.30023,285 27,864 176,167 246.380 968.627 1.024.596 8,254.061 8.527.430
169 169 1.449 1.432Liberty White Ligonier Valley
--March July 1 to Mch. 31 March July 1 to Mch. 31-1912. 1911. 1911-12. 1910-11. 1912. 1911. 1911-12. 1910-11.$ $ 5 $ $ 5 $ $7,624 9,863 57,377 73,650 11,643 6,690 75,131 63,0721.275 1.340 12.401 13,719 1.747 1.375 29,571 25,0098.9018182.1431762.808
11,2102,6472,169813,459
69,7946,34216,1451,112
24,788
87,39920,77417,967
66726,892
6,715 9,061 54.730 72,075
13,6612,0711,017573,548
8,3272,11177050
3.235
107,69417,4497,176476
29,1187,144 6.707
2.185 2,149 15,063 15,3232.185 2,149 15,063 15,323196 185 1,836 1,671
1,988 1,964 13.227 13.65240 33
Little Kanawha February- July 1 to Feb. 29-1912. 1911. 1911-12. 1910-11.
$ $ $s1,295 1.130 9,771 10,775992 884 9.795 7,459
3,0141.549
392.3401.302
5122,786 22,36411,642 12,6492,334 1.010
1.910 1,15_ 14,075 14,0303.709 3.4 5 31,438 29,438
6,517 1,620--370
91,22122,9416,212496
28,266
Lehigh & Hudson River March July 1 to Mch. 31-1912. 1911. 1911-12. 1910-11.$ $ $ 3
161,783 109.726 1,190,289 1,013,3133,453 3,180 36,709 35,666
166,467 114,302 1,247.589 1,063,90711,335 8.504 133,252 113,02722,824 18,663 171,103 152,0741,415 1,257 11,149 10,542
59,237 43,320 425,316 357,60499,395 75,258 784,942 666,561 67,072 39,044 457,647 397,346
67.072 39,044 457,647 397,3463,500 3,100 31,500 27,90063,572 35,944 426,147 369,446
96 96Letbairtell & Eastern
March July 1 to Mch. 31-1912.$
111. . 1911-12. 1910-11.$ 3
36,641 33,808 279.217 260,3879,469 11.644 102,779 96,965
48,862 48,172 405,098 378,3417,279 15,820 83,776 102,4197,804 7,819 68,030 62,184497 417 4,294 3,851
10,229 9,597 92,584 83,12627.728 35,342 265,249 270,07621,134 12,829 139,849 108,264
5 15 285 21721,139 12,844 140,134 108,4811,000 1.000 9,000 9,000
20,139 11,844 131,134 99,48196 96Litchfield & Madison
March July I to Mch. 31-1912. 1911. 1911-12. 1910-11.$ $ $ $33,523 16,575 203,856 216,46433,6832,4596,302184
6,762
16,6771,2406,687176
3,081
205,02220,84648,8941.748
37,684
219,90424,76473,4361,80139,571
58.403 62.097 16,517 12,098 115.165 145,66849,291 29,124 17,165 4,578 89,856 74,23572
6,147 1,620 49,363 29,124 311 269 2,597 2.449
5,836 1,351• 16 16Live Oak Perry & Gulf
March July 1 to Mch. 31-1912. 1911. 1911-12. 1910-11.$ $ • $ $7,771 5,730 59,722 58.681959 1,266 9.999 '14,219
8.8162.0172.494190
3,080
8,1332,6602,0001662,100
73,17919,17719,4291.57323.027
8,354 7,416 67.833--695 --1,114 --8,651 --6,839
-695 -1.114 -8,651 -6,839164 191 1.357 1,530
461 717 5,346
--860 -1,306 -10.009 -8,36930 30
Louisiana March- -July 1 to Mch. 31 -
1912. 1911. 1911-12. 1910-11.a
5.555 9,761 45.445 76,419
5.555 • 9.761 • 45,445 76.419782 • 715 • 6,255 7.256824 744• 7,393 7,484
• 1-,788 • 3.597 • 21.065 35,8873,543 5,211 36,683 53,0432.011 4,550 8,762 23,3752.011 4.550 8,762 23,375 160 96 947 773
1.851 4,453 7.815 22,60229 29Louisiana & Pacific
March July 1 to Mch. 31-1912. 1911. 1911-12. 1910-11.$ $ $ a23,549 19,142 154,068 182,427
22 60 252 36324,237 19,407 158.243 184,7012,809 2,423 15,481 16,2843,196 2.687 33,628 13,920297 8.46 7,312 8,110
6,740 6,679 52,127 58,68614,680 14,034 122,253 110,321
78,08618.40417.9041,514
20.96263,96614,119
461 717 5,346 14,119613 600 5,478 5,400-151 - 117 -131 8,71981 66
Louisiana & Arkansas March July 1 to Mch. 31-1912. 1911. 1911-12. 1910-11.$ $ $ $117,018 113,459 880.241 910,99214,825 14.359 158,318 143.379
137,009 132,508 1,081,198 1,095,93215,688 19,450 182.023 173,478• 19,937 • • 17,734 166.125 150.809• • 2,609 • 2,192 21,300 21,79136,652 • 34,778 297,860 292,36578,590 78,807 708,691 678.92258,418 53,701 372.507 417,00958,418 53,701 372,507 417.0094,233 2,825 32,700 24,22554,185 50,876 339,807 392.784255 255
Louisiana Central March -July 1 to Mch. 31-1912. 1911. 1911-12. 1910-11.5• $ $ $4,170 12,593 50,084 11,22213 60
9,557 5,373 35,990 74,379
17.165 4.578 89,856 74,235500 1,200 8,700 10,80046.766 26,674 15,555 3,378 81.156 63,43543 43
Lorain & West Virginia March- July 1 to Mch. 31-1912. 1911. 1911-12. 1910-11.$ $ $ $20,365 11,677 182,807 112,14620,3671,135124
11,6849986722713,339 3,543
4,691 5.563
183,30917,8599,3921,506
38,406
113,0999,1505,2562,658
24,78568,266 42,559
15,676 6,121 -115,043286 544
70,540291
15,676 6,407 115,587 70,831515 466 4,642 4,190
15,160 5,940 110,945 66.64034 34Louisiana & Northwest
March July I to Mch. 31-1912. 1911. 1911-12. 1910-11.
$ $ $ls7,754 23,568 173,876 179,1093,088 3,316 37,216 41,64922,150 28,239 224,332 233,9996,203 7,293 59,539 43,6543,483 4,488 35,095 32,894493 410 4,307 4,092
8,291 10,437 73,837 79,06820,038 24,500 190,779 176,3422,111 3,739 33,553 57,6572,111 3,739 33,553 57,6571,050 1,000 9,450 8,8501,061 2,739 24,103 48,807121 121
Louisiana Ry & Navigation March -July 1 to Mch. 31-1912. 1911. 1911-12. 1910-11.$ $ $ $124,247 107,986 1,114,177 989,02118,397 18,027 208,917 180,965
11,164 19,850 85.147 171,152 153,069 134,243 1.427,060 1,278,5123,886 7,324 33,144 52,035 28,223 19,076 221,335 217,2102.583 4,633 22,047 34.659 15,314 20.060 131,213 157,091343 393 3,113 3,470 6,364 4,746 55,049 44,2752,942 4,610 24.412 45.414 65,297 53,445 561,208 524,34710.220 19,113 87.466 141,612 120,840 103,182 1,028,812 997,943
943 737 -2,318 29,540 32,229 31,060 398,247 280,5689,557 5,373 35,990 74,379321 204 2,191 1,920
9.235 5,169 33,79873 73Macon & Birmingham
March July 1 to Mch. 31-1912. 1911. 1911-12. 1910-11.$ $ $ $12,051 12,817 85,716 82,4653.498 3.349 38,630 37,57716,2882,6751,0644745,578
16,8192,7481.6945576.194
943 737 -2,318262 240 2,226 29,540 32,229 31,066 398,247 280,5681,860 5,000 4,400 43,200 39,600
72,459 681 497 -4,544 27,68042 42Macon Dublin & Savannah March July 1 to Mch. 31-1912. 1911. 1911-12. 1910-11.$ $ $ $42,590 27,402 293,085 259,4499,874 9,799 107,359 101,714
131,059 125,946 54,25324.113 27,704 6,23313.453 -15,616 3.6234,755 7,616 2,90346.600 46.860 17,667Tot.. Incl. general 10,564 12,045 96,547 105.950 32,347
Net from railroad_ _ __ 5.723 4,773 34.511Outside operations,netTotal net revenue__ 5.723 4,773Taxes _., . 612 581 Final net 5,111 4,192 28,795 14.656 20,300Miles of road operated 105 • 105 92Little Falls & Dolgev-See N Y Central Louisiana Western-See So PaoLong Island-S Penn RR Louisv & Jeff Bridge-See N Y CentralLouis ana Southern-See St L & San Fr Louisv 5c Nashv-See Atlantic Coast
19,991 21,90634,511 19.991 21.9065,716 5,334 1.605
27,229 26,660 355,047 240,968350 350Manistee & Northeastern March July 1 to Mch. 31-1912. 1911. 1911-12. 1910-11.a $ $ $45,287 43,189 341,723 287,1476.775 7,226 77,680 75,714
48,598 416,942 374,598 54,975 52,849 445,903 380,9904,627 47,122 56,271 4,880 4,900 58,741 69,2714.775 44,806 40,764 8.363 5,491 71,548 62,9132,716 25,858 23,060 915 910 8,557 7,81413,662 130,540 108,185 18,996 18,435 158.732 152,89127,679 264,889 241,863 34,841 31,683 314,161 310,56020,918 152,053 132,735 20.133 21,166 131,742 70.42920,918 152,053 132.735 20,133 21,166 131,742 70,4291,030 12,318 9,843 3.130 2,799 28,173 25,19519,888 139,735 122,892 17.003
_ 18,366 103,568 45,23492 18:3 18:3Louisv & Wadley-See Cent of Georgia Maine Central-See Boston & MaineLouisv Hend & St 1,-See Atl Coast Manistique & L Sup-See Det Tol & IMacoupin County-See Chi° & N W Manufacturers-See Penn RR
Digitized for FRASER http://fraser.stlouisfed.org/ Federal Reserve Bank of St. Louis
Page 15
MAX, i912.1 RAILWAY EARNINGS is
EARNINGS
Freight revenue Passenger revenue_ _ _Tot. Incl. other rev_
Expenses-Maint. wayMaint. of equipmentTraffic expenses__ _Transportation exp.
Tot.. incl. general
Net from railroad_ _ _ _Outside operations,netTotal net revenue
Taxes Final net
Mlles of road operated
EARNINGS
Freight revenue Passenger revenue.- - -
Tot., incl. other rev.Expenses-Maint. wayMaint. of equipmentTraffic) expenses _ - -Transportation cap.
Tot.. Incl. general
Net from railroad.... _Outside operations,netTotal net revenue_
Taxes •Final net
Miles of road operated
EARNINGS
Freight revenue Passenger revenue_ - _
Tot., incl. other rev.Expenses-Maint. wayMaint. of equipmentTraffic expenses...Transportation exp.
Tot., incl. general
Net from railroad_ _Outside operations.net
Total net revenue_ _Taxes
Final net Miles of road operated
EARNINGS
Freight revenue Passenger revenue_ -.
Tot., Incl. other rev.Expenses-Maint. way
Maint. of equipmentTraffic expenses_ - -Transportation exp..
Tot., incl. general
Net from railroad....Outside operations,net
Total net revenue_ _Taxes
Final net Miles of road operated
EARNINGS
Freight revenue Passenger revenue_ _ _
Tot., incl. other rev.Expenses-Maint. wayMaint. of equipmentTraffic expenses__ _Transportation cap.
Tot.. Incl. general
Net from railroad_ _ _ _Outside operations.net
Total net revenue Taxes
Final net Miles of road operated
EARNINGS
Freight revenue Passenger revenue_ _ _ _
Tot., Incl. other rev.Expenses-Maint. wayMaint. of equipmentTraffic expenses..._Transportation exp..
Tot., Incl. generalNet from railroad_ _ _ _Outside operations.netTotal net revenue_
Taxes Final net
Miles of road operated
EARNINGS
Freight revenue Passenger revenue_ _ _
Tot.. Incl. other rev.Expenses-Maint. wayMaint. of equipmentTraffic expenses.. _Transportation exp..
Tot., incl. general
Net from"rallroad_ _Outside operations,net
Total net revenue_Taxes
Final net 5,682Mlles of road operated 41Maryland Del & Va-See Penn RRMcKeesport Conn-See U S SteelMercer Valley-See U 3 Steel
Manitou & Pikes Beak March- -July 1 to Mch. 311912. 1911. 1911-12. 1910-11.$ 2. I $
630 73284,279 80.797
25 1912,579 1,164
88.67310,53121,921
73 9 16.52613.384 1,902
--13,384 -1,902
--13.384 -1.902364 443
85,2745.2716,453
13,80658,986 35.919
Manufacturers Junction March July 1 to Mch. 31-1912. 1911. 1911-12. 1910-11.
2,285 2,737 18,213 19,355
10,0281,8361,106216
3.592
9,0111,50271154
3,878
82,71918,5799,3161,023
34,032
80,28518,4457,844735
39,9197,121 6,423 66,732 70,179
29,686 49,354
29,686 49,3543,300 4.228
--13,749 -2,345 26,386 45,1268Marshall & East Texas
March July 1 to Mch. 31-1912. 1911. 1911-12. 1910-11.
$10,308 15,348 121,536 125.3182,071 2,168 23,004 23,022
2,907 2,588 15,987 10.105
2,907 2,588 15,987 10,105700 1,118 7,854 10,063
2,207 1,470 8,13219 19
Maryland & Pennsylvania March July Ito Mch. 31-1912. 1911. 1911-12. 1910-11$ $ $ $20,320 21,949 170,109 172,7939,968 9,250 105,815 105.417
Manufacturers Ry of St Louis March July 1 to Mch. 31-1912. 1911. 1911-12. 1910-11.
20,9431,4341,638110
6,093
17,4292,0422,852144
4,647
178,715 168,83519.409 24,44918,976 20.1501,050 1,436
49,169 42.01211,297 11.784 133,244 122,387
9,645 5,644 45.471 46,448
9.645 5.644 45.471 46,448753 570 5,694 5.244
42 8,892 5,074 39.776 41,2032 2
Maryland Electric Rys March .July 1 to Mch. 31-1912. 1911. 1911-12. 1910-11.$ $ 1 $2,976 3.437 39,920 28,40517,743 11.285 135,179 113,166
13,404 18,648 154,373 158,159 35,903 36,814 326,529 326,603 21,554 15,503 184,512 150,0565,006 4,410 48,742 39,747 5,069 4,445 58,945 40,176 2,335 2,166 23,392 21,1411,937 2,401 19,052 23,680 4,669 3,701 38,971 33,051 3,811 3,319 33,232 30,492558 402 3,235 2,430 647 510 5,412 5,187 692 249 3.073 2,806
7,134 6,456 59,007 61,903 13,660 13,196 119,969 115,517 10,324 8.982 91,329 83,062
15,551 14,509 139,203. 137,133 25,953 23,742 240.022 210,320 19,039 16.632 166,705 152,252
--2,146 4,139 15,170 21,026 9,949 13,071 86.506 116,282781 1,207 -1,027 -3,044
2,515 • --1,128 17,807 --2.195
-2,146 4,139 15,170 21,026 9,949 13,071 87,287 117,490 2,515 -1,128 16,779 -5,239825 393 3,699 2,736 973 1,155 11,023 9.371 1,056 1,050 9,480 9,491
-2,971 3,746 11,470 18,28992 92
MattoonFebruary- -July 1 to Feb. 29-
1912. 1911. 1911-12. 1910-11.
1,342 1,699 10,289 13,629212 225 1,918 1,931
1,63219480
1,992224147
758 682
12,8483,7401,916
16,1992.959603
6.750 6,695
1,392 1,342 14,724 12,421
239 650 --1,876 3,777
239 650 --1,876 3,77769 69 557 526
170 580 -2,433 3,25129 29
Midland Valley March -July 1 to Mch. 31-1912. 1911. 1911-12. 1910-11.
7*1,960 78,301 71,299 619,06935,578 36,291 338,316 308,700
114,86922,36115,6422,769
36,741
121,408 1,124,314 1,005,51121,611 236,616 183,10918,656 175,555 154,7882,429 27,009 19,845
34,840 353.757 292,89284,370 83,852 850.449 714,408
30,499 37,555 273,864 291,103--184 2.757 558 11,48730.314 40,313 274,423 302,5905,785 5,475 52,068 49,27924,529 34,837 222,354 253,311
373 323
Minneapolis & St Louis SystemMinneapolis & St Louis
March -July 1 to Mch. 31-1912. 1911. 1911-12. 1910-11.488,675 599,910 4,278.969 4,945,503123.250 136,898 1,296,167 1,366.933
651,80466,87399,15918,215
295.419
776,503 5,959,808 6,686.15759,218 714,561 719,02596,998 887,680 955,87317,981 162,895 163.751
296.400 2.706,505 2,703,525
500,218 491,557 4,662,493 4,755.768
151,586 284 ,94-5 1,297,314 1,930,38860 -39 -268 -307
151,647 284,906 1,297,045 1,930,08025.728 27,020 255.281 263,956125,918 257,885 1,041,764 1,666,124
1,585 1.585(See this road on page 31)
Mississippi Central March July 1 to Mch. 31-1912. • .1911. 1911-12. 1910-11.
47,262 51,024 416,500 450,12812,521 12,926 126,373 137,97967,9049,79913,350
87218,965
71,80512,04112,3461,038
15,666
615,61794,161120,1458,224
141,308
645,987109,955108,7229,261
140,71747,494 45,378 403,128 402,841
20,409 26,426 212,488 243,145
20,409 26,426 212,488 243,1452,200 2,500 23,600 19,50018,209 23,926 188,888 223,645
164 164(See this road on page 31)
Missouri & Louisiana March July 1 to Mch. 31-1912, 1911. 1911-12. 1910-11.
13.562 12,995 76.119 141,646454 483 3,919 3.007
8,975 11,916 76,264 108,11979 79
McCloud RiverMarch -July 1 to Mch. 31-
1912. 1911. 1911-12. 1910-11.$ a $ a12,991 13,891 229,046 295,3401,729 1,725 15,574 16,104
15,2264,7312,454
584,197
16,0155,4794,303
234,682
13,234 15,505
1,991 510
1,991 5101,704 372
249,40836,47948,047
21662,403
316,69953,34460,103
38678,203
168.094 210,046
81,313 106,653
81,313 106,65315,336 3.355
287 13778 78
Mineral Point March 1912. 1911.$ $6,676 6,407679 554
7,964 7,266534 556667 1,041179 85
2,866 2,913
65,977 103,297
& NorthernJuly 1 to Mch. 31-1911-12. 1910611.
58,202 71,2186,625 5,91668,84410,04310,5571,481
26,647
80,0336,74412,5551,077
27,6634,663 5,347 55,893 55,144
3,300 1,919 12,951 24,888
3,300 1,919 12,951 24,888290 250 2,610 2,250
3,010 1,669 10,341 22,638• 30 30
Minneapolis & St Louis SystemRailway Transfer Co of Minn
March July 1 to Mch. 31-1912. 1911. 1911-12. 1910-11.
1,458 -2,522 7,299 -14,73126 26
Memphis Dallas & Gulf March July 1 to Mch. 31-1912. 1911. 1911-12. 1910-11.$ $ $ $16,747 9,365 132,082 87,9812,206 1,967 21,411 19,70320,1972,3691,782444
3.567
12,2591,5652,079588
2.850
• 167,39123,78014.4223,26028,572
118,11220,94415,6433,77430,816
9,601 7,885 80.529 78,630
10,595 4,374 86,861 39.4811,429
10,595 4,374 86.861 40,9111,020 504 8.643 6,1049,574 3,870 78,218 34,807
93 68
Minneapolis & Rainy River March -July 1 to Mch. 31-1912. 1911. 1911-12. 1910-11.1 $ $ $22,048 16.850 95,667 165,8571.420 1.461 11.104 8,690
24,1531,9481,025
5,665
18,6322,2831,655
136.304
110,95019.0246.130
3125,881
179,82827.33416,776
5746,494
9,406 11.133 57.310 98.403
14,747 7,498 53,639 81,424
14,747 7,498 53,639 81,424977 745 4,466 7.191
13,770 6,752 49,172 74,23390 97
Minneapolis Eastern March -July 1 to Mch. 31-1912. 1911. 1911-12. 1910-11.$ $ $ $
15.044 16.961 146.067 149.811 6,069 4,724 49.184 49,634248 267 6.544 4.995 186 147 1.813 4,858326 374 5.814 5.186 559 160 4,056 2,523
5.930 7.139 57.662 60.7416.505 7.780 70.021 70,9238,539 9,180 76,045 78,887
8,539 9,180 76,045 78,887601 678 5,842 5.992
• 7,937 8,501 70,203 72,895ii 11Mississippi River & Bonne Terre
March July 1 to Mch. 31-1912. 1911. 1011-12. 1910-11.$ $ a $50,596 43,952 434.464 490,0566,610 7.239 69,223 78,91963,3955,6989,757872
22,20042,781
20,613
20,613
56,3998,2279,255858
25,047
564,556'64,01569,6408,522
192,259
615,57476,41483,7208,634
201,18747,700 378.089 410,449
8,699 186.467 205,125
8,699 186,467 205,1251,541 1,545 13,892 13,556
19,071 . 7,153 172.574 191,56864 64
Missouri & North ArkansasMarch July 1 to Mch. 31-
1912. 1911. 1911-12. 1910-11.$ $ $ S47,860 46,217 413,897 409,83022,394 22,111 238,684 219,941
1.916 1.331 15,370 17,3462,964 1.903 24,015 27.203
3,105 2,821 25,168 22,430
3,101 2,821 25.168 22,430242 189 1,967 1,985
2.862 2,632 23.201 20,4451 1
Missouri & Illinois Bridge & Belt February July 1 to Feb. 29-
1912. 1911. 1911-12. 1910-11.$ $ a a3,722 4,127 32,464 38,981216 201 1,641 1,745
. 3,954 4,371 34,285 42,472152 164 2,000 2,54286 144 3,718 1,6495 81
891 868 7,201 7,1411,315 1,340 14,622 12,6732,63-8 3,030 19,663 29,70
2,638 3,030 19,663 29.799625 625 5,000 5,000
2,013 2,405 14.663 24,7993 2
Missouri Kansas & Texas SystemMissouri Kansas & Texas •
March July 1 to Mch. 31-1912. 1911. 1911-12. 1910-11.851,618 893,362 8,539.645 8,829,276297.338 384.279 3.287.156 3.703.273
14,058 13,516 80,741 145,259 75,970 74,428 706,768 680,438 1,233,125 1,372.521 12,590.095 13.363.6541,429 1,049 11,083 11,164 31,059 20,701 224,699 191,999 129,628 155,346 1,542,182 1,718.1882,035 1,572 16,897 16,554 13,595 14,823 107,703 113,935 214,179 219,769 1.833,822 1,901,085
17 17 194 99 3,460 2.198 31.899 19,133 35,761 40,231 319,810 338,1034,374 3,804 26,633 36,732 29,366 28,749 270,857 256,298 487,367 483.636 4,167.202 4.482,2438,260 6,880 58,214 67,838 81.167 70.579 669.046 611,377
5,797 6,636 22,527 77.420
5,797 6.636 22,527 77,420114 25 1,034 946
-5,196 3,849 37,721 69,061
--5,1965,000 4.250 45,000 38,250
6,610 21,492 76.473 -10,19641 365Michigan Air Line-See Grand TrunkMichigan Central-See N Y CentralMiddletown & Humm -See Reading
3,849 37,721 69,061
906,771 942.805 8.236.488 8.8348.36
---a26,354 429.716 4,353.606 4,528.818---2,915 -349 --19,845 451323,439 429,366 4,333.761 4.529,27052,000 58.500 500.926 522.083
-400 -7,278 30,811 271,439 370.866 3,832,835 4.007,187365 1,744 1,736
Midland Term-See Cripple Creek Cent Minneapolis Western-See Great NorMineral Range-See Canadian Pacific Minnesota & Internat-See Nor PaoMinn St Paul & S S M-See Can Pao Mo Kan & Tex of Tex-See Mo K & T
Digitized for FRASER http://fraser.stlouisfed.org/ Federal Reserve Bank of St. Louis
Page 16
16 RAILWAY • EARNINGS [VoL. Lxxxxiv.
EARNINGS
Freight revenue Passenger revenue__ _ _
Tot., incl. other rev.Expenses-Maint. way
Maint. of equipmentTraffic
expenses_- _
Transportation exp _Tot., incl. general
Net from railroad_ _Outside operations,net
Total net revenue Taxes
Final net Mlles of road operated
EARNINGS
Freight revenue Passenger revenue_ _ _ _
Tot., Incl. other rev.Expenses-Maint. way
Maint. of equipmentTraffic expenses__ _Transportation exp _
Tot., Incl. generalNet from railroad_ _Outside operations,net
Total net revenue_ _Taxes
Final net Miles of road operated
EARNINGS
Freight revenue Passenger revenue_ _ _ _
Tot., incl. other rev.Expenses-Maint. wayMaint. of equipmentTraffic expenses__ _Transportation exp _
Tot., incl. generalNet from railroad_ _ _ _Outside operations,net
Total net revenue_ _Taxes
Final net Miles of road operated
EARNINGS
Freight revenue Passenger revenue..._ _
Tot.. incl. other rev.Expenses-Maint. way
Maint. of equipmentTraffic expenses__ _Transportation exp _
Tot., incl. generalNet from railroad.. _ _ _Outside operations,net
Total net revenue Taxes
Final net Mlles of road operated
EARNINGS
Freight revenue Passenger revenue_ _ _ _Tot.. incl. other rev.
Expenses-Maint. wayMaint. of equipmentTraffic expenses__ _Transportation exp _
Tot., incl. general
Net from railroad_ _ _ _Outside operations,net
Total net revenue_ _Taxes
Final net Miles of road operated
EARNINGS
Freight revenue Passenger revenue_ __ _Tot , incl. other rev.
Expenses-Maint. wayMaint. of equipmentTraffic expenses_ _ _Transportation exp..
Tot., incl. generalNet from railroad_ _Outside operationsmet
Total net revenue_ _Taxes
Final net Miles of road operated
EARNINGS
Freight revenue Passenger revenue_ _ _ _
Tot., incl. other rev.Expenses-Maint. way
Maint. of equipmentTraffic expenses__ _Transportation exp _
Tot.. incl. generalNet from railroad_ _ _ _Outside operations,netTotal net revenue_ _
Taxes
Missouri Kansas & Ineluls SystemMissouri Kansas & Texas of Texas March July 1 to Mch. 31-1912. 1911. 1911-12. 1910-11.412,433 413,465 5,308,274 5,170,863245,441 316,999 2,831,955 2,902,293719,280114,650123,53926,131
490,889783,109
791,351 8,677,175 8,585,203179,049 1,815.112 1,285,21869,704 891,196 605,54322,333 222,489 206,229
457,447 4,530,923 4,028,323759,197 7,731,332 6,440,249
--63,828 32,154--2,132 --336-65,960
21,33731,81822,500
Missouri Kansas & Texas SystemTexas Central
March July 1 to Mch. 31-1912. 1911. 1911-12. 1910-11.39,686 45,260 455,417 462,84717,202 23,480 •- 230,062 269,544
Missouri Kansas & Irmims System' Total Company
March-------- July 1 to Mch. 31 -1912. 1911. 1911-12. 1910-11.
1,303,737 1,352,087 14,303,336 14,462,990559,981 724,758 6,349,173 6,875,110
63,866 77,225 744,407 797,838 2,016,271 2,241,097 22,011,677 22,746,6958,139 13,940 82,019 119,866 252,417 348,335 3,439,283 3,123,272
' 4,072 12,073 71,512 95,957 341,700 301,546 2,796,530 2,602,5851,451 1,281 11,635 12,918 63,343 63,845 553,934 557,250
24,444 36,474 270,077 277,176 1,002,700 977,557 8,968,202 8;787,74243,638 69,538 486,805 544,758 1,733,518 1,771,540 16,454,625 15,819,843
945,843 2,144,954-8,071 -5,935937,771 2,139,018243,974 202,101
-87,298 9,318 693,797 1,936,9161,345 1,348
Missouri Kansas & Texas SystemWichita Falls & Northwestern
March July 1 to Mch. 31-1912. 1911. 1911-12. 1910-11.29,779 33,729 463,149 524,24815,380 18,793 192,886 174,32649,35111,8658,8482,168
28,913
56,0727,4239,0421,461
28,696
700,351103,931102,68716,131
253,798
724,88453,38159,80811,129
216,04754,761 48,752 504,545 '359,239
-0,409 7,319 195,806 365,645
-5,409 7,319 195,806 365,6453,439 2,288 27,588 20,596
-8,848 5,031 168,217 345,049228 210
Missouri Pacific SystemMissouri Pacific
March- July 1 to Mch. 31-1912. 1911. 1911-12. 1910-11.
1,292,178 1,381,784 13,221,370 13,122,336304,798 355,744 3,506,204 3.582,184
1,751,094245,244232,89659,294
971,719
1,912,178 18,402,237 18,402,733245,313 3,186,698 2,782,886253,041 3,354,969 3,038,32455,517 533,476 529,821
1,004,238 8,613,793 9,188,1351,587,217 1.628,395 16,331,544 16,169,440163,876 283,783 2,070,693 2,233,293-2,181 -2,885 -32,081 -25,104161,695 280,898 2,038,612 2,208,189103,000 83,500 784,194 751,50058,695 197,398 1,254,418 1,456,6893,915 3,920
Missouri Pacific SystemArkansas Central
March July 1 to Mch. 31-1912. 1911. 1911-12. 1910-11.
4,521 4,375 58,923 49,4472,659 2,686 30,532 29,7087,8561,72399873
2,790
7,6431,18982460
2,921
94,23713,39411,759
92525,503
83,95311,3709,605680
26,5246,177 5,597 57,570 53,551
20,228 7,686 257,602 253,00 282,754 469,556 5,557,051 6,926,852311 764 2,757 -5,047 -364 -27,152 -2,727
20,228 7,998 258,366 255,8383,705 2,908 38,102 29,41216,522 5,090 220,264 226,425
308 308
Missouri Kansas & Texas SystemWichita Falls & Southern
March- July 1 to Mch. 31-1912. 1911. 1911-12. 1910-11.
5,001 5,623 48,078 68,6851,439 1,601 13,814 17,5267,0581,345521128
2,511
7,6811,771477171
2,757
66,7359,2655,3921,755
22,022
91,54712,2812,7881,332
22,4914,780 5,364 40,983 40,6282,277 2,316 25,751 50,919
2,277 2,316 25,751 50,919785 370 4,912 3,330
277,707 469,182 5,529,898 6,924,12677,042 83,908 783,002 753,596
200,663 385,274 4,746,896 6,170,5283,397 3,392(See this road on page 31)Missouri Oklahoma & Gulf March -July 1 to Mch. 31-1912. 1911. 1911-12. 1910-11.5 $ * $52,994 63,859 581,419 453,7526,697 8,973 90,477 100,95462,68515,75316,3914,06053,128
74,97816,68116,0073,011
33,841
693,262101,430133,19331,449
306,05994,602 73,166 605,925
--31,917.182
-31,7343,074
1,491 1,946 20,83956 56
Missouri Pacific SystemSt Louis Iron Mountain & Southern March July 1 to Mch. 31-1912. 1911. 1911-12. 1910-11.
1,856,031 1,773,898 16,827,546 15,738.169487,231 495,197 4.656,193 4,648,759
2,538,065 2,434,473 23,047,204 21,867,485210,098 167,728 3,638,878 3,062,945267,581 249,482 3,204,578 2,898,30960,035 53,091 483,800 498,714922,162 485.371 7,543,166 7,860,127
1,541,377 1,430,832 15.517,377 15,011,478
1,811 87,337305 2,688
2,116 90,0255,931 47,666
573,11097,248'131,31125,767
251,911527,259
45,8502,600
48,45153,379
47,588 --34,809 --3,814 42,358 --4,928247 212Missouri Pacific System
Total Company March July 1 to Mch. 31 -1912. 1911. 1911-12. 1910-11.
3,148,209 3,155,682 30,048,916 28,860,505792,029 850,941 8,162,397 8,230,943
4,289,159 4,346,651 41,449,441 40,270,218442,994 413,041 6,825,576 5,845,831326,875 502,523 6,559,547 5,936,633119,329 108,608 1,017,276 1,028,535
11,893,881 1,889,609 16,156,959 •17,048,2623,128,594 3,059,227 31,848,921 31,180,918
996,687 1,003,641 7,529,826 6,856,006-3,342 -4,069 -48,267 -33,095993,344 999,571 7,481,559 6,822,910118,315 88,416 801.315 717,784875,029 911,155 6,680.244 6,105,126
3,314 3.313
Missouri Pacific SystemNatchez & Southern
March July 1 to Mch. 31-1912. 1911. 1911-12. 1910-11.
Dr75 483 5,044 3,835740 3,369 38,211 34,307565 454 3,903 4,194
167 810 661171 15 708 394
1,326 1,662 12,868 13,7852,231 ' 2,499 19,538 20,636
1,678 2,046 36,667 30,401
1,678 2,046 36,667 30,4011,000 500 5,500 4,430678 1,546 31,167 25,97146 46Monongahela Connecting March July 1 to Mch. 31-1912. 1911. 1911-12. 1910-11.$ $ $ $
82,808 70,258 654.922 650,6176,169 6,039 56,158 61,80813,316 12,110 102,712 103,864
300 300 2,706 2,70940,769 36.401 315,553 334,11563,348 57,466 502,977 525,94319,460 12,791 151,945 124.673
--1,491 870 18,673 13,670
-1,491 870 18,673 13,67050 33 362 297
1,160,563 1,287,424 9,600,519 9,089,299---5,523 --6,954 -80,348 ---58,199
1,155,039 1,280e469 9,520,171 9,031,099221,315 171,916 1,585,509 1,469,284933,724 1,108,553 7,9:l,662 7,561,815
7,229 7,233
Missouri Southern March July 1 to Mch. 31-1912. 1911. 1911-12. 1910-11.$ $ $ $11,803 13,625 99,540 106,480
920 924 8.953 9,36913,536 15,573 115,435 123,2742,038 1,145 14,976 15,966901 2,163 6,439 11,99331 44 346 364
3,094 3,298 25,117 31,6797,034 7,653 55,584 70,0956,502 7,920 59,851 53,178
-1,541 837 18,310 13,3732 2
Montana Wyoming & Southern March July i1o Mch. 311912. 1911. 1911-12. 1910-11.$ $ $ $12,608 9,094 115,488 100,789
260 349 2,816 2,85713,0621,5191,205
502,766
9,6401,53093654
2,598
120,42014,91710,624
72124,263
6,502 7,920 59,851 53,178300 136 2,700 1,231
6,202 7,783 57,151 51,94753 53
Montour March-- July 1 to Mch. 31-1912. 1911. 1911-12. 1910-11.$ $ $ $11,493 7,504 107,947 92,4081,161 1,233 12,208 12,645
106,30713,1299,565582
22,9076,560 6,571 61,438 61,021
6,502 3,068 58,981 45,286
19,460 12,791 151,945 124,6731,545 1,225 16,678 11,815
17,910 11,566 135,267 112,8576 6
Montpelier & Wells River March July 1 to Mch. 31-1912, 1911. 1911-12. 1910-11.$ $ $ $15,592 15,624 129,793 128,9534,848 3,865 50,288 50,91221,991 20,902 193,428 192,3613,282 3,337 29,571 29,3001,946 1,843 19,625 20,677203 296 2,990 2,802
10.637 7,527 73,040 61,49416,867 14,004 131,238 123,6945,124 6,897 62,190 68,666
5,124 6,897 62,190 68,666750 600 6,092 6,095
6,502 3,068 58,981 45,286374 284 3,101 2.322
6,128 2.784 55,880 42,96432 32
Morgantown 85 KingwoodJanuary July Ito Jan. 31
1912. ' 1911. 1911-12. 1910-11.$ $ $ $
4,374 6,297 56,098 62,57145 49
Natchez Columbia & Mobile February July 1 to Feb. 29-1912. 1911. 1911-12. 1910-11.$ $ $ $8,763 9,548 57,735 62,574116 143 1,302 1,416
9,214 10,097 62,002 66,7752,426 2,049 18,130 17,8372,206 2,385 12,810 14,591
91 20 93 692,806 3,191 20.331 23.4428,066 8.268 56,573 60,1181,148 1,828 5,428 6,657
1,148150
Final net 998Miles of road operated 30
Mobile & Ohio-See SouthernMonongahela-See PennsylvaniaMonroe-See Atlantic Coast
Nevada-California-Oregon SystemNevada-California-Oregon
March July 1 to Mch. 311912. 1911. 1911-12. 1910-11.14,133 8,806 143,025 146,67813,697 7,245 91,722 78,05830,5566,1384,293578
6,898
18.7417,5133,638622
5,90019,877
259,31072,94533,1345,734
58,603
250,02668,44229,6335,099
50,720
13,182 9,223 125,574 110,0781,926 2,221 29,542 31,3221,599 982 8.958 8,451100 100 927 905
2,785 2,516 25,148 22,5976,976 6,385 69,820 68,4956,206 2,837 55,753 41,583
6,206 2,837 55,753 41,583225 200 2,375 2,100
5,981 2,637 53,378 39,48313 13
Munising Marquette & Southeastern March July 1 to Mch. 31-1912. 1911. 1911-12. 1910-11.$ $ $ $26,396 22,866 288,143 282,4244,350 4,436 46,338 50,821
32,955 30,301 363,890 358,1194,027 4,052 55,221 65.0974,954 5,233 38,875 49,503208 196 2,688 1,881
9,846 9,787 06,982 108,741 20,109 20,301 204,496 235,06212,845 9,999 159,393 123,057
12,845 9,999 159,393 123,0572,329 2,387 21.963 20,29710,515 7,612 137,430 102,760
132 132Nevada-California-Oregon System
Sierra & Mohawk February July 1 to Feb. 29-1912. 1911. 1911-12. 1910-11.
532 9,832163 2,608863209216
60119,861 188.276 173,536
14,0084,04378150
6.640850 11,821
10,678 -1,119 71,034 76,48959 64
1,828 5,428 6,657 10,737 -1,119 150 1,200 1,150 1.821 1,703
1,678 4,228 5,507 8,91630 237Morencl Southern-See El Paso & S W
RR Morg Li& Tex RR & SS-See Sou Pao
71,099 78,48916,394 15,331
13 2,186
13 2,186252 2,023
-2,823 54,704 61,158184
Morris Terminal-See Rook IslandMt Oilead Sh Line-See N Y Central
239 16336Nashv Chatt & St Louis-See Atl CoastNatchez & Sou-See Missouri Pacific
Digitized for FRASER http://fraser.stlouisfed.org/ Federal Reserve Bank of St. Louis
Page 17
MAY, 1912.1 RAILWAY EARNINGS 17
EARNINGS
Freight revenue Passenger revenue__ -
Tot., Incl, other rev.Expenses-Maint. way
Maint. of equipmentTraffic expenses_ _Transportation exp_
Tot., Incl. general
Net from railroad_ _ _ _Outside operations,net
Total net revenue_ _Taxes
Final net Miles of road operated
EARNINGS
Freight revenue Passenger revenue-
Tot., incl. other rev.Expenses-Maint. way
Maint. of equipmentTraffic expenses__ -Transportation exp.
'rot., Incl. general
Net from railroad_ - - -Outside operations,net
Total net revenue Taxes
Final net Mlles of road operated
EARNINGS
Freight revenue Passenger revenue__ _
Tot., Incl. other rev.Expenses-Maint. way
MaInt, of equipmentTraffic expenses__ _Transportation exp.
Tot., incl. general
Net from railroad. _ _ _Outside operatIons,net
Total net revenue Taxes
Final net Mlles of road operated
EARNINGS
• Freight revenue Passenger revenue__ _
Tot., incl. other rev.Expenses-Maint. way
Maint. of equipmentTraffic expenses__ _Transportation exp.
'rot., Incl. generalNet from railroad_ _ _ _Outside operations.net
Total net revenue_ _Taxes
Final net Miles of road operated
EARNINGS
Freight revenue Passenger revenue__ _
Tot., Incl. other rev.Expenses-Maint. way
Maint. of equipmentTraffic expenses Transportation exp.
Tot., incl. general
Net from rallroad.._ _ _Outside operations,net
Total net revenue Taxes
Final net Miles of road operated
EARNINGS
Freight revenue Passenger revenue__ _
Tot., incl. other rev.Expenses-Malta. way
Maint. of equipmentTraffic expenses__ _Transportation exp.
Tot., incl. general
Net from railroad__ _ _Outside operations,net
Total net revenue_ _Taxes
Final net Mlles of road operated
EARNINGS
Freight revenue Passenger revenue.._ _
Tot., incl, other rev.Expenses-Maint. way
Maint. of equipmentTraffic expenses__ _Transportation exp.
Tot., incl. generalNet from railroad_ _ _ _Outside operations,net
Total net revenue Taxes
Final net Mlles of road operatedNew Jersey & New York-See Erie
Nevadhl. County Narrow Gauge------March -July 1 to Mch. 31-
1912. 1911. 1011-12. 1910-11.$ $ $ $4,189 4,789 45,134 49,1103,593 3,838 39,650 41,160
8,5542,0571,613
382,574
9,5562,5851,170
672,708
91,13618,42912,248
58422,464
97,50619,82513,384
78623,562
7,194 7,365 62,157 65,655
Nevada Northern March July 1 to Mch. 31-1912. 1911. 1911-12. 1910-11.$ $ $ $
120,948 100,933 953,928 959,36911,678 11,170 98,508 103,601
135.76814,95614,571
37129,022
115,209 1,079,041 1,096,94612,857 115,308 111,21014,610 134,268 124,248
272 3,051 3,17226,486 231,761 237,767
62,350 58,028 515,918 508,779
1,359 2,190 28,978 31,850
1,359 2,190 28,978 31,850530 430 4,170 3,870
829 - 1,760 24,808 27,98020 20
New Orleans Great Northern March July 1 to Mch. 31-
1912. 1911. 1911-12. 1910-11.$ $ $ $94,793 114,998 874,545 885,87125,077 28,514 258,237 279,437
129,418 154,313 1,221,488 1,270,06618,711 22,954 187,628 188,79317,412 20,809 161,697 175,3872,392 3,097 23,373 27,652
40,761 47,317 393.565 364,479
73,417 57,181 563,123 588,166
73,417 57,181 563,123 588,1665,723 6,300 45,335 40,907
67,694 50,881 517,787 547,259165 165
New Orleans Mobile & Chicago February July 1 to Feb. 29-1912. 1911. 1911-12. 1910-11.$ $ $ $
131,887 120,519 975,245 930,25725,897 24,752 242,107 230,520
87,717 100,952 832,407 803,510
41,70-1 53,361 389,080 466,555-40 -66 -643 -824
166,78931,93017,8223,078
52,591
152,84722,7229,0062,748
47,401112,863 90,455
1,292,662 1,237,267199,122 170,142139,393 98,44422,511 22,309
392,452 363,053816,967 718,439
53,926 62,391-138
41,661 53,294 388,436 465,731• 123 1,889 16,173 17,510
41,538 51,405 372.263 448.220282 282
New Orleans Southern & Grand Isle March July 1 to Mch. 31-
1912. 1911. 1911-12. 1910-11.$ $ $*
3,486 65,8214,484 37,1118,6841,20484944
3,456
108,84916,77810,586
24335,427
6,028 71,313
New Iberia & Northern March July 1 to Mch. 31-1912. 1911. 1911-12. 1910-11.$ $ $9.071 87.684
$
778 5,5069,9723,294639496
2,984
93,82423,0543.9842,956
35,5848,017 70,783
1,954 23,040
1,954 23,040500 4,379
1,454 18,66178
New Orleans Natalbany & Natchez February July 1 to Feb. 29-1912. 1911. 1911-12. 1910-11.$ $ $ $2,218 20.794 • 96,154 148,464482 391 3,863 3,778
7,3692,6621.420
752.330
21,4513,5574,074
754,157
107,06932,57830,027
67930,116
152.90136.38637,383
19036,133
6,907 12,760 97,900 113,205475,694 518,827--389
53,788 62,3914,073 3,910
476,084 518,82735,892 34,742
49,714 58,481 440,192 484,048404 404
New York & Pennsylvania March July 1 to Mch. 31-1912. 1911. 1911-12. 1910-11.$ $ $ $6,902 6,192 47,924 50,2361,990 1,844 20,266 20,1389,607 8,820 74,889 76,3742,227 1,275 19,398 22,032990 1,014 8,553 7,332
2,655 37,536
2,655 37,536940 8,460
3,443 3,981 32,476 31,885
7,348 6,814 66,374 66,392
2,259 2,005 8,514 9,982
461 8,091 9,109 39,695
461 8,691 9,169 39,695125 100 1,599 800336 8,591 7,570 38.89529 22
New York Central SystemNew York Central & Hudson River March July 1 to Mch. 31-1912. 1911. 1911-12. 1910-11.
5,639,030 4,936,382 46,721,073 43,975,6182,251,910 2,227,096 23,907,898 23.282,2848,852,174 8,159,297 78,961,500 75.341.967964,349 972,485 10,122,018 10,406,006
1,703,408 1,619,317 12,938,453 13,438,362203,905 172,154 1,676,479 1,812,613
3,637.085 3,308.992 29,929,809 29,210,2106,731,717 6.301,985 56,675,640 56,880,731
2,259 2,005 8,514 9,982242 242 2,185 2,185
1,715 29,07659
New York Central SystemChicago Indiana & Southern
March July 1 to Mch. 31-1912. 1911. 1911-12. 1910-11.393,531 305,804 2,738,615 2,465,83220,112 19,699 226,206 216,642
424,989 333,605 3,075,044 2,757,98945,177 38,773 413,625 360.300105,670 104,050 701,875 640,622
7,832 7,175 68,733 78,441149,972 124,136 1,132,674 1,079,501
317,067 283,163 2,393,278 2,256,325
2,016 1,762 6,329 7,79756 56
New York Central SystemChicago Kalamazoo & Saginaw March July 1 to Mch. 31-1912. 1911. 1911-12. 1910-11.
4,442 2,680 33,090 50.0252,515 3,261 33,733 36.881
2,120,45-6 -1,857.311 22,285,859 18,461,2367,146 15,100 279,355 60,716
2,127,603 1,872,412 22,565,215 18,521,952462,209 376,783 4,524,431 3,553,452
1,665,393 1,495,628 18,040,783 14,968,4993,596 3,591 (See this road on page 31)
New York Central SystemCincinnati Northern
March • July 1 to Mch. 31-1912. 1911. 1911-12. 1910-11.96,811 67,691 803,444 750,75714,521 14,613 166.034 171,966
17,286 14,997 151,607 156,183 116,035 88,613 1,016,784 974,3281.462 1,612 23,509 21,771 17,867 18,125 183,939 159,5972,137 1,451 23,034 9,349 30,385 17,036 213,795 202,586510 537 4,147 4,275 2,543 2,952 24,515 30,275
5,785 4,016 51,501 38.631 64.612 34,588 431,700 370.001 10,563 8,318 107,268 81,250 118.786 75,737 881,922 789,515
107,921 50,441 681,766 -501,664106 -824 1,877 -2,021
108,027 49,616 683,643 499,64213,000 13,900 114,098 122,39395,027 35,716 569,544 377,249
358 340(See this road on page 31)
New York Central SystemCleveland Cincinnati Chicago & St. Louis March July 1 to Mch. 31-
1912. 1911. 1911-12. 1910-11.1,953,245 1,730,238 15,621,708 15,234,500545,407 584,021 5,810,255 6,049,056
2,720,369 2,555,219 23,395,090 23,374,293262,587 268.400 2,491,347 2,991,374459,701 477,301 3,817,337 4,140,24765,631 77,372 674,386 760,408
1,141,418 1,074,841 9,451.824 9,954,3891.982.459 1,958,831 16,922,805 18,372,191
737,910 596,387 6,472,284 5,002,101-3,691 -7,518 -25,775 -67,020
6,722 6,678 44,339 74.932 --2,751 12,8/.1. 134,862 184,812
6,722 6,678 44,339 74,932 -2.751 12,875 134,802 184,8121,091 1,119 9,974 10,241 5,300 4,700 50,991 43,2055,631 5,558 34,364 64,691
44 44
New York Central SystemDetroit & Charlevoix
March July 1 to Mch. 311912. 1911. 1911-12. 1910-11.
6.739 5,824 72,231 56,340716 673 7,220 6.158
7,6791,389651
3,993
6,7381,4351,684
133,601
82.16515,1894,659195
38,843
64,88812,9036,323285
30,284
-8,051 8,175 83.870 141.607244 245(See this road on page 31)
New York Central SystemDunkirk Allegheny Valley Ec• Pittsburgh March -July 1 to Mch. 31-1912. 1911. 1911-12. 1910-11.18,192 19,267 156,468 152,2705,290 5,278 62,053 63,67927,8473,8571,291629
12.7256,403 7,118 61,107 52,607
28,3966,1902,9781,753
11,626
250,04762,03714,1455,417
109,881
250,41462,56429,5059.030
105.53919.143 23,157 197,199 211,922
1,276 -37f) 21,057 12,281
734,218 588,868 6,446,509 4,935,08195,000 80,000 867,512 733,548
639,218 508,868 5,578,996 4,201,5332,011 1,978(See this road on page Si)
New York Central SystemFulton Chain
March July 1 to Mch. 31-1912. 1911. 1911-12. 1910-11.
2,046 6,311 4,754Dr.5 4 4,216 3,996
2,047 4 11,443 9,64521 173 2,126 1,520
96 285 84 2,534 2,456115 302 5,025 4,175
1,932 -208 6,41k 5,4i
1,932 --298 6,418 5,470299 231
1,932 -208 6,119 5,2392 2
New York Central SystemLake Erie & Western
March July 1 to Mch. 31-1912. 1911. 1911-12. 1910-11.404,354 368,606 3,323,314 3,311,93363.898 60,231 693,212 692,496
490,90562,79693,34610,109
199,406376,621
452,270 4,252,125 4,231,81870,213 590,507 684,29390,398 740,067 795,84313,273 112,463 139,031
188,829 1,683,921 1,644,089375,269 3,225,820 3,374,878
1,276 -379 21,057 12,281606 582 5,312 6,131 669 -962 15,745 -.. 6.14943 43
New York Central SystemIndiana Harbor Belt
March July 1 to Mch. 31-1912. 1911. 1911-12. 1910-11.
266,38122,26731,0072,915
117,588
202,589 1,966,397 1,812,95215,572 226,034 265,97227,784 218,904 233,8223,182 26,204 22,38999,973 891,813 969.661
180,569 153,732 1,430,514 1,544,810
8.704 5,239 52,848 38,491
8,704 5,239 52,848 38,4911.175 1,828 14,660 . 14,5367,529 3,411 38,187 23,955
90 90
New York Central SystemKankakee & Seneca
March -July 1 to Mch. 31-1912. 1911. 1911-12. 1910-11.
6,734 3,988 38,795 39,7731,406 1,360 14.429 13,9898.5341,697624
5,868 56,8831,579 16,153884 5,250
58,68016,9426,515
2,811 2,683 27,061 22,0455,346 5,359 50,548 47,534
85,811 48,856 535,883 268,142442 817 23,359 10,998
86,254 49,674 559,242 279,1415,000 5,500 38,437 48.595
81,254 44,174 520,805 230,546104 113
New York Central SystemLake Erie Alliance & Wheeling March July 1 to Mch. 31-1912. 1911. 1911-12. 1910-11.74,288 56,690 523,412 511,3853,591 4,106 37,530 38,076
3,187 500 6,334 11,145
3.187 509 6,334 11,145740 750 6.221 6,931
2,447 -241 113 4,21442 42
New York Central SystemLake Shore & Michigan Southern March July 1 to Mch. 31-1912. 1911. 1911-12. 1910-11.
3,302.269 2.697,485 24,855,685 23,911,758805.032 836,591 8,747,125 8,613,309
78,821 62,060 572,774 562,680 4,609,512 3,985,897 38,038,901 36,824,21114,969 16,226 139,929 166,729 421,929 520,848 3,958,632 5,862,33517,997 8,934 106,042 73,290 690,057 713,364 5,174,438 6,123,2311,035 1,891 12,425 13,600 80,119 101,277 760.824 900,725
30,843 22,225 205,977 199,276 1,608,996 1.468,786 12,568,379 13.224.44765,875 50,309 471,598 460,460 2.901,580 2.899,714 23,148,001 26.823,399
114,284 77,000 1,026,305 856,93i) 12,945. 11,751 101,17-S 102,219 1,707,031 1,086,183 14,890,899 10,000,80____ -5.864 -6,477 -18.278 -47,445114,284 77,000 1,026,305 856,939 12,945 11,751 101,175 102,219 1,702,067 1,079,705 14.872,621 9,953.36619,000 18,000 176,296 167,762 3,295 4,020 30,849 34,783 140.000 135,000 1,283,939 1,315,18295,284 59,000 850.008 689,177 9,650 7,731 70.326 67,435 1,562,067 944,705 13,588,681 8,638.183
886 886(See this road on page 31) 87 87 1,775 1,662(See this road on page 31)New On k N E-See Ala NO ea T P ikk..w Oil Tex & Meg-See St L & 3 Fr New York & Ottawa-See N Y Cent
Digitized for FRASER http://fraser.stlouisfed.org/ Federal Reserve Bank of St. Louis
Page 18
18 RAILWAY EARNINGS [VoL. Lxxxxiv.
EARNINGS
Freight revenue Passenger revenue.. _ _ _
Tot., incl, other rev.Expenses-Maint. wayMaint. of equipmentTraffic expenses.. _ _Transportation exp.
Tot.. incl. generalNet from railroad.._ _ _Outside operations,net
Total net revenue Taxes
Final net Miles of road operated
EARNINGS
Freight revenue Passenger revenue- _
Tot., incl. other rev.Expenses-Maint. wayMaint. of equipmentTraffic expenses.... _Transportation exp..
Tot.. incl. generalNet from railroad........Outside operations,netTotal net revenue.. _
Taxes Final net
Miles of road operated
EARNINGS
Freight revenue Passenger revenue........
Tot., incl. other rev.Expenses-Maint. wayMaint. of equipmentTraffic expenses _ _ _Transportation exp.
Tot.. Incl. gener 1
Net from railroad.....Outside operations.netTotal net revenue.._
Taxes Final net
Miles of road operated
EARNINGS
Freight revenue Passenger revenue...._
Tot., incl. other rev.Expenses-Maint. way
Maint. of equipmentTraffic expenses.....Transportation exp.
Tot.. incl. generalNet from railroad......Outside operationsmet
Total net revenue-Taxes
Final net Miles of road operated
EARNINGS
Freight revenue Passenger revenue _ _ _
Tot., incl. other rev.Expenses-Maint. way
Maint. of equipmentTraffic expenses... _Transportation exp..
Tot., incl. generalNet from railroad_ _ _Outside operations,net
Total net revenue Taxes
Final net Mlles of road operated
EARNINGS
Freight revenue Passenger revenue......
Tot., incl. other rev.Expenses-Maint. wayMaint. of equipmentTraffic expenses.....Transportation exp.
Tot., incl. generalNet from railroad......Outside operations,net
Total net revenue.._Taxes
Final net Mlles of road operated
EARNINGS
Freight revenue Passenger revenue......
Tot., incl. other rev.Expenses-Maint. way
Maint. of equipmentTraffic expenses Transportation exp..
Tot.. Incl. generalNet from railroad........Outside operations,net
Total net revenue...Taxes
New York (Warta SystemLittle Falls & Dolgeville
March July 1 to Mch. 31-1912. 1911. 1911-12. 1910-11.
5,708 4,920 48,139 46,8421,473 1,458 16,108 16,0087,44068627656
2,698
6,761544229116
2,105
66,90413,6055,864820
24,446
6,5489,1785,816766
25,2213,789 3,020 46,133 42,737
3,650 3,741 20,770 22,810-34 -212
3,650 3,741 20,736 22,598231 3,530 2,897
3,419 3,741 17,205 19,70013 13
New York Central SystemMount Gilead Short Line
March -July 1 to Mch. 31-1912. 1911. 1911-12. 1910-11.
164 230 1.893 2,068168 184 1,765 1,892378 452
17919 67
4,178904336
4,293848452
579 546 5,095 4,595601 795 6,352 5,910
-222 -342 -2.173 -1,617
--222 --342 --2,173 -- 1,61740 33 368 288
-262 -3752 2
New, York Central SystemLouisville & Jeffersonville Bridge March July 1 to Mch. 31-1912. 1911. 1911-12. 1910-11.15,319 14,812 120.201 136,134
418 443 4,894 5,70418,434 16,737 148.147 158.736
2 2
New York Central SystemNew York & Ottawa
March -July 1 to Mch. 311912. 1911. 1911-12. 1910-11.13,849 9,725 108,064 91,7582,344 2,209 28,875 28,50817.2543.7252,700605
7.837
13,1093,7852,390623
7,742
146,87126,00528.5495,88170.189
129,97736,97725,4905,954
63,48516,064 15,168 137,544 137,8451,190 -2,058 9,327 -7,867
1,190 -2,058 9,327 -7,86778 78 9,412 8.109
-2,541 -1,906 1,112 -2,136 -85 -15.97769 69
New York Central SystemPeoria & Eastern
March July 1 to Mch. 31-1912. 1911. 1911-12. 1910-11.217,634 194,979 1,724,727 2,027.76151,807 51,618 537,334 546,873
288,121 267,469 2,435,587 2,770,45632.551 34,838 311,948 355,92539,694 48,522 348,381 459,4054,739 5,179 46,741 53,634
121,232 126,253 1.010.960 1.170,389203.588 222,088 1.769.530 2,093,02284,533 45,381 666.056 677,434
84.533 45,381 666,056 677.4349,800 9,500 87,602 86.37774,733 35,881 578.453 591,056
351 351 (See this road on page 31)
New York Central SystemRutland
March --July 1 to Mch. 31-1912. 1911. 1911-12. 1910-11.165,664 149,461 1,387,745 1,398,56474,850 75,506 893.977 869,942270,07029,15058,4547,331
118,856
252,857 2.576,336 2,564,09028,194 304,482 337,81154,115 409,837 425,6365.735 65,124 63.728
117,184 1,036.938 1,012,069220,738 212,613 1,875.720 1,903,46749,332 40,243 700.616 660,622
49,332 40,243 700,616 '660,62211,731 9,538 101,147 94.47937,601 30.705 599.468 566,143
468 468(5ee this road on page 32)
New York Central SystemZanesville & Western
March July 1 to Mch. 31-1912. 191.1. 1911-12. 1910-11.42,736 25,921 331,139 293,9074,491 3,950 38,931 39,397
48,232 30,871 380,906 342,9488,651 8,631 71,045 71,75211,767 13,661 75,521 79,786
574 692 6,279 5,47815,852 13,918 132,577 137,69737.756 37,890 292,716 302,53010,476 -7.019 88,189 '40.417
10,476 -7,019 88,189 40,4172,244 1,650 25,823 12,0928,231 -8,669 62,366 28,325
89 89
NYNH&HSystemNew York Ontario & Western
March July 1 to Mch. 31-1912. 1911. 1911-12. 1910-11.643,245 635,892 5,369,543 5,460,48288,003 88,419 1,280,647 1,289,466755,77791.429135,0378,607
332,749
744,783 6,909,361 7,008,57793,045 962,923 834,866132,242 1,164,598 1,102,8379,460 88,133 102,342
321,472 2,692,087 2,767,916585.388 575,618 5,062,035 4,967,462
New York Central SystemPittsburgh & Lake Erie
March -July 1 to Mch. 31-1912. 1911. 1911-12. 1910-11.
1,252,193 1,068,225 10,750,722 10,454,036114,201 112,619 1,151.983 1,204,306
New York Central SystemMichigan Central
March July 1 to Mch. 31-1912. 1911. 1911-12. 1910-11.
1,909,567 1,634,768 15,322,810 14,612.664545,831 523,014 5,916,879 5,709,970
2,719.337 2,410,085 23,524,745 22,667.737232,346 277,459 2,593,502 3,237.767383,819 424,468 2,790,487 3,452.61260,945 73,722 583,735 680,929
1,146,431 1,106,655 9,197,980 9,542.7911,872,628 1,933.398 15.568,185 17,358,776
846,709 476.686 7,956.560 5,308,961-434 --3,616 26,191 -35,261
846,274 473,070 7,982,751 5,273,699 .116,000 106,450 1.030,370 1,015,919730,274 366,620 6,952,381 4,257,779
1,816 1.804(See this road on page 31)
New York Central SystemNew York Chicago & St Louis
March July 1 to Mch. 31-1912. 1911. 1911-12. 1910-11.901,199 805,336 7.186,879 6,978.81184,519 92.377 1.172.170 1,155,046
1,026,98690,070106,08843,319
475,303
933,819 8,690,718 8,441,44680,640 958.820 913,049125,614 919,748 1,113,84046,188 417,537 446,061435,974 3.669,493 3,561,216
731,678 703,693 6,117,672 6,178,489
295,308 230,126 .2,573,046 2.262,95d-2,694 -1,992 -15.872 -14,891292,614 228,133 2,557,173. 2,248,064
• 32,000 29,600 297,124 276.120• 260,614 198,533 2,260,048 1,971,944
562 561(S,ee this road on page 31)
New York Central SystemRoquette Lake
March July 1 to Mch.31 -1912. 1911. 1911-12. 1910-11.
1,066 995 5,684 9,609531 178 18,051 17,890
1,410,726 1,216,951 12,272,764 12,017,899145,485 123,657 1,309.665 1,438,859220,284 119,983 1.939,492 1,163,98311,520 16,419 115,402 132,364
351,993 311,108 2.934,306 2,904,331753,158 598,570 6.512.256 5,856,810657,567 618,381 5,760,507 6,161.089-288 -466 -2.536 -3,459
657,279 617,914 5,757,970 6.157,62931.000 30.000 270,389 246,576
626,279 587,914 5,487,581 5.911.053215 .191(See this road on page 31)
New York Central SystemSt Lawrence & Adirondack
March July 1 to Mch. 31-1912. 1911. 1911-12. 1910-11.45,819 48,009 347,298 307,23012,146 12,766 160,452 172,38460,131 62,888 530,370 495,89910,119 4,151 73,776 65,8431,783 3,860 18,806 34.617434 400 4,930 5,786
37,646 26,342 244,070 220,04751,258 35,753 352.668 334,6998,873 27,134 177,701 161,199
8,873 27,134 177,701 161,199253 362 4,497 4,886
• 8,620 26,772 173,203 156,313• 65 65
NYNH&HSystemNew York New Haven & Hartford March -July 1 to Mch. 31-1912. 1911. 1911-12. 1910-11.
3,066,763 2,500,920 23,787,344 22,439,5491,956,982 1,953,693 20.048,705 19,660,3845,476,408 4,919.827 48,171,976 46.245.543411,589 454,456 4,818,472 5,045,975677,511 622.985 5,737,203 5,393,83629,782 30,295 287,093 259,174
2,289,410 2,142,350 18,844,338 18,441,7693,569,166 3,440,038 31,132,654 30,504,355
1,934 1,316 27,675490 300 16,40243 926 619
28998 479 11,195
31,30710,9201,56960
9,4521.668 1,847 28,856 22,375
265 --530 --1,181 8,932
265 -530 -1,181 8,9322,727 2,594
265 -530 -3,909 6,33824 24New York Central System
Toledo & Ohio Central March .124111 1 to Mch. 31-1912. 1911. 1911-12. 1910-11.408,400 302,633 3,407,826 3,214,04041,805 34,746 487,358 495,216464,53858,57392,1226,331
177,636
351,230 4,073,247 3,898,54854,204 612,080 534,26675,266 597,011 592,8447,163 59,790 60,069
138,222 1,410,578 1.330,537342.676 285.497 2,754,188 2,589,911
121,861 65,732 1,319,059 1,308,65g-485 -52 -7,624 -421
121,376 65,679 1,311.434 1,308,21420,385 20,343 184,886 170,846100,991 45,336 1,126,547 1,137,368
440 444(See this road on page 31)
NYNH&HSystemCentral New England
March July 1 to Mch. 31-1912. 1911. 1911-12. 1910-11.299,324 213,559 2,242,394 1,948,84023,997 27.011 254,019 266,503
337,87916,56524.5161,228
94,262
255,186 2,623,364 2,342,85229,701 366,125 442,17820,143 200,229 201,8491,127 11,467 16,641
70,800 709,235 684,901138,657 140,820 1.311,832 1,389,362
1,907,241 1,479.789 17,039,322 15,741,188102,988 99,177 1.051,729 1,053;586
2,010,230 1,578,966 18,091,051 16,794,774340,000 285,000 2,870.000 2,747,000
1,670,230 1,21i3,966 15,221,051 14,047,7742,091 2,040
NYNH&HSystemUnion Freight
March July 1 to Mch. 311912. 1911. 1911-12. 1910-11.
8,056 7,669 83,344 81,672
8,4241,95582550
4,022
7,94085072850
3,610
84,71910,9747,064450
39.420
82,86210.7088,702491
38,4247,294 5,701 62,098 62,695
170.388 169.164 1,847,326 2,041,115-3,130 -7,322 -10,198 -42,145167,258 161,842 1,837,128 1,998,96917,916 17,500 161,249 157,500
149,341 144,342 1,675,878 1,841,469565 545(Sce this road on page 31)
Norfolk & Portsmouth Belt Line March July 110 Mch. 31-1912. 1911. 1911-12. 191041.*
1,130 2,239 22,621 20,167
1,130 2,239 22,621 20,167575 650 5,175 5,850555 1,589 17,4l2 2
Norfolk & Western March July 110 Mch. 31-1912. 1911. 1911-12. 1910-11.$ $ $ $
2,845,648 2,482.104 24,931,129 22,714,300315,723 -310,239 3.263,450 3,188.986
17,976 22,180 143,857 145,870 3,270,707 2,885,340 29,244,104 26,874,0802,570 2,276 24,550 20,698 364,181 339,161 3,425,719 3,090,2101,449 1.685 14,155 16,691 687.358 470.125 5,729.590 4,995,678
57,413 48,567 473,692 443,6431,030,897 886,311 8,731,327 8,083,563
12.451 13,555 98,277 108,713 2.203,211 1.804,177 18.924.998 17,159,211
7,342 8,466 51,558 63.498
5,524 8,625 45,579 37,156 1,067,495 1,081,162 10,319,105 9,714,869-2,159 -556 -18,449 -6,766
5,524 8,625 45,579 37,156 1,065,336 1,080,605 10,300,656 9,708.103515 568 4,545 4,278 120,000 115,000 1,050,000 975.000
Final net 5,008 8,056 41,034 32,878 945,336Mlles of road operated 13 13 2,013N Y Chic & St Louis-See N Y Central N Y Susq & Western-See ErieN Y Ont & Western-See N Y N H &H Newb & So Shore-See II S Steel4 Y Phila & Non -See Penna BR Newport & Richford-See Can Pao
199,221 114,365 1,311,532 953,489--138 -4,675
199,083 114,365 1,306,856 953.4899,000 19,000 81,000 111,000
190,083 95,365 1,225,856 842,489276 276
NYNH&HSystemWood River Branch
March---- July 1 to Mch. 31-1912. 1911. 1911-12. 1910-11.
886 853 7,169 7,014380 380 3,705 3,817
1,39313049
1,3751626
11,892 11,8352,387 • 2,155367 ,22
968 647 5, '21 4,9731,383 1,014 9,883
9 600 1,991 1,951
9 360 1,991 1,95146 46 421 421
14,317 -37 313 1,569 1,5295 5
Norfolk Southern SystemNorfolk Southern
March - July 1 to Mch. 31--1912. 1911. 1911-12. 1910-11.213,557 225,794 1,550,850 1,455,62155,938 51,428 628,516 572.325
286,663 290,682 2,365,478 2,177,61633,500 37,865 273,211 248,08733,628 30,147 289.972 256.4695,126 4,730 49.725 43,684
91,621 88,334 780,741 676.723177,402 174,778 1.512,006 1,348.694109,261 115,904 853,472 828,922--181 --158 -3,674 3,620
965,605 9,250.656 8,733,1031,990(See this road on page 31)
No Yakima & Val-See Union Pada°Northeast Penn-See ReadingNorthern Alabama-See Souther'i
109,079 115,746 849,797 832.5427,500 5.900 67.500 53,900
101,579 1097846 782,297 778.642607 607Northern Central-See Fenno RR
Digitized for FRASER http://fraser.stlouisfed.org/ Federal Reserve Bank of St. Louis
Page 19
MAY. 1912.] RAILWAY EARNINGS 19
EARNINGS
Freight revenue Passenger revenue_
Tot.. incl. other rev.Expenses-Maint. wayMaint. of equipmentTraffic
expenses_- _
Transportation exp.Tot., incl. general
Net from railroad_ _ _ _Outside operations,netTotal net revenue
Taxes Final net
Miles of road operated
EARNINGS
Freight revenue Passenger revenue- _
Tot.. incl. other rev.Expenses-Maint. wayMaint. of equipmentTraffic expenses_ _Transportation exp.
Tot., incl. general
Net from railroad_ _Outside operations,netTotal net revenue_ _
Taxes Final net
Miles of road operated
EARNINGS
Freight revenue Passenger revenue- - - -
Tot.. incl. other rev.Expenses-Maint. wayMaint. of equipmentTraffic expenses_
.-Transportation exp.Tot., incl. general
Net from railroad_ _ _ _Outside operations.netTotal net revenue_ _
Taxes Final net
Miles of road operated
EARNINGS
Freight revenue Passenger revenue_ - -
Tot., incl. other rev.Expenses-Maint. way
Maint. of equipmentTraffic expenses Transportation cap_
Tot.. incl. general
Net from railroad _ _ _ _Outside operations,netTotal net revenue_ _
Taxes Final net
Miles of road operated
• • •
EARNINGS
Freight revenue Passenger revenue_ _
Tot., incl. other rev.Expenses-Maint. way
Maint. of equipmentTraffic expenses_ _ _Transportation exp.
Tot., incl. generalNet from railroad_ _ _ _Outside operations,net
Total net revenue_ _Taxes
Final net Miles of road operated
EARNINGS
Freight revenue Passenger revenue....
Tot., Incl. other rev.Expenses-Maint. wayMaint. of equipmentTraffic expenses__ _Transportation exp.
Tot., incl. general
Net from railroad.. _ _Outside operations,net
Total net revenue Taxes
Final net Miles of road operated
EARNINGS
Freight revenue Passenger revenue_ _
Tot., incl. other rev.Expenses-Maint. way
Maint. of equipmentTraffic) expenses _Transportation exp_
Tot.. Incl. generalNet from railroad_ _Outside operations.net
Total net revenue_ _Taxes
Norfolk Southern SystemKinston-Carolina Railroad & Lumber Co. March- --,July 1 to Afch. 31 -1912. 1911. 1911-12. 1910-11.
3,658 3,829 21,785534 260 5,207
4,279 4,089 27,727671 1,429 5,602183 353 3,100
30 471,095 1,221 9.447 2,053 3,093 18,712
2,225 996 9,014
2,225 996 9,01444 6 263
2,180 990 8,75020 20
Northern Pacific SystemNorthern Pacific
March July 1 to Mch. 311912. 1911. 1911-12. 1910-11.
3,558,469 3,428,571 32,936,181 33,265,9011,040,253 1,215,868 11,515,723 13,233,963
Ncall & South Carolina March -July 1 to Mch. 31-1912. 1911. 1911-12. 1910-11.
12,971 11,101 76,608 70.6672,565 2,568 29,554 30,621
licathamptcala & Bath March--- -July 1 to Mch. 31-1912. 1911. 1911-12. 1910-11.
$ 11,317 17,378 11
$ 5,023 14
$1,382
369 332 2.862 3,24816,221 14,050 109,595 103,864 13,903 22,587 138,310 177,7103,274 1,287 18,586 11,305 982 533 11,553 9,335567 318 2,748 2,157 2,450 3,457 23,375 26,835268 144 1,897 1,342 390 228 1,909 1,812
4,352 3.739 31,763 26,788 9,411 12,576 85.232 99,481
4,928,944 4,959,768 47,580,314 49,751,768369,555 345,334 5.462,191 5,853,989668,971 706,713 5,305,760 6,075,361102,056 114,103 870,405 813,642
1,759,779 1,785,667 15,725,464 16,604,2342.974.750 3,035.414 28.107,770 30,112.0381,954,194 1,924,354 19,472,543 19,639-,n1)-2,964 5,228 269,877 392,521
1,951,229 1,929,583 19,742.420 20.032,251295.737 247.988 2,479,161 2,453,681
1,655,492 1,681,595 17,263,259 17,578,5706.032 6,028
Northern Pacific SystemPort Townsend Southern
February July 1 to Feb. 29-1912. 1911. 1911-12. 1910-11.
2,489 1,152 13,660 10,4081,246 1.353 10.830 12,6764,376 3,101
. 374 548295 2105
1,052 1,287
30,7575,5132,411
358,499
30.4348,4702,886
6010,214
1,871 2,191 17.736 22,853
2,505 910
2,505 910625 600
13,020 7.581
13,020 7,5815.000 4,800
1.880 310 8,020 2,78141 41
Ohio River & Western March July 1 to Mch. 31-1912. 1911. 1911-12. 1910-11.I I $ $5,722 5,683 48,912 48,9467,974 7,607 75,146 76,11015.250 14,857 141,798 141,3324,683 5,147 47,305 46,5092.108 2,186 18,901 19,577
32 54 819 7514,246 4,889 39.488 40,86411.740 13,667 115,220 114,666
3,509 1,190 26,577 26,666
3,509 1,190 26.577 26,666807 804 7.597 7,609
2,702 385 18,979 19,057111 111
Pacific & Idaho Northern March July 1 to Mch. 31-1912. 1011. 1911-12. 1910-11.$ I a $5,685 4,946 98,930 71,7194,555 4,069 56,237 54,14911,3533,8581.940338
3,226
10.0033,11394683
4,235
167,20434,79314,3752,678
39.716
135,04032,1146,6211,380
32,9589,966 9,145 99,383 79.1921,386 • • 857 • 67.820 • 55,847
1,386 857 67,820 55.847500 500 4,349 4,095886 357 63,471 51,75289 76
Penn System-Eastern LinesPennsylvania Railroad
March July 1 to Mch. 311912. 1911. 1911-12. 1910-11.
11,055,991 9,693,390 89,008,103 85,666,6382,591,627 2,537,831 25,559,080 25,016,74714.527,248 12,999,491122,641,107118,454,1911,560,082 1,453,118 13,819,384 14,728,3403,024,404 2,304,021 24,514,837 22,338,128185,383 166,668 1,655,313 1,702,177
5,506,577 4.911,992 45,681,832 43.985,80110,653,676 9,196.647 88.781,299 85,800.4223,873,572 3,802,843 33,859,807 32,653,768-106.429 -120,394-1,164,079 -977,3843,767,142 3,682,449 32.695,728 31,676,384564,472 474.453 5,329,004 4,270,082
3,202,670 3,207,996 27,366,723 27,406,3024,017 3,976(See this road on page 31)Penn System-Eastern Lines
Cape Charles March----- -July 1 to Mch. 31-1912. 1911. 1911-12. 1910-11.
647 448 11,545 2,956267 164 3,014 791970 625 15,165 3,780225 298 1,628 94849 19 209 6217 6 324 68
594 440 4,531 1,879978 801 7,154 3.085--8 --176 8,010 694
9,673 6.634 65,708 50,439 13,476 17,003 124,632 139,200
6,548 7,415 43,887 53.425 426 5,584 13.678 38,509
6,548 7.415 43,887 53,425 426 5,584 13,678 38,509350 150 1.950 1.006 276 272 2,488 2,454
6,198 7,265 41.937 52,41877 55
Northern Pacific SystemBig Fork & International Falls March July 1 to Mch. 311912. 1911. 1911-12. 1910-11.
5,965 6,271 48,926 49,5242,831 2,544 22.751 17,9959,20453914843
2,894
9,51464856344
3,061
81,4398.3953,805376
23,525
72,01210.4623,994344
25,2743,828 4.518 37,935 42.0655,375 4,995 43,504 29,947
5,375 4,995 43,504 29,947194 380 3,176 2.966
5,181 4,614 40,328 26,98033 33
Northwestern Pacific Mara-- -July 1 to Mch. 31-1912. 1911. 1911-12. 1910-11.$ $ $ $81,216 90,499 1.040,894 1,052,841122,386 108,330 1,380,102 1.246.841224,78953,52138,1023,517
97,448
221.277 2,617.858 2.492,12451,780 445.486 451.46546,880 361,507 373,6413,172 29,664 25,959
95,444 956,920 943,595203,671 206,956 1,880.469 1.877.975
21,118 14,320 737.388 614,149
21,118 14,320 737,388 614,14911.077 12,700 108,442 97,30010,041 1,620 628,946 516,849
401 376
Oklahoma Central March July 1 to Mch. 311912. 1911. 1911-12. 1910-11.$ $ I $14,012 15,705 176.852 159,4353,358 4,116 38,741 41.56318,165 20,9438,327 6,6143,510 3.530467 438
7.254 8.55721,068 20,527
150 5,311 11,189 36,0547 7
Northern Pacific SystemMinnesota & International
March -July 1 to Mch. 31-1912. 1911. 1911-12. 1910-11.54,555 53,522 401,885 405,97320.061 21,002 179,273 168,06178,78712,9689,698333
29,654
77,57910.9429,535330
24,704
619,82882,89266,9733,430
207,347
612,58566,59660,4802,652
189,29154.960 48,055 381,710 338,478
23,827 29,524 238,117 274,107
23,827 29,524 238,117 274,1073,140 3.119 24,976 24,52720,686 26,405 213,141 249,579
177 177
Norwood & St Lawrence March July 1 to Mch. 31-1912. 1911. 1911-12. 1910-11.3 $ $ i5,700 4,186 57,082 56,499910 850 8,504 8.508
7,186 5,643 74.008 78,388829 903 9,239 6.669853 534 8,628 7,9215 3 92 148
2,621 2.798 23.861 26,9284.709 4,794 45.320 46.6692,477 848 28.688 31,718
-336 1,4142.477 848 28,352 33,133200 200 1,800 1.350
2,277 648 26,554 31,78319 19
Ouachita & Northwestern March July 1 to Mch. 31-1912. 1911. 1911-12. 1910-11.$$ i
9.742 11.394 109,190 112,634
222,458 210,671 9,755 11,397 109.302 112,67361,137 47,033 2,922 3.043 25.044 21,14728,764 29,690 1,444 2,324 15,602 16,8135,198 4,841 300 224 1.800 2,825
61.427 65.483 3,541 3,213 27,965 25.586169.862 159,646 8.410 8.975 72,289 68.137
-2,902 416 52,596 51,024 1,345 2.422 37,012 44.536
--2,902 4161,628 1,733
52,596 51.024 1,345 2,422 37,012 44.53614.655 15,709 170 125 1,530 1,125
-4,530 -1,316 37.940135 134
. Pacific Coast March July 1 to Mch. 31-1912. 1911. 1911-12. 1910-11.1 $ $ $8,709 5,251 143,020 127,8714.599 2,124 47.359 43.98414,1883,4542,141116
5,301
8,0813,2992,747105
3.282
198,47731,63524.7531.268
51,826
179.17158,93127.518
99752.599
12,290 10,663 121,266 152,248
35,314 1,175 2,297 35,482 43.41159 59
Pacific Railway & Navigation March -July 1 to Mch. 31-1912. 1911. 1911-12. 1910-11.$ $ $ I6,894 13,4616,776 17,88714,73811,729
60442
7,84320.973
1,898 -2,581 77,210 26,923
1,898 -2,581' 77,210 26,9231,057 822 8,799 8,233840 --3,404 68,411 18.69099 95(See thlsroad on page 31)
Penn System-Eastern LinesBaltimore & Sparrows Point
March July 1 to Afch. 31--1912. 1911. 1911-12. 1910-11.
8,934 8,474 72,051 83.314
8,9344,090Cr149180
2,968
8,4748722144
2,560
72,05126.560
3031,249
28.687
83.31416,921Cr5 ,3771,403
28.4357,379 3,805 58,682 43.389
1,554 4,669 13.369 39,925
1,554 4,669 13,369 39,925383 329 3.453 2,332
1,170 4,339 9,915 37,59211 11
Penn System-Eastern LinesCornwall & Lebanon • •
March July 1 to Mch. 311912. 1911. 1911-12. 1910-11.21.204 22,440 190.906 219,2181,135 1,047 26.686 23.227
23,2571,8376,230
779,419
24,4452,6256,721145
9,452
228,86819,20362,3221.598
91,111
253,41724.02164,5421,939
93.78919,023 19,974 185.317 194,049
4,234 4,471 43.550 59,368
-6,235
-6,2351,500
34,27024,8602,938109
15,73444,227
-10,256
-10,2564,500
-7,735 --14,75691
Penn System-Eastern LinesBaltimore Chesapeake & Atlantic March July 1 to Mch. 31-1912. 1911. 1911-12. 1910-11.10.030 9,593 87.135 90,8155.707 4,992 98,313 97.92317.511 15,730 207,406 206,4574.500 4.001 37,458 40.1932,404 2,235 13,590 18.601335 255 4,699 4,802
7.928 6,806 83,148 73.76015.800 13,962 144.602 143.685
1,710 1,768 62,804 62,7719,521 7.843 84,977 119.86111,232 9,612 147,781 182,6331.673 2,182 18,113 19,6399,558 7.429 129,667 162,994
87 87(See this road en page 32)
Penn System-Eastern LinesCumberland Valley
March-- -July 1 to Mch. 31-1912. 1911. 1911-12. 1910-11.201,900 173,971 1,613,628 1,718,92247,244 44,518 499.494 486,883259,978 228,109 2,218,122 2,311,13540,570 82,339 381,884 318.09333,996 30.008 288,093 306,9733,808 4,056 40,674 42,025
86,016 81,479 733.086 740,667172,576 206,193 1.513,364 1.468.478
4,234 4,471 43,550 59.3681,168 1,087 10,715 10.399
Final net -53 -206Miles of road operated 12 8
3,06526
Northw RR of So Caro-See At! Coast Oregon Short Line-See Union PaoOpel Gulf & N E-See Texas & Pao Ore-Wash RR ec Nay-See Union PaoOrange & Northw-See St L & San Fr Pac & Eastern-See Spok Port & Seat
--8 --176 8,010 69445 30 495 120
7,515 574
87,401 21,916 704,758 842,656160 354 3.607 2.592
87,562 22.270 708,365 845,2485,611 5.141 53,326 50,306
3,384 32,835 48.968 81,951 17,129 655,039 794,94226 162 162 (See this road on page 32)
Parag Southeast-See St L Southw Pecos River-See AtchisonParis & (it Nor-,See St L & San Fran Pennsylvania Company-See PennPecos & Nor Tex-See Atchison Pennsylvania Terminal-See Penn
Digitized for FRASER http://fraser.stlouisfed.org/ Federal Reserve Bank of St. Louis
Page 20
20 RAILWAY EARNINGS [VOL. Lxxxxiv.
EARNINGS
Freight revenue Passenger revenue__ _
Tot., incl. other revExpenses-Maint. wayMaint. of equipmentTraffic expenses__ _Transportation exp.
Tot., incl. general
Net from railroad_ _Outside operations,net
Total net revenue_ _Taxes
Final net Mlles of road operated
EARNINGS
Freight revenue Passenger revenue __ _
Tot., incl. other rev.Expenses-Maint. wayMaint. of equipmentTraffic expenses__ _Transportation exp.
Tot., incl. general
Net from railroad_..Outside operations,netTotal net revenue_ _
Taxes Final net
Miles of road operated
EARNINGS
Freight revenue Passenger revenue__ _
Tot., incl. other rev.Expenses-Maint. wayMaint: of equipmentTraffic expenses__ _Transportation exp.
Tot., inel. general
Net from railroad_ _Outside operations,netTotal net revenue_ _
Taxes Final net
Miles of road operated
EARNINGS
Freight revenue Passenger revenue_
Tot., incl. other rev.Expenses-Maint. wayMaint. of equipmentTraffic expenses__Transportation exp-.
Tot., incl. general
Net from railroad_ _Outside operations,netTotal net revenue_ _
Taxes Final net
Miler of road operated
EARNINGS
Freight revenue Passenger revenue
Tot., fact. other rev.Expenses-Maint. way
Maint. of equipmentTraffic expenses_ _ _Transportation exp.
Tot., incl. general
Net from railroad_ _ _ _Outside operations,netTotal net revenue_ _
Taxes Final net
Miles of road operated
EARNINGS
Freight revenue Passenger revenue__ _
Tot., Incl. other rev.Expenses-Maint. way
Maint. of equipmentTraffic expenses__ _Transportation exp.
Tot., incl. general
Net from railroad_ _ _ _Outside operations,netTotal net revenue_ _
Taxes Final net
Mlles of road operated
EARNINGS
Freight revenue Passenger revenue__ _
Tot.. incl. other rev.Expenses-Maint. way
Maint. of equipmentTraffic expenses__ _Transportation exp.
Tot., incl. general
Net from railroad.. _Outside operations,netTotal net revenue
Taxes Final net
Miles of road operated
Peoria & Eastern-SeePerkiomen-See ReadingPhila & Chest Val-See
Perm System-Eastern LimosLong Island
March July 1 to Mch. 31-
Reim System-Eastern LinesMaryland Delaware & VirginiaMarch
Penn System-Eastern LimasMonongahela
1912. 1911. 1911-12. 1910-11.303,532 271,498 2,470,587 2,280,770422,160 391,882 5,096,714 4,726,642
July 1 to Mch. 31-1912. 1911. 1911-12. 1910-11.
4,038 4,721 43,173 44,5643,040 2,533 50,557 47,856
March July 1 to Mch. 31-1912. 1911. 1911-12. 1910-11.130,829 103,863 938,916 925,1722,193 2,244 20,932 23,460
757,849 699,706 7,903,606 7,363,243109,905 93,656 1,056,708 861,313109,290 104,158 976,955 1,051,5999,956 12,526 116,949 151,746
414,139 401,755 3,670,561 3,592,405
8,088 8,001 103,120 102,1155,000 3,016 34,333 25,3361,528 2,083 11,775 14,500181 194 3,413 3,406
4,582 4,253 49,118 42,85711,516 9,772 100,788 88,576
134,737 107,414 973,310 961,99114,600 11,859 126,489 181,00318,321 8,253 81,461 80,128
306 193 3,031 2,35125,738 22,647 203,986 219,331
667,393 641,282 6,012,372 5,865,099 61,014 44,888 432,349 500,83590,455 58,424 1,891,234 1,498,143 24,009 24,814 482,636 519,278
-3,428 -1,770 2,332 13.538 -540,961
8,754 9,371 74,489 53,268 5,326 7,600 76,821 66,807
73,723 62,525 461,1M
114,465 83,238 2,373,870 2,017,42256,450 53,533 490,671 481.961 454 606 5,000 5,455
4,871 6,994 71,821 61,351
73,723 62,525 540,961 461,1552,000 1,900 23,429 18,853
58,015 29,705 1,883,199 1,535,461398 395(See fists road on page 32.
Penn System-Eastern LinesNew York Philadelphia & NorfolkMarch July 1 to Mch. 31-
71,233 60,625 517,531 442,30164 64
Penn System-Eastern LinesPennsylvania Terminal
83 83 (See this road on pagc32/Penn System-Eastern Lines
Northern CentralMarch
1912. 1911. 1911-12. 1910-11.208,201 216,600 1,935,436 2,007,08229,893 30,598 338,375 315,277
July 1 to Mch. 31-1912. 1911. 1911-12. 1910-11.904,622 859,809 7,334,057 7,373,469169,010 168,682 1,727,013 1,725,936
March July 1 to Mch. 31-1912. 1911. 1911-12. 1910-11.
256,661 265,194 2,454,077 2,508,75122,703 38,077 251,507 286,34147,131 51,673 437,150 427,2264,042 4,024 36,292 39,060
107,384 104,749 982,335 971,093
1,134,763 1,081,368 9,632,062 9,657,827148,467 162,511 1,032,826 1,672,250245,099 192,239 2,062,574 1,839,29114,452 14,060 133,098 149,866
538,021 516,801 4,824,366 4,557,923
38,614 38,257 334,321674 862 8,551
1,001 1,078 14,360192 305
17,161 16,617 149,501193,731 210,074 1,817,990 1,824,718 974,522 914,314 8,275.178 8,447.196 19,161 18,648 174,24962,929 55,119 -636,086- 684,032 160,241 1-6-7,053 1,356,883 1,210,630
236 103 4,648 5,11019,452 19,609 160,072
62,929 55,119 636,086 684,0327,900 7,500 68,700 69,150
160,477 167,157 1,361,532 1,215,74036,175 33,986 350,545 305.875
19,452 19,609 160,0721,360 1,130 14,029
55,029 47,619 567,386 614,882112 112(See this road on page 32)
Penn System-Eastern LinesPhiladelphia Baltimore & Washington
March July 1 to Mch. 31-
124,302 133,170 1,010,986 909,864473 468(See this road on page 32)
Penn System-Eastern LinesRosslyn Connecting
18,092 18,479 146,0424 4
Penn System-Eastern LinesSusquehanna Bloomsburg & Berwick
1912. 1911. 1911-12. 1910-11.806,679 775.113 6,919,807 7,106,318594,015 586,427 5,864,025 5,716,918
March July 1 to Mch. 31-1912. 1911. 1911-12. 1910-11.
622 968 7,882 10,786
March July 1 to Mch. 31-1912. 1911. 1911-12. 1910-11.18,146 11,818 103,146 91,769,1,068 1,065 10,791 11,719
1,558,427 1,506,887 14,254,579 14,231,885220,766 203,077 1,972,699 2,138,535268,212 234,214 2,455,698 2,298,00429,086 30,332 248,084 263,377
701,087 682,644 6,029,872 6,011,182
629 968 7,926 10,8393,799 269 6,131 4,735137 161 1,313 1,5042 3 23 39
1,240 1,394 10,438 11,651
19,438 13,036 115,712 104,9991,129 1,347 11,479 17,3842,987 1,341 14,387 7,500
4,882 3,408 30,463 28,8561,268,947 1,203.011 11,058,098 11,046,659 5,184 1,829 17.938 17,942 9,811 6,822 63,914 60,901289,480 303,875 3,196,481 3,185,226 -4,554 -860 -10,012 -7,103 9,6211 6,213 51,798 44,09T
289,480 303,875 3,196,481 3,185,22649.268 48,151 451,990 433,362
--4,554 --860 --10,012 --7, 10377 . 74 696 669
9,626 6,213 51,798 44,097385 361 2,541 3,265
240,212 255,723 2,744,490 2,751,864713 713(See this road on page 32)
Penn System-Eastern LinesUnion Railroad of BaltimoreMarch July 1 to Mch. 31-
-4,631 -935 -10,709 -7.7733 3
Penn System-Eastern LinesWest Jersey & Seashore
March July
9,241 5,851 49,256 40,83143 43 •
Penn System-Western Lines -Central Indiana
1912. 1911. 1911-12. 1910-11.108,038 105,086 931,130 959,35618,780 18,117 183,398 180,804
1 to Mch. 31-1912. 1911. 1911-12. 1910-11.173,416 153,870 1,435,360 1,364,911231,194 223,671' 3,015,917 2,939,599
March July 1 to Mch. 31-1912. 1911. 1911-12. 1910-11.12,098 11,684 109,778 109,3302,228 2,086 20,453 19,847
128,505 124,672 1,129,178 1,152,9696,931 9,955 88,866 78,073
1,000 996 7,224 7,0125,831 5,667 50,611 50,611
428,377 400,019 4,756,385 4,591,26172,312 73,723 738,880 730,44180,517 51,560 831,084 569,44711,909 10,659 118,391 139,658
218,898 202,084 2.084,805 1,946,521
14,990 14,494 136,214 135,3332,159 3,060 36,700 35,9183,865 4,030 33,720 34,828678 690 5,693 5,371
7,670 7,169 66,478 62,39316,605 18,961 169,220 154,700 397,408 349,273 3,873,894 3,482,790 15,575 16,028 152,798 148,218
111,900 105,710 959,958 998,269 30,968 50,746 882,490 1,108,471-5,532 -4,193 -34,245 -49.476
-584 --1,534 --16,583 -12,884
111,900 105,710 959,958 998,2695,414 5,063 51,780 45,568
25,435 46,553 848,245 1,058,99529,901 23,000 230,546 207,002
-584 --1,534 --16,583 --12,8841,621 1,687 14,991 13,108
106,485 100,647 908,177 952,7009 9
Penn System-Western LinesCincinnati Lebanon & NorthernMarch July 1 to Mch. 31-
-4,466 23,553 617,698 851 992355 353 (See this road on page 32)
Penn System-Western LinesGrand Rapids & Indiana
-2,206 ---3,221 -31,575 ---25,993127 127
Penn System-Western LinesManufacturers
1912. 1911. 1911-12. 1910-11.27,051 27,355 267,569 273,2334,771 4,275 43.314 42,358
March July 1 to Mch. 31-1912. 1911. 1911-12. 1910-11.320,940 301,377 2,265,812 2,355,478115,716 115.059 1,328,002 1,309,269
March -July 1 to Mch. 31-1912. 1911. 1911-12. 1910-11.
43,667 34,832 357,364 339,2099,009 5,464 83,087 57,0925,862 3,165 48,200 34,932899 657 7,712 8,181
14,599 13,406 123,319 128,248
467,544 444,630 3,888.032 3,946,38051,441 51,805 414,837 505.91977,552 80,630 642,698 655,61711,304 10,777 101,419 109,566
212,338 185,206 1,666,563 1,739,221
6.207 5,173 36,267 41,936385 Cr434 12,018 8,984280 279 2,543 2,503
3,944 3,620 33,499 33,36731,053 23,078 266,222 231,759 366,986 342.504 2,958.028 3,142,750 4,610 3.617 48,079 45,22212-,b14 11,754 91,141 107,450 100,557 102,125 930,004 803,629
-787 -180 -1,547 7-4001,596 1,555 --11,812 -3,286
12,614 11,754 91,141 107,4502,371 1,500 26,555 14,653
99,770 101,944 928.456 803,22923,364 23,351 207,581 216,182
1 ,596 1,555 --11,812 --3,2861.511 1,100 13,522 9,072
10,242 10,254 64,586 92.79645 45
Penn System-Western LinesPennsylvania Company
March July 1
76,405 78,593 720.875 587.046586 587(See this road on page 32)
Penn System-Western Lines.Pittsburgh Chartiers & Youghiogheny
84 455 -25,335 -12,3593 3
Penn System-Western LinesPittsburgh Cincinnati Chicago & St Louis
Marchto Mch. 31-1912. 1911. 1911-12, 1910-11.
3,546,516 2,790,680 29,902,544 29,237,416700,445 609,158 6,566,735 L315,120
March July 1 to Mch. 31-1912. 1911. 1911-12. 1910-11.29,782 19,247 223,663 227,223
543 574 5,163 6,396
July 1 to Mch. 31-1912. 1911. 1911-12. 1910-11.
2,696,567 2,106,877 21,207,305 20,342,845621,709 623,108 6,007,540 6,183,595
4,627,655 3,747,977 39,921,438 38,774,175660,807 417,156 5,353,583 4,588,018903,255 658,979 7,267,844 6,803,45278,993 69,640 676,366 718,369
1,801,535 1,431,998 14.229,160 13,982,507
32,047 ' 21,065 244,346 246,2941,645 2,987 24,172 44,3381,410 1,364 18.455 19,050231 255 2,139 2,137
9,378 8,087 76,567 84,864
3,656,826 3,061,569 30,547,804 29,793,194371,575 298,170 3,979,934 3,655,346694,898 581.019 5,685,516 5,573,91469,431 63,038 610,946 .663,851
1,375,929 1.189,961 11,086,598 11,326,5753,537.878 2,660,177 28,316,906 26,852.428 14,013 14.026 133,655 163.466 2,579,854. 2,196,991 21.958,884 21,811,0341,089,776 1,087,800 11,604,531 11,921,747-4,358 -8,183 -18,530 -54,503
18,033 7.039 110.690 82,827 1,076,971 864,578 8,588,920 7,982,159-467 -1,056 -7,818 -7,989
1,085,418 1,079,617 11,586,000 11,867,243215,641 265,367 1,736,681 1,697,690
18,033 7,039 110,690 82,827847 862 7,822 9,109
1,076,504 863,521 8,581,102 7,974,170125,156 134,244 1,134,846 1,231,771
869,777 814,249 9,849,319 10,169,5521,760 1,415(8ce this road on page 32)Penn System-Western Lines
Toledo Peoria & WesternMarch July 1 to Mch. 31-
17,186 6,177 102,868 73,71821 21
Penn System-Western LinesVandalia
951,348 729,277 7,446,255 6,742,3991,467 1,467(See this road on Page 32)
Penn System-Western LinesWaynesburg & Washington
31-1912. 1911. 1911-12. 1910-11.67,432 59,738 590,032 593,02432,667 33.081 339,865 342,517
March July 1 to Mch. 31-1912. 1911. 1911-12. 1910-11.611,982 571,625 5,089,778 5,423,146182,205 182,352 1,828,554 1,840,052
March July 1 to Mch.1912. 1911. 1911-12. 1910-11.
4,851 3,747 45,128 39,2885,778 5,294 53,685 54.617
105,273 97,970 984,848 986,62715,005 15,503 149,592 168,59426,118 26,216 216,836 196,3472,240 2,223 20,889 20,743
42,015 40,207 374,549 371.445
878,018 847,799 7,764,586 8,076,385104,186 99,432 1,028,573 1,028,880188,362 156,988 1,499,924 1,479,58721,669 23,704 228,434 249,350
369,133 342,668 3,078,208 3,239,935
11,46:3 9,940 106,796 102,65g2,211 2,556 24,548 27,7221,294 . 1,349 13,111 12.886112 139 1,024 1.065
5,060 4,022 39,803 38,51188,915 87,490 792.549 785,984 700,844 642,459 6,003,819 6,175,540 8,891 8.257 80.152 81,79016,357 10,479 192,298 200,642 177,173 205,340 -1,760,766 1,900,845 2,571 1,682 26,643 20,867
------16,357 10,479 192,298 200.6425,000 4,300 43,600 44,300
177,173 205,340 1,760,766 1,900,84528,687 27.441 254,029 250.491
2,571 1,682 26,643 20,867266 246 2,174 2.546
11,357 6,179 148,69§ 156,342247 247(See this road on page 32)
N Y Central Phila & Reading-See ReadingPhila Bait &IlWash-See Penn
Reading Phila Newt & N Y-See Reading
148,486 177,899 1,506,737 1,650,353827 827(See this road on page 32)
Pickering Valley-See ReadingRR Pierre & Ft Pierre Bdg-See Ch ea
Pierre Rap Cy & N \V-See Ch do
2,305 1,436 24,469 18,32028 28
Pine Bluff Ark Riv-See St L SouthwN WN W
..•Digitized for FRASER http://fraser.stlouisfed.org/ Federal Reserve Bank of St. Louis
Page 21
MAY, 1912.] RAILWAY EARNINGS 21
EARNINGS
Freight revenue Passenger revenue
Tot., inel. other rev.Expenses-Maint. wayMaint. of equipmentTraffic expenses_ _ _Transportation exp.
Tot.. lnel. general
Net from railroad _ _ _ _Outside operations,netTotal net revenue_ _
Taxes Final net
Miles of road operated
EARNINGS
Freight revenue Passenger revenue__ -
Tot., lnel. other rev.Expenses-Maint. wayMaint. of equipmentTraffic expenses_ Transportation exp.
Tot.. inel. general
Net from railroad_ Outside operatlons,net
Total net revenue Taxes
Final net Miles of road operated
EARNINGS
Freight revenue Passenger revenue_ _ _
Tot.. Incl. other rev.Expenses-Maint. wayMaint. of equipmentTraffic expenses.._ _Transportation exp.
Tot.. Incl. general
Net from railroad_ _ _ _Outside operations net
Total net revenue.._Taxes
Final net Miles of road operated
EARNINGS
Freight revenue Passenger revenue_ - _
Tot., Incl. other rev.Expenses-Maint. wayMaint. of equipmentTraffic expenses.._ _Transportation exp.
Tot., inel. general
Net from railroad _Outside operatIons.net
Total net revenue_ _Taxes
Final net Miles of road operated
EARNINGS
Freight revenue Passenger revenue__ -
Tot.. incl. other rev.Expenses-Maint. wayMaint. of equipmentTraffic expenses.._ _Transportation exp.
Tot.. inel. general
Net from railroad_ _Outside operations,net
Total net revenue_Taxes
Final net Mlles of road operated
EARNINGS
Freight revenue Passenger revenue__ _
Tot., inel. other rev.Expenses-Malnt.iwayMaint. of equipmentTraffic expenses__ _Transportation exp.
Tot.. Ind. general
Net from railroad_ _ _Outside operations,net
Total net revenue...Taxes
Final net Miles of road operated
EARNINGS
Freight revenue Passenger revenue......Tot.. lnel. other rev.
Expenses-Maint. wayMaint. of equipmentTraffic expenses.._Transportation exp.
Tot.. Inel. general
Penn System-Western LinesWheeling Terminal
March July 1 to Mch. 31-1912. 1911. 1911-12. 1910-11.
6,3261,4771,085
4,2791.026610
1,9.51 1,684,581 3,392 35,569
1,7.11 887 10,184
1,7,14 877 10,1841,078 976 8,815
45,75410,0745,712
4319,122
Peoria & Pekin Union March July 1 to Mch. 311912. 1911. 1911-12. 1910-11.$ a $ I7,958 6,996 53,786 52,4343,806 2,966 30,263 24,836
Peoria Railway Terminal March- -July 1 to Alch. 31-1912. 1911. 1911-12. 1910-11.$ $ • 1 $6,541 3,719 42,899 38,4496,213 5,547 53,801 48.738 .
33,457 83,593 75,702 672,437 688,462 21,119 16,676 147,439 151,3929,382 8,937 5,951 84,174 75,628 1,096 3,121 15,527 13,4492,220 7,620 10,487 72,391 77,228 2,518 2,916 18,505 19,778
53 100 201 465 556 113 73 954 54713,750 38,825 39,886 329,301 366,292 14,777 11,989 104,595 106,285
26,183 59,445 60,656 520,248 553,607 20,151 19.508 151,629 150,272
7,273 24,147 15,045 152,189 134,854 968 -2,832 -4,189 1,119
7,273 24,147 15,045 152,189 134,854 968 -2,832 -4,189 1,1198,562 4,224 4,270 39,638 36,310 1,043 590 12,160 5.384
665 -88 1,3699 9
Pere Marquette March -July 1 to Mch. 311912. 1911. 1911-12. 1910-11.$ $ $ $
921,994 929,270 8,464,121 8,145,743270,812 276,555 3,095,922 3,030,931
1,299,315 1,304,040 12,598,475 12,120,306148,012 147,425 1,552,144 1,572,412273.357 219,798 2,088,750 1,887,77429,782 37,240 319,147 353,464
709.926 638,178 5.908,694 5,530,0891,196,001 1,089,318 10,168,837 9,656,651103,314
--13,51489,79956,521
214,722 2,429,638 2,463,654-8,608 -52,670 -59,878
-1,288 19,923 10,775 112,550 98,54418 18
Philadelphia & Beach Haven March July 1 to Mch. 31-1912. 1911. 1911-12. 1910-11.$ $ a614 696
$5•795 4,655
419 389 8.548 9,5251,121 1,163 16.725 16,3031,920 3,214 18,251 16.001258 189 3,326 2,27247 31 480 580812 877 9.407 8,572
3,060 4,334 31,635 27,611
--1,939 -3,171 -14,909 -11.307
206,113 2,376,968 2,403,7i 654,634 510,442 522,921
--1,939 --3,171 --14,909 --11,307168 164 1,491 1,476
33,278 151,478 1,866,525 1,880,8542,330 2,331(See this road on page 32)
Pittsburgh Allegheny & McK RocksMarch- July 1 to Mch. 31-
1912. 1911. 1911-12. 1910-11.
13,802 6,686 80,590 87,888
16,4171,651881
6,84711,953
-2,108 -3,335 --16,401 -12,78412 12
Pittsburgh Shawmut & Northern March -July 1 to Arch. 31-1912. 1911. 1911-12. 1910-11.
3146,992 77,985 1,054.723 943,2737,527 7,714 77,488 80,030
8,0891,1701,679
96,2999,15411,301
104,98914,22814,136
4,169 44,835 66,8878,862 90,412 115,317
4,463 --773 5,887 --10,327128 --58 682 --204
4,592 -831 6,569 -10,-532543 53 4,536 620
4,049 -884 2,032 11,1521 1Prescott & Northwestern February -July 1 to Feb. 29-1912. 1911. 1911-12. 1910-11.
$ $ $ $6,465 5,235 52,132 40,427370 301 4,192 4,692
7,379 6,003 60,459 48,0851,462 1,433 16,291 12,2061,553 397 11,808 8,835408 296 2,716 2,260
4,923 2,788 23,476 23,065
156,76916,69032,9671,068
48,830
87,464 1,149,684 1,040,0147,749 123,818 149.637
25,251 235.169 267,6171,08.3 9.867 10,568
34,678 340.632 383,571103,92:3 73,720 746,093 852.691
52,846 13,744 403,591 187.323
52,846 13,744 403,591 187.3231,561 1,562 14,173 14,081
51,284 12,182 389,417 173,241278 240
Quanah Acme & PacificMarch July Ito Mch. 31
1912. 1911. 1911-12. 1910-11.$ I $ $9,372 9,716 108,325 108,9711,040 1,241 12,157 14.652
11,1761,2791,007210
3,3858,963 5.392 59,665 49.731-
--1,584 611 793 --1,650
12,0451,125976308
3,109
130,342'8,24510.6202,10529.642
134,09113,0019.217692
31.2617,500 7.246 64.766 . 69.776
3,676 4,799 65.575
-1,584 611 793 -1,650299 252 2,410 2,041
-1,853 358 1,616 -3,69141 41
Ray & Gila Valley March July 1 to Mch. 31-1912. 1911. 1911-12. 1910-11.3 a 3 328,353 9,764 240,690 31,8531,107 1,107 9,646 3,270
. 3,676 4,799 65,575400 415 3,904
-74 -3,422 -16,349 -4,26512 12
Pittsburgh & Moon Run March July 1 to Arch. 31-1912. 1911. 1912. 1911.
$ $ $1s0,649 9,568 98.675 91,792118 114 1,205 1.08.3
10,797 9,713 100,198 93.159953 1,058 12,996 14,422138 248 2,598 2.84050 51 473 451
1,052 1,000 9,626 9.013
2,573 2.749 29,165 30,241
8,224 6,964 71,033 6'2,918
8,224 6,964 71.033 62.918275 175 4.000 2,875
7,949 6,789 67,033 60,0435 5
Poplar Bluff & Dan River January July 1 to Jan. 31-1912. 1911. 1911-12. 1910-11.I $ $ $
Raritan River March July 1 to Mch. 31-1912. 1911. 1911-12. 1910-11.
18,423 17,033 156,127 143,930728 697 5,993 5.951
20.1082,3412.825342
6,367
18.7192,0311,485277
5.111
172,50925,90217,2612,461
48,233
159.62021,45813,0442,474
45.14513.418 10.266 107.089 94,194
64,314 6,690 8,452 65.419 65,426
64.314 6,690 8.452 65,419 65.4264.993 730 687 5,870 6.189
3,276 4,384 61,670 59,32142 42
Reading System. Atlantic City
March July 1 to Mch. 31-1912. 1911. 1911-12. 1910-11.76,673 60,631 591,699 554.77347,181 46,419 905,530 873,178
5,960 7,765 59,549 59,23621 21
Reading SystemCatasauqua & Foglesville
March July 1 to Mch. 31-1912. 1911. 1911-12. 1910-11.14,251 20,837 137,051 177,363
140 142 1,257 1.482
30.672 12,192 261,940 41,419 129,577 115.909 1,575.434 1,501,085192 573 5,722 2,535 • 26.727 34,853 234,307 229.496
2,750 739 23,997 1,815 14,092 25,571 120.087 129,54379 201 758 614 2,056 1,635 21,724 25,457
3,093 2,979 29,826 8,592 77,518 84.328 779,919 751,349
6,435 5,060 62.868 15,545 121,341 147,159 1,167,255 1.147.515
24,236 7,132 199,072 25,873 8,236 -31.250 408.178 353,570-4,318 -4.306 -38,402 -46.277
24,236 7,132 199,072 25,873 3,917 -35,556 369,776 307.292350 225 2,093 675 7,000 7,000 63,000 63,000
23,886 6,907 196,979 25,1986 6
Reading SystemCentral Railroad of New .Jersey
- March July 1 to Afch. 31-1912. 1911. 1911-12. 1910-11.
1,998,899 1,660.304 14,982,561 13,667,131384,127 342,506 4,108,958 3,531,086
2,519,582 2,111.977 20,173,947 18,136,426168,743 176.646 1.885,774 1,849,335326,661 296,824 2,823,854 2,783,53326,003 27,065 273,697 279,906
743.355 625,994 5,947.842 5,316,2391,305,8813 1.163,939 11,296,310 10.586.2331,213,695 948,038 8,877,636 7,550,192-18,417 -12,756 105,701 66,4181,195,278
94,445935,282 8,983,338 7,616,61094,426 1,029,513 814,260
1,100,83:3 840,855 7,953,824 6,802,349671 631(See this road do page 30)
Reading SystemMiddletown & Hummelstown
March July 1 to Mch. 31-1912. 1911. 1911-12. 1910-11.
1,064 1,146 8,928 12,474163 149 1.916 1.983
1,133 1,223 10,762 14,411392 304 2,855 3,299
608"3 3
845 816 7,846 7.6631,240 1,123 10.723 11,692
-3,082 -42,556 306,776 244,292166 166
Reading SystemChester & Delaware River
March July 1 to Mch. 311912. 1911. 1911-12. 1910-11.12,157 15,585 119,271 127,426
14,541668353
5.547
17,592 141,2141,127 10,204
1043 38
6,048 48.4196,334 7,202 59.0888,206 10,389 82,125
40
148,81413.164
41430
54,58264.453
14,465 21,298 139,6153,140 2,701 21,2891,942 1,286 14,275
5 5 1114,101 3,757 35,908
180.89518,0217,361113
38,3009,228 7,788 72,048 64.215
5,236 13,10 67,567 116,68031 293
5,236 13,541 67,567 116,973600 500 5.400 4.500
4,636 13,041 62,167 112,47330 30
Reading SystemGettysburg & Harrisburg
March July 1 to Mch. 31-1912. 1911. 1911-12. 1910-11.18,418 13,547 142,738 128,2132,269 1,790 29,200 38.788
21,5432.778
86114
9,337
16,4373.5872,127143
10.753
179.80235,2967,0121,402
85,83312.359 16,810 131,045
80,360 9,183 -373 48,756482 20
8,206 10,429 82,12599 124 1.155
80,8421.259
8,107 10.305 80,969 79,5825
Reading SystemNortheast Pennsylvania
March - -July 1 to Mch. 311012. 1911. 1911-12 1910-11
4,333 4,570 35,781 34,8872,521 2.651 43.170 45.620
8,0931.649
19190
5,460 5,004
9,8643,599
98.33922,3572.683
4 26464,818
7,334 8,661 90,307
Net from railroad_ _ _ - -106 100 38 2,718 1,659Outside operations,net 1 95
Total net revenue_ -106 161 38 2;813 1,659Taxes 9 10 103 133
Final net -116 91 --65 2,680 1,459Mlles of road operated 6 6 ' 25
Pitts & Lake Erie-See N Y Cent Pitts Lisbon & West-See WabashPitts Char & Yough-See Penn 1111 Pontiac Oxford & Nor-See Gr TrunkPitts Cin Ch & St L-ee Penn R:i Port R.taling-See Madill:
1,202 8,03190
1,293 8,031200 200 1,800
102.18725.497
11.807
52.068
182.74535.4003,8101.510
84.255126.160
56,584109
9.183 -352 48,756 56,693300 275 2,700 2,475
8,883 -627 46,056 54.21841 42
Reading SystemPerkiomen
March -July 1 to Mch. 31-1912. 1911. 1911-12. 1910-11.50.092 43,939 414,384 414.7365,772 5.077 60.753 58.45358,1364,4978357
17.251
51.6349,8.31
2820
45,580
493,60840,4672,224388
145,82879,581 22,666 55,576 189.720
491,16457,8942,185395
162,122223.458
22,606 35.470 -3,941 303,887728 12
23,335 35,470 -3,929 303,8871.800 1,250 1.100 11,250
1,093 6,231 21,53525
Pt Townse id Sou-See Nor PaoPortland ferm- 3ee Bost & MaineQuincy On Sc K C-See Ch Burl & Q
267,705338
268.0439,900
34.220 --5,029 292.637 258.14338 38RY Trans of Minneao-See M .fc St LRaleigh & Charleston-See SeaboardPa iuette Lake-See N Y Central
Digitized for FRASER http://fraser.stlouisfed.org/ Federal Reserve Bank of St. Louis
Page 22
22 RAILWAY EARNINGS [VoL. Lxxxxiv.
EARNINGS
Freight revenue • Passenger revenue_ __ _
Tot., incl. other rev.Expenses-Maint. way
Maint. of equipmentTraffic expenses.__ _Transportation exp..
Tot.. Incl. generalNet from railroad.. ___Outside operations,netTotal net revenue_ _
Taxes Final net
Miles of road operated
EARNINGS
Freight revenue Passenger revenue_ _
Tot., incl. other rev.Expenses-Maint. wayMaint. of equipmentTraffic expenses__ _Transportation exp_
Tot., incl. generalNet from railroad_ _ _ _Outside operations,net
Total net revenue_ -Taxes
Final net Miles of road operated
EARNINGS
Freight revenue Passenger revenue..
Tot., incl. other rev.Expenses-Maint. wayMaint. of equipmentTraffic expenses__ _Transportation exp-
Tot.. incl. generalNet from railroad_ _ _ _Outside operations,net
Total net revenue_ _Taxes
Final net Miles of road operated
EARNINGS
Freight revenue Passenger revenue- _ - _
Tot., incl. other rev.Expenses-Maint. way
Maint. of equipmentTraffic expenses__ _Transportation exp.
Tot.. Incl. generalNet from railroad_ _ _ _Outside operations,net
Total net revenue_ _Taxes
Final net Miles of road operated
EARNINGS
Freight revenue Passenger revenue_ _ _
Tot., incl. other rev.Expenses-Maint. way
Maint. of equipmentTraffic expenses__ _Transportation exp_
Tot., incl. generalNet from railroad_ _Outside operations,net
Total net revenue_ _Taxes
Final net Mlles of road operated
EARNINGS
Freight revenue Passenger revenue_
Tot., incl. other rev.Expenses-Maint. wayMaint. of equipmentTraffic expenses__ _Transportation exp_
Tot., Incl. generalNet from railroad_ _ _ _Outside operations,net
Total net revenue Taxes
Final net Miles of road operated
EARNINGS
Freight revenue Passenger revenue_ - - _
Tot., incl. other rev.Expenses-Maint. way
Maint. of equipmentTraffic expenses_ _ _Transportation exp.
Tot.. Incl. generalNet from railroad_ _Outside operations,net
Total net revenue_ _Taxes
Reading SystemPhiladelphia & Chester Valley March-- July 1 to Mch. 311912. 1911. 1911-12. 1910-11.
4,688 5,324 45,845 45,943728 697 7,390 7.328
5,987 6,7311,174 1,574
62 2
3,524 2,6014,747 4,218
Reading SystemPhiladelphia & Reading RR.
March- -July 1 to Mch. 311912 1911. 1911-12. 1910-11.
3,783,225 3,012,946 27,810,236 26,126.558505,359 516,033 5,202,219 5,258,458
58,773 58,963 4,448,828 3,715,525 34,508,876 32,857,6039.670 11,510 275,105 284,727 2,901,250 2,753,342
31 28 758,561 735,696 6,285,537 6,154,10018 28 41,209 38,726 369.859 383,918
28,268 23,760 1,437,348 1,223,997 11,183,668 10,687.66338,362 35,706 2,577,982 2.345,720 21,336,867 20,569.419
1,240 2,51324
1,240 2,537130 130
20,411 23,256 1,870,845 1,369,804 13,172,008 12,288,184117 54,196 29,766 249,926 159,190
20,411 23,374 1,925.041 1,399,571 13,421.935 12,447,3751,170 1,170 87,413 84.142 810,690 758,028
1,110 2,407 19,24123 23
Reading SystemPickering Valley
March July 1 to Mch. 31-1912. 1911. 1911-12. 1910-11.
552 711 5,010 5,859553 620 5,561 6,380
2,247 2,509 21,307333 Cr854 2,64227 27
71,541 1,026 10,7491,905 175 13,469'
341 2,334 7,838
341 2,334 7.83817 19 256
324 2,315 7,58111 11
Reading SystemRupert & Bloomsburg
March July 1 to Mch. 31-1912. 1911. 1911-12. 1910-11.
2,391 1,714 21,638 15,76267 78 918 937
2 .501 1,826 22,85191 196 3.593
3915 910 8,362
1,008 1,109 11,9861,492 717 10,865
121,492 729 10.865
19 14 254
8.03710,304
17,3562,248
22,204 1.837,628 1,315,429 12,611,244 11,689.3461.014 1 ,022(See this road on page 32)
Reading SystemPort Reading
March- July 1 to Mch. 31-1912. 1911. 1911-12. 1910-11.177,737 101,065 1,025,880 949,232
22,407 178,2486,760 5,838141 667 30
9,947 52,97516,885 58,989 34,5745.521 119,258 67,333
55 11,833 4,4175,577 131,092 71,750265 3,800 3,500
101,907 1,036,9468,075 71,908
99 1,45834 278
26,265 317,641
966.97560,059
499286
272.541
Reading SystemPhiladelphia Newtown & New York March July 1 to Mch. 31-1912. 1911. 1911-12. 1910-11.
5,534 5.119 45,005 37,6065,885 6,095 56,617 57,70712,992 13,228 116,1191,605 925 18,254
7410 10 66
10,080 8,198 74,56211,750 9,192 93,5351,241 4,036 22,583
491,241 4,085 22,583300 300 2,700
110,41513,263
34566
71,52285,62824.786
49525,2822,700
941 3,785 19,883 22.58221 21
Reading SystemReading & Columbia
March -July 1 to Mch. 31-1912. 1911. 1911-12. 1910-11.24,134 19,273 182,587 165,9477,188 6,974 73,103 73,696
33,4184,224309244
16,585
29,8205,6561,274
7914,061
273,47354,2832,565811
134,294
260,92047,35018.175
742126.146
392,279 334,588 21,624 21,150 193,831 193,055644,666 632.387 11,793 8,660 79,641 67.86440,561 46,451 114 445685,227 678,838 11,793 8,774 79,641 68,31034,200 31.500 400 400 3,600 3,600
5,311 127,292 68,250 651,027 647,33821 21
Reading SystemStony Creek
March July 1 to Mch. 31-1912. 1911. 1911-12. 1910-11.
6,685 6,803 59,412 60,178379 421 . 3.682 2,980
7,590 7,518 65,833783 764 11,222
13 6
2,473 2,3746 36
21,2093,272 ' 3,185 32,604
66,13913,882
1
11,393 8,375,4 76,041 64,71059
Reading SystemTamaqua Hazleton & Northern March July 1 to Mch. 31-1912. 1911. 1911-12. 1910-11.
582 2,181 8,389 16,62265
593 2,181 8,465 16,62219 232 1,163 977
39 1 1 9 921,442 586 545 4,965 4,743
7.052 4,318 4,332 33,229120 74
7,172207
1,473 715 10.610 6.9641 1
Reading SystemWilliams Valley
March July 1 to Mch. 31-1912. 1911. 1911-12. 1910-11.
1,685 1,538 12,231 11,208735 1,122 9,104 9,817
2,557 2,772 22,607 22,812218 229 4,303 4,30499 39 1,221 4731 1 18 38
1,579 1,302 11,735 10,8401,901 1,605 17.383 15,823655 1,167 5,223 6,989
1 216655 1,168 5,223 7,20556 55 504 495599 1,11311 11
Richmond-Washington SystemWashington Southern
March July 1 to Mch. 31-1912. 1911. 1911-12. 1910-11.33,998 35,442 289,587 290,41046,070 41,064 347,883 324,960105,87412,66911,2681,354
40,925
100,86713,11015,2321,117
36,888
847,872102,81092,02711,100
331.453
815,22199,68985,61010,655
299,35668,865 68,666 562,005 517,32837,008 32,200 285,866 297,892
37,0083,244
----32,2002,344
35,529 610 782 6,168 5,766
30,609 --16 1,399 2,296 10,8551,106 24
4,318 4,407 33,229 31,71675 75 675 675
4,243 4,332 32,554 31,04110 9
Reynoldsvilie & Falls Greek Marchr------ -July 1 to Mch. 31 -1912. 1911. 1911-12. 1910-11.$ $ I $7,539 8,745 70.297 74,764
7,6471,69744459
1,823
8,8951,62246458
2,2234.438 4,7303,209 4,165
3,209 4,16594 94
71,46815,1506,268362
18,846
75,73614,5296,903387
19,69444,531 45,117
26,937 30,618
26,937 30,618846 846
4,719 6,710 3,115 4,071 26,091 29,77225 25
Rio Grande & Eagle Pass March July 1 to Mch. 31-1912. 1911. 1911-12. 1910-11.$ $ $ s7,264 8,797 62,719 63,953645 574 6,219 5,700
8,3351,7512,254
10,1193,0592,338
1.363 1,484
76,72916,89217,443
73,77218,45715,555
11,103 10.7556,422 7,890 54,905 54,422
1,913 2,229 21,824 19,350360
285,866 297,892 1,913 2,229 21.824 19,71029,203 21.103 .359 327 3,235 2,950
33,764 29,855 256,662 276.78835 35Rock Island System •
Chicago Rock Island & Pacific March July 1 to Mch. 31-1912. 1911. 1911-12. 1910-11.
3,228,096 3,396,856 29,910.848 31,704,2151,224.347 1,476,679 13.723,480 14,819,1294,777,604 5,200,444 46,655,057 49,442,736491,828 643,299 6,502,526 6,970,040617,771 762,237 6,298,776 6,793,784161,758 161,627 1,419,183 1,421,863
2,346,003 2.154,215 19,299,383 19,073,5453,752,246 3,857,437 34,806,067 35,507,5481,025,358 1,343,007 11,848,989 13,935,187-17,598 -5,448 -144,275 -89,1111,007,759 1,337,559 11,704,713 13,846,076225,572 206,691 1,991.755 1.981,046782,187 1,130,867 9,712,957 11.865.0307,565 7,548
Rock Island SystemSt Paul & Kansas City Short Line March July 1 to Mch. 31-1912. 1911. 1911-12. 1910-11.53,940 330,68711,984 110.98469,3918,0798,6961,712
25.948
468,65761,57952,90513,737
181.83046.335 319,98223,056 148,674
23,056 148,6742,825 13,764
Final net 20,231Miles of road operated 128Reading & Columbia-See ReadingRich Fred & Potomac-See Rich-WashRio Grande-See St L & San FranRio Grande & El Paso-See Atchison
134,91061
Rio Grande Southern-See Deny & RRossiyn Conn-See Penn RRRupert & Bloomsb-See Reading
1,553 1,901 18,589 16,75928 28Rock Island System
Morris TerminalFebruary July 1 to Feb. 29-
1912. 1911. 1911-12. 1910-11.
484 388 3,403 2,69342 69 1,064 52810 9 142 143
386 331 3.010 2.768465 436 4,428 3,64419 --47 --1,024 -950
19 --47 --1,024 --95030 20 240 177
--10 -67 --1,264 --1,1283 3
Rock Island Southern Railway March July 1 to Mch. 311912. 1911. 1911-12. 1910-11.$ $ $ $12,662 5,646 88,995 61,7177,990 7,302 87,949 31,057
21,444 13.091 180,872 98,5721,346 Cr999 13,161 5,2093,754 830 19,094 3,059691 1,852 9,419 9,446
10,274 7,020 73,403 48,50516,522 9,179 119,440 69.7314,922 3,912 61,431 28,841
4,922 3,912 61.431 28,841285 600 3,857 5,400
4,636 3,312 57,501 23,44156
Rutland-See N Y CentralSt Clair Term-See U S SteelSt Clair Tunnel-See Or Trunk
--16 1,399 2,296 10,8804 17 97 162
--21 1,381 2,198 10,7179 9
Richmond-Washington SystemRichmond Fredericksburg & Potomac March July 1 to Mch. 31-1912. 1911. 1911-12. 1910-11.101.425 111,439 878,786 839,62297,116 86.789 709,802 635,123221,23530,26228,4903,128
89,970
222.853 1,812,406 1,686,42432,766 191,404 220,80925,295 228,548 197,6182,630 25,766 24.982
71,503 688,725 590.290157,536 137,982 1.187,483 1.086,213
63,698 84,871 642,922 600,211
63,698 84,871 642,922 600,2111,094 200 9,846 1.800
62,604 84,671 615,076 598,41183 83Rock Island System
Chicago Rock Island & Gulf March July 1 to Mch. 31--1912. 1911. 1911-12. 1910-11.154,010 159,850 1,584,747 1,567,17540,920 52,346 470,989 539,249
211,927 227,324 2,207,409 2,249,40-429,643 31,806 253,554 333,35924,971 15,265 215,143 168,93610,003 8,181 89,719 81,38796,965 93,229 773,270 813,749169,310 156,228 1,405,424 1,470,84642.616 71,095 802,072 778,557-306 -167 -2,121 -2,46542,310 70.928 799.950 776,0918,122 9,501 60,316 58,177
34,188 61,427 739,634 717,914476 470
Rock Island SystemTotal Company
March July 1 to _Itch. 31-1912. 1911. 1911-12. 1910-11.
(See this road on page 32)
St Louis & Hannibal March July 1 to Mch. 31-1912. 1911. 1911-12. 1910-11.$ $ I $9,166 9,488 110,332 103.8605,384 5,485 57,494 55,12615,848 16.405 182,757 172.3282,337 4,504 54,842 89,4922,960 2,787 22,020 21,454203 215 2,015 2,001
6,758 7,989 75,513 69.51613,176 16,656 165,250 190.5112,671 --250 17,506 --18.182
2,671 -250 17.506 -18.182745 700 6.327 6,101
1,926 -951 11,179 -24,284103 103St Johnsbury & L Cham-See B &St Jos & fir Island-See Union PaoSt Lawr & Adiron-See N Y Central
Digitized for FRASER http://fraser.stlouisfed.org/ Federal Reserve Bank of St. Louis
Page 23
MAY, 19U.] RAILWAY EARNINGS 23
EARNINGS
Freight revenue Passenger revenue_ _- -
Tot., Incl. other rev.Expenses-Maint. wayMaint. of equipmentTraffic
expenses_- -
Transportation exp.Tot., incl. general
Net from railroad_ _- -Outside operations,netTotal net revenue_ _
Taxes Final net
Mlles of road operated
EARNINGS
Freight revenue Passenger revenue_ -
Tot., incl. other rev.Expenses-Maint. wayMaint of equipmentTraffic expenses._ -Transportation exp.
Tot., incl. general
Net from railroad_ _ - -Outside operations,net
Total net revenue_ _Taxes
Final net Mlles of road operated
EARNINGS
Freight revenue Passenger revenue_ __ _
Tot., incl. other rev.Expenses-Maint. way
Maint. of equipmentTraffic expenses__Transportation exp _
Tot., Incl. general
Net from railroad- _ _Outside operations,net
Total net revenue_Taxes
Final net Miles of road operated
EARNINGS
Freight revenue Passenger revenue_ _
Tot., Incl. other rev.Expenses-Maint. way
Maint. of equipmentTraffic expenses_ _ _Transportation exp..
Tot., incl. generalNet from railroad_ _ _ _Outside operations,net
Total net revenue_ _Taxes
Final net Miles of road operated
EARNINGS
Freight revenue Passenger revenue_ _ _ _
Tot., Incl. other rev.Expenses-Maint. way
Maint. of equipmentTraffic expenses__ _Transportation exp
Tot., incl. generalNet from railroad _ _ _Outside operations,netTotal net revenue_ _
Taxes Final net
Miles of road operated
EARNINGS
Freight revenue Passenger revenue_ _ _
Tot., incl. other rev.Expenses-Maint. wayMaint. of equipmentTraffic expenses_ _ _Transportation exp _
Tot.. Incl. general
Net from railroad__ _ _Outside operations,netTotal net revenue_ _
Taxes Final net
Mlles of road operated
EARNINGS
Freight revenue Passenger revenue_ - - -
Tot.. Incl. other rev.Expenses-Maint. wayMaint. of equipmentTraffic expenses_ _ _Transportation exp..
Tot., Incl. general
St Louis & (Mallon March -July 1 to Mch. 31-1912. 1911. 1911-12. 1910-11.$ $ $ s39,919 16,421 201,075 214,360
300 300 2,700 2,70040,309 16,811 204,585 217,870
693 2,764 8,851 19,7014,026 3,833 30,704 32,156
87 73 732 8524,470 2,242 26,387 27,42411,317 10,217 79,777 95,28428,992 6,594 124,808 122,586
28,992 6,594 124,808 122,586620 1,350 11,420 7,950
28,372 5,244 113,388 114,6368 8
St Louis & San Francisco SystemParis & Great Northern
----March -July 1 to Mch. 311912. 1911. 1911-12. 1910-11.19,236 17,885 132,576 114,4723,990 4,240 46,280 42,209
St Louis & San Francisco SystemSt Louis & San Francisco
March July 1 to Mch. 31-1912. 1911. 1911-12. 1910-11.
2,217,842 2,336,676 19,775,832 20,723,364817,878 892,550 8,491,035 8,676,217
3,263,042 3,475,440 30,494,078 31,598,290299,511 361,237 3,570,781 4,160,594447,498 432,894 3,985,094 4,260,12183,100 78,108 815,781 772,679
1,352,623 1,250,946 10,982,264 11,168,2802,275,076 2,216,381 20,250,509 21,271,483987,965 1,259,058 10,243,568 10,326,806
987,965 1,259,058 10,243,568 10,326,806158,690 153,814 1,436,825 1,301,430829,275 1,105,244 8,806,743 9,025,376
4,731 4,731
St Louis & San Francisco SystemSt Louis San Francisco & Texas March------- -July 1 to Mch. 31 -1912. 1911. 1911-12. 1910-11.82,674 61,880 689,276 578,21521,635 24,250 246,038 224,636
24,077 22,857 186,920 164,381 11,306 91,849 997,787 852,7033,333 1,500 19,590 23,665 18,446 28,866 165,559 174,6881,767 1,058 16,676 8,786 14,734 15,541 139,398 124,224273 265 1,905 1,792 4,370 3,599 27,900 27,252
5,059 4,706 40,596 46,802 54,709 62,297 452,816 476,60211,296 8,252 86,785 88,457 98,357 114,430 829,557 837,69412,781 14,604 100,13-4 75,923 12,948 -22,581 168,230 15,009
12,871 14,604 100,134 75,923 12,948 --22,581 168,230 15,009400 375 4,141 3,573 1,216 1,360 9,539 10,574
12,381 14,229 95,993 72,35016 16
St Louis & San Francisco SystemBeaumont Sour Lake & Western March July 1 to Mch. 311912. 1911. 1911-12. 1910-11.59,333 34,863 454,200 334,3217,179 3,536 63,246 32,675
69,747 40,781 544,052 393,46517,252 8,411 121,817 68,5489,199 4,013 63,551 31,046243 1,508 16,041 13,909
28,340 19,369 215,301 152,83958,112 36,023 447,588 292,47711,635 4,758 96,464 100,987
11,635 4,758 96,464 100,987946 636 8,647 5,918
10,688 4,121 87,816 95,069118 118
St Louis & San Francisco SystemNew Orleans Texas & Mexico
March -July 1 to Mch. 31-1912. 1911. 1911-12. 1910-11.116,572 76,206 924,277 677,19819,443 13,074 170,620 130,010
11,731 -23,942 158,690 4,435243 243
St Louis & San Francisco SystemChicago & Eastern Illinois
March-- -July 1 to Mch. 31-1912. 1911. 1911-12. 1910-11.
1,077,433 876,027 8,917,126 8,638.335220,828 217,047 2,220,200 2,166,675
1,406,378 1,174.192 12,004,538 11,580,009107,546 109,882 1,257,559 1,155,482277,814 182,924 2,329,089 1,914,92032,386 27,213 269,827 262,062565,846 444,114 4,468,801 4,169,189
1.023,004 804,796 8.693.314 7,859,320
383,374 369,396 3,311.223 3,720,688-1,815 -1,474 -15,511 -18,452381,558 367,921 3,295,711 3.702,23637,500 38,786 323,092 341,794344,058 329,135 2,972,619 3,360.441
1,275 1,275St Louis & San Francisco System
Orange & Northwestern March July 1 to Mch. 31-1912. 1911. 1911-12. 1910-11.
8,860 10,123 50,382 82,9921,692 1,824 12,952 14,696
144,245 96,085 1,164,730 874,682 12,066 14,100 77,917 116,34030,279 21,461 232,539 159,322 2,617 4,151 37,812 29,10818,531 9,037 137,301 96,417 1,857 1,086 12,206 12,117
527 2,994 35,109 31,427 40 385 2,142 4,15867,057 47,509 512,209 380,997 11,552 4,705 54,209 52,760123,492 89,062 984,165 737,558 16,517 10,973 110.078 110,55920,753 7,023 180,565 137,123 -4,451, 3,126 -32,161 5,780
20,753 7,023 180,565 137,123 -4,451 3,126 -32,161 5,7809 3,473 5,291 534 439 5.195 4,331
20,753 7,013 177,091 131,832277 264
St Louis & San Francisco SystemSt Louis Brownsville & Mexico March July 1 to Mch. 31-1912. 1911. 1911-12. 1910-11.122,215 90,557 1,052,712 839,87659,730 57,192 537,522 454,884
202,69542,20518,0837,534
81,782
166,786 1,726.381 1,405,95537,288 369,357 387,96912,510 124.086 113,0992,525 30,640 21,025
64.312 614,055 512,779156,213 124,843 1,204,881 1,106,40646,481 41,943 521.500 299,549
46,481 41,943 521,500 299,5495,150 4,500 49.084 43,000
41,331 37,443 472,415 256,549509 501
St Louis Southwestern SystemSt Louis Southwestern Ry of Texas March July 1 to Mch. 31-1912. 1911. 1911-12. 1910-11.228,721 230,872 2,411,817' 2,362,90862,492 64,751 781,791 785,466
313,688 316,266 3,422,149 3,343,46474,666 93,914 499,312 836,48093,020 78,569 738,103 662,93911,832 11,697 110,333 96,930
165,677 159,586 1,363,937 1,465,165362,976 360,162 2,869,484 3,213,445-49,287 --43,895 552,665 130,018
--587 -125 --2,316 --1,857-49,875 --44,020 550,349 128,160
10,945 10,000 95,552 85,726-60,820 -54,020 454,797 42,434• 703 703St Louis Southwestern System
Paragould SoutheasternMarch July 1 to Mch. 31-
1912. 1911. 1911-12. 1910-11.3,182 2,785 33,958 29,5481,659 1,550 17.593 16.873
--4,985 2,687 -37,357 1,44861 61
St Louis Rocky Mountain & Panic March---- -July 1 to Mch. 31-1912. 1911. 1911-12. 1910-11.$ $ $ $21,034 16,841 160.189 187,9893,181 4,251 30,659 34,49625,016 22,507 201,339 233,8735,564 9,684 50,667 54,6155,966 5,894 59,249 51,414633 529 6.238 6,925
6,545 7,397 58,894 67,02921.073 25,607 196,221 197,7483,943 --3,100 5,117 36.124
3,943 --3,100 5,117 36,124
3,943 -3,100 5,117 36,124105 105(See this road on page 32)
St Louis Southwestern SystemTotal Company
March -July 1 to Mch.311912. 1911. 1911-12. 1910-11.766,030 767,533 6,955,326 7,117,111154,491 167,340 1.797,055 1,858,244972,730' 134,250210,04441,424341,380
982,493 9,280,039 9,431,352169,711 1,025,565 1,491,176183,461 1,696,285 1,602,55037,679 366,795 338,020
323,735 2,818,794 2,966,993777,263 754,932 6,285.960 6,754,642195,468 227,562 2,994,079 2,676,709-1,088 -617 -10,825 -8.031194,378 226,944 2,983,253 2,668,67633,507 31,574 286.464 265.815160,871 195,369 2,696,789 2,402.861
1,545 1,499(See this road on page 32)
St Louis Southwestern SystemPine Bluff Arkansas River
March July 1 to Mch. 31-1912. 1911. 1911-12. 1910-11.
1,860 2,326 19,767 21,272991 1.503 11.074 14.257
March 1912.
4,579610
St Louis & San Francisco SystemFt Worth & Rio Grande
March July 1 to Mch. 31-1912. 1911. 1911-12. 1910-11.37,946 41,075 413,267 455,26918,881 27,178 224,064 241,25363,881 75,414 701,321 752,72313,7_08 9,508 147,682 123,5159,676 11,735 90,307 89,8684,927 4,344 31,609 31,978
37,386 38,629 348,022 344,34270,582 68,140 651,886 624,286
--6,701 7,273 49,434 128,437
-6,701 7,273 49,434 128,4372,357 2,795 18,704 21,214
-9,059 4,478 30,730 107,222235 235
St Louis & San Francisco SystemTotal Company
March July 1 to Mc/i. 31-1912. 1911. 1911-12. 1910-11.
2,357,698 2,457,516 21,010,951 21,871,320862,384 948.218 9,007,417 9,184,315
3,462,306 3,665,560 32,380,106 33,368.097334,998 401,111 3,903,612 4,482.462473,675 461,228 4,231,475 4,482,99992,670 86,316 877,195 833.701
1,449,777 1,356,578 11,823,698 12,036,0262,455,311 2.407,203 21.818.737 22,821.920
1.006,993 1,258,354 10,561,366 10,546,175
1,006,993 1,258,354 10,561,366 10,546,175162,663 158,344 1,469,209 1,336.791844,328 1,100,009 9,092,156 9,209,3835,225 5,225
St Louis & San Francisco SystemLouisiana Southern
March -July 1 to Mch. 31--•1912. 1911. 1911-12. 1910-11.
3,295 68,3391,439 11,4355,598Cr571,566
13,3244,916
681
84,86716,21714,773
9532,55464,759
20,107
681 20,107733 5,465
--51 14,64245
St Louis & San Francisco SystemRio Grande
March -July 1 to Mch. 31-1912. 1911. 1911-12. 1910-11.
590 316 4,305 672283 193 3,289 425
1,015237203
627 8,841 1,345293 2,562 1,194221 1,228 433
64352 463 3,876 952820 984 7,988 2.585194 '--357 853 --1,239
194 -357 853 --1,23965 75 580 150129 -432 272 -1,38922 22
St Louis Southwestern SystemSt Louis Southwestern
March July 1 to Mch. 31-1912. 1911. 1911-12. 1910-11.537,309 536,661 4,543,509 4,754.20391,999 102.589 1.015,264 1,072.878
659,04259,584117,02429,592
175.703
666,227 5,857.890 6,087,88875,797 526,253 654,696104,892 958,182 939,61125,982 256,462 241,090164.149 1.454,857 1.501,828
414,287 394,770 3,416,476 3.541,197
244,755--501
244,25322,562
271,457 2,441,414 2,546,691--492 --8,509 --6,174
270,964 2,432,904 2,540,51621,574 190,912 180.089
221,691 249,389 2,241,992 2,360,427842 796
St Louis Southwestern SystemEastern Texas
-July 1 to Mch. 31-1911. 1911-12. 1910-11.4,976 38,391 47.903583 4,754 6,001
5,562 5,914 46,166 57,1921,440 3,447 13,203 19,950
44 62 1,038 3,103102 95 994 1,013
1,469 1,217 12,703 13,7143,359 5.126 30,893 40,6362,202 787 15,273 16,555
2,202 787 15,273 16,555220 200 2,083 1,712
1,982 587 13,189 14,84330 30
St Louis Southwestern SystemStephenville North & South Texas March----- --July 1 to Mch• 31-1912. 1911. 1911-12. 1910-11.
8,367 3,508 100,939 52.2812.799 2,727 32.715 16.925
5,338 4,665 55,878 51,813 2,970 3,925 31,920 36,447 11,9194,169 1,892 28,971 25,840 1,446 2,500 12,982 14,115 3,975108 114 1,667 4,283 77 35 691 788 40763 42 434 426 52 33 319 299 187
1,945 1,758 17.152 17,009 1,489 1,186 12,354 10,868 8,5416,606 4,095 51,116 50,390 3,378 4,075 29,509 29.475 14.641
Net from railroad_ _ -1,267Outside operations.net
Total net revenue__ -1,267Taxes 292
Final net -1,559Miles of road operated 37St L Browns & Mex-See St L & S FSt I. El Reno &W-See Ft Sm & W
6,772 141,445 74,2424,265 53,376 39,905268 7,745 3,669190 2,003 1.535
2.516 68,043 17.4108.036 142,248 68,017
570 4,762 1,422 -407 --150 2,411 6,972 --2,721 --1,264
570 4,762 1,422 -407 -150 2.411 6.972270 2,628 2,430 174 174 1,566 1.566300 2,134 -1,007 -58137 31St L Iron Mt & So-See Mo PaoSt L 11 B & Ter-See Ter BR As of St L
-803 6,225
-2,721 -1,264 -803 6,225250 360 2,036 1.952
-324 845 5,406 --2,971 --1,625 -2,839 4.27231 106 75
St L S & Tex--See St L & San Fran St IS W of Tex-See St L SW
Digitized for FRASER http://fraser.stlouisfed.org/ Federal Reserve Bank of St. Louis
Page 24
24 RAILWAY EARNINGS (VOL. Lxxxxiv.
EARNINGSFreight revenue Passenger revenue.._-Tot., incl. other rev.Expenses-Maint. wayMaint. of equipmentTraffic expenses.._ _Transportation exp.Tot., incl. general
Net from railroad_ _- -Outside operations,netTotal net revenue.._Taxes Final net Miles of road operated
EARNINGSFreight revenue Passenger revenue_ _ _ _Tot.. Incl. other rev.Expenses-Maint. wayMaint. of equipmentTraffic expenses... _Transportation exp..Tot., incl. general
Net from railroad_ _ _ _Outside operations,netTotal net revenue Taxes Final net Miles of road operated
EARNINGSFreight revenue Passenger revenue__ -Tot., incl. other rev.Expenses-Maint. wayMaint. of equipmentTraffic expenses.._ _Transportation exp_Tot., incl. general
Net from railroad_ _Outside operations,netTotal net revenue.._Taxes Final net Miles of road operated
EARNINGSFreight revenue Passenger revenue_ _ _ _Tot., incl. other rev.Expenses-Maint. wayMaint. of equipmentTraffic expenses__ -Transportation exp_
Tot., incl. generalNet from railroad.... _Outside operations,netTotal net revenue...Taxes Final net Miles of road operated
EARNINGSFreight revenue Passenger revenue__ - -Tot., Incl. other rev
Expenses-Maint. way'Maint. of equipmentTraffic expenses._.Transportation expTot., incl. general
Netlfrom railroad_ _Outside operations,netTotal net revenue_ _Taxes Final net Miles of road operated
EARNINGSFreight revenue Passenger revenue_ _ _ _
Tot..'inci. other rev.Expenses-Maint. wayMaint. of equipmentTraffic expenses...Transportation exp _Tot.. incl. general
Net'from railroad....Outside operations,netTotal net revenue_ _Taxes Final net Miles_of road operated
cE.ARNINGSFreight revenue Passenger revenue _ _
Tot., inci, other rev.Expenses-Maint wayMaint, of equipmentTraffic exnenses_ _ _Transportation exp_Tot., incl. general
St Louis Transfer March .July 1 to Arch. 31-
1912. 1911. 1911-12. 1910-11.
37,7591,2051,880184
21,048
31,3831,1923,297204
14,283
289,47322,80230,7041,719
154,770
292,25215,79525,5661,647
146,22825,570 20,353 222,567 201.36912,188 11,030 66,906 90,88312,188 11,030 66,906 90,883933 933 7,784 7,66511,254 10,097 59,122 83,2176 6Salem Falls City & Western March July 1 to Mch. 31-1912. 1911. 1911-12. 1910-11.$ $ $ $7,038 9,064 54,833 68,1802,558 2,525 26,269 26,77110,8021,0321,367
452,955
11,8571,8621,9083,286
88,84112,64912,806
56526,018
98.93217,29614.530
St Louis Troy & Eastern March July 1 to Mch. 31-1912. 1911. 1911-12. 1910-11.$ $ $ $38,693 13,562 204,316 228,24438,6931,1197,468
525,840
13,5622,3397.904
584.899
16,472 18,30122,221 -4,738
22,221 -4,738900 1,186
204.31613,09958,596
54442,262133,65370,663
70,6638,100
228,24418.77369,054
51552,177160,641
St Paul Bridge & Terminal March July 1 to Mch. 31-1912. 1911. 1911-12. 1910-11.
11,1331.2001.331
54,503
10,7461,5041,1704,852
7,401 7,88767,602
67,6028,386
21,321 -5,925 62,563 59,21525 25Salt Lake & Los Angeles March July 1 to Mch 31-1912. 1911. 1911-12. 1910-11.$ $ $ $2,320 2,624 20,625 21,928442 797 55,801 59,9603,509 3,431 81,319 89.90617 3,536 7,279 12,186352 533 6,297 4,359522 3,093 12,39431,816 3,339 1,373 35,909 29.752
5,920 7,623 57,383 69,322 5,230 7.392 73.471 73.7284,882 4,234 31,458 29,610 -4,720 -3.961 7.847 16,1784,822 4,234 31,458 29,610 -1,720 --3,961 7,847 16.178333 179 3,002 1,618 275 276 2,482 2.4394.548 4,054 28,456 27,991 -4,995 -4,237 5,365 13.73864 64 15 15San Diego & Cluyamaca
February July 1 to Feb. 29-1912. 1911. 1911-12. 1910-11.$ $ $ $7,972 6,165 64,434 47,8577,007 5.864 54.179 42,12416,018 12,982 133.293 98,2071,714 1,148 19,691 15,5342,338 2,275 22,311 17,33291 73 948 3184,783 3,670 39,734 29,4229,612 7,950 88,332 68,0696,406 5,032 44,960 30,137
San Diego SouthernFebruary July 1 to Feb. 29-1912. 1911. 1911-12. 1910-11.
$ $ $ $6,438 4,170 55,004 38,3168,291 7,266 62,318 57,13115,461 12,079 124,214 100,9123,244 1,927 19,704 16,1262,581 2,264 18,046 16,408238 262 2,141 2,0335,320 4,878 45,066 40,99612,754 10,500 95,807 84,0932,706 1,578 28,407 16,819
6,406 5,032 44,940 30,137 2,706 1,578 28,407 16,819500 200 4,000 1,600 560 440 4,480 3,5205,906 4,832 40,060 28,537.25 25Seaboard Air Line System
Seaboard Air Line March July 1 to Mch. 31-1912. 1911. 1911-12. 1910-11.1,529,887 1,600,476 11,508,988 11,142,072473,394 441,466 3,886,395 3,567,2502,213,531 2,253,819 17,145,147 16,360,428300,167 227,871 2,480,494 2,130,757297,267 292,157 2,410,949 2,198,00162,354 58,103 541,816 545,637793,397 736,455 6,201,206 5,502,8421,518,144 1,369,663 12,154,070 10,831.725695,386 884,156 4,991,076 5,528,703-3,628 777 -13,333 -8,631691,758 884,933 4,977,743 5,520.07180,000 72,000 677,000 602,000
611,758 812,933 4,300,743 4,918,0713,070 3,046
Sierra Ry of California March July 1 to Mch. 31-1912. 1911. 1911-12. 1910-11.$ $ $ $20,490 20,933 223,114 210,6346,884 6,100 81,462 76,79429,007 28,883 320,136 302,5725,438 9,003 57,227 76,6653,012 2,459 28,019 22,143377 395 3,619 3,237
6,700 7.392 66,615 86,52717,235 20,749 168,535 200,93911,772 8,133 151,600 101,632
11,772 8,133 151,600 101,6321,700 1,500 15.458 13,47310,072 6,633 136,141 88,159
75 75South Georgia
March July 1 to Mch. 31-1912. 1911. 1911-12. 1910-11.$ a a a11,038 10,490 103,211 111,9894,116 4,356 44,348 47.215
2,146 1,138 23,927 13,29949 49Seaboard Air Line System
Chesterfield & Lancaster March July 1 to Mch. 311912. 1911. 1911-12. 1910-11.7,785 10,883 39.090 53,722
818 695 7,674 8.4308,924 12,0641,362 984511 35910 1
1,886 2,0434,449 3,9754 ,475 8,0884,475 8,088
49.5245,826
• 3,481113
13,93929.62319,900
64,9705.8112,495105
13,74327,75837,211
3,731 2,858147 80
3,878 2,939450 433
115,23614,36012,003
2146,385
117,84712,39910,42750,815
75,719 76,41539,516 41,4322,200 3,687
41,717 45,1194,690 4,828
3.427 2,506 37,026 40,290
Sala Antonio & Aransas Pass March July 1 to Mch. 31-1912. 1911. 1911-12. 1910-11.$ $ $ $226,017 178,016 2,424,058 2,244,79280,711 72,599 903,291 840,627325,73459,94153,6875,429
147,593
269,537 3,526,527 3,269,53888,230 580,354 631,75849,192 424,892 429,7155,129 50,919 45,188
131,151 1,290,845 1,181,131 277,388 285,000 2,436,775 2.378,72948,345 -15,462 1,089,752 890,80948,345 -15,462 1,089,752 890,80911,000 11,000 99,000 89,00037,345 -26,462 990,752 801,809-727 -727
San Pedro Los Angeles & Salt Lake February July 1 to Feb. 29-
1912. 1911. 1911-12. 1910-11.$ $ $J5,343 342,508 3,471,986 3,196.716233.131 196.118 1,960.126 1,806.471
742,16973,722189,00230,808
268,773
576,754 5,815,309 5,337.825109,100 951,389 964,295122,150 1,336,979 855,86033,362 254,577 251.009
259,910 2,257,249 1,981,036579,051 542,718 4,936,276 4,189,867163,117 34,036 879,033 1,147,958---2,489 ---5,381 --31.336 ---10.054160,628 28,654 847,696 1,107.90324.701 26,694 197,640 214.086135.926 1,959 650.056 893,817
1,115 1,105Seaboard Air Line System
Raleigh & CharlestonFebruary July Ito Feb. 29-1912. 1911. 1911-12. 1910-14.5,886 9,102 43,190 47,5691,231 952 10,973 9,9207,314 10,293 56,249 59,0931,206 2,817 10,171 12,939669 1,047 5,770 5,2676 155 560 869
1,950 2,259 16,439 17,1664,743 6,895 37,915 40,8362,570 3,397 18,334 18,257
100 6519,900 37,211 2,570 3,397 18,434 18,322216 283 1,945 1,750 224 165 1,699 1,320
35,461 2,346 3,232 16,735 17,00243 43South Dakota Central
March- July 1 to Mch. 31-1912. 1911. 1911-12. 1910-11.$ $ $ $14,375 16,005 97,114 153,2204.011 5,190 39,506 51,379
4,258 7,805 17,95438 38South Buffalo
March July 1 to Mch. 31-1912. 1911. 1911-12. 1910-11.3 $ $ $33,149 32,729 238,246 247,260175 162 1.196 1,37066,1423,5595,912129
25,262
58,4843,0816,131185
27,351
479,50848,29647.3472,139
203.308
519.81759,21653,1131,711
249,14236,191 38.271 316.850 374,84220,951 20,213 162,658 144,97529,951 20,213 162,658 144,975950 800 8,318 7,20029,001 19,413 154,340 137,77536 36
Southern SystemSouthern March July 1 to Mch. 311912. 1911. 1911-12. • 1910-11.3,821,534 3,722.150 31,263,376 30,393,1561,259,621 1,221,013 12,835.479 12,237.485
16,898 15,841 160,636 167.940 5,556,583 5,361.435 47.923,233 46,176,1783,156 2,737 28,354 37,554 658,450 635,498 5,735,624 5,725.6982,074 2,346 17,805 15,217 873,077 860,260 7,601,710 7,427,137292 308 3,157 2,205 149,578 124,06 1,251.144 1,160,1165.010 4,799 37,570 40,073 1,987,308 1,865,217 16,569,040 15.509,29811.549 11.055 96,143 103.097 3,829.130 3.635.154 32,572,532 31,153.0745,349 4,785 64,492 64,842 1,727.453 L726,280 15,350,700 15,023,1037,619 -6,605 49,857 3,2945,349 4,785 64,492 64,842 1,735,072 1.719,674 15,400.558 15.026.397522 477 4,701 4,300 205,656 184,436 1,833,603 1,640,3394,826 4,308 59,791
77 77Southern System
Asheville & Craggy Mountain March July 1 to Mch. 31-1912. 1911. 1911-12. 1910-11.400 340 3,423 2,5654001289
283421
342 3.435696
9 1212,570622621
304 1,246 2.046317 2.604 3.324
Net from railroad.. -20Outside operations,netTotal net revenue__ -20Taxes 21
nFinal net -41Mlles of road'operated 4St Paul & K C Sh Line--See,Rook /31
19,3893,1872,025338
5,199
22,2681,4202,501203
5,115
147,72826,31517,3692,447
44,80112,023 10,912 102,6287.366 11,356 45,100
216,13913,44722,0672.066
47,79896,128120,011
7.366 11,356 45,100 120,011900 900 8,210 7,500
6,466 10,456 36,890 112,511102 102
Southern SystemAlabama Great SouthernMarch July 1 to Mch. 31-.1912. 1911. 1911-12. 1910-11.
286,371 218.525 2.401,443 2.282,00681,250 81,211 885,706 852,827401.43549,84881,14311,462
136.298
335,255 3.584,092 3.425,89749,233 402.805 432,63999,447 783,025 788,8139,758 100,552 03,039
118,476 1.115,069 1.049,358288,426 286.076 2.487,838 2,446,499
60,541 1,529,416 1,535.237 13,566,955 13,386.0587,089 7,038Southern SystemAugusta Southern March July 1 to Mch. 311912. 1911. 1911-12. 1910-11.14,674 15.294 109.347 89.5453,921 3.492 41.406 37,553
19,5332,3001.414123
8 713
20.0462,6661,922191
8 309
160.38323.41212,8231,598
68.54913.205 13.646 112.559
24 831 -754
24 831 -75422 194 198
137,20624,25013,8641 812
53.02298.584
6.327 6.399 47.824
6.327 6.399 47.824575 500 5.432
2 637 -952 5,752 5.899 42.3914 82 82Sanir Rh' & Rang Ltcs-See B do M
38.621
113,009 49,179 1.096,253-491 -180 -4,118979,397--6,205
112,518 48,998 1.092,134 073,19113,935 13,241 133,393 122,31698,583 35,757 958,74-1 850,874
309 300Southern System
Blue Ridge March-- -July 1 to Mch. 31-1912. 1911. 1911-12. 1910-11.14.247 14.955 88.292 85.7613.966 3.553 38.096 39.09319.667 20,036 137,478 134,3072,676 1,927 24,353 17,6341,052 722 11,776 7,517152 166 1,557 1,607
5,598 5,419 46,157 42.69310,420 9,240 92,162 77.54d
9,246 10.795 45,315
38.6214.486
34.135
56,760
9.246 10,975 45,315 56,760514 440 4,018 4.010
8.732 10,355 41,296 52,75044 44
Sierra & Mohawk-See Nev-Cal-OreSharosville-See Balto & Ohio
Digitized for FRASER http://fraser.stlouisfed.org/ Federal Reserve Bank of St. Louis
Page 25
MAY, 1912.1 RAILWAY EARNINGS 25
EARNINGS
Freight revenue Passenger revenue.._ _
Tot.. Incl. other rev.Expenses-Maint. wayMaint. of equipmentTraffic expenses.._ _Transportation exp_
Tot., incl. general
Net from ratlroad.._ _ _Outside operations,netTotal net revenue_ _
Taxes Final net
Miles of road operated
EARNINGS
Freight revenue Passenger revenue.._ _
Tot., incl. other rev.Expenses-Maint. way
Maint. of equipmentTraffic expenses_ - -Transportation exp.
Tot., incl. general
Net from railroad_ - - -Outside operations,net
Total net revenue Taxes
Final net Mlles of road operated
EARNINGS
Freight revenue Passenger revenue__ _Tot. Incl. other rev.
Expenses-Maint. wayMaint. of equipmentTraffic expenses_
-Transportation exp.Tot., incl. general
Net from railroad_ _ _ _Outside operations,net
Total net revenue Taxes
Final net Miles of road operated
EARNINGS
Freight revenue Passenger revenue
Tot., incl. other rev.Expenses-Maint. wayMaint. of equipmentTraffic expenses__ _Transportation exp.
Tot.. Incl. general
Net from railroad_ _Outside operations.net
Total net revenue Taxes
Final net Miles of road operated
EARNINGS
Freight revenue Passenger revenue.._ _
Tot., incl, other rev.Expenses-Maint. wayMaint. of equipmentTraffic expenses_ _ _Transportation exp.
Tot., lnel. general
Net from railroad_ _ _ _Outside operations,net
Total net revenue.._Taxes
Final net Miles of road operated
EARNINGS
Freight revenue Passenger revenue.._ _
Tot., incl. other rev.Expenses-Maint. wayMaint. of equipmentTraffic, expenses.._ _Transportation exp.Tot , lnel. general
Net from railroad_ _ _ _Outside operations,net
Total net revenue_ _Taxes
Final net Miles of road operated
Southern SystemCumberland
February July 1 to Feb. 29-1912. ' 1911. 1911-12. 1910-11.
2,472 1,313 20,798 16,650612 450 5,812 3,927
3,124 1,832 27,0741,013 580 8,067184 73 1,039117 86 883
1,321 711 9,700
2,965 1,668 21,916
159 163 5,157
159 163 5,15724 24 193
135 139 4,96412 8
Southern SystemHartwell
February July 1 to Feb. 29-1912. 1911. 1911-12. 1910-11.
1,820 1,514 14,382 12,815400 362 3,859 3,841
Southern SystemDanville & Western
March-- July 1 to Mch. 311912. 1911. 1911-12. 1910-11.18,432 17,679 163,998 166.5504,589 5,143 49,866 51,949
20,925 24,120 24,051 224,540 227.9786,019 5,482 4,386 37,894 30,311781 2,122 3,191 22,165 19.831746 328 163 1,924 1,564
6,985 6,836 7,487 61,392 58,10816,296 15,585 16,025 131,165 117,237
4,628 8,535 8,026 93,374 110,740
4,628 8,535 8,026 .93,374 110,740209 1,132 1,226 10,482 10,091
4,419 7,402 6.799 82,891 100,64983 83
Southern SystemMobile & Ohio
March -July 1 to Mch. 31-1912. 1911. 1911-12. 1910-11.812,259 850,703 7.031,184 6,786.369107,822 107,993 1,097.485 1,096.299
2,308 1,971 18,909 17,508 978,164 1,019,139 8,649,952 8,370.8781,361 597 4,051 2,649 108,417 114,515 991,088 971,882106 136 1,654 544 190,176 171,314 1,603,790 1.450,6636 1 38 49 35,443 31,423 306,783 294,305
849 873 6,819 6,681 364,079 346,332 3,086,110 2,876.845
2,409 1,712 13,389 10,706
--101 259 5,519 6,802
-101 259 5.519 6,80275 50 547 442
-176 209 4,971 6,35910 10
Southern SystemSouthern Ry in Mississippi
March July 1 to Mch. 311912. 1911. 1911-12. 1910-11.43,387 51,036 536,337 510,76122,694 29,170 292,199 325,78872,296 86,761 893.568 896,83323,850 26,343 205.356 201,8489,810 5,404 81,915 55,1612,192 2,139 21.622 23,664
38,899 39,170 348,054 343,14079,359 76.672 692.923 658,835
-7,063 10,088 200,645 237,997
--7,063 10,088 200,645 237,9974,218 5.103 43.629 44,534
-11,281 4,985 157,015 193,463280 280
Southern Pacific SystemSouthern Pacific
March July 1 to Mch. 31-1912. 1911. 1911-12. 1910-11.
4,149,403 4,191,691 40,147,224 40,493,4392,440,418 2,484,054 23,488,548 23.986,006
731,317 702,674 6,274.379 5,904,610
246,846 316,465 2,375,573 2.466,268-855 -715 -8,563 -12.564
245,990 315,749 2,367,009 2.453.70327.483 25.460 229,399 225,540218,507 290,289 2,137,609 2.228,163
1,114 1,114
Southern SystemTallulah Falls
March -July 1 to Mch. 31-1912. 1911. 1911-12. 1910-11
4,793 5,945 49,644 41.8853,394 2,293 38,202 28.8989,149 8,997 98,069 79,3764,960 3,627 19,132 21,9342,195 • 454 15.683 4,860129 74 927 ' 909
2,692 2,625 27,766 25,264
10,407 7,234 68,426 57,340
-1,257 1,762 29.642 22,036
-1,257 1,762 29,642 22,036300 400 3,120 2,850
--1,557 1,36258 58
Southern SystemGeorgia Southern & Florida
March -July 1 to Mch. 31-1912. 1911. 1911-12. 1910-11.128,853 123,175 978,829 1,004,54965,099 61,991 642,614 605,575
223,60326,44643,5877,457
88.444
209,997 1,875.403 1,847.91221,317 188.323 198,21039,869 358,277 371.2375,798 65,350 54,265
83,841 721.314 691.139
175,648 159,511 1,416,892 1,395,565
47,955 50.486 458.511 452.346
47.955 50.486 458.5119.818 9.157 92.437
452.34684.475
38.136 41.329 366.073 367.871395 395
Southern System• Northern Alabama March July 1 to Mch. 31-1912. 1911. 1911-12. 1910-11.31,481 33,910 289,489 339.6535,527 4,880 57,414 53,300
38,284 39,957 358,3026,931 13,997 49,6706,189 5,784 48,878128 127 1,492
18,023 15,687 154,86132,250 36,607 263,892
404,97075,21049,5141,718
160,630295,783
6,033 3,350 94,409 109,186
6,033 3,350 94,409 109,1862,712 2,589 24,085 24,306
3,321 761 70,323 84.879112 112
Southern SystemVirginia & Southwestern
March July 1 to Mch. 31-1912. 1911. 1911-12. 1910-11.135,852 90,014 1,151,951 885,37612,172 11,727 123,756 114.515
151,12918.51632,0841,886
40,769
105.690 1,307,304 1,033,97112.961 155,850 118,04427,381 264,802 227,5041,412 16,459 13.341
31.039 381,503 313,65996.500 77.413 852,590 707.113
54,629 28,277 454,713 326,857
54,629 28,277 454,713 326,8575,331 4.828 44.254 40,127
26,522 19.186 49,298 23,949 410,458 286.730240 242
Southern Pacific SystemCorvallis & Eastern
March July 1 to Mch. 31-1912. 1911. 1911-12. 1910-11.11,466 10.149 124,523 121.7927,100 8,628 112.268 112,470
7,090.018 7,231,623 68,326,426 69,233,883745,440 987,989 7,701,368 8,568,512950,551 940,467 8,421,615 8,862,377192,132 167,074 1,582,443 1,480,529
2,159,497 2,173,641 19,821,479 18,891.553
4,248,349 4,528,046 39,288,702 39,892,326
.2,841,668 2,703,576 29,037,723 29,341,5565.119 29,442 202.320 225,170
2,846,788 2,733,019 29,240,043 29,506,727385,663 295,095 3,031,274 2.512,826
2,461,124 2,437,824 26,208,769 27,053,9006,221 6,187
Southern Pacific SystemHouston & Texas Central
March-- July 1 to Mch. 311912. 1911. 1911-12. 1910-11.256,593 326,711 2,897,693 3,422,798111,881 119,587 1,344,921 1,272,753409,62162,29966,75820,082
223,240
482,477 4,584,066 5,016,77686,487 648,174 704,68175,095 760,692 602,89817,423 171,831 165,183
227.435 1,932,402 2,001,874391,161 430,197 3.698,173 3,669,210
18,459 52,280 885,892 1,347,566-1,571 --1,337 --2.141 --4,89616,888 50,943 873,750 1.342,66920,557 17,816 201,367 165,134-3,669 33,126 672,383 . 1,177,534
789 789
Southern Pacific SystemLake Charles & Northern
March July 1 to Mch. 3 1 -1912. 1011. 1911-12. 1910-11.13,152 13,623 56,578 81,4971.918 2,555 17,490 21,516
20,6027,4132,014391
8,24019.696
20,5229,6631,887471
0,835
255,47197,46817,3263.32874.198
252,30292,63918,6254,019
67,18120,255 204,866 191,938
905 266 50,604 60,363
9051,709 1,657
266 50,604 60,36315.634 15.250
--804 -1.390 34.976140 140
Southern Pacific SystemHouston East & West Texas
March July 1 to Mch. 31-1912. 1911. 1911-12. 1910-11.74.787 77.477 675,514 705,35624,626 27,715 246.739 271,292
105,693 111,546 976,580 1,033,30614,399 17,887 174,136 176,89210,673 10.942 101,527 88,3802,836 1,676 17.911 16,104
41.534 37,793 330,978 340.42173,406 72,557 657.938 658,000
32,287 38,988 318.642 375,305
32,287 38,988 318,642 375.3053,916 3,319 38,554 30,78228,371 35,668 280,087 344,523
190 190
Southern Pacific SystemLouisiana Wpstern
July 1 to Mch. 3r1912. 1911. 1911. 1911-12. 1910-11.115,483 117,607 898,576 1,013,65051,406 59,519 489,440 505,835
15,528 16,332 77,582. 105,766 176,568 185,386 1,465,032 1,593,6343,419 4,224 24,145 26,282 16,170 17,952 174,664 202.3951,267 • 265 6,273 7,980 31,922 23,190 259,173 223,275
52 69 345 402 7,577 6,859 69,730 57.1953,958 4,624 28,918 35,211 62,771 • 55.419 492.275 471.4238,050 9,581 61,760 72,3936,577 6,751 15,822 33,372
6,577 6,751 15,822 33,37250 55 578 464
EARNINGS
Freight revenue Passenger revenue.._ _
Tot., incl. other rev.Expenses-Maint. way
Maint. of equipmentTraffic expenses__Transportation exp. Mt., incl. general
Net from railroad_ _Outside operations,net
Total net revenue_ _Taxes
Final net Mlles of road operatedSo Kan itY of Tex-8
6,527 6,696 15,244 32,90865 65
Southern Pacific SystemTexas & New Orleans
March July 1 to Mch. 31-1912. 1911. 1911-12. 1910-11.230,650 239,817 1,941.287 2.005,77380,027 90.086 773,211 813,604333,15246,21275,9369,545
145,308
348,906 2,892,140 2,992.87764,635 478,668 532,24569,285 655,072 520,5857,747 74,096 65,458
131,830 1,172,750 1,179.354288.414 283.853 2,474,912 2.384,600
44,738 65,052 417,228 608,277-927 1,125 --3,242 5,29543,810 66,177 413,985 613,57313,683 12,257 131,760 110.76830,127 53,920 282,225 502,804
458 458es Atchison
124,482 110,982 1,054.875 1.022,13652,0813 74,404 410,157 571.498
704 748 2,008 79952,790 75.152 412,165 572,2980,534 6,577 64,341 63.10346,256 68,575 -347.824
207 207
Southern Pacific Systemrota! Company
March July 1 to Mch. 31-1912. 1911. 1911-12. 1910-11.
So Ry in Miss-See Southern
509,195
(See thisroacrom page 32
Staten island-See Balto & Ohio
Southern Pacific SystemGalveston Harrisburg & San Antonio March -July 1 to Mch. 3 1 -1912. 1911. 1911-12. 1910-11.594,979 614,231 5,495,826 5,849,038.243,846 257,830 2.222.087 2.123.722890.249102.203186.70036,623
409.696
919.695 8.152.117 8.397,137126.117 992.735 1.091,072166.987 1.455.615 1,287.30232,993 300.380 252.720327,758 3,175.866 3,069,490
765,238 685,339 6,174,697 5.958.473
125.010 234.356 1.977.419 2,438.663-7.391 -740 -45.681 -22.290117,618 233,616 1,931,737 2.416,37335,404 29.697 348,413 270,515
45.113 • 82,214 203,919 1,583,324 2,145,858.1,338 1.338 •Southern Pacific System
Iberia & Vermilion February
1912. 1911.July 1 to Feb. 29-
1911-12. 1910-11.5,369 2 833 53.987 54,6851,806 1.214 15,071 12.8017,433 4,355 71,430 69,9771,166 1,521 8,378 12.220184 249 1.208 890131 111 970 805
2.051 985 19.409 14.6973,658 3.027 30.986 29.873
3,775 1 327 40,444 40,103
3.775 1,327 40,444 40.103248 217 2.122 1,707
3,527 1.110 38,321 38,39621 20
Southern Pacific SystemMorgan's Louisiana & Texas RR. & SS. March July 1 to Mch. 31-
1912. 1911. 1911-12. 1910-11.260,530 250,360 2,666.065 2,773,14694,216 99,100 949,368 916,202383.018 376,273 3,844.300 3.922,58356,558 55,157 487.238 529.10150.877 60,999 502,001 462,23013,278 12,102 123,140 101.637
172.958 150.139 1,548,395 1.360,816305,031 292,250 2.772.050 2,576.826
77,986 84,022 1,072,250 1.345,757-1.506 206 -17,351 -12.730'76,480 84,228 1,054,899 1,333,02617,762 18.756 167,299 175.500-58.718 65,472 887,599 1,157,525
404 404
Southern Pacific System
March--Arizona Eastern
-July 1 to Mch• 31-1911. 1911-12. 1910-11.1912.
135,298 103,130 1,108,867 853,408-36,918 34,479 300,912 297,977180,885 145,729 1,494,000 1,231,99921,508 61,009 214,316 284,98013,114 12.004 113.347 110,735.2,451 1,851 20,695 17,291
47,343 37,079 396,769 342,32792,246 114,873 803,308 789,836-88,638 30,856 690,691 442,162-
189 25 1,621 -5488,828 30,881 692,313 442,10712,000 6,943 90.508 55,819'76,828 23,938 601,805 386,288.
366 354Staten Island R 1-See Balto & Ohio
Digitized for FRASER http://fraser.stlouisfed.org/ Federal Reserve Bank of St. Louis
Page 26
26 RAILWAY EARNINGS [VoL. Lxxxxiv.
EARNINGS
Freight revenue Passenger revenue__
Tot.. Incl. other rev.Expenses-Maint. wayMaint. of equipmentTraffic expenses...Transportation exp.
Tot.. Incl. generalNet from railroad_ _ _ _Outside operations,netTotal net revenue...
Taxes Final net
Mlles of road operated
EARNINGS
Freight revenue Passenger revenue
Tot.. Incl. other rev.Expenses-Maint. wayMaint. of equipmentTraffic expenses__ _Transportation exp.
Tot., incl. generalNet from railroad......Outside operations,netTotal net revenue...
Taxes Final net
Miles of road operated
EARNINGS
Freight revenue Passenger revenue_ - -
Tot., Incl. other rev.Expenses-Maint. way.
*taint. of equipmentTraffic expenses...Transportation exp.
Tot.. Incl. general,Net from railroad_ _ _ _Outside operations,netTotal net revenue_ _
Taxes Final net
Miles of road operated
EARNINGS
Freight revenue Passenger revenue__ _
Tot., incl. other rev.Expenses-Maint. way
Maint. of equipmentTraffic expenses__ _Transportation exp.
Tot., incl. generalNet from railroad_ _Outside operations.netTotal net revenue_ _
Taxes Final net
Miles of road operated
EARNINGS
Freight revenue Passenger revenue.._ _
Tot.. Incl. other rev.Expenses-Maint. wayMaint. of equipmentTraffic expenses.._ _Transportation exp.
Tot.. Incl. generalNet from railroad_ _ _ _Outside operations.netTotal net revenue...
Taxes Final net
Miles of road operated
ra 'EARNINGS
Freight revenue Passenger revenue....
Tot.. Incl. other rev.Expenses-Maint. wayMaint. of equipmentTraffic expenses_ - -Transportation exp.
Tot., incl. generalNet from railroad__ -.Outside operations,netTotal net revenue
Taxes teinal net
Miles of road:operated
EARNINGS
Freight revenue Passenger revenue
Tot., incl. other rev.Expenses-Maint. way
Maint. of equipmentTraffic expenses......Transportation _exp.
Tot.lincl. generalNet from railroad _ _ _Outside operations,netTotal net revenue_
Taxes
Southern Pacific SystemCoos Bay Roseb & Eastern RR & Nay March- July 1 to Mch. 31-1912. 1911. 1911-12. 1910-11.
3,197 4,397 32.582 47,5012,839 2,733 26.048 25.206
Southern Pacific SystemHearne & Brazos Valley
March- -July I to Mch. 31-1912. 1911. 1911-12. 1910-11.
1,102 570 31,364 23.357575 535 8,452 6,430
Southern Pacific Systemi Houston & Shreveport
March July 1 to Mch. 31-1912. 1911. 1911-12. 1910-11.21,028 22,316 168,613 190,7004,237 5,065 49,955 56,443
6,525 7,629 62,544 78,834 1,742 1,172 40,442 30,391 26,670 29,055 229,097 258,9831,115 1,750 18,089 19,077 302 1,398 2,864 5,377 1,980 2,602 25,945 28.743305 993 4,705 12,492 165 38 2,922 623 279 334 6,112 3,575,9 37 59 391 32 31 271 233 Cr271 263 3,743 3,0771.834 • 2,257 16,683 20.306 1,106 721 8.989 7,023 9,080 8.452 69,711 71,4014.058 5.662 44,846 57,024 1,671 2,278 15,964 14,662 11,559 12,189 110,345 112,2422.467 1,966 17,697 21,809 71 -1,106 24,477 15,728 15,111 16,865 118,752 146,740
2,467 1,966 17.697 210,809 71 -1.106 24,477 15,728 15,111 16,865 118,752 146,740421 807 4,284 7,263 76 75 687 686 839 774 8,474 4,8602,046 1,159 13,413 14,545
27 27
Southern Utah March July 1 to Mch. 31-1912. 1911. 1911-12. 1910-11.I$ I
6,189 *5,541 74,582
394 186 4,4716,991 6,026 81,2472,715 1,037 14,6592,653 1,070 17,423
553.284 1,993 31.8039,328 4.618 69.492
--2,337 1,407 11,755
---2,337 1,407 11,755123 132 1,031
-2,461 1,274 10,72420 20
Spokane Portland & Seattle SystemPacific & Eastern
December July 1 to Dec. 31-1911. 1910. 1910-11. 1909-10.
744 484 13,423 5,5841,317 725 12,449 6.0452,2671.77311739
1,519
1,354 27,509652 14,380
1.2018 188
1,140 12,1403,672 2,075 30,619
--1,405 --721 --3,109
-1,405 --721 --3,109198 72 645
12,7654.439236229
8,404
-5 -1,182 23,789 15,04120 19Spokane International* - . •
March -July 1 to Mch. 31-1912. 1911. 1911-12. ' 1910-11.
$ $ • 417,135 0,002 386.991 559.18319,105 17.769 179,205 173,22768,973 ,70,217 601,431 774,71210,332 9,506 110,031 131,1795,794 6,463 49.604 51,9391,889 2,415 18,713 20,958
22,564 23,525 211.582 235,17544,094 46,434 420.875 471,24424,879 23,782 180,555 303,468
24,879 23,782 180,555 303,4682,525 2,818 21,697 25,082
22,354 20,964 158,857 278.386161 140Standard & Hernando
Marth---• --July 1 to Mch. 31-1912. 1911. 1911-12. 1910-11.$ $ $ $7,472 10,427 73,040 66,145133 208 1.522 • 1,498
8,5113,1302,259
12,5312.0061,460
2,897 2,835
84,09024,55417 .388
3025,059
76,56415,53414,554
5423,579
14,469 8.287 6,303 68,395 55,483
14,271 16,091 110,277 141,88039 39
Spokane Portland & Seattle SystemSpokane Portland & Seattle
March -July 1 to Mch. 31-1912. 1911. 1911-12. 1910-11.232,470 272,594 2,110,171 2,421,013127,640 140,025 1,306.791 808.166381,17048,36536,0746,350
101.487
429,658 3,646,023 3,402,40650,142 376,947 394,15846,735 342,362 249,6956,986 63,350 39,358
107,197 934,830 901,140204,531 223,244 1,819,594 1,673,237176,639 206,413 1,826,429 1,729,168
552 1,314 10,528 -6,294177,191 207,728 1,836,957 1,722,87453,400 42,200 367,204 302,800123,791 165.528 1,469,752 1,420,074
555 550Stanley Merrill & Phillips March-- -July 1 to Mch. 31-1912. 1911. 1911-12. 1910-11.$ $ $ $9,670 12,292 60,984 75,225852 868 6,278 7,209
10,8371,5261,903209
2,931
13.6011,1832,436237
4,002
69.27520,75925,2741,670
23.303
85,96113,38117,9111,577
27,6057.034 8,313 75,429 64,639
--1.701 224 6,228 15,694 21,080
-1,704 224 6,228 15,694 21,080519 426 426 3.482 3.842--1,603 --794 --3,754 --2,224
33 12Sugar Pine
January July 1 to Jan. 31--1912. 1911. 1911-12. 1910-11.
Susquehanna & New York March-- July 1 to Mch. 31-1912. 1911. 1911-12. 1910-11.$ $ 1 $22,026 20,124 223,947 179,6632,369 2,358 23,985 24.724
26,184 24,9434,945 3,2354,808 3,578479 475
11,901 8,98723,018 17,7043,166 7,239
3,166 7,239450 350
2,716 6,889 72,13574 79
Tennessee Central March July 1 to Mch. 31-1912. 1911. 1911-12. 1910-11.3 $ $. $90,024 99,152 772,993 770.74428,074 27.237 293,855 295,756125,20525,69118,0875,312
46,158
132,708 1,134,447 1,130,71319,189 206,252 161,43112,592 160,281 118,6525,405 48,029 43,997
42.623 428.705 351,706102,243 87,976 916,907 748.74822,962 44,731 217,540 381,964
22,962 44,731 217,540 381,9644,211 3,980 37,878 35.82118,750 40,751 179,661 346,143
293 293
Texas & Pacific SystemTexas & Pacific
March July 1 to Mch. 311912. 1911. 1911-12. 1910-11.931,935 818,151 9,371,599 8,580,583314,968 319,557 3,179,494 3,167,787
1,332,785 1,205,475 13,375,040 12,632.679192,725 184,437 1,456,920 1,454,927240,921 262,438 1,828,980 2,369,44835,891 18,614 272,313 191,296
694,839 574,267 5,722,825 5,121,0311,210,428 1.078,004 9,690,386 9,466,930122,357 127,470 3,684,653 3,165,749-5.381 1,384 -33,393 -3,046116,975 128,854 3,651,259 3,162,70348,489 44.763 570,380 465,390
-202 5,801 11,851 17,23733 29
Sumpter Valley ' March- -July 1 to MM. 31-1912. 1911. 1911-12. 1910-11.$ ' $ $ $9,272 12.564 119.957 129.1953,212 4.111 40.123 33.32013,828 18.038 173,015 175.7162,225 3,544 40,184 37,4983.271 2,974 29,128 28,050
3,082 5,387 45.300 45.40812,183 12,460 131.543 133,381 1.645 5.578 41,472 42,334
1.645 5.578 41,472 42.334600 609 5.459 4,369
1.045 4,968 36.013 37,96481 81
Tampa Northern March-- -July Ito Mch. 31-1912. 1911. 1911-12. 1910-11.• $ $ $ $
9,423 8.953 82.957 75.5882.915 2.662 26.271 22.772
264.357 221,761 13,799 13,707 120,314 113,14336,932 34,856 2.922 2.916 25,263 21,46339,913 34,355 2,288 1,408 19,757 14,8134,427 5.459 170 133 1,508 1.67899,429 80,016 3,888 3,553 32,911 28,796188.772 163,929 10,155 8,840 87,514 75,24275,585 57.831 3,644 4,867 32,800 37,900
3,803 5,287 -6,154 21,321
3,803 5,287 -6,154 21,321184 218 1,867 1,782
3,618 5,068 -8,022 19.53955 56
Sunset March July 1 to Mch. 31-
1912. 1911. 1911-12. 1910-11.$ 3 $39,044 75.723 52$,72l 573,3059,989 15,571 138.640 ' 145,570
50,173 94,391 711.368 746.27312,698 7,648 106,729 100,0861,531 475 24,053 11,341
35 30 405 38014,720 22,227 252.540 183.49329.973 30,644 409,479 299,31520,200 63,746 301,888 446,958
20.200 63,746 301,888 446,9582.187 1,774 29,304 6.227
18.01:3 61,972 272,584 440,73058 56
75,585 57,831 3,644 4,867 32,800 37,0003,450 3.450 1,000 1,000 9,000 9,00054,381 2,644 3.867 23,800 28,900
60 60Terminal RR Assn of St Louis System
Terminal RR Assn of St Louis March July 1 to Arch. 31
1912. 1911. 1911-12. 1910-11.
264 306 2,215 2.565264,07933,11024,858
706• 105.932
207,056 2,095,826 2.038,17331,890 309,992 267,88525,252 216,758 178,893
819 6,312 5,98381.107 779,549 757.551
169,503 154,989 1,362,230 1,267,33994,576 52.067 733,596 770,83310,374 11.604 80.258 127.417
104.950 63.671 813,854 898,25026.000 27.000 247.010 253.43078.950 36.671 566,843 644,820
35 34Texas & Pacific SystemDenison & Pacific Suburban
February July 1 to Feb. 29-1912. 1911. 1911-12. 1910-11.14,390 2.370 64,218 53,940
164 164 2,034 1.87015.641
388248
3,324454218
71,8694,3052.049
19,2793,2391,225
3,330 1,475 16,907 12,4893.967 2.148 23,303 16.976
Tennessee Alabama & Georgia- Starch
1912.I
1911.$
July 1 to Mch. 31-1911-12. 1910-11.
$ *6,074 7,601 53,0:34 49,3061.547 1.744 18.371 • 16,3908.451 10,124 79,423 72,5772,207 6,229 31,296 50,6632.164 2.866 18,453 20,681785 883 7,888 6,320
3,911 4,158 40,346 34.2809005 15,230 104.962 125.369
-1,353 -5.105 -25,539 -52,792
-1,353 -5,105 -25,539 -52,792814 768 7,056 6,931
--2,168 -5.874 -32,596 -59,72494 94
Terminal RR Assn of St Louis SystemSt Louis Merchants Bridge & Terminal
March--- -July 1 to Mch. 31-1912. 1911. 1911-12. 1910-11.
297 345 2,828 22,552183.663 128,562 1 1 ,299 ,17519,102 12,098
,351 ,369212,814 192.504
1.971 8,110 82,115 57,402457 476 3,973 3,699
103.861 75,463 737.594 650,676130,917 101,025 1,082,650 948,88352,745 27,537 268,718 350,292
52.745 27,5:37 268.718 350,2925.600 5.700 52,132 56.016
47,145 21,837 216.586 294,2769 9Texas & Pacific System .,Opelousas Gulf & NortheasternMarch July 1 to Mch. 31-
1912. 1911. 1911-12. 1910-11.3,339 3,405 43,691 38,2441.305 1,038 12,411 12,8485,082 4,825 60,590 55,0114,879 2,833 29,941 23,3352,934 1,832 23,924 24,064372 421 3,879 3,251
2,788 2,497 27.231 24,27111,797 8,430 92,945 83,145
11.673 1,176 48,565 2,302 --6,715 --3,605 --32,354 --28,131
11.673 1.17680 80!nal net 68,485 84,091 3,080,879 2,697,313 11,593Miles of road operated 1,884 1,884(See this road on page 32) 7
Stephen N & S Tex-See St L Southw Susq Bloomsb & Ber-See Penn RRL. Stony Creek-See Reading Sussex-See Delaware Lack & WestL. Sullivan County-See Bost & Maine Syrac Bing & N if-See D L & W
48,565 2,302640 040
-6,715305
--3,605 -32.354303 2,734
1.096 47,925 1,662 --7,020 --3.908 --35,0897 57 57
Tacoma Eastern-See Chic Milw & St P Texas & (lull-See AtchisonTallulah Fails-See Southern Texas & New On-See Sou PaoTam Hai & Nor-Sec Reading Texas Central-See Mo Kan & Texas
-28,1312,763
-30,895
Digitized for FRASER http://fraser.stlouisfed.org/ Federal Reserve Bank of St. Louis
Page 27
MAY, 1912.1 RAILWAY EARNINGS
EARNINGS
Freight revenue Passenger revenue..._
Tot., incl. other rev.Expenses-Maint. wayMaint. of equipmentTraffic expenses__ _Transportation exp _
Tot.. Incl. general
Net from railroad_ _ _ _Outside operations.net' • Total net revenue_ _Taxes ' Final net Miles of road operated
EARNINGS
Freight revenue Passenger revenue__ _
Tot., incl. other rev.Expenses-Maint. way
Maint. of equipmentTraffic expenses.._ -Transportation exp.
Tot., Incl. general
Net from railroad__ - -Outside operations,net
Total net revenue_ _Taxes
Final net Miles of road operated
EARNINGS
Freight revenue Passenger revenue_ - -
Tot.. incl. other rev.Expenses-Maint. wayMaint. of equipmentTraffic expenses__ _Transportation exp.
Tot.. Incl. general
Net from railroad_ _ _Outside operations,net
Total net revenue Taxes
Final net Mlles of road operated
EARNINGS
Freight revenue Passenger revenue.._
Tot., incl. other rev.Expenses-Maint. way
Maint. of equipmentTraffic expenses__ _Transportation exp.
Tot., incl. general
Net from railroad_ Outside operations,net
Total net revenue_ _Taxes
Final net Miles of road operated
EARNINGS
Freight revenue Passenger revenue
Tot., Incl. other rev.Expenses-Maint. way
Maint. of equipmentTraffic expenses__ _Transportation exp.
Tot., Incl. general
Net from railroad_ _ _ _Outside operations,net
Total net revenue_ _Taxes
Final net Miles of road operated
EARNINGS
Freight revenue Passenger revenue.._ _
Tot., incl. other rev.Expenses-Maint. way
Maint. of equipmentTraffic expenses_ _ _Transportation exp.
Tot., Incl. general
Net from railroad_ _ _ _Outside operations,net
Total net revenue Taxes
Final net Miles of road operated
EARNINGS
Freight revenue Passenger revenue...
Tot., Incl. other rev.Expenses-Maint. way
Maint. of equipmentTraffic expenses_ - _Transportation exp.
Texas & Pacific SystemWeatherford Mineral Wells & N W March -July 1 to Mch. 31-1912. 1911. 1911-12. 1910-11.
5,890 5,683 55,562 54,0042,949 4,020 36,704 40,425
9,582 10,591 100,976 102,5962,498 1,830 16,614 14,876584 644 5,870 10,055148 168 1,762 1,293
2,969 3,489 26,703 27,053
6,852 6,690 56,337
Texas City Terminal March July 1 to Mch. 31-1912. 1911. 1911-12. 1910-11.$ $ $ $13,906 9.775 152,986 137,716
255 220 1.606 1,95216,978 11,491 200,221 150,450
856 1,577 11,447 8,770Cr574 712 4,399 7,189469 226 5,991 2,016
7,928 5,231 91,912 54,73358,875 10,404 9,892 132.098 88,584
2,730 3,901 44,639 43,720 6.574 1,599 68,123 61,866
2,730 3,901 44,639423 331 3,730
2,307 3,570 40,90941 41
Texas midland March -July 1 to Mch. 31
1912. 1911. 1911-12. 1910-11.$ $ I $33.620 30,536 414,074 349,3359,256 10,274 110,876 106,776
45,731 44,093 559,194 485,57312,308 11,107 101,975 107,0098,713 8,720 104,804 82,2661,426 1,937 14,428 14,65518,964 19,639 184.252 183,228
43,844 43,857 429,079 412,088
1,886 235 130,115 73,485
1,886 235 130,115 73,4851,700 1,500 14.100 11,700186 -1,204 116,015 61,785125 125
Toledo St Louis & Western SystemToledo St Louis & Western
March July 1 to Mch. 31-1912. 1911. 1911-12. 1910-11.274,685 253,325 2,446,520 2,317,32323,759 34,270 328,747 356,015
318,19724,39748,1708,600
120,504
311,089 2,961,793 2,850,38334,514 332,547 367,60948,614 543,803 416,47810,692 74.460 79,488
116,739 1,094,767 1,010,388209,467 219,481 2,122,523 1,958,131
108,729 91,607 839,270 892,251
108,729 91,60715,750 14,55092,979 77,057
450 450
Tonopah & Goldfield February July 1 to Feb. 29-1912. 1911. 1911-12. 1910-11.$ $ $ $52,310 42,853 429,074 432,6107.071 8,377 65,256 77,874
839,270 892,251132,750 127,700706,520 764,551
43,720 6,574 1,599 68,123 61,8663,307 149 71 1,224 64040,413 6,424 1,528 66.899 61,225
6 6
Texas Oklahoma & Eastern February -July 1 to Feb. 29-
1912. 1911. 1911-12. 1910-11.$ $ $ $16,320 79,8271.160 9.807
17,6784,4531,940140
2,896
91,47636,81614,835
89622.994
10,587 84.621
7,091 6,854
7,091 6.854112 896
6,979 5,95824
Toledo St Louis & Western SystemChicago & Alton
March July 1 to Mch. 31-1912. 1911. 1911-12. 1910-11.896,237 691,429 7,420,209 6,987,253293,348 318,760 3,129,380 3,282,576
1,281,365 1,098,931 11,390,669 11,075,741105,560 96,204 1,481,153 1,430,740262,146 109,178 2,237,804 1,816,29039,401 48,254 360,338 353.677508,880 413,163 4,202,615 4.168,110
949,949 699,947 8,578,688 8.080.178
331,415 398,984 2,811,981 2,995.563---28.817 --16,696
327,559 397,068 2,783,163 2,978,86643,500 37,000 334,500 325.600284,059 360,068 2,448,663 2.653.266
1,025 1,025
Tonopah & Tidewater SystemTonopah & Tidewater
March July 1 to Mch. 31-1912. 1911. 1911-12. 1910-11.22,597 22.914 174.821 182,9753,612 4,256 32,152 41,413
63,397 56,291 522,462 543,165 27,891 29,1735,486 5,459 63,626 49,765 3,747 4,9637,592 12,241 84,340 100,666 2,312 2,1351.852 3,131 14,323 24,948 2,483 1,746
16.843 20.561 135,335 193,029 6,642 8,415
34.457 44,925 320,101 401,254 16,010 18,328
28,939 11,365 202.361 141,911 11,881 .10,844
28,939 11,365 202,361 141,911 11,881 10,8442,474 2,447 20,084 19,494 1,548 1,75926,465 8,918 182,276 122,417
110 109
Traverse City Leelanau & Manistique March -July 1 to Mch. 31-1912. 1911. 1911-12. 1910-11.$ $ 3 $760 781 4,725 6,262
1,009 884 12,756 11,401
2,337 2,239 23,302 23.505248 319 3,200 4,250314 938 3,374 3.396
61,403 1,331 12,217 12,422
1.977 2,643 18.900 20,712
360 -404 4,402 2,792
360 -404 4,402
360 -404 ' 4,40229 29
Ulster & Delaware March July I to Mch. 31-1912. 1911. 1911-12. 1910-11.
54,368 44,079 477.895 514,95014,664 12,961 286,412 275.61672,844 60,802 803,372 831,2218,612 8,772 109,495 109,44913,547 14,137 103,204 111,0311,460 930 12,582 11,739
32,269 31,527 333,172 354,17358,413 57.789 581,034 608,771
221.84136,08017,23618,96060,061
241.03540,13332,55917,78581,390
141.215 182,230
80,626 58.805
80.626 58,80513,980 16.559
10,333 9,084 66,645 42,246180 180
Tremont & Gulf March July 1 to Mch. 311912. 1911. 1911-12. 1910-11.$ $ $ 314,781 14,403 132,066 135,9671,252 1,307 10,401 11,423
17,0166,8571,045445
4,622
17,238 149,0406,196 57.2681,050 • 15,633438 3,927
4,954 40,308
154,73656,51615.2874,28944,492
14,015 13,736 125.765 131.081
3,000 3,502 23,275 23,655
2,792 3,000 3,502 23,275 23,6551 50 200 1,200 1.800
2,791 2,950 3,302 22,075 21,855102 102
Union Ry (of Memphis) February July 1 to Feb. 29-1912. 1911. 1911-12. 1910-11.$ $ $ $
17,656 19,949 158,194 179,819972 2,531 18,620 24,352995 3,675 6,011 26,164
63 5815,287 16,419 113,089 129,16318,035 23,208 147,035 188.012
14,430 3,013 222,338 222,449 -378 -3,258 11,159 -8.1935 -48 739 626
14,435 2,964 223,077 223,0763,300 3,300 29,700 29,70011.135 -335 193,377 193,376
128 128
Union Pacific SystemOregon Short Line
March- July 1 to Mch. 31-1912. 1911. 1911-12. 1910-11.
1,129,511 1,020,219 11,165,699 10,766,245294,744 325,168 3,452,733 3,668,131
1,527,687 1,449,709 15,577,541 15,407,144169,147 175,617 1,705,875 1.959,934167,253 181,452 1,537,610 1,670,43626,878 24.781 254,145 254,028
422.984 398,593 3.870,680 3,791.659Tot., incl. general 820,858 821.395 7,688.603 8.064,697
Net from railroad__ _ _ 706,829Outside operations.net -2,407
Total net revenue__ 704,421Taxes• Final net 647.421Miles of road operated 1,761
Tol & Ohio Cent-See N Y CentralTol Peer & West-See Penn RR
628,314 7,888.937 7,342,446-3,515 -5.620 -15,482624,798 7.883-,31-7 7.326.964
57,000 58,665 1,005,690 626,761
--378 --3,258 11,159 --8,193799 805 6,397 6,447
--1,178 --4,06420 20
Union Pacific SystemOregon-Washington Ry & Nay March-- -July 110 Mch. 311912. 1911. 1911-12. 1910-11.800,557 808.179 7,701,008338,201 347,241 3.725.892
4.761 -14.640
1,233,838 1,231,171 12,296,705184,037 157,538 1,595,314154,152 136,906 1,301,87742,575 45,581 396.918493,487 491,440 4,386.006925.957 871,309 8.078.636
307,881 -3-59,861 4.218,068--6,817 --14,521 10,885
27
Texas MexicanJuly 1 to Mch. 31-1911-12. 1910-11.
March1912. 1911.
14,694 17,788 132,390 167,2004,872 4,987 52,609 49,457
20,585 24,462 202,106 232,8335,591 8,698 55,682 76,409260 389 2,139 2,027441 692 5,023 4,672
10,111 11.153 92.706 100,634
17,617 22,196 ' 166,411 194.537
2,968 2,266 35,695 38,296
2,968 2,266 35,695 38,2961,395 1,400 12.207 11.532
1,573 866 23,488 26,764161 161
Tionesta Valley March -July 1 to Mch. 31-
1912. 1911. 1911-12. 1910-11.$ I $ $15,262 18,215 170,681 170,751
853 941 9.018 9,324
16,608 19.580 183,226 183,7172,365 2,517 25,687 30,8761,410 1,400 22,087 19,608232 251 1,892 1,871
6.873 7,106 58,022 57.285
11.655 11.912 113,911 115.636
4,952 7,668 69,315 68,080
4,952 7,668 69,315 68.080350 350 3.885 3,750
4,602 7,318 65,430 64.33085 85
Toledo Terminal March
1912.$
1911.$
-July 1 to Mch. 31-1911-12. 1910-11.
I $
27,994 29,118 235,796 246,8171,923 4.683 24.700 49,2423,603 5,568 32,604 42,460169 207 1.986 1,813
15,320 18.849 122.919 168,016
21,982 30,235 190.867 270.890
6,011 -1,117 44,928 -24,073
6,011 -1,117 44.928 -24.0732,452 1,576 19,745 13,104
3.558 -2,693 25.183 -37,17831 31
Tonopah & Tidewater SystemBullfrog-Goldfield
March July 1 to Mch. 31-1912. 1911. 1911-12. 1910-11.
5,983 4,562 57.616 51,4121,548 1,840 13,913 18,5458,171 7,121 77,710 76,3961,985 1,797 17.408 18,0004,238 4,498 18,072 19,226904 874 8,068 8,978
3,027 3.897 28,658 40,691
10,556 11,575 76.620 92,255
-2,385 -4,453 1,090 -15,859
-2,385 -4,453 1,090 -15.859658 831 5.983 8,467
-3.044 -5,285 -4.893 -24,32683 83
Uintah March
1912.I
1911.i
-July 1 to Mch. 31-1911-12. 1910-11.
s $15,235 30.280 237,271 265,2351,132 1.343 12.442 11,860
17,057 32,314 256.254 283,4294,709 3,640 46,041 35.0947.063 5.413 38.228 41,147123 58 774 769
4,638 5.972 53,800 52,193
17,958 17.478 166,519 154.415
-900 14,836 89,734 129,014-3,563 -2,337 -23,453 -23,673
-4,463 12,498 66,281 105,3412,255 702 13,715 12.641
-6,718 11,796 52,566 92.69969 54
Union Pacific SystemUnion Pacific
March- -July 1 to Mch. 31-1912. 1911. 1911-12. 1910-11.
2,226,435 2,505,489 24.768.853 27.825,237627.695 761,241 7,731,758 8,405,737
3.220,068 3,641,199 35,870,367 39,557.506341,368 462.656 3,226,247 3.884,778558,719 474,191 4.539,642 4,604,02894,787 96,499 942.139 909,857
1.171,443 1.043.953 10.514.545 10,277,682
2.271.465 2,178.496 20,180.785 20.639,755
948.603 1,462,702 15.689,582 18.917.750,-5.517 -6,393 -22.949 -46,544943.086 1,456,309 15,666,632 18.871.205159,950 152,686 1,515,866 1.396.381783,136 1,303,622 14,150.766 17.474,8243,537 3,478
Union Pacific SystemTotal Company
March- -July 1 to Mch. 31-1912. 1911. 1911-12. 1910-11.
4,156.503 4,333,887 43,635,5601.260,640 1.433,750 14,910,3835,981.593 6,322.079 63,744,613694,552 795,811 6,527,436880,124 792,549 7,379,129164.240 166,861 1.593.202
2,087.914 1,933,986 18.771,2314.018,280 3,871.200 35.948.024
1.963.313 2,450,877 27.796,587-14,741 -24.429 -17,684
301,064 345,340 4,228,954 1.948.571 2,426,447 27.778,903 70,580 74.168 928,319 287.530 285,519 3,449.875
566,133 6.877,626 6,700,203 230,484 271.171 3,300.634 1.661,041 2,140,926 24,329,0261,646 1,919 1,737 7.217 6.855(5ee this road on page 32)
Tol Sag & Musk-see Grand Trunk Union RR (of Penn)-See U S Steel Un Pt & White Plains-See Atl Coast
Trinity & Brazos Val-See Colo & Sou Union Freight-See N Y N If & H Union RR of Bait-See Penn RR
Digitized for FRASER http://fraser.stlouisfed.org/ Federal Reserve Bank of St. Louis
Page 28
28 RAILWAY EARNINGS [VOL. Lxxxxrv.
EARNINGS
Freight revenue Passenger revenue.._ _ _
Tot., incl. other rev.Expenses-Maint. wayMaint. of equipmenTraffic expenses_ _ _Transportation exp_
Tot., incl. genefalNet from rallroad.._ _ _Outside operations,net
Total net revenue.._Taxes
Final net Mlles of road operated
EARNINGS
Freight revenue Passenger revenue.._ _ _
Tot., incl. other rev.Expenses-Maint. wayMaint. of equipmentTraffic expenses_ _ _Transportation exp.
Tot., incl. generalNet from rallroad.._ _ _Outside operations,netTotal net revenue
Taxes Final net
Miles of road operated
EARNINGS
Freight revenue Passenger revenue..- _ _Tot., incl. other rev.
Expenses-Maint. wayMaint. of equipmentTraffic expenses_ _ _Transportation exp_
Tot.. incl. generalNet from railroad_ _ _ _Outside operations,netTotal net revenue.._
Taxes Final net
Miles of road operated
EARNINGS
Freight revenue Passenger revenue. - _ _
Tot., incl. other rev.Expenses-Maint. wayMaint. of equipmentTraffic expenses _Transportation exp_
Tot., incl. generalNet from railroad_ _ _ _Outside operations,netTotal net revenue_ _
Taxes Final net
Miles of road operated
EARNINGS
Freight revenue Passenger revenue.._ _ _
Tot., inel. other rev.Expenses-Maint. way
Maint. of equipmentTraffic expenses Transportation exp_
Tot.. incl. generalNet from railroad........Outside operations,net
Total net revenue_ _Taxes
Final net Miles of road operated
EARNINGS
Freight revenue Passenger revenue......_Tot, .incl. other rev.
Expenses-Maint. wayMaint. of equipmentTraffic expenses_Transportation exp.
Tot., incl. generalNet from railroadOutside operations,net
Total net revenue Taxes
Final net Miles of road operated
EARNINGS
Freight revenue Passenger revenue.._- -
Tot., incl. other rev.Expenses-Maint. way
Maint. of equipmentTraffic expenses Transportation exp_
Tot.. Incl. general
Union Pacific SystemNorth Yakima & Valley
February July 1 to Feb. 29-1912. 1911. 1911-12. 1910-11.
2,653 3,814 25,535 25,8011,697 1.946 17.119 15,4384,651 5,950 44,591 42,450380 648 4,913 5,589280 260 3,223 1,30825 26 398 109
2,282 2,717 21,973 15,041
Union Pacific SystemSt Joseph ec Grand Island
March July 1 to Mch. 31-1912. 1911. 1911-12. 1910-11.71,904 92;156 765,528 848,12724,251 34,018 312,113 348,107109,56817,02323,9535,022
60,0363,567 3.962 35,740 24.427
137,575 1,185,564 1,302,06821,012 193,898 269,50321,951 195,421 184,0966,392 44,936 58,414
60,195 534,172 563,709111,912 116,287 1,018,771 1,132,384
1,083 1,988 8,850 18,023
1,083 1,988 8,850 18,023575 400 5,950 1.625508 1,588 2,900 16,39837 32
United States SteelBessemer Cc Lake Erie
March July 1 to Mch. 31-1912. 1911. 1911-12. 1910-11.382,281 424,380 5,460,536 5,104,07521,225 20,943 262,165 276,033
413,08244,937117,8638,102
171,232
453,204 5,810,472 5,463,65838,888 584,396 648,769158,209 1,171,912 1,223,6817,549 74,611 69,642
146,062 1,555,380 1,572,483352.032 359,049 3,478,731 3,619,13961,049 94,154 2,331,740 1,844,519
61,049 94,154 2,331,740 1,844,5199,000 6,000 94,473 80,20852,049 88,154 2,237,267 1,764,310
203 204
United States SteelDuluth Missabe & Northern
March July 1 to Mch. 31-1912. 1911. 1911-12. 1910-11.169,681 91,994 4,673,742 7,454,96034,279 37,775 330,594 358.309209,259 134,489 5,076,485 7,870,35643,223 72,807 784,428 883,62158,749 83,054 556,098 841,1791,666 1,983 16,593 15,381
80,778 85,847 983,167 1,281,956195,537 255,510 2,460,594 3,152,35313,722 -121,021 2,615.890 4,718,003
-2,383 -1,769 33,580 45,74411,338 -122,790 2,649,470 4,763,7488,401 5.477 244,218 394,7472,936 -128,268 2,405,251 4,369,000341 316
United States SteelMcKeesport Connecting
March July 110 Mch. 31-1912. 1911. 1911-12. 1910-11.
18,665 20,883 127,242.2,261 7,155 25,2783,954 3,981 29,551
150,21032,11532,151
11,936 11,489 87,998 105,72018,195 22,654 143,330 171,871
470 -1,770 -16,087 -21,661
470 -1,770 -16,087 -21,661547 546 5,659 3,723-76 -2,316 -21,747 -25,384
5 5United States Steel
St Clair Terminal March July 1 to Mch. 31-1912. 1911. 1911-12. 1910-11,
11,680548
3,412
11,891601
2,040
165,63412,41426,375
5,445 5,500 48,7199,494 9,151 88,1632,186 2,739 77,471
2,186 2,739 77,471300 225 2,365
1,886 2,514 75,1057 7Valley Connecting
January July 1 to Jan. 31-1912. 1911. 1911-12. 1910-11.3 $ $ a
Virginia-Carolina March July 1 to Mch. 31-1912. 1911. 1911-12. 1910-11.$ $ $ $7,578 11,793 77,972 78,690993 1,113 11,950 12.737
8,740981678
1,727
13,0661,338447Cr12
2,238
91,85313,5884,002
Cr716,297
4.372 4.924 42,920
92,93311,9763,569Cr12
20,258
130,12216,99130,428
1047,650
-2,344 21,288 166,792 169,68477 60 238 349
-2,267 21,349 167,031 170,0336,395 5,711 61,670 53,324
-8,663 15,638 105,360319 319
United States SteelDonora Southern
March- July 1 to Mch. 31-1912. 1911. 1911-12. 1910-11.
20,345 16,290 168,395507 1,126 42,401
2,582 4,203 26,460
116,708
119,45224,34838,761
7,940 7,180 61,734 63,45811,621 11,984 133,765 129.8378,724 4,306 34,629 -10,384
8,724 4,306 34,629 -10,384264 157 2,229 1,270
8,460 4,148 32,400 -11,6554 4
United States SteelElgin Joliet & Eastern
March July 1 to Mch. 311912. 1911. 1911-12. 1910-11.931,312 627,462 7,143,234 5,671,404
• 4 10 35 68986,21471,916
141,11494,161
(310,312
669,039 7,543,883 6,010,23552,004 681,680 753,80692,049 1,353,045 1,209,2634,197 37,703 36,554
230,877 2,268,806 1,954,908542,654 392,369 4,484,661 4,106,183443,559 276,669 3,059,221 1,904,052
443,559 276.669 3,059,221 1,904,05223,554 19,600 183,943 156,311
420,005 257,069 2,875,278 1,747,740841 831
United States SteelMercer Valley
March July 1 to Mch. 31-1912. 1911. 1911-12. 1910-11.
11,985 8,8121,500 2,3461,062 1,210
310,139 6,124
76,65012,8498,857
62,981
114,84030,10712,072
2670.894
12,818 9,799 85,693 114,076-832 -986 -9,043 764
-832 -986 -9,043 76475 85 735 1,025
-907 -1,071 -9,778 -2603 :3
United States SteelUnion RR (of Penn)
March- July 1 to Mch. 31-1912. 1911. 1911-12. 1910-11.
282,64538,17080,073
100132,129
255,941 3,067,969 2,646,48531,427 278,108 355,19082,102 724,379 577,642
102 913 973118,546 1,156,508 1,106,576
95,997 254.928 236.274 2,192,978 2,077.28234,124 27,717 19,667 874,990 569,202
2,584 1.463 31,846 20.23834,124 30,302 21,130 906,836 589,4411,835 4.750 3,250 58,072 49,750
32,289 25,552 17.880 848,764 539,69131 31
Victoria Fisher & Western March July 1 to Mch. 311912. 1911. 1911-12. 1910-11.
7,848 8,397 50,513 73.685
7,848 8,397 50,513 73,6851,988 4,191 20,774 25,6671,660 2,620 16,860 13,472205 41 2,022 1,597
2,470 2,292 14,936 20,7256,342 9.218 57.121 63.187
Union Terminal February- July 1 to Feb. 29-1912. 1911. 1911-12. 1910-11.
320 169 5,818220 500 2,78783 427 894
17 34 1,919832 1,227 8,287
--512 --1,058 --2,469290 244 2,309
--221 --813 --159785 680 6,280
-1,006 -1,493 -6,4396 4
3,2102,4031,224
1,8118,426
--5,2161,892
-3,3234.906
-8,229
United States SteelDuluth & Iron Range
March July 1 to Mch. 31-1912. 1911. 1911-12. 1910-11.83,185 131,675 4,480,625 5,212,01423,173 29,116 194,561 237,541114,400 170,370 4,759,101 5,536,17028,968 45,951 651,094 579,55945,009 43,943 464,316 502,880
785 556 7,655 4,38364,696 80,036 966,027 1,249,864148,176 181,419 2,196,815 2.452,206
-33,775 -11,049 2,568,286 3,083.964-3,374 -4,348 4,922 3,132
---37,150 -15,397 2,573,208 3,087,0964,558 ' 6,717 228,656 270,069
--41,708 --22,114 2,344,552 2.817.026200 190
United States SteelLake Terminal
March July 1 to Mch. 31-1912. 1911. 1011-12. 1910-11.
44,860 40,585 378,090 367,1346,131 7,390 74,809 81,1167,436 8,862 79,387 77,135
18,824 13,524 150,893 132,68432,518 29,879 306,362 291,97612,342 10,705 71,727 75.158
12,342 10,705 71.727 75,1582,858 1.557 29,669 15,5019,484 9,148 42,058 59,856
10 10
United States SteelNewburg & South Shore
March.July 1 to Mch. 31-1912. 1911. 1911-12. 1910-11.
630 567 5,270 5.38757,692 48,400 401,278 377,4302,339 3,532 34,808 38,11813.316 12,457 109,277 107,235
20,220 17,625 148,237 144,22837,535 35,479 307,479 305,99720,156 12,920 93,799 71,433
20,156 12,920 93,799 71,4333,515 1,234 36,617 9,69116,640 11,686 57,181 61,741
13 13United Verde & Pacific
March July 1 to Mch. 31-1912. 1911. 1011-12. 1910-11.a a $ $15,574 24,289 137,086 218,6721,566 1,523 12,917 11,973
17,9897,8424,078
26,5237,4845,012
157,58073,91341,834
237,22671,77246,222
5,809 8,355 50,618 70,22018,473 21,604 173,388 195.063-484 4,919 -15,807 42,162
--484 4,919 --15,807 42,162343 279 3,447 2,860-827 4,639 -19,255 39,301
26 26Virginia & Truckee
March-- -July 1 to Mch. 31-1912. 1011. 1911-12. 1910-11.$ $ $ $14,841 13,622 162,209 144,4025,976 7,164 64.730 68,245
22,075 21,971 240,294 225,0263,475 3,142 42,819 40,2202,862 2,712 27,027 25,117850 501 6,333 3,645
7,531 7,843 75,918 75,46815,706 15,077 160,732 153,394
1,506 -821 -6,608 10.497 6,369 6,894 79,561 71,632
1,506 -821 -6.608 10,497200 200 1,800 1,650
1,306 -1,021 -8,408 8,84756 56
Virginian March July 1 to Mch. 31-1912. 1911. 1911-12. 1910-11.$ $ $ $
382,591 272,697 3,274,911 2,372,20316,944 17,981 196,603 193,824
409,91059,35677.7784,954
118.972
299,110 3,570,086 2,640,61432,592 433,636 298,86664,945 644,518 449,4675,308 45,397 46,432
80,352 991,717 724.07044,773 269.044 191.260 2.186,384 1.587,679
Net from railroad__ _ 4,368 8,142 48,933Outside operations,netTotal net revenue._ 4,368 8,142 48,933Taxes 380 377 3,420Final net 3,988
Miles of road operated 29U S & Canada-9ee Grand TrunkVan dalia-See Penn RR
48,150 140,866 107,849 1,383,701 1.052,9345.287 5.561 46.886 43,323
48,159 146,154 113,411 1,430,588 1,096,2573.395 17,600 17.600 141,400 131,756
7,764 45,513 44,764 128,554 95,811 1,289,188 964.50129 474 473Vermont Valley-See Boston & Me Virginia & Southw--See SouthernVicks Pac-See AlaNO &TP
6,369 6,894 79,561 71,6322,030 1,685 18,273 15,1734,338 5,208 61,288 56,458
67 67
Wabash SystemWabash
March July 1 to Mch. 31-1911-12. 1910-11.
14,558.949 15,417,5405,300,892 5,635,215
1912. 1911.1,589,369 1,700,960• 439,667 499,5692,201,081211,838474,57164,879
1,070,400
2,372,442262,054413,65670,920
1,049,397
21,574,9802,457,1853,827,968698,416
9,032,126
22,702,2852,502,0473,623,002691,072
0,044.7761,882,594 1,898,755 16,671,800 16,548,243318,486-6,600
473,686-2,667
4,003,180-18,881
6.154,041-10,0706,137,970681,197
5,456,772
311,87971,655
471,01876,947
4,884,209636.663
240,2242,514
394,0702,514
4,247,636
Wabash-Pltts Term-See Wabash .
Digitized for FRASER http://fraser.stlouisfed.org/ Federal Reserve Bank of St. Louis
Page 29
MAY, 1912.) RAILWAY EARNINGS 29
EARNINGS
Freight revenue Passenger revenue_ _ _
Tot., Incl. other rev.Expenses-Maint. way
Maint. of equipmentTraffic expenses .. - _Transportation exp.
Tot., Incl. generalNet from railroad_ _ _ _Outside operations,netTotal net revenue_ _
Taxes Final net
Miles of road operated
EARNINGS
Freight revenue.._..Passenger revenue___
Tot.. inel. other rev.Expenses-Maint. way
Maint. of equipmentTraffic expenses...Transportation exp.
Tot., incl. general
Net from railroad...Outside operations,netTotal net revenue..
Taxes Final net
Miles of road operated
EARNINGS
Freight revenue Passenger revenue__ _
Tot., Incl. other rev.Expenses-Maint. wayMaint. of equipmentTraffic expenses__ -Transportation exp.
Tot., incl. general
Net from railroad_ _ _ _Outside operations,netTotal net revenue_axes Final net Iles of road operated
EARNINGS
Freight revenue Passenger revenue_ _ _
Tot., incl other rev.Expenses-Maint. wayMaint. of equipmentTraffic expenses...Transportation exp.
Tot., incl. general
et from railroad__• utside operations,net
Total net revenue_ _axes Final net lies of road operated
EARNINGS
reight revenue I•assenger revenue__
Tot., Incl. other rev.xPenses-Maint. wayMaint. of equipmentTraffic expenses...Transportation exp.
Tot., incl. general
Wabash SystemPittsburgh Lisbon & WesternMarch -July 1 to Mch. 31-
1912. 1911. 1911-12.4,945 4,080 39,011938 1,058 9,102
6,119 5,439 50,660937 858 10,053751 771 4,650105 181 1,561
1,984 1,830 16,403
4,091 3,958 35,651
2,028 1,480 15,008
2,028212
1,480178
15,0081.962
1,815 1,302 13,04627 27
Wabash SystemWheeling & Lake Erie
March-- --July 1 to Afar. 31--1912. 1911. 1911-12. 1910-11.606,829 430,396 5,003,846 4,293,32342,033 40,350 462,935 466,924
680,543. 80,807
136,5377,268
226,430
501,483 5,816,441 5,097,26758,314 667,579 563,730109,105 1,047,634 1,019,9167,538 66,538 74,201
200,630 1,902,651 1,844,948465,524 389,056 3,810,723 3,626,027
1910-11.38,8859,580
Wabash SystemWabash Pittsburgh Terminal
March -July 1 to Mch. 31-1912. 1911. 1911-12. 1910-11.54,156 36,846 405,838 424,8905,876 6,029 61,318 67,690
51,4409,9203,1231,892
16,44634,262
17,178
17,1781,567
63,1966,23310,4311,429
22,350
47,8636,8426,2761,834
21,174
494,53767,67399,87013,522
195,065
517.61959,59573,68817,090
209,92645,411 40,977 420,653 407,306
17,784 4,885 73,884 110,312-304 -753 17,480 4,885 73,130 110,3126,000 6,000 54,000 54,000
15,611 11,480 -1,114 19,130 56,31263 63
Wabash Chester & Western March-- -July 1 to Mch. 31-1912. 1911. 1911-12. 1910-11.
7,547 6,736 64,364 78,3881,582 1,910 17,948 19,117
215,018 112,426 2,005,718 1,471,2401,447 2,125 20,549 27,560
216,466 114,552 2,026,268 1,498,80133,615 20,014 271,177 185,972182,850 94,537 1,755,090 1,312,828
457 457
Western Allegheny March July 1 to Mch. 31-1912. 1911, 1911-12, 1910-11.4 $ 4 a13,236 8,922 104,850 97,6761,760 2,004 20,457 22,371
15,639 11,6662,498 1,9072,006 1,283157 125
6,272 4,57211,456 8,901
130,42325,34919,7571,103
48,649
126,66119,95515,270
91742,354
Wabash SystemWest Side Belt
March -July 1 to Mch. 31-1912. 1911. 1911-12. 1910-11.43,806 19,565 361,680 291,603
601 470 5.510 5,086
44,5733,9924,471670
7,899
20,1636,3044,159896
5,200
369,98547,84953,2676,29473,573
298,05052.27752,2866,48357.382
20,102 19,525 208,262 194,407
24,470 638 161,722 103,643-150 -2,068 -1,350
24,470 488 159,654 102.293100 400 900 3.600
24,370 88 158,754 98,69322 22
Washington Idaho & Montana March July 1 to Mch. 31-1912. 1911. 1911-12. 1910-11.$ $ $ $30,904 33,934 217,736 245,7033,867 4.932 32,666 42,974
9,998 9,644 91,978 106,610 35,900 39,909 262,607 300,5913,219 3,252 23,768 29,423 2,090 2,619 37,419 41,7211,299 1,007 18,957 16,419 3,631 10,058 43,521 45,743243 192 1,729 1,842 179 221 1,979 1,292
4,178 3,646 38,288 34,843 8,247 12,376 78,105 81,8009,304 8,486 87,621 86,482 15,169 26,915 171,944 180,493
694 1,158 4,356 20,128 20,731 12,993 90,663 120,098
694 1,158 4,356 20,128 20,731 12,993 90,663 120,098563 492 5,170 5,188 887 650 7,204 6,015131 666 -813 14,93964 64
Western Maryland SystemWestern Maryland
March -July 1 to Mch. 31-1912. 1911. 1911-12. 1910-11.571,720 493,451 4,469,932 4,424,34759,446 58,329 701,150 745,075
655,53864,30391,2129,703
248,558
575,701 5,395,725 5,396.84755,694 614.962 605,83269,023 675,853 644,5347,337 91,296 81,822
189,527 1,974,892 1,874.390
103,875 88,251 428,930 334,667 3.480,999 3.326.519
4,182 2,764 26,548
4,182 2.764 26,548250 362 1,750
38,409 226,607 241,034 1,914,725 2,070.32738 -393 -2,812
38,409 226,607 241,073 1,914,332 2,067,5143,262 21,000 21,000 189,000 177,000
3,932 2,402 24,798 35,14653 53
Western Ry of Alabama March July 1 to Mch. 311912. 1911. 1911-12. 1910-11.$ $ $ $80,674 73,735 623,818 568,64439,839 36,849 375,107 349,799
130,03322,51022,8655,214
42,17798,34631,686-6
120,55330,19218,1875,239
34,231
1,084,024173,226199,20748,319304,870
1,000,274191,099168,63546,317268,221
95,696 780,003 727,111
24,856 304,020 273,162-117 126 --1,783
31,679 24,739 304,146 271,3794,612 4,339 41,510 39,052
27,067 20,399 262,635 232,327133 133
Wisconsin & Michigan March July 1 to Melt. 311912. 1911. 1911-12. 1910-11.$ $ $ a18,292 22,948 95,952 118,6841,107 3,063 17,934 28,055
19,8291,5311,544244
6,24810,564
26,4963,1524,208441
8,886
117,53422,99720,1613,30550,560
152,17322,51830,2544,129
62,68218,319 106,925 132,819
et from railroad_ __ _ 9,265• utside operations,net
Total net revenue__ 9,265axes 1,079 Final net 8,185Iles of road operated 135Wadley Southern-See Central of GaWash & Vandemere-See Atl CoastWash Southern-See Richm-WashWaynesh & Wash-See Penn RRW Min Wells & N NV-See Tex & PaoWest Jer & Seashore-See Penn RR
EARNINGS
reight revenue assenger revenue_ -Tot., incl. other rev.xpenses-Maint. wayMaint. of equipmentTraffic expenses_ _ _Transportation exp.
Tot., incl. generalet from railroad.. _ _ _
I utside operations,netTotal net revenue..
I axes Final net lies of road operated
8,177 10,609 19,354
8,177 10,609 19,3541,175 10,443 11,557
205,607 220,073 1;725,332 1,890,514543 543 (See this road on page 32)
Williamsport & North Branch March July 1 to Mch. 31-1912. 1911. 1911-12. 1910-11.$ $ a a7,135 7,836 54,028 57,8922,819 2.691 42,366 38,42110,412
8841,068
743,779
10,9271,024983349
3,810
102,11415,55810,3382,08135,123
102,34714,6379,7071,712
37,1796,891 7,028 70,759 71,183
3,520 3,899 31,355 31,163
3,520 3,899 31,355 31,163246 153 2,214 1,381
3,274 3,745 29,14084 84
Yosemite Valley March July 1 to Mch. 311912, 1911. 1911-12. 1910-11.$ $ $ $6,222 • 3,316 79,798 46,3784,649 2,785 107,783 85,50511,7632,4592,173919
3,84710,445
6,8275,9091,9081,0402,532
197,40025,21214,3288,45235,852
141,55626,88813,0259,554
31,55511,842 89,649 85.420
1,318 -5,014 107,751 56,136
1,318 -5,014 107,751 56,136323 609 5,689 6,640
7,002 165 7,796 995135 79West Side Belt-See WabashWestern Pacific-See Den & Rio GWheel Et Lake Erie-See WabashWheeling Term-See Penn RRWh Sul Sp & Yel Pk-See C M & St PWich Falls & N W -See Mo K & Tex
19,843 12,343 83,459 114,08349 49
Western Maryland SystemGeorges Creek & Cumberland
March -July 1 to Mch. 31-1912. 1911. 1911-12. 1910-11.10,120 4,727 70,832 42,316
53 61 542 69810,817 5,236 76,164 48,8361,665 Cr61 12,386 1,6837,316 2,131 58,900 44,052166 167 1,759 1,534
4,402 2,443 30,450 21.13213,870 5,179 106,521 72.678
-3,053 57 -30,360 -23,841
-1,053 57 -30,360 -23,841900 900 8,100 8.100
-3,953 -842 -38,460 -31,94131 32
Winston-Salem Southbound March -July 1 to Mch. 31-1912. 1911. 1911-12. 1910-11.$ $ $ a24,848 11,385 224,840 17,7302,370 1,307 28,669 4,23627,6776,3161,3441,774
10,070
12,7722,113314907
2,088
257,17842,08712,03212,83281,552
22,1692,506775
2,5614,965
20,861 5,905 161,255 11,980
6,816 6,866 95,922 10,188
6,816 6,866 95,922 10,1882,000 18,000
29,782 4,816 6,866 77,922 10,18889 87
Youngstown & Ohio River March July 1 to Mch. 31-1912. 1911. 1911-12. 1910-11.$ 4 • $ $4,576 4,349 37,922 36,92211,861 11,849 119,198 114,34218,875
9411,189231
5,925
18,0121,2591,195303
5,407
178,51513,50610,6842,411
50,558
166,04813,5279,3602,993
46,1319,353 9,401 87,008 81,922
9,522 8,610 91,507 84,125
9,522 8,610 91,507 84,125920 590 8,872 5,275
-5,624 102,061 49,49579
Wich Falls sou-See Mo Kan & TexWichita Valley-See Colo & SouthernWilkes-Barre & East-See ErieWilliams Valley-See ReadingWood Riv Branch-See N Y N 11 & H
HAWAIIAN RAILROADS.Hilo
March July 1 to Mch. 31-1912. 1911. 1911-12, 1910-11.
23,573 15,783 164,023 139,2886,501 3,707 42,641 32,00932,5482,8012,438228
9,65716,764
22,1801,65594034
5,494
229,94720,49716,6171,018
71,958
192,08520,49313,372
63554,370
9.427 124,299 103,813
15,784 12,752 105,647 88,271926 666 3,111 5,974
16,710 13,419 108,759 94,246486 409 4,029 3,436
Kahului February- July 1 to Feb. 29-1912. 1911. 1911-12. 1910-11.$ $ $ a19,319 14,972 129,813 112,7661,006 953 9,976 10.205
25,7443,2521,238
1015,16421,540
20,916 176,365 151,1973,092 24,234 11,6651,944 16,401 28,858
17 84 9910,684 97,101 87,01117.046 150,925 136.316
4,203 3,8-7-6 25,439 14,880613 922 57,688 40.892
4,817 4,792550 550
16,224 13,009 104,729 90,81069 61
83,128 55.7732,939 4,417
4,267 4,242 80,189 51,35528 25
8,602 8,019 82,635 78,84935 35Wrightsv & Tennille-See Cent of GaW yo & North w-See Chic & N WYazoo & Miss Val-See Ill CentralYork liar & Beach-See Boston & MeZanesville 5c Western-See N Y Cent
Chaim Ity & Land Co March July 1 to Mch. 31-1912. 1911. 1911-12. 1910-11.$ $ $ $54,422 54,335 529,004 416,46718,140 15,505 163,144 151,88679,540 76,936 749,247 621,4357,213 8,736 68,485 71,4227,406 5,907 62,536 51,264583 554 4,901 5,332
17,898 18,117 158,573 144,93036,942 36.054 325.335 302,70242,597 40,881 423,912 318,732-4,481 -6,248 19,136 -5.16238,116 34,633 443,049 313,5705,000 4,600 45.000 41,388
33,116 30,033 398,049 272,18298 96
Digitized for FRASER http://fraser.stlouisfed.org/ Federal Reserve Bank of St. Louis
Page 30
30 RAILWAY EARNINGS [VoL. Lxxxxiv.
Revenue from operation Operating expenses Net revenue from operation_ _ _ _ 145,805 129,339 951,393
Additional income (hire of equip) _ 3,992 8.480 123,331 Total net income 149.798
Fixed charges and other deductions 114,307Surplus over charges 35,490 35,341
COMPANY RETURNS• All the figures in the foregoing pages are transcripts of the monthly returns as filed with the Inter-State Commerce
Commission at Washington. Many railroad companies also issue monthly statements of their own, and the form of thereturns in such cases is often different from that prescribed by the Commerce Commission. In some instances thefigures in the two returns correspond, but the company statements go beyond the requirements of the Commission andgive fixed charges and income from investments in addition to earnings and expenses.
It is our purpose that each issue of the "Railway Earnings Section" shall furnish an absolutely complete record ofall monthly returns, in whatever form issued, that may be put out by any steam railroad in the United States. Ac-cordingly, we bring together on this and the following two pages all the company statements where they differ in anyway from the returns to the Commission, or where they embrace more facts than are contained in such returns. Inthese instances, of course, uniformity is lacking. Each company makes up its statement according to its own con-ception of what will serve best to convey a correct idea of the course of its income in the distinctive circumstances thatmay attend its operations or the character of its business. We in turn give the statements in the precise form fur-nished by the companies. Obviously, we cannot undertake to reconcile differences or discrepancies that may appearbetween the company figures and the Inter-State Commerce returns.
It should be distinctly understood that where the company statements are identical with those rendered to the CommerceCommission, we do not undertake to repeat them here. In such cases the reader must look for the figures among the detailedstatements on preceding pages, which include every steam road that is obliged to make monthly returns to the Commission.
There is just one exception to the rule excluding statements that agree with those made to the Commerce Com-mission. Where the fiscal year of a company differs from that in the Commerce returns-that is, from July 1-weintroduce the road here in order to present the figures for its own fiscal year.
Atchison Topeka & Santa Fe March July 1 to Mch. 31-
1912. 1911. 1911-12. 1910-11.$ $ $ $
Gross operating revenues 8,821,567 9,267,520 80,683,663 81,532,910Operating expenses 5,982,418 6,173,196 54,276,066 53,356,491 Net operating revenue 2,839,148 3,094,324 26,407,597 28,176,419
Taxes 367,322 306,437 3,182,891 2,594,542Operating income 2,471,826 2,787,886 23,224,705 25,581,876
Average operated mileage 10,704 10,381 10,599 10,333
Bangor & Aroostook March- July 1 to Mch. 31-
1912. 1911. 1911-12. 1910-11.a a a $336,499 316,461 2,591,978 2,374,723190,693 187,121 1,640,584 1.543,124
831,59$144,117
137,820 1.074,725 975,715102,478 959.044 871,354
115.680 104,360
Bellefonte Central March July 1 to Mch. 31-
1912. 1911. 1911-12. 1910-11.
Gross receipts 6,4905,128 17,266 15,503Operating expenses 6,107 4,189 15,219 15,844Net
Interest and taxes 244382 939 2,046 -340
250 732 750Surplus over charges 138 689 1,314 -1,090
Gross earnings Expenses Net earnings
Charges Surplus over charges 463 347
Buffalo Rochester & Pittsburgh March- July 1 to Mch. 31-
1912. 1911. 1911-12. 1910-11.3 $ $ $
Operating revenue 819,541 691,343 7,193,082 6,980,585Operating expenses 561,762 475,490 4,871,436 4,439,040
Bridgeton & Saco River March
1912. July 110 Mch. 31-1911. 1911-12. 1910-11.5
4,123 4,053 43,377 40,0353,023 3,070 29,542 28,2151,100 983 13,825 11,820637 636 5,843 5,627
Net operating revenue 257,778Outside operations Dr.510Net revenue 257,267
Taxes 17,000Operating income 240,267
Other incomeGross corporate income 313,148 . 263,458 2,727,503 3,043,811
Fixed charges and other deductions 158,439 158,692 1,406,517 1,429,565
7,982 6,193
215,852 2,321,646 2,541,549223 947 412
215,629 2,322,593 2,541,96136,000 153,000 164,000179,629 2,169,593 2,377,961
72,880 83,829 557,910 664,850
Surplus over charges 154,708 104,766 1,320,986 1.613,246Central of New Jersey March- July 1 to Mch. 31-
1912. 1911. 1911-12. 1910-11.$ $ $ $
Receipts 2,745,293 2,390,912 23,073,360 21,739,968Operating expenses 1,459,797 1,368,123 12,682.263 12,463,227Net income
Fixed charges and taxes 1,285,495 1,022,788 10,391,096 9,276,740524,206 526.024 4,975.761 4.727.580
Surplus over charges 761,289 496.763 5,415,334 4,549.160Chicago & North Western March July 1 to Mch. 31-
1912. 1911. 1911-12. 1910-11.Average miles of road operated..___ 7,950 7,743 7,827 7,710
I $ $ $Operating revenues 5,845,116 5,884,169 55,356,170 57,042,005All other receipts 27.638 175,545 2,137,324 1,984.277
Total receipts 5,872,755 6,059,715 57,493,494 59,026,282Operating expenses and taxes 4.533,027 4.245,879 42,575.689 42,518.508Net earnings 1,339,728 1,813.836 14,917,805 16.507.774
Fixed charges 821.451 786,616 6.906,715 6.968,881 Surplus 518,276 1.027,219 8,011,090 9,538,893
Chicago Great Western March
1912. 1911.Mileage operated 1,496 1,496
$ $Total operating revenue 1,051,712 1,070.865Total operating expenses 891.721 783.079• Net operating income 159,991 287,786 2.219,085 2,480,215Other income 8.309 6.180 97.591 75.422
July 1 to Mch. 31 -1911-12. 1910-11.
$9,676.372 9,572,1767.457,287 7,091.961
Total income 168,300 293,966 2,316.676 2.555.637Taxes and other charges 229.829 223,466 2,062,553 1.908,902
Surplus over charges -(11,529 70,500 254,123 646,735
Net operating revenue 260,352 223.630Taxes 64,000 66,382
Miles operated
Gross revenue Operating expenses Net earnings
Proportion fixed charges and taxes_Surplus over charges
Chicago Memphis & GulfFebruary- -July 1 to Feb. 29-
1912. 1911. 1911-12. 1910-11.52 31 52 31$ $ $ $
Chicago St. Paul Minneapolis & Omaha March July 1 to Mch. 31-
1912. 1911. 1911-12. 1910-11.Average miles of road operated..___ 1.743 1,743 1,743 1.742
a a aOperating revenues 1,226,497 1,259,559 11,517,393 12,517,625All other receipts 13,987 3,674 119,980 84.722Total receipts 1,240,484 1,263,234 11,637,373 12,642,347
Operating expenses and taxes 969,442 835,027 8,669,703 8,564.595Net earnings 271,042 428,207 2,967,670 4.077,752
Fixed charges 192,254 163,744 1,610,685 1.508,552Surplus over charges 78,787 264,462 1,356,984 2,569.191i
Colorado & Southern March- July 1 to Mch. 31-
1912. 1911. 1911-12. 1910-11.$ $ $ $
Operating revenue 1,035,317 1,115,313 10,978,849 12,576,767Operating expenses 826,456 790,093 7,365.435 8,214,568Net operating revenue
Taxes Operating income
Misc, charges and credits to incomeBalance available for interest_ _ _
Interest 239,631 235,658 2,142,490 2.089,191Surplus -32,883 -78,557 1,453,315 1,949.359
Colorado Midland February -July 1 to Feb. 29-.
1912. 1911. 1911-12. 1910-11.Miles of road 337 337
$ $ $ • $Operating revenues 118,665 117,971 1,315,999 1,374,534Operating expenses 104.635 115,233 1.055.646 1,150.904
208,860 325,220 3.613,413 4.362.19842,841 39,999 382,640 360.061166,019 285,221 3,230,773 4,00233740,728 28,995 365.033 36.413206,747 314,216 3,595,806 4,038,550
14,030 2,7388,000 8,500
Operating income 157,248Net miscellaneous debit to income_ 35.429
Balance available for interest_ _ _ 37,543 24,789 150,285 121.818Interest • 29,820 29.820 238,560 238.560
Deficit or surplus +7,723 -5,030 -88,274 -116.741
Delaware & Hudson March -July 1 to Mch. 31-1912. 1911. 1911-12. 1910-11.3 $ $ $
1,772,363 1,812,489 5,273,920 4,867.3951,200,564 1,130,016 3,512,864 3,232,114
Gross earnings Operating expenses Net earnings
Outside operations-net Total net revenue
Taxes Final net
6,030 ---5,761 196,35231.513 30,550 46,067
571.799 682,473 1,761,056 1,635.28120,807 --1,185 11,594 -3,504
592.606 681,288 1,772,650 1.631.77748.739 44,067 144,809 126.825543,867 637,221 1,627,841 1,504.952
Denver & Rio Grande March -July 1 to Mch. 31-.1912. 1911. 1911-12. 1910-11.$ $ $ I
Total operating revenue 1.717,730 1.687,224 17,629.097 17,797,063Operating expenses and taxes 1,443,918 1,328.649 13,476.895 12,821.548
273,812 358,575 4.152.201 4,975.51677,096 80.731 1,118,160 1,154.492
Operating income Other Income . ......Total income_ --------- _
Propor'n of fixed charges & rentalsSurplus above charges
From which deduct: renewal fundBalance
350,908 439,306 5,270,362 6.130,007484,798 477.607 4,547.285 4,469.192
723,076 1,660.81190,000 90.000
-133,889 -38,300 10.000 10.000
-143,889 -48,300 633,076 1,570,814
Duluth South Shore & Atlantic March--- -July 1 to Mch. 31--
19412. 1911. 1911-12. 1910-11$ $ $ ':053225 21;370626:831092 21:637531:473064Operating revenue
Operating expenses 214823:083921
21827760,140 40.512 619,277 682,362Net operating revenue
2.569 33,598 4'7,800Other income 3,768Total net 63.910 43,082 652,876 730,163
Interest, taxes, &i, 96,268 96,379 863.840 863.745Net loss 32,357 53,296 210,963 133,581
Digitized for FRASER http://fraser.stlouisfed.org/ Federal Reserve Bank of St. Louis
Page 31
MAY, 1912.] RAILWAY EARNINGS
659,795 575,544 Total net revenue 734,218 588,869 1.405,882 1,274,40676,817 73,205 One-twelfth annual taxes 95,000 80.000 285,000 240.000736,612 648,749 Operating income 639,218 508.869 1,120,882 1.034,406524,336 535,31743,082 68,014 Lake Erie & Western
567,418 603.331 Operating revenues 490,905 452,270 1.355,471 1,289,373Operating expenses 376.621 375,270 1,110,416 1,097,869Net from railroad 114,284 77,000 245,054 191,504
Net-outside operations Total net revenue 114,284 77,000 245,054 191,504
July 1 to Mch. 31- One-twelfth annual taxes 19.000 18,000 57,000 54.0001911-12.
55 1910-11. Operating income 95,284 59,000 188.054 137.504
1' 14,755
44,677,787 47,742,89438,973,370 35.996,4035,704,416 11,746.491
Kansas City Southern March- July 1 to Mch. 31-1912. 1911. 1911-12. 1910-11.$ $ $ 1
746,467 849,608 7,141,692 7,820,045Operating expenses 567,998 • 543,085 4,840,133 4,981.480Net revenues 178,469 306,523 2,301,559 2,838,565
Taxes 31,311 28,209 313,896 267,604Operating income 147715-8 27STä 1,987,663 2,570,961
Mineral Range March -July 1 to Mch. 31-
1912. 1911. 1911-12. • 1910-11.$ $ $ I
Operating revenue 69,983 68,652 573,997 569,039Operating expenses 52,579 55,719 471,538 547,485Net operating revenue 17,404 12,933
154 1,251 Total net 17,558 14,184
12,745 12,740Net Income sur.4.813 sur.1,443
Minneapolis & St. LouisIncluding Iowa Central March July 1 to Mch. 31-1912. 1911. 1911-12. 1910-11.1 I $ $
Gross earnings 651,804 746,503 5,959,808 6,686,157Operating expenses and taxes 525,946 488,578 4,917,774 5,019.725
125,857 257,924 1,042,033 1,666,431Additional income 2,175 -8,907 -4,745 46,067
Other income
Interest, taxes, &c
102,458 21,5546,129 12,455
108,588 34,009112,296 114,910
Net
GeorgiaFebruary July 1 to Feb. 29-
1912. 1911. 1911-12. 1910-11.$ $ $ $
Total revenue from transportation_ 290.214 269.968 2,326,744 2,208,912Revenue other than transportation 2,492 1,716 15,170 8,890
Total operating revenue 292 706Total operating expenses 237,348Net earnings 55,358 58,137
Other income_Total net income 64,852 66,883
Fixed charges 77,504 64,105Additions and betterments 1.787 5,309
Total deductions from income_ _ _ 79,291 69.414
Surplus -14,438 -2,531
Illinois Central
271,684 2,341,915 2,217,802213,547 1,682,120 1,642,258
9,494 8,746
Miles operated
Total revenueTotal expenses and taxes Net revenue
March-1912. 1911.
4,755 4,755
5,189,259 5.194,0374,309.612 4,053,636879,646 1,140,400
Gross revenues
New York Central System-Concluded March July 1 to Mch. 31-
1912. 1911. 1911-12. 1910-11Cleveland Cin Chic & St Louis $ $ $ $
Operating revenues 2,720,369 2,555,219 7,389,061 7,132,557Operating expenses 1,982.459 1,958,831 5,967,287 5,837.545Net from railroad 737,910 596,388 1,421.774 1,295,011
Net-outside operations -3,691 -7,519 -15,892 -20.606
169,194 45,418
Total net 128,033 249,016
-2,707 -80,901
1,037,287 1,712,498
Minneapolis St Paul & Sault Ste. Marie March -July 1 to Mch. 31-
1912. 1911. 1911-12. 1910-11.$ $ $ I
Railroad and outside revenue 1.513,137 1,015,732 12,819,929 9,971,976Railroad and outside expenses.. _ _ 819,409 716,664 6,975,987 6,226,649Net revenues 693,728 299,067 5,843,942 3,745,326
Taxes 98,354 60.943 872,432 604,371 Operating income 595.374 238,124 4,971,510 3,140,955Chicago Division
Railroad and outside revenue 801,776 728,031 7,000,708 6,780,123Railroad and outside expenses_ _ _ _ 585,741 566,687 4.893,026 4,979,494Net revenue 216,035 161,344 2,107,682 1,800,628
Taxes 36,239 35.429 310,916 299,793Operating Income 179,796 125,914 1,796,765 1,500,835
Missouri Kansas & Texas March July 1 to Mch. 31-
1912. 1911. 1911-12. 1910-11.Miles operated 3,398 3,303 3,398 3,393
$ s s aOperating revenue 2,016.273 2,241,098 22,011,678 22,746.696Operating expenses 1,733,532 1.771.541 16.454.760 15,819,843Net operating revenue 282,740 469,557 5,556,918 6,926,853
Outside operations, debit 5,047 374 27,152 2,725Total net revenue 277,692 469,182 5,529,766 0,924,127
Taxes 77,042 83,908 783.003 753,597Operating Income 200,649 385,274 4,746.763 6.170.529
Mississippi Central March -July 1 to
1912. 1911. 1911-12.S $ $
Gross earnings 73,830 76,238 665,084Expenses 47.494 45,378 403,128Net earnings 26,335 30,860
Taxes
Mch. 311910-11.
695,233402,841
261,956 292,3922,200 2,500 23,600 19,500
Net income 24,135 28,360 238,356 272,892
New York Central System March-- July 1 to Mch. 31-
1912. 1911. 1911-12. 1910-12.
• New York Central & Hudson RiverOperating revenues 8,945.281 8,247.123 24,632,009 23,147,987Operating expenses 6.813,294 6,364,511 19,817,725 19,160,562Net from railroad
Net-outside operations Total net revenue
One-twelfth annual taxes Operating income
2,131.987 1,882,612 4,814,283 3,987,4257,146 15,100 63,437 43,208
Chicago Indiana & SouthernOperating revenues Operating expenses Net from railroad
Net-outside operations Total net revenue
One-twelfth annual taxes Operating income
Cincinnati NorthernOperating revenues Operating expenses Net from railroad
Net-outside operations Total net
One-twelfth annual taxes Operating income
2,139.133 1.897,712 4.877.720 4,030,633462,60 377,295 1,489,201 1,155.628
1,676,526 1,520,417 3,388,519 2.875,005
424,989 333,605 1,125,278 944,080317,067 283.164 923,972 825.730107.921 50,441 201,306 118,350
106 --824 -99 --3,483108.027 49,617 201,207 114,86713.000 13,900 39.000 41,70095,027 35,717 162,207 73,167
116,035 88,613 308,791 270,017118,786 75.737 318.569 244.358
2,751 12.876 9,778 25,659
2,751 12.876 9,778 25.6595,300 4,700 15,900 14,100
Lake Shore & Michigan SouthernOperating revenues 4.609.512 3.985,898 12,422,947 11.117,178Operating expenses 2.901,580 2,899.715 8.470.217 8.502,866 Net from railroad 1,707,931 1,086,183 3,952,729 2,614,262
Net-outside operations -5,864 6,477 -19,003 -19.161Total net revenue 1,702,067 1.079,706 3,933.726 2.595,101
One-twelfth annual taxes 140.000 135,000 420,000 405.000Operating income 1,562,067 944,706 3,513.726 2,190,101
Michigan CentralOperating revenues 2,719,337 2,410,086 7,419,669 6.960.325Operating expenses 1,872,628 1,933,399 5.461.654 5.765,332Net from railroad 846,709 • 476,687 1,958,015 1,194.993
Net-outside operations -434 -3,617 376 -11,435Total net revenue 846,274 473,070 1,958,392 1.183,558
One-twelfth annual taxes_ __ 116,000 106,450 348,000 320.900Operating income 730,274 366,620 1,610,392 862,658
.New York Chicago & St LouisOperating revenues 1,026.986 933,820 2,824,515 2,652,093Operating expenses 731,678 703,694 2,188,654 2,082.706Net from railroad 295.308 230,126 635,861 569.387
Net-outside operations --2.694 --1.993 -7,883 --5,583Total net revenue 292,614 228,133 627,977 563,804
One-twelfth annual taxes 32,000 29,600 96,000 88,800Operating income 260,614 199.533 531,977 475,004
Peoria & EasternOperating revenues 288,121 267,469 781,581 826,146Operating expenses 203.588 222.087 604,532 696,520Net from railroad 84,533 45.382 177,049 129,626
Net-outside operations Total net revenue 84,533 45,382 177,049 129,626
One-twelfth annual taxes 9.800 9,500 29,400 28,500Operating income 74,733 35,882 147.649 101,128
Pittsburgh & Lake ErieOperating revenues 1,410,726 1,216,952 3,901,500 3,248,821Operating expenses 753,158 598,570 2.184,966 1.724.560Net from railroad 657,567 618,382 1.716,533 1,524.261
Net-outside operations -288 -467 -1.012 -1.454Total net revenue 657,279 617,915 1,715,520 1,522.807
One-twelfth annual taxes 31.000 30.000 93,000 90.000Operating income 626,279 587,915 1,622,520 1,432.807
Toledo & Ohio CentralOperating revenues 464,538 351,230 1,242,875 974,248Operating expenses 342,676 285,497 975,036 843.115Net from railroad 121.861 65,733 267,838 131,133
Net-outside operations -485 -53 -1.812 -422Total net revenue 121,376 65,680 266,025 130,711
One-twelfth annual taxes 20.385 20,344 62,349 61.034Operating income 100,991 45,336 203.676 69.677
New York Ontario & Western March -July 1 to Mch. 31-
1912. 1911. 1911-12. 1910-11.$ $ $ $
Gross earnings 755,777 744,783 6.909.362 7,008,578Operating expenses and taxes 603,306 593,119 5,223.285 5.124,963Net eardings 152,471 151,664 1,686.077 1,883,615
Fixed charges, &c_ 107,362 130,224 998,146 1,080.560Surplus 45,109 21,440 687.931 803.055
New York Susquehanna & Western March July 1 to Mch. 31--.
1912. 1911. 1911-12. 1910-11.$ $ $ s
Gross revenue 333,635 352.411 2,950,862 2.868,665Operating expenses and taxes 235,692 210,850 2,034,085 1,919.475
Operating income 97,942 141,561 916,777 949.180
Norfolk & Western March July 1 to Mch. 31-
1912. 1911. 1911-12. 1910-11.Mlles operated 2,014 1,990 2,008 1.964
$$ $Total operating revenues 3.270,707 2,815,340 29,244.104 26,874,080Total operating expenses 2,203.211 1,804,177 18,924.998 17,159,211
Net operating revenuesOther income
1,067,495 1,081,162 10,319,105 9.714,86987.428 80.525 742,640 1.012.439
Gross income 1,154.924 1,161.688 11.061,746 10,727,308Fixed charges and taxes 463.860 497.213 4.250,873 4,617,576Net income 691,064 664,475 6.810.872 6.109,732
Pacific Coast Co. March -July 1 to Mch. 31-
1912. 1911. 1911-12. 1910-11.$
Gross earnings ----------600,543 600,543 539,835 5,668,803 5.896,712Expenses _ ........... .. 539.326 510,871 4,772.069 4.897.234Net earnings_ 61,216 28,963 896.734 999,478
Pennsylvania Railroad SystemMarch- -July 1 to Mch. 31•-•
1912. 1911. 1911-12. 1910-11.Pennsylvania RR. $ $ $ I
Total operating revenues 14,527,248 12.999,491 40,479,376 36.545.765Operating expenses, Incl. taxes_ __ _11.218,148 9,671.100 32,911.739 29.451.731Net operating revenue 3,309.100 3,328,391 7,567,637 7,094,034
Outside operations-net 106,430 120,395 -413,187 -476,673Operating inoome 3.202.670 3,207.996 7.154.450 6,617.36i
Mlles of line operated 4.018 3,977-8,051 8.176 25,678 11.559
Digitized for FRASER http://fraser.stlouisfed.org/ Federal Reserve Bank of St. Louis
Page 32
32 RAILWAY EARNINGS VoL. Lxxxxiv.
Pennsylvania Railroad System-Concluded March
1912. 1011.July 1 to Mch. 31-1911-12. 1910-11.
Baltimore Chesapeake & Atlantic $ 5Total operating revenues 17,511 15,730 39,119 41,710Operating expenses, incl. taxes.. _ 17,474 16,144 48,058 44,819Net operating revenue 37 -414 -8,939 -3,109
Outside operations-net 9,521 7,844 -19.426 24,350Operating income 9,558 7,430 -28,365 21,241
Mlles of line operated 88 88
Cumberland ValleyTotal operating revenues 259,978 228,109 718,076 674,620Operating expenses, Incl. taxes_ _ _ _ 178,188 211,334 539,208 503,718Net operating revenue 81,790 16,775 178,868 170,902
Outside operations-net . 161 354 775 681Operating Income 81.951 16,129 179,643 171,583
Miles of line operated 162 162
Long IslandTotal operating revenues 757,849 699,707 2,069,249 1,898,128Operating expenses, incl. taxes_ _ _ _ 723.843 694,815 2,104.760 2.055,583Net operating revenue 34,006 4,892 --35,511 --157,455
Outside operations-net 24,010 24,814 51,321 62,984Operating income 58,016 29,706 15,810 -94,471
Miles of line operated 399 395
Maryland Delaware & VirginiaTotal operating revenues 8,088 8,002 17,864 20,457Operating expenses, Incl. taxes...._ _ 11,971 10,379 29.232 26,531
Net operating revenue -3,883 -2,377 -11,368 -6,074Outside operations-net 8.755 9,371 -5,858 16,551
Operating income 4,872 6,994 -17,226 10,477Miles of line operated 84 84
New York Philadelphia & NorfolkTotal operating revenues 256,662 265,195 726,068 734,713Operating expenses, Incl. taxes_ _ _ _ 201,632 217,575 597,175 614,128
Net operating revenue 55,030 47,620 128,893 120,585Outside operations-net
Operating income 55,030 47,620 128.893 120,585Mlles of line operated 112 112
Northern CentralTotal operating revenues 1.134,764Operating expenses, Incl. taxes.. 1.010.698
1,081,369948,302
3.093.9983,022,622
2.997.4702,880,741
Net operating revenue 124,066Outside operations-net 236
133,067103
71.376482
116,729827
Operating income 124,302 133,170 71,858 117,556Miles of line operated 473 469
Philadelphia Baltimore & WashingtonTotal operating revenues 1 ,558 ,428Operating expenses, incl. taxes_ 1,318,215
1,506,8871,251,163
4,459,6743,962,094
4,272,7473.725,706
Net operating revenue 240,213 255.724 497,580 547,041Miles of line operated 713 713
West Jersey & SeashoreTotal operating revenues 428,377 400.020 1,096,104 1,034,082Operating expenses, incl. taxes_ __ _ 427,311 372,274 1,256,806 1.098,389Net operating revenue 1,066
Outside operations-net ---5,53227,746
--11,193--160,702--14,362
---64,307--9,928
Operating income -4,466Miles of line operated 356
23,553353
--175,064 --74,235
Pennsylvania CompanyTotal operating revenues 4,627,655Operating expenses, incl. taxes_ _ _ _ 3,753.519
4,034,0333,070,860
12,450,25710,586.446
11,163,8659.315,508
Net operating revenue 874,136Outside operations net -4,358
963,173-8,183
1,863,811-10,666
1,848,357-20,973
Operating income 869,778 954.990 1,853,145 1,827,384Miles of line operated 1,760 1,760
Grand Rapids & IndianaTotal operating revenues 467,544Operating expenses, incl. taxes__ _ 390,351
444,630365,856
1,201,5281,121,594
1,220,4101,097,185
Net operating revenue 77,193 78,774 79,934 123,225Outside operations-net -787 --181 --1,445 -537
Operating income 76,406 78,593 78,489 122,688Miles of line operated 586 587
Pittsburgh Cincinnati Chicago & St. LouisTotal operating revenues 3,656,826 3,061,569 10,049,484 8,920,492Operating expenses, incl. taxes_ 2,705,011 2,331,236 7,862,241 7,214,572
Net operating revenue 951,815 730,333 2,187,243 1,705,920utside operations-net -467 -1.056 -2.583 -3,114Operating income 5
11348
Miles of lin operated , 9,
e 467729, 277
1 ,467842,1.660 1,702,806
VandaliaTotal operating revenues 878,018 847,790 2,564,257 2,423,939Operating expenses, incl. taxes.._.._ 729,532 669,900 2.108,948 2.015,183Net operating revenue 148.486 177.899 455,306 408.756
Miles of line operated 827 827
Pennsylvania System
Lines East-
-East and West of Pittsburgh
July 110 Mch. 31-1911-12. 1910-11.1
March912. 1911.$ 5
Total operating revenue 19.849,973 18.066,48 6 55,127,625 50.633,092Total oper. exp. (Incl. taxes acced)15,981,423 14,243,48 6 47,027,474 42,935,357Net operating revenue 3,868,550 3,823,00 0 8,100,151 7,697,735Lines West-
Total operating revenue 9,735,323 8,480,51 6 26,548,368 23,986,084Total oper. exp. (Incl, taxes acced) 7,653,301 6.499,79 8 21,980.332 19,823,930
Net operating revenue 2,083,022 1,980,71 8 4,658,036 4,162,154Lines East and West-
Total operating revenue 29,586,296 26,547,001 81,675,994 74,619,177Total oper. exp. (incl. taxes acced)23,634,724 20,743,284 68,917,806 62.759,287
Net operating revenue 5,951,572 5,803,718 12,758,187 11,859,889
Pere Marquette
March -July 1 to Mch. 31-1911-12. 1910-11.
$ 31912. 1911.$ $
Operating revenues 1,299,315 1,304,040 12,598,475 12,120,306Operating expenses 1,106,001 1,089,318 10.168,837 9.656,651Net from railroad 103,314 214,722 2,429,638 2,463,654
Outside operations Dr 13,514 Dr.8,608 Dr.52,670 Dr.59,878Net operating revenue '
Other income 89,799
---40.852206,113
---37,8112.376,968 2,403,776-433,093 -417.451
Total net 48,947 168,302 1,943,874 1,986,325Fixed charges and taxes 396.390 403.571 3,531.155 3.303.332
Surplus or deficit -347,442 -235,269--1,587,281-1,317,007
Reading Company Marc
1912.Railway Company
Receipts 4,576,753Expenses, including renewals, doe 2.718.989' Net earnings
Coal and Iron CompanyReceiptsExpenses Net earnings
Reading CompanyNet income
h July 1 to Mch. 31-1911. 1911-12. 1910-11.$ $ 5
3,802.186 35,304,845 33,798.6352,469,450 22,542.133 21,751,243
1,857,763 1,332,736 12,762,711 12,047,391
4,824,180 1,976,528 30,921,836 24,466,1944,277,156 1,948,061 29,360,602 24,150,857547,024 28,467 1,561,234 315,336
163,446 125,620 1,478,760 1,287,932Net earnings of all companies 2,568,235Proportion of annual fixed chargesand taxes of all cos. (estimated) _ 868.250Surplus 1,699,985
Operating revenues Operating expenses Net operating revenue
Net revenue outside operations..Total net revenue
One-twelfth annual taxes Operating income
Operating revenue Operating expenses Net operating revenue
Less taxes
1,486,823 T5,802,706 13,650,666
888,660 7,814,250 7.997,944598,162 7,988,456 5,652,715
Rutland March-- -July 1 to Mch. 31-1912. 1911. 1911-12. 1910-11.$ 5 $. 11
270,070 252,858 733,451 700,599220.738 212.614 627,594 631.73849,332 40,244 105,856 68.861
49,332 40,244 105,856 68,86111.731 9,538 34,521 29.19737,601 30,706 71,335 39,664
Rio Grande Southern March July 1 to Mch. 31-
1912. 1911. 1911-12. 1910-11.$$ $
33,505 17,322 379,466 433,81139.867 31,035 367,837 277.024-6,361 6,286
3,350 3,05011,628 ' 156,78726,850 24,750
Operating income -9,711 3,236 -15,221 132,037Other income 32 35 8,856 8,337Total net income 9,678 3,272 -6,364 140,374
Interest, 6ce 15,095 16,034 145,379 147,538Surplus or deficit --25,674 --12,762 --151,744 --7,164
Rock Island Lines March -July 1 to Mch. 31-
1912. 1911. 1911-12. 1910-11.Average mileage operated 8,040 8,024 8,028 8,024
4 $ $ $Operating revenue 4,989,532 5,427,769 48,862,556 52,137,254Operating expenses 3,921,557 4,013,666 36,211,494 37,253,877Net operating revenue 1,067,974 1,414,103 12,651,061 14,883,377
Outside operations (debit) 17,005 5,616 146.396 92,746Total. net revenue
Taxes 1,050,069 1,408,487 12,504,664 14,790,630
233,694 216,193 2.052.072 2,059.883Operating Income 816,375 1,192,294 10,452,591 12,730,747
St Louis Rocky Mountain & PacificJuly 1 to Mch. 31-
1912. 1911. 1911-12. 1910-11.3 .
Gross earnings - • 199,259 153,732 1,517,744 1,610,843Expenses and taxes 131,563 110,595 1,021,313 1.053.269Net earnings 67,705 43,136 496,431
Interest 32,058 32,773 284,958Surplus above charges 35,647 10,363 211,473
St Louis Southwestern- --March---- -July 1 to
$1912. 1911. 1911-12.
Total operating revenues 972,731 982,494 9,280,040Operating expenies ani taxes.._ _ _ 811,810 787,125 6,583.251
557,574293.576263,998
Mch. 31 -1910-11.
9,431,3537.028,490
Operating income 160,870 195,309 2,696,789 2,402,862Add other Income 92,095 60,402 637,092 342,791Total income 252,966 255,772 3,333,881 2,745,653
Proportion fixed chges., rentals, &o. 199,115 187.885 1,783,051 1,674,862Surplus over charges 53,851 67,886 1,550,829 1,070,790
Southern Pacific March July 1 to Mch. 31--
1912. 1911. 1911-12. 1010-11.Average miles of road operated.... __ 9,961 9,937 9,947 9.881
$ 5 $ $Gross revenue 10,397,063 10,658,024 90,464,336101,399,559Operating expenses 7,188,153 7,334,910 64,938,341 64,783,281Taxes 488,636 388.711 4.029.920 3,372.925
Total expenses and taxes 7,676,790 7,723.621 68,968,261 68,156,206Net over expenses and taxes......_ 2,720,27:1 2,934,402 30,496,075 33,243,353
Texas & Pacific-----Alarch-------1912. 1911.
Gross earnings 1,332,785 1,205,475Operating expenses 1,210.428 1,078,004Net earnings 122,357 127,470
Outside operations-net -5,381 1,384Total net revenue 116,975 128,854
Taxes 48,489 44,763Final net 68,485 84,091
-July 1 to Mch. 31-1911-12. 1910-11.
4,169,365 3,687,5503,585,064 3,182,192584,301-9,988574,313151,479422,834
505,3589,102
514,460122,042392,41
July 1 to Mch. 31--1911. 1911-12. 1910-11.S $ $
Railroad and outside r 97,070 984,846 986,626Operating expenses 87.490 792,549 785.986
Other income_ 6,174 8,159 Ts:(14 92:711Net earnings. .._ __ --- . __ 16,357 10,479
evenuc_
Toledo Peoria & WesternAtarch
1912.
105,27388.915
Total net income_ Fixed charges, &o. Surplus
22,53224,010
18,63823,524
228,321215,33812,983
232,754221,55511,199
July 1. to Mch. 31-1911-12. 1910-11.
7,121 6,786
Gross revenue 65,128.923 69,263,535Operating expenses Taxes
Total expenses and taxes 4.443.478 4,317,072 40,709,895 41,194,518
1,478 -4,885Union Pacific System March
1912. 1911.Average miles of road operated...._ 7,218 6,781
6,104,520 6,457.9994,155,948 4,031,551 37,350.018 38,519.864287,530 285,521 3.449,876 2,674.653
Net over expenses and taxes_ _ __ 1.661,042 2,140,926
Western Maryland February
1912. 1911.
Gross earnings, rallwaysOperating expenses and taxes Net earnings, railways
Miscellaneous receipts (balance).....Net profits, coal 6: other departm'ts • Total net income
24,329,028 28,069,016
-July 1 to Feb. 29-..1911-12. 1910-11,
.................
Digitized for FRASER http://fraser.stlouisfed.org/ Federal Reserve Bank of St. Louis