31
Vance Dippold III Glenn Research Center, Cleveland, Ohio CFD Analyses and Jet-Noise Predictions of Chevron Nozzles With Vortex Stabilization NASA/TM—2008-215150 March 2008 AIAA–2008–0037

Vance Dippold IIIGlenn Research Center, Cleveland, Ohio
CFD Analyses and Jet-Noise Predictions of Chevron Nozzles With Vortex Stabilization
NASA/TM—2008-215150
March 2008
AIAA–2008–0037

NASA STI Program . . . in Profi le
Since its founding, NASA has been dedicated to the advancement of aeronautics and space science. The NASA Scientifi c and Technical Information (STI) program plays a key part in helping NASA maintain this important role.
The NASA STI Program operates under the auspices of the Agency Chief Information Offi cer. It collects, organizes, provides for archiving, and disseminates NASA’s STI. The NASA STI program provides access to the NASA Aeronautics and Space Database and its public interface, the NASA Technical Reports Server, thus providing one of the largest collections of aeronautical and space science STI in the world. Results are published in both non-NASA channels and by NASA in the NASA STI Report Series, which includes the following report types: • TECHNICAL PUBLICATION. Reports of
completed research or a major signifi cant phase of research that present the results of NASA programs and include extensive data or theoretical analysis. Includes compilations of signifi cant scientifi c and technical data and information deemed to be of continuing reference value. NASA counterpart of peer-reviewed formal professional papers but has less stringent limitations on manuscript length and extent of graphic presentations.
• TECHNICAL MEMORANDUM. Scientifi c
and technical fi ndings that are preliminary or of specialized interest, e.g., quick release reports, working papers, and bibliographies that contain minimal annotation. Does not contain extensive analysis.
• CONTRACTOR REPORT. Scientifi c and
technical fi ndings by NASA-sponsored contractors and grantees.
• CONFERENCE PUBLICATION. Collected
papers from scientifi c and technical conferences, symposia, seminars, or other meetings sponsored or cosponsored by NASA.
• SPECIAL PUBLICATION. Scientifi c,
technical, or historical information from NASA programs, projects, and missions, often concerned with subjects having substantial public interest.
• TECHNICAL TRANSLATION. English-
language translations of foreign scientifi c and technical material pertinent to NASA’s mission.
Specialized services also include creating custom thesauri, building customized databases, organizing and publishing research results.
For more information about the NASA STI program, see the following:
• Access the NASA STI program home page at http://www.sti.nasa.gov
• E-mail your question via the Internet to help@
sti.nasa.gov • Fax your question to the NASA STI Help Desk
at 301–621–0134 • Telephone the NASA STI Help Desk at 301–621–0390 • Write to:
NASA Center for AeroSpace Information (CASI) 7115 Standard Drive Hanover, MD 21076–1320

Vance Dippold IIIGlenn Research Center, Cleveland, Ohio
CFD Analyses and Jet-Noise Predictions of Chevron Nozzles With Vortex Stabilization
NASA/TM—2008-215150
March 2008
AIAA–2008–0037
National Aeronautics andSpace Administration
Glenn Research CenterCleveland, Ohio 44135
Prepared for the46th Aerospace Sciences Meeting and Exhibitsponsored by the American Institute of Aeronautics and AstronauticsReno, Nevada, January 7–10, 2008

Acknowledgments
This work was supported by the Propulsion 21 program. The author is grateful for the assistance and instruction ofAbbas Khavaran, who helped the author run the JetNo acoustics code.
Available from
NASA Center for Aerospace Information7115 Standard DriveHanover, MD 21076–1320
National Technical Information Service5285 Port Royal RoadSpringfi eld, VA 22161
Available electronically at http://gltrs.grc.nasa.gov
This work was sponsored by the Fundamental Aeronautics Program at the NASA Glenn Research Center.
Level of Review: This material has been technically reviewed by technical management.

NASA/TM—2008-215150 1
CFD Analyses and Jet-Noise Predictions of Chevron Nozzles With Vortex Stabilization
Vance Dippold III
National Aeronautics and Space Administration Glenn Research Center Cleveland, Ohio 44135
Abstract The wind computational fluid dynamics code was used to perform a series of analyses on a single-flow
plug nozzle with chevrons. Air was injected from tubes tangent to the nozzle outer surface at three different points along the chevron at the nozzle exit: near the chevron notch, at the chevron mid-point, and near the chevron tip. Three injection pressures were used for each injection tube location—10, 30, and 50 psig—giving injection mass flow rates of 0.1, 0.2, and 0.3 percent of the nozzle mass flow. The results showed subtle changes in the jet plume’s turbulence and vorticity structure in the region immediately downstream of the nozzle exit. Distinctive patterns in the plume structure emerged from each injection location, and these became more pronounced as the injection pressure was increased. However, no significant changes in centerline velocity decay or turbulent kinetic energy were observed in the jet plume as a result of flow injection. Furthermore, computational acoustics calculations performed with the JeNo code showed no real reduction in jet noise relative to the baseline chevron nozzle.
Nomenclature D diameter of nozzle exit, taken as the average of the nozzle diameters at the chevron valley and
chevron peak Djet equivalent jet diameter based on flow area as calculated by the JeNo code EPNdB effective perceived noise in dB f frequency of noise in Hz k turbulent kinetic energy NPR nozzle pressure ratio SPL sound pressure level, at a given frequency St Strouhal number u local axial velocity ujet mass-average axial velocity of jet at nozzle exit ujet,JeNo maximum axial velocity at jet exit as calculated by the JeNo code W magnitude of vorticity x, y, z orthogonal coordinate system
Introduction In recent years, nozzles with chevrons have been developed as a method to reduce aircraft jet noise.
Chevrons work by strengthening streamwise vortices that increase mixing within the plume to hasten jet potential core decay. Enhanced mixing usually increases the smaller scales of motion, and thus adds to the high frequency noise. However, the breakdown of the larger scale turbulence into small scale turbulence reduces the low frequency noise at its peak directivity angle near the downstream jet axis and subsequently reduces the overall sound pressure level. Callender, Gutmark, and Martens (refs. 1 to 3) conducted extensive tests to study the near-field and far-field noise reduction benefits of chevrons nozzles in dual-stream jets. They found that the presence of chevrons moved the peak noise directivity angle away from the streamwise

NASA/TM—2008-215150 2
axis and reduced its level. Additionally, increasing chevron penetration tends to further strengthen its role in reshaping the noise spectrum, i.e., increasing the high frequency noise and reducing the low frequency noise. Bridges and Brown (ref. 4), used a single flow nozzle with chevrons to study the impact of the chevron penetration on the noise. They found that chevrons reduce noise equally well in heated and unheated jets. Koch, Khavaran, and Bridges (ref. 5) demonstrated that computational fluid dynamics (CFD) combined with a Reynolds-Averaged Navier Stokes (RANS) based acoustic analogy could predict noise reduction trends for chevron nozzles. Using a similar approach, Engblom, Khavaran, and Bridges (ref. 6) studied the effect of chevron penetration and correctly predicted the noise reduction trends.
Practical applications of chevron nozzles on full-scale engines were investigated by Loheac, Julliard, and Dravet (ref. 7), who applied chevron mixers to the nozzle of the CFM56 turbofan engine. Even though installation related effects significantly reduced the benefits observed earlier during uninstalled testing, the chevrons still managed to reduce noise by 2.5 EPNdB. Researchers at the Boeing Company have demonstrated variable geometry chevrons using memory alloys (ref. 8), which allow the chevrons to retract from the flow path at cruise conditions in order to provide optimal engine performance. They have also performed engine tests using Powered Variable Geometry Chevron nozzles (ref. 9). In addition to chevrons, others have investigated the benefits of injecting a small amount of auxiliary flow, placed strategically around the nozzle exit, to produce an effect similar to that of the chevron mixers (refs. 10 to 12). These fluidic chevrons could be used to reduce jet noise when necessary, yet not reduce thrust at cruise, which is a problem suffered by traditional chevron mixers.
More recently, flow injection along each chevron has been proposed as an addition that could enhance and stabilize the streamwise vortices produced by the chevrons to further improve mixing and reduce noise. The purpose of this study was to investigate the effect of air injection at the edge of a chevron nozzle on the nozzle flowfield. The injection points were selected along the edge of the chevron nozzle and were in a direction tangent to the outer surface of the nozzle. In theory, the momentum added by the injection will strengthen the vortices forming off the chevron, allowing greater mixing further downstream along the jet plume compared to a standard chevron nozzle without injection. Several injection pressures and injection locations along the chevron were studied using a single-flow chevron nozzle.
Analysis Setup Nozzle Configuration
The baseline nozzle used in this study was a convergent, single-flow plug nozzle with eight chevrons equally spaced around the circumference of the nozzle. The nozzle diameter was 3.16 in. at the chevron notch and 2.81 in. at the chevron tip. The chevrons had zero penetration, i.e., they were not turned into the nozzle flow any more than if the nozzle was a simple axisymmetric nozzle. Injection tubes with an inner diameter of 0.0625 in. and outer diameter of 0.125 in. were placed at three locations along each chevron as seen in figure 1: near the chevron tip, “Tip”; near the chevron notch, “Notch”; and at a point midway along the chevron, “Midway.” The injection tubes were placed at the edge of the nozzle, with the flow pointed tangent to the nozzle outer surface. The chevron nozzle with tubes placed midway along the chevron is illustrated in figure 2. The nozzle was run with unheated flow at a nozzle pressure ratio (NPR) of 1.50 into quiescent air. The injection tubes were run with plenum total pressures of 10, 30, and 50 psig, corresponding to mass flow rates of 0.10, 0.21, and 0.31 percent of the nozzle mass flow rate.
Nozzle Grid
Structured, multi-zoned grids were created using the Gridgen (ref. 13) software. Using symmetry of the nozzle as an advantage, only 1/16 of the nozzle—a 22.5° segment, representing one half of one chevron—was modeled for the computational simulations. The injection tubes were simplified: while actual injections tube would most likely have a circular external cross-section, the tubes created for the computational model were square along the bottom where they intersected the nozzle outer surface, as illustrated in figure 3. It was
NASA/TM—2008-215150 3
assumed that, since the flow outside the nozzle is quiescent, modeling the tube this way would have a negligible effect on the rest of the flow and greatly reduce the complexity of the grid in the tube-nozzle outer surface intersection region. Two more simplifications were made to reduce the complexity of the grids: first, only a portion of the outer surface of the tubes were modeled, ranging from 4.5 to 4.9 in.; second, the injection tubes were kept straight to reduce the complexity. The internal surface of the injection tube ranged from 9.2 in. for the Notch injection configuration to 9.6 in. for the Tip injection configuration. The injection tubes were found to experience substantial pressure drops, so it was imperative to model the internal tube to an appropriate length for the boundary layer to develop. Care had to be taken while creating the grids near the injection tube exit, as these areas experienced high levels of grid skewness. Grids were clustered near solid surfaces to ensure sufficient resolution of boundary layers. The grids extended 5.3 nozzle diameters in the radial direction and 53 nozzle diameters in the axial direction and were composed of approximately 8.8 million grid points. Figure 4 shows the grid around the nozzle.
Computational Resources
Computational fluid dynamics simulations were performed using Wind version 5.0 (refs. 14 to 16). Wind is a Reynolds-Averaged Navier-Stokes code, developed and managed by the NPARC Alliance. The NPARC Alliance is a partnership between NASA Glenn Research Center, USAF Arnold Engineering Development Center, and The Boeing Company. The Wind code has matured as a multi-zone, structured grid compressible flow solver, offering a variety of turbulence models. These turbulence models include several zero-equation models, Spalart-Allmaras and other one-equation models, and the Chien k-ε and Menter SST two-equation models. The Menter SST turbulence model (ref. 17) was used for this study, as it has been shown to be one of the better turbulence models for nozzle flows (refs. 18 and 19). Additionally, it was found that it was necessary to use Gauss-Seidel subiterations to achieve solution stability (ref. 6). The CFD simulations were performed on a 30-node Intel-based Linux cluster, typically using 8 to 10 nodes. Still, the simulations took nearly a week of wall-clock time to converge adequately.
Acoustics calculations were performed using the JeNo code (ref. 20). The JeNo code is a statistically-based noise prediction code built around Lilley’s acoustic analogy. Its propagation Green’s function is calculated numerically assuming the mean flow is axisymmetric. Since the chevron nozzles investigated in this study are not axisymmetric, a 2.5-D approximation was used. In this type of approximation, the Green’s function is calculated along a specified azimuthal plane, while the source volume integration is conducted in full three dimensions. The selection of the azimuthal plane for the Green’s function (referred to as the line-of-sight) is determined by the user. In this study, the Green’s function was calculated along two lines-of-sight, one along the chevron tip and one along the chevron notch, as illustrated in figure 5. The resulting noise spectral predictions were then analyzed with and without auxiliary injection. The JeNo code reads in flowfield data from the Wind CFD analyses, specifically the density, momentum components, energy, turbulent kinetic energy, and turbulent dissipation rate. Since JeNo’s grid requirements consider the jet plume as a superposition of slices normal to the streamwise direction, an H-grid was defined, and the Wind CFD solution was post-processed and mapped to this new grid. The interpolation was carried out using the Wind tool fpro (ref. 16). The JeNo acoustic computations were run on a single node of a 220-node AMD-based Linux cluster. Each line-of-sight calculation took 2 to 3 hr to complete.
Results Wind CFD Calculations
Solution convergence was determined by monitoring the mass flow rate at the inflow and exit of the nozzle and injection tube. The solution was considered converged when these values changed less than 0.05 percent over one hundred cycles. Additionally, the centerline velocity and contours of velocity and turbulence in the jet plumes were monitored to ensure convergence.

NASA/TM—2008-215150 4
During the first few analyses, a large pressure drop was noted along the length of the injection tube: 27 percent in the 10 psig inject case, and 36 percent in the 30 and 50 psig injection cases. Whereas the ideal (inviscid) injection tube exit Mach numbers would have been 0.85, 1.31, and 1.56 for the 10, 30, and 50 psig tube total pressures, respectively, the CFD solutions predicted injection tube exit Mach numbers of 0.49, 0.98, and 1.17, respectively.
The nondimensionalized plume centerline velocity, u/ujet, is plotted in figure 6 for each case. In this plot, ujet is defined as the mass-averaged axial velocity at the nozzle exit plane. Because the grids vary between configurations, u is nondimensionalized by the ujet computed for each case. For the NPR = 1.50, ujet ranged from 772 to 786 ft/s. It is also important to note that ujet was computed at the actual nozzle exit—along the chevron—and the axial dimension, x, was not constant. The diameter, D = 3.02 in., is the nozzle diameter at the point midway between the chevron peak and chevron valley. The injection has little effect on the centerline velocity, and no conclusive trend can be observed at this time. Figure 7 shows the maximum turbulent kinetic energy along the nozzle plume for each case. In the plots, the turbulent kinetic energy, k, is nondimensionalized as k/ujet
2. The plume can be divided into four regions: x/D<0.1; 0.1<x/D<3; 3<x/D<8; x/D>8. The maximum turbulence profiles are nearly identical for the four cases in the regions 0.1<x/D<3 and x/D>8. For x/D<0.1 (see inset plot in figure 7), the 50 psig cases show higher levels of turbulence relative to the baseline nozzle case as well as other injection cases. In general, all the injection cases produce more turbulence in the region immediately downstream of the injection tube exit, x/D<0.1, compared to the baseline no injection case. The one exception is the Notch configuration with 10 psig injection, which exhibits lower values of maximum turbulence relative to the baseline, i.e., up to 17 percent less than the baseline at x/D = 0.15. The region 3<x/D<8 is where the main jet flow begins mixing with the surrounding quiescent air. The baseline configuration shows that the maximum value of turbulence in this region oscillates somewhat as one proceeds downstream. Cases with auxiliary injection also show a similar behavior. While the maximum turbulence for all the injection cases follows the same trend, some variance is observed. The Notch 50 psig case exhibits the lowest maximum turbulence through this region, 8 percent lower than the baseline no injection case. However, this same case and two of the 30 psig cases have maximum turbulence values roughly 6 to 7 percent larger than the baseline through this region. The effect of fluidic injection on noise reduction is not easily deduced from the maximum turbulence levels through the plume.
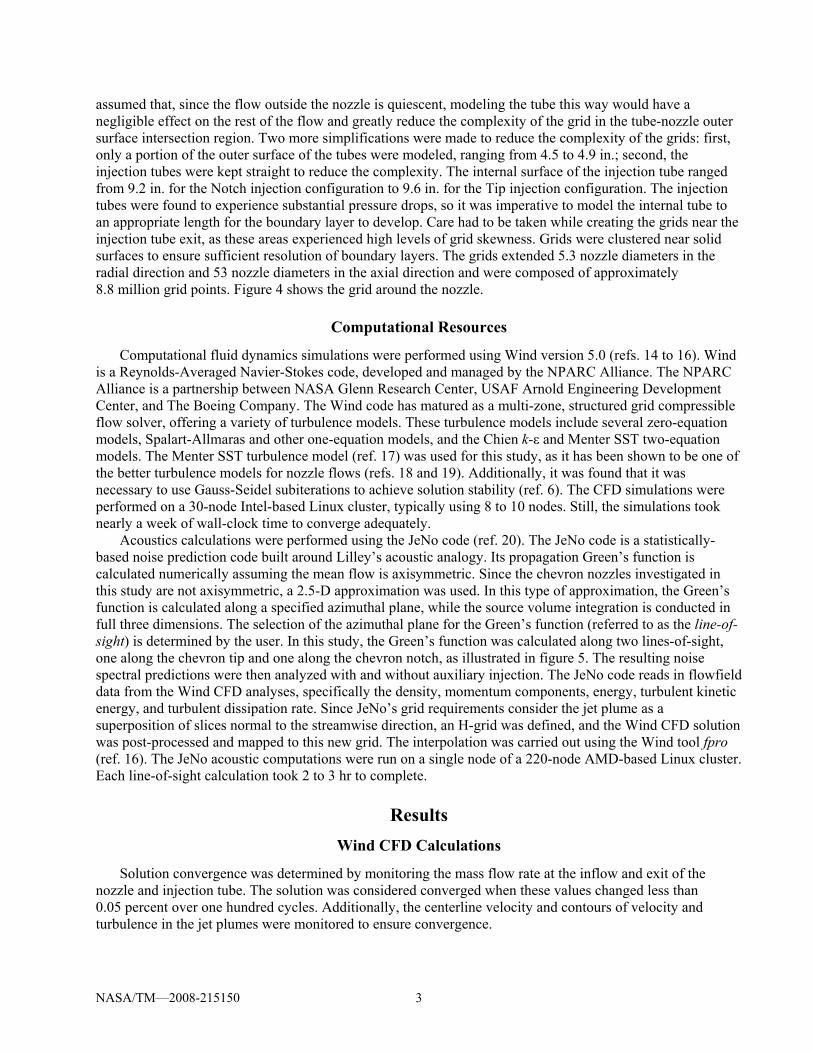
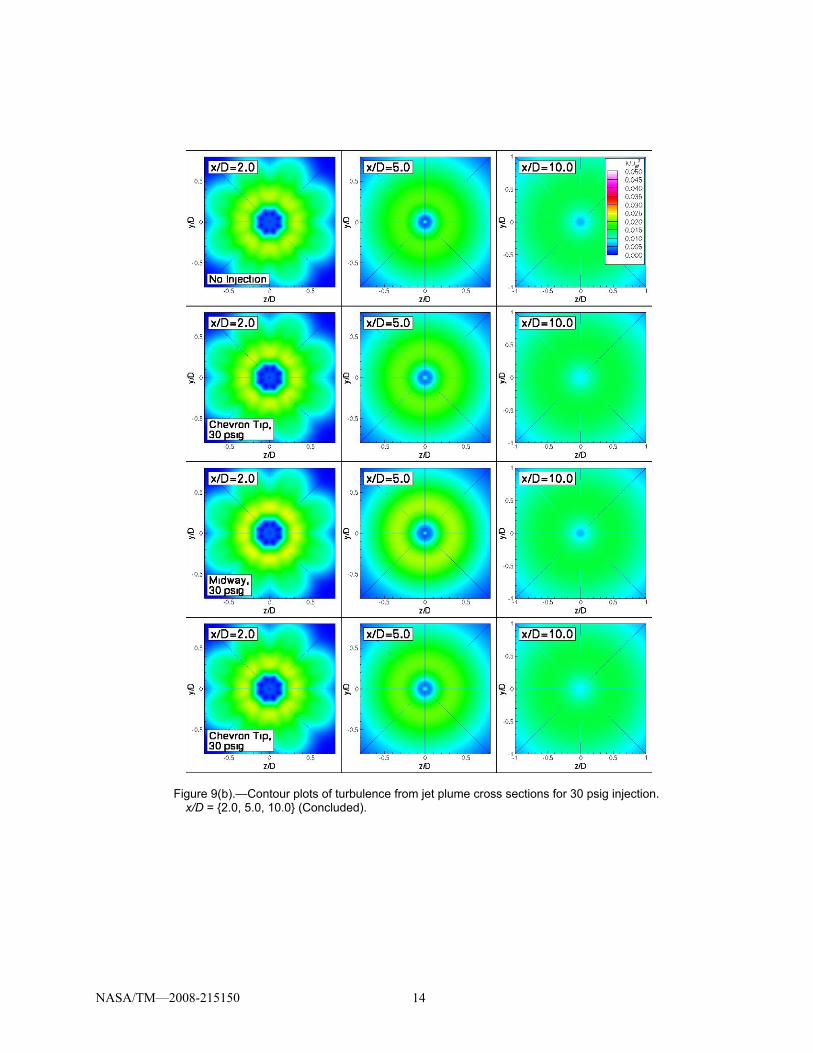
Contour plots of turbulence are plotted at axial stations along the nozzle plume in figures 8 to 10. As observed in figure 7, the larger turbulence resulting from the injection stream shear layer is seen immediately downstream of the injection tube, especially for the 30 psig and 50 psig injection pressures. Figures 8(a) and (b) show only small effects from the lowest injection pressure on the turbulence structure of the plume for each injection tube location. The Notch tube configuration at 10 psig seems to reduce the amount of turbulence in the x/D = 0.1 region. However, there is no significant difference in the amount of turbulence between the different injection locations at x/D = 1.0 and beyond. At the larger injection pressures, as shown in figures 9(a) and (b) and 10 (a) and (b), the injection does somewhat alter the turbulence pattern in the x/D = 0.2 and x/D = 0.5 cross sections, and the turbulence from the injection is clearly recognizable. The altered turbulence structure is more pronounced for the Midway and Notch geometries. At x/D = 1.0 and beyond, the significance of various injections relative to the baseline case begin to grow less apparent. While the turbulence does appear to be reduced somewhat in small regions of the plume flow, it is not readily apparent if and how this will affect the radiated jet mixing noise.
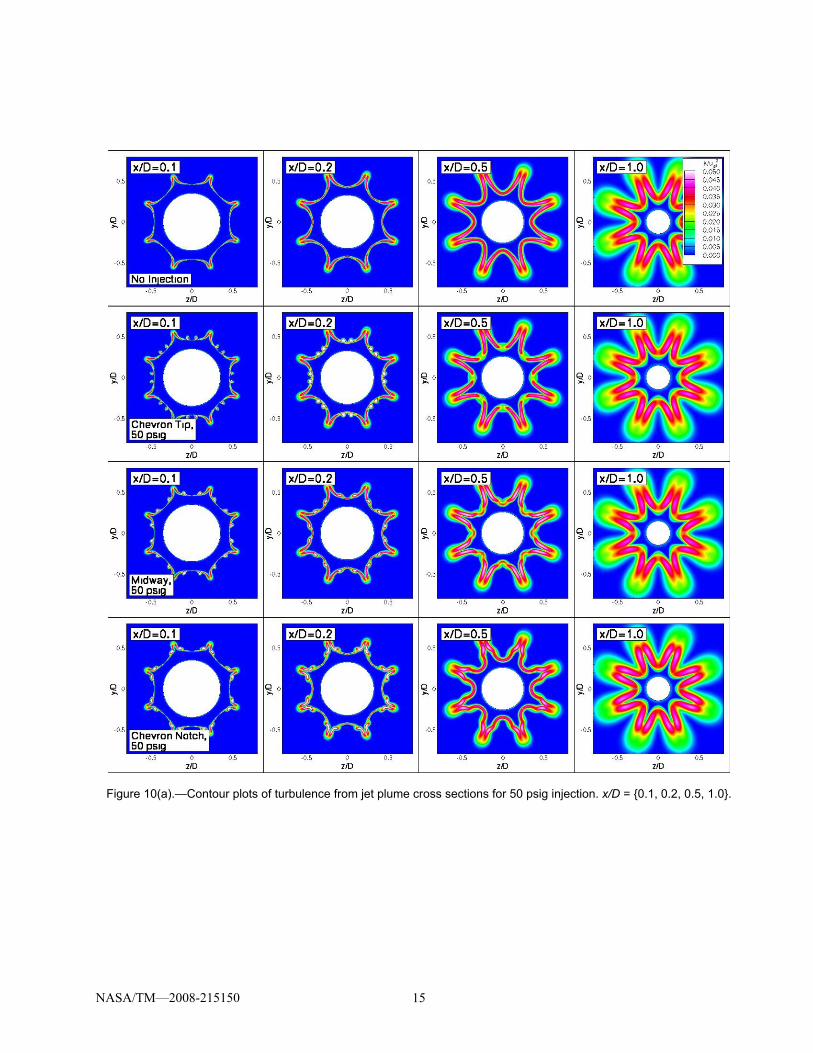
Contours of vorticity at the same plume cross sections are plotted in figures 11 to 13. The vorticity magnitude, W, is nondimensionalized as W*D/ujet. As is expected, the vorticity structures in the jet plume resemble what was observed in the turbulence structures. Compared to the baseline no injection case, the injection cases have an increased amount of vorticity near the nozzle exit, at x/D = 0.1. In figure 11(a), the Notch configuration at 10 psig injection pressure spreads the vorticity out radially from the center of the plume at x/D = 0.5. However, this phenomenon is not observed at higher injection pressures, leading one to believe this might only be an isolated computational-related result rather than a real trend. Similar to the jet plume turbulence, the effects of the injection on the plume are more pronounced for the larger injection pressures. At injection pressures of 30 and 50 psig, the injection produces a noticeable change in the vorticity structure, relative to that of the baseline case, observed at x/D = 0.2 and x/D = 0.5 while dissipating by

NASA/TM—2008-215150 5
x/D = 1.0 (see figures 12(a) and 13(a)). Beyond x/D = 1.0, as shown in figures 11(b), 12(b), and 13(b), the effects of the injection on the jet plume vorticity are minimal. While the goal of the injection was to strengthen the vortices formed by the chevrons, no clear increase in vorticity was observed in the jet plumes with the injection.
JeNo Statistical Calculations
Jet noise calculations were run for each nozzle using the JeNo code. Because JeNo only calculates the two-dimensional Green’s function for an axisymmetric nozzle, a 2.5-D approximation was used for these three-dimensional nozzles by computing the propagation Green’s function at specified lines-of-sight: in one case, the azimuthal line-of-sight is selected along the chevron tip; in the second case, it was set and along the notch plane (refer to figure 5). The farfield jet noise was computed at five inlet angles: 70°, 90°, 110°, 130°, and 150°. Sound spectral density (3rd-octave, lossless, observer at 50 ft or approximately 200D) for the baseline nozzle (no injection) is plotted in figure 14. The horizontal axis is the dimensionless frequency (Strouhal number), defined as:
JeNojet
jet
uDf
St,
⋅=
in which f is the noise frequency in Hz, ujet,JeNo is the maximum jet exit velocity calculated by JeNo, and Djet is the diameter of a circular jet based on the equivalent flow area. There are small differences, 1 to 2 dB, between the two line-of-sight predictions at higher frequencies and at all angles other than 90°. At the downstream angles, 130° and 150°, the notch line-of-sight prediction is significantly lower than for the tip line-of-sight prediction (up to 8 dB at 130° and 25 dB at 150°). The difference in two line-of-sight predictions is related to the Green’s function. It essentially reflects the difference in propagation if the sound had to reach a farfield observer by going through a mean flow characterized by the temperature and average velocity profile either at an azimuthal plane aligned with the tip or the notch of the chevron nozzle. A full three-dimensional Green’s function, in principle, should be able to predict the azimuthal variation in jet noise when the mean flow is not axisymmetric. The noise comparison shown at the two different lines-of-sight highlights the difference between the two extremes when a two-dimensional propagation filter is used in conjunction with a three-dimensional nozzle flow.
Similar noise predictions for the jets with auxiliary injection are shown in figure 15 for both lines-of-sight. For the most part, flow injection produced very little difference in predicted spectra compared to the baseline case. At lower frequencies the Notch injection cases produce a small noise increase (<1 dB). Near the downstream axis, at the 150° observation angle, the 10 psig Notch makes a noticeable difference at very higher frequencies (up to 9 dB noise reduction). However, this is only observed in the notch line-of-sight calculation and the tip line-of-sight calculation does not show a similar trend relative to the baseline case. This particular configuration also shows some reduction in TKE relative to the baseline at x/D = 0.1, as seen in figure 8(a). The CFD and acoustic predictions show that slight reductions in turbulence just downstream of the nozzle should translate into noise differences at higher frequencies. However, because the observed noise reduction was sensitive to the selection of the line-of-sight in the Green’s function calculation, it is unlikely that this noise reduction will be meaningful in the full three-dimensional noise field.
Conclusions In this study, a single-flow plug nozzle with chevrons was successfully analyzed using the Wind RANS
solver. Air was injected at the nozzle exit at three different points along the chevron: near the notch, at the mid-point, and near the tip. Additionally, three injection pressures were used: 10, 30, and 50 psig. The results show that injection has a rather subtle effect on the jet plume of the chevron nozzle. The turbulence and vorticity structures were altered by the injection in a very short span in the vicinity of the injection plane, with

NASA/TM—2008-215150 6
each injection location producing its own distinct plume structure. These structures became more pronounced as the injection pressure increased. However, centerline velocity decay and peak turbulence levels within the jet plume were generally not affected by the fluidic injection. Furthermore, the observable effects of injection were localized to the region immediately downstream of the nozzle exit, x/D≤1.0. Further downstream, at x/D>1.0, the observable effects of injection had dissipated, and there was no significant difference between the plumes of the baseline no injection case and those with air injection.
From the steady-state RANS solutions, one cannot clearly infer whether the auxiliary injection actually reduced jet noise. Therefore, jet noise calculations were also performed for each injection configuration using the results of the RANS solutions as input to the JeNo code. JeNo uses a variant of the acoustic analogy based on Lilley’s formulation. Acoustic spectral predictions did not show a clear noise reduction benefit as a result of the injection.
Large Eddy Simulation (LES) may be considered as an alternative tool in understanding the impact on jet mixing due to the large-scale structures as a result of chevrons and auxiliary fluidic devices. However, the complexity of chevron nozzles combined with the injection tubes and the grid requirements to properly resolve various scales in a high Reynolds number jet flow makes such LES computations very expensive.
References 1. Callender, B., Gutmark, E., and Martens, S., “A Far-Field Investigation into Chevron Nozzle Mechanisms
and Trends,” AIAA Paper 2003–1058, 2003. 2. Callender, B., Gutmark, E., and Martens, S., “A Near-Field Investigation into Chevron Nozzle
Mechanisms,” AIAA Paper 2003–3210, 2003. 3. Callender, B., Gutmark, E., and Martens, S., “A PIV Flow Field Investigation of Chevron Nozzle
Mechanisms,” AIAA Paper 2004–191, 2004. 4. Bridges, J. and Brown, C.A., “Parametric Testing of Chevrons on Single-flow Hot Jets,” AIAA Paper
2004–2824, 2004. 5. Koch, L. D., Bridges, J., and Khavaran, A., “Mean Flow and Noise Prediction for a Separate Flow Jet
with Chevron Mixers,” AIAA Paper 2004–189, 2004. 6. Engblom, W., Khavaran, A., and Bridges, J., “Numerical Prediction of Chevron Nozzle Noise Reduction
using WIND-MGBK Methodology,” AIAA Paper 2004–2979, 2004. 7. Loheac, P., Julliard, J., and Dravet, A., “CFM56 Noise Reduction with the Chevron Nozzle,” AIAA Paper
2004–3044, 2004. 8. Calkins, F.T. and Butler, G.W., “Subsonic Jet Noise Reduction Variable Geometry Chevron,” AIAA
Paper 2004–190, 2004. 9. Mabe, J.H., Cabell, R.H., and Butler, G.W., “Design and Control of a Morphing Chevron for Takeoff and
Cruise Noise Reduction,” AIAA Paper 2005–2889, 2005. 10. Henderson, B.S., Kinzie, K.W., Whitmere, J., and Abeysinghe, A., “The Impact of Fluidic Chevrons on
Jet Noise,” AIAA Paper 2005–2888, 2005. 11. Henderson, B.S., Kinzie, K. W., Whitmere, J., and Abeysinghe, A., “Aeroacoustic Improvements to
Fluidic Chevron Nozzles,” AIAA Paper 2006–2706, 2006. 12. Harrison, S.A., Gutmark, E.J., and Martens, S., “Jet Noise Reduction by Fluidic Injection on a Separate
Flow Exhaust System,” AIAA Paper 2006–2547, 2006. 13. GRIDGEN Version 13, User Manual, Pointwise, Inc., Bedford, Texas, 1998. 14. Bush, R., Power, G., and Towne, C., “WIND: The Production Flow Solver of the NPARC Alliance,”
AIAA Paper 98–0935, 1998. 15. Nelson, C.C. and Power, G.D., “CHSSI Project CFD-7: The NPARC Alliance Flow Simulation System,”
AIAA Paper 2001–0594, 2001. 16. The Wind User’s Guide, User Manual, The NPARC Alliance,
http://www.grc.nasa.gov/WWW/winddocs/user/index.html. 17. Menter, F.R., “Two-Equation Eddy Viscosity Turbulence Models for Engineering Applications,” AIAA
Journal, vol. 32, no. 8, pp. 1598–1605, 1994.

NASA/TM—2008-215150 7
18. Georgiadis, N. and Papamoschou, D., “Computational Investigations of High-Speed Dual-Stream Jets,” AIAA Paper 2003–3311, 2003.
19. Georgiadis, N.J., Rumsey, C.L., Yoder, D. A., and Zaman, K.B. M.Q., “Effects of RANS Turbulence Modeling on Calculation of Lobed Nozzle Flowfields,” AIAA Paper 2003–1271, 2003.
20. Khavaran, A., Bridges J., and Georgiadis, N., “Prediction of Turbulence-Generated Noise in Unheated Jets: Part 1: JeNo Technical Manual (Version 1.0),” NASA/TM—2005-213827, 2005.

NASA/TM—2008-215150 8
Figure 1.—Diagram of injection tube locations along chevrons.
Figure 2.—Rendering of chevron nozzle with injection tubes at the Midway position.
Figure 3.—Illustration of simplified injection tube-nozzle surface
interface. Midway position of injection tubes shown.

NASA/TM—2008-215150 9
(a) Grid around 22.5° nozzle section.
(b) Grid at chevron/injection tube exit.
Figure 4.—Chevron nozzle grid with tube at the Midway position.
Figure 5.—Diagram of chevron nozzle lines-of-sight.

NASA/TM—2008-215150 10
Figure 6.—Centerline velocity of jet plume.
Figure 7.—Maximum turbulence along plume.

NASA/TM—2008-215150 11
Figure 8(a).—Contour plots of turbulence from jet plume cross sections for 10 psig injection. x/D = {0.1, 0.2, 0.5, 1.0}.

NASA/TM—2008-215150 12
Figure 8(b).—Contour plots of turbulence from jet plume cross sections for 10 psig injection.
x/D = {2.0, 5.0, 10.0} (Concluded).

NASA/TM—2008-215150 13
Figure 9(a).—Contour plots of turbulence from jet plume cross sections for 30 psig injection. x/D = {0.1, 0.2, 0.5, 1.0}.
NASA/TM—2008-215150 14
Figure 9(b).—Contour plots of turbulence from jet plume cross sections for 30 psig injection.
x/D = {2.0, 5.0, 10.0} (Concluded).
NASA/TM—2008-215150 15
Figure 10(a).—Contour plots of turbulence from jet plume cross sections for 50 psig injection. x/D = {0.1, 0.2, 0.5, 1.0}.

NASA/TM—2008-215150 16
Figure 10(b).—Contour plots of turbulence from jet plume cross sections for 50 psig injection.
x/D = {2.0, 5.0, 10.0} (Concluded).

NASA/TM—2008-215150 17
Figure 11(a).—Contour plots of vorticity magnitude from jet plume cross sections for 10 psig injection. x/D = {0.1, 0.2,
0.5, 1.0}. Note: contour levels are not consistent across plume locations.
NASA/TM—2008-215150 18
Figure 11(b).—Contour plots of vorticity magnitude from jet plume cross sections for 10 psig injection. x/D = {2.0, 5.0, 10.0}. Note: contour levels are not consistent across plume locations (Concluded).

NASA/TM—2008-215150 19
Figure 12(a).—Contour plots of vorticity magnitude from jet plume cross sections for 30 psig injection. x/D = {0.1, 0.2,
0.5, 1.0}. Note: contour levels are not consistent across plume locations.

NASA/TM—2008-215150 20
Figure 12(b).—Contour plots of vorticity magnitude from jet plume cross sections for 30 psig injection. x/D = {2.0, 5.0, 10.0}. Note: contour levels are not consistent across plume locations (Concluded).

NASA/TM—2008-215150 21
Figure 13(a).—Contour plots of vorticity magnitude from jet plume cross sections for 50 psig injection. x/D = {0.1, 0.2,
0.5, 1.0}. Note: contour levels are not consistent across plume locations.

NASA/TM—2008-215150 22
Figure 13(b).—Contour plots of vorticity magnitude from jet plume cross sections for 50 psig injection. x/D = {2.0, 5.0, 10.0}. Note: contour levels are not consistent across plume locations (Concluded).

NASA/TM—2008-215150 23
Figure 14.—Comparison of JeNo Sound
spectral density predictions (3rd-octave, lossless, observer at 50 ft or approx-imately 200D) for baseline nozzle using chevron tip and chevron notch lines-of-sight. All spectrum angles measured from inlet axis.

NASA/TM—2008-215150 24
Figure 15.—JeNo spectral density predictions (3rd-octave, lossless, observer at 50 ft or approximately 200D) for baseline nozzle using chevron tip and chevron notch lines-of-sight. All spectrum angles measured from inlet axis.

REPORT DOCUMENTATION PAGE Form Approved OMB No. 0704-0188
The public reporting burden for this collection of information is estimated to average 1 hour per response, including the time for reviewing instructions, searching existing data sources, gathering and maintaining the data needed, and completing and reviewing the collection of information. Send comments regarding this burden estimate or any other aspect of this collection of information, including suggestions for reducing this burden, to Department of Defense, Washington Headquarters Services, Directorate for Information Operations and Reports (0704-0188), 1215 Jefferson Davis Highway, Suite 1204, Arlington, VA 22202-4302. Respondents should be aware that notwithstanding any other provision of law, no person shall be subject to any penalty for failing to comply with a collection of information if it does not display a currently valid OMB control number. PLEASE DO NOT RETURN YOUR FORM TO THE ABOVE ADDRESS. 1. REPORT DATE (DD-MM-YYYY) 01-03-2008
2. REPORT TYPE Technical Memorandum
3. DATES COVERED (From - To)
4. TITLE AND SUBTITLE CFD Analyses and Jet-Noise Predictions of Chevron Nozzles With Vortex Stabilization
5a. CONTRACT NUMBER
5b. GRANT NUMBER
5c. PROGRAM ELEMENT NUMBER
6. AUTHOR(S) Dippold, Vance, III
5d. PROJECT NUMBER
5e. TASK NUMBER
5f. WORK UNIT NUMBER WBS 561581.02.08.03.03.02
7. PERFORMING ORGANIZATION NAME(S) AND ADDRESS(ES) National Aeronautics and Space Administration John H. Glenn Research Center at Lewis Field Cleveland, Ohio 44135-3191
8. PERFORMING ORGANIZATION REPORT NUMBER E-16329
9. SPONSORING/MONITORING AGENCY NAME(S) AND ADDRESS(ES) National Aeronautics and Space Administration Washington, DC 20546-0001
10. SPONSORING/MONITORS ACRONYM(S) NASA
11. SPONSORING/MONITORING REPORT NUMBER NASA/TM-2008-215150; AIAA-2008-0037
12. DISTRIBUTION/AVAILABILITY STATEMENT Unclassified-Unlimited Subject Category: 01 Available electronically at http://gltrs.grc.nasa.gov This publication is available from the NASA Center for AeroSpace Information, 301-621-0390
13. SUPPLEMENTARY NOTES
14. ABSTRACT The wind computational fluid dynamics code was used to perform a series of analyses on a single-flow plug nozzle with chevrons. Air was injected from tubes tangent to the nozzle outer surface at three different points along the chevron at the nozzle exit: near the chevron notch, at the chevron mid-point, and near the chevron tip. Three injection pressures were used for each injection tube location--10, 30, and 50 psig-giving injection mass flow rates of 0.1, 0.2, and 0.3 percent of the nozzle mass flow. The results showed subtle changes in the jet plume’s turbulence and vorticity structure in the region immediately downstream of the nozzle exit. Distinctive patterns in the plume structure emerged from each injection location, and these became more pronounced as the injection pressure was increased. However, no significant changes in centerline velocity decay or turbulent kinetic energy were observed in the jet plume as a result of flow injection. Furthermore, computational acoustics calculations performed with the JeNo code showed no real reduction in jet noise relative to the baseline chevron nozzle. 15. SUBJECT TERMS Jet noise; Chevron nozzle; Vortex stabilization; Fluidic injection
16. SECURITY CLASSIFICATION OF: 17. LIMITATION OF ABSTRACT UU
18. NUMBER OF PAGES
30
19a. NAME OF RESPONSIBLE PERSON STI Help Desk (email:[email protected])
a. REPORT U
b. ABSTRACT U
c. THIS PAGE U
19b. TELEPHONE NUMBER (include area code) 301-621-0390
Standard Form 298 (Rev. 8-98)Prescribed by ANSI Std. Z39-18