CFD simulation of a pilot scale slurry photocatalytic reactor and design of multiple-lamp reactors Yash Boyjoo, Ming Ang, Vishnu Pareek n Department of Chemical Engineering, Curtin University, Perth, WA 6102, Australia HIGHLIGHTS CFD simulation of a pilot scale single-lamp photocatalytic reactor. Half order and first order reaction regions determined in the reactor for different catalyst loadings. Results used to design multiple-lamp reactors. article info Article history: Received 1 November 2013 Received in revised form 5 February 2014 Accepted 14 February 2014 Available online 5 March 2014 Keywords: Photocatalytic Radiation Multi-lamps Multiphase Modelling abstract The hydrodynamics behaviour and radiation transport occurring inside a pilot-scale slurry photocatalytic reactor (treating real shower water) with large diameter was investigated using computational fluid dynamics (CFD). The multiphase flow system was solved using a granular Eulerian model while the solution of the radiative transport equation (RTE) was solved using the finite volume based discrete ordinate model (DOM). Multiphase simulation showed recirculation zones caused by the high slurry inlet velocity. Due to the rapid attenuation of light occurring radially within the reactor, regions of varying reaction orders exist, i.e., half order reaction close to the lamp and first order reaction further from the lamp, as the incident radiation goes below a certain value. A rate equation relating pollutant degradation to the rate occurring in the half and first order reaction regions (in terms of local volumetric rate of energy absorption – LVREA) was proposed. Using a value of 225 W m 2 as the minimum incident light intensity at which half order reactions take place, a Pearson correlation of 0.88 between simulated and experimental data indicated that the proposed model satisfactorily described the experimental observations. Next, simulations performed with a system of multiple lamps (2 and 4 lamps) at different geometrical arrangements (i.e. with the lamps separated by the distance X lamp ) showed that within the range of catalyst concentration investigated, the maximum potential increases in reaction rate was 56% and 123% when using 2 and 4 lamps (at optimum lamp arrangement) respectively, as compared to using one lamp. The increase in reaction rate occurred due to the maximisation of incident radiation contours at which first order reactions take place. The optimum lamp separation was dependent on the catalyst concentration in the wastewater and decreased with increasing catalyst concentration. & 2014 Elsevier Ltd. All rights reserved. 1. Introduction Photocatalysis as a method of water treatment has been intensively investigated in the past three decades. However it is only recently that photocatalytic reactors for gas and liquid phase reactions have been modelled using computational fluid dynamics (CFD). The modelling of photocatalytic reactors requires solving the solution of the radiation transport equation (RTE). Mathematical models such as emission models have been developed for simple systems without absorption and scattering (Salvado-Estivill et al., 2007a). Other mathematical models have been developed for idealised flows (thin film slurry reactors) (Li Puma and Yue, 2003) or for specific designs, with varying levels of complexity that require numerical methods to be solved (Passalia et al., 2011). Methods that involve statistical treatment such as the Monte Carlo method (Alexiadis, 2006) and approximations to the solution of the RTE such as the P1 model (Cuevas et al., 2007) and the DOM have also been devised and tested. Nonetheless, it is the discrete ordinate model (DOM) that has proven the most accurate and flexible along the years and it is now being used for several types of immobilised or slurry reactors (Chong et al., 2011; Denny et al., 2009, 2010; Duran et al., 2011; Pareek, 2005; Pareek and Adesina, 2004; Pareek et al., 2003b; Qi et al., 2011; Trujillo et al., 2007, 2010). Since the Contents lists available at ScienceDirect journal homepage: www.elsevier.com/locate/ces Chemical Engineering Science http://dx.doi.org/10.1016/j.ces.2014.02.022 0009-2509 & 2014 Elsevier Ltd. All rights reserved. n Corresponding author. Tel.: þ61 8 9266 4687; fax: þ61 8 9266 2681. E-mail address: [email protected](V. Pareek). Chemical Engineering Science 111 (2014) 266–277
Transcript
CFD simulation of a pilot scale slurry photocatalytic reactor and designof multiple-lamp reactors
Yash Boyjoo, Ming Ang, Vishnu Pareek n
Department of Chemical Engineering, Curtin University, Perth, WA 6102, Australia
H I G H L I G H T S
� CFD simulation of a pilot scale single-lamp photocatalytic reactor.� Half order and first order reaction regions determined in the reactor for different catalyst loadings.� Results used to design multiple-lamp reactors.
a r t i c l e i n f o
Article history:Received 1 November 2013Received in revised form5 February 2014Accepted 14 February 2014Available online 5 March 2014
The hydrodynamics behaviour and radiation transport occurring inside a pilot-scale slurry photocatalyticreactor (treating real shower water) with large diameter was investigated using computational fluiddynamics (CFD). The multiphase flow system was solved using a granular Eulerian model while thesolution of the radiative transport equation (RTE) was solved using the finite volume based discreteordinate model (DOM). Multiphase simulation showed recirculation zones caused by the high slurry inletvelocity. Due to the rapid attenuation of light occurring radially within the reactor, regions of varyingreaction orders exist, i.e., half order reaction close to the lamp and first order reaction further from thelamp, as the incident radiation goes below a certain value. A rate equation relating pollutant degradationto the rate occurring in the half and first order reaction regions (in terms of local volumetric rate ofenergy absorption – LVREA) was proposed. Using a value of 225 W m�2 as the minimum incident lightintensity at which half order reactions take place, a Pearson correlation of 0.88 between simulated andexperimental data indicated that the proposed model satisfactorily described the experimentalobservations. Next, simulations performed with a system of multiple lamps (2 and 4 lamps) at differentgeometrical arrangements (i.e. with the lamps separated by the distance Xlamp) showed that within therange of catalyst concentration investigated, the maximum potential increases in reaction rate was 56%and 123% when using 2 and 4 lamps (at optimum lamp arrangement) respectively, as compared to usingone lamp. The increase in reaction rate occurred due to the maximisation of incident radiation contoursat which first order reactions take place. The optimum lamp separation was dependent on the catalystconcentration in the wastewater and decreased with increasing catalyst concentration.
& 2014 Elsevier Ltd. All rights reserved.
1. Introduction
Photocatalysis as amethod of water treatment has been intensivelyinvestigated in the past three decades. However it is only recently thatphotocatalytic reactors for gas and liquid phase reactions have beenmodelled using computational fluid dynamics (CFD). The modelling ofphotocatalytic reactors requires solving the solution of the radiationtransport equation (RTE). Mathematical models such as emissionmodels have been developed for simple systems without absorption
and scattering (Salvado-Estivill et al., 2007a). Other mathematicalmodels have been developed for idealised flows (thin film slurryreactors) (Li Puma and Yue, 2003) or for specific designs, with varyinglevels of complexity that require numerical methods to be solved(Passalia et al., 2011). Methods that involve statistical treatment suchas the Monte Carlo method (Alexiadis, 2006) and approximations tothe solution of the RTE such as the P1 model (Cuevas et al., 2007) andthe DOM have also been devised and tested. Nonetheless, it is thediscrete ordinate model (DOM) that has proven the most accurate andflexible along the years and it is now being used for several types ofimmobilised or slurry reactors (Chong et al., 2011; Denny et al., 2009,2010; Duran et al., 2011; Pareek, 2005; Pareek and Adesina, 2004;Pareek et al., 2003b; Qi et al., 2011; Trujillo et al., 2007, 2010). Since the
Contents lists available at ScienceDirect
journal homepage: www.elsevier.com/locate/ces
Chemical Engineering Science
http://dx.doi.org/10.1016/j.ces.2014.02.0220009-2509 & 2014 Elsevier Ltd. All rights reserved.
proposal of the DOM to solve the RTE (Romero et al., 1997) in amedium and the development of powerful computers that use theDOM or related variants to solve the RTE, more research involvingphotocatalytic treatment have also involved a CFD treatment so as tovalidate experimental results. CFD treatment involves the simulationof fluid flows (single phase/multiphase) as well as solving the RTEwithin the treated medium. The hydrodynamics of multiphase flow inslurry reactors is solved by either the Euler–Euler (E–E) or Euler–Lagrange (E–L) formulations. Researchers in general have preferredthe E–E method in solving multiphase flows compared to the E–Lapproach (Dhotre et al., 2008; Olmos et al., 2001; Pareek et al., 2003b;Sanyal et al., 1999; Tabib et al., 2008) due to its robustness, accuracyand relatively lower computational time requirement.
The rate of reaction in an immobilised system can be related tothe incident radiation reaching the surface of the immobilisedcatalyst. This is slightly different for a slurry system. Here theconcept of local volumetric rate of energy absorption (LVREA) isadopted. The LVREA is the amount of energy absorbed in everyelemental volume within a slurry reactor and is proportional tothe local incident radiation at that point. In slurry reactors, theincident light intensity decays exponentially with radial distancefrom the surface of the lamp enclosure (due to light absorptionand shielding by the catalyst particles) and so does the LVREA.
The reaction order for a photocatalytic reaction can be halforder, transitional order or first order with respect to the LVREA,depending on the incident light intensity reaching the surface ofthe catalyst particles. The higher the light intensity, the higher willbe the rate of electron–hole recombination within the TiO2
particles, which reduces the probability of pollutant speciesoxidation. This makes the reaction half order (or square rootdependent) with respect to the LVREA. As the light intensitydecreases, the reaction rate will tend towards first order depen-dency with respect to the LVREA. Herrmann (1999) mentionedthat the rate of reaction was proportional to the radiant flux belowa value of 250 W m�2 and that above this value, the rate becameproportional to the square root of the radiant flux.
However immobilised systems can give a better indication of theinfluence of radiant flux on reaction rate since the radiant fluxes aremeasured at the catalyst surface. Consequently, for aqueous systems,linear regimes have been reported at r28.1 Wm�2 (Charles et al.,2011) and r110Wm�2 (Romero et al., 2003) while a transitionalregime was found in the range between 55 and 210Wm�2
(Mehrotra et al., 2005).In slurry reactors with large annulus (as in this study) or small
catalyst loading, all reaction rate regimes are expected to occur.A slurry reactor was used as opposed to an immobilised system(where a catalyst coating is used) due to better mass transfer andimproved contact area of the catalyst particles with the pollutants.The aim of this study is to relate the average degradation rate ofshower water (in terms of TOC – total organic carbon) with thereaction regimes (half and first order) prevailing within the reactionspace and to validate the experimental results previously obtainedwith the devised model. Once validated, the rate parameters werethen used to determine the effect of using multiple lamps (2 and4 lamps) and having the same total emissive power as the one lamp,on the average rate of reaction. Variables such as catalyst loadingand geometrical arrangement (i.e. with the lamps separated by thedistance Xlamp) were investigated in the case of multiple lamps.
2. Experimental
The photodegradation of shower water was carried out in a31 L pilot scale reactor using 1 lamp and operating in recirculationmode (i.e., slurry outlet was circulated back to the slurry inlet). Theinlet concentration of shower water in terms of total organic
carbon (TOC) was 2:052� 10�373:67� 10�5 mol L�1. A mediumpressure Hg lamp (Primarc PM3426, 560 W) was used as the UVsource. The lamp spectrum as obtained from the manufacturerwas grouped into 3 bands within the absorbable UV range for P25TiO2 (υr387:5 nm). The radiation emission for each band ispresented in Table 1.
3. Theoretical analysis
This section presents the theoretical analysis of the hydrody-namics and radiation transport occurring within the slurry reactor.
3.1. The Eulerian–Eulerian multiphase model
The Eulerian–Eulerian model allows for the modelling of multi-ple separate, yet interacting phases (Fluent, 2005). The phases areconsidered as interpenetrating continua for which equationsrepresenting the conservation of mass and momentum are solved.These are presented below (Fluent, 2005; Ranade, 2002).
The concept of volume fraction: for n phases in total isintroduced here,
∑n
k ¼ 1αk ¼ 1 ð1Þ
where αk is the volume fraction of phase kThe continuity equation can therefore be written as
∂ðαkρkÞ∂t
þ∇ðαkρkUkÞ ¼ ∑n
p ¼ 1;pakSpk ð2Þ
where the subscript k denotes phase k and Spk is the rate of masstransfer from phase p to phase k.
The momentum balance for phase k can be written as
∂ðαkρkUkÞ∂t
þ∇ðαkρkU2kÞ ¼ �αk∇p�∇ðαkτkÞþαkρkgþFk ð3Þ
where, Fk denotes the interphase momentum exchange termsbetween phase; k and all other phases present in the system.
The main interfacial force acting between the phases is the dragforce. From outcomes obtained in previous works, other forcessuch as lift, virtual mass and turbulent dispersion were notdeemed to be significant in this reactor (Buwa et al., 2006; ElenaDiaz et al., 2009; Selma et al., 2010; Tabib et al., 2008). The Morsiand Alexander (1972) model was used for the calculation of thedrag coefficient as it is the most complete model and can beadjusted frequently over a large range of Reynolds number.
3.2. Species balance
The concentration of reactants or final products in each controlvolume of the computational grid can be expressed in terms ofmass fraction, Yi. The species balance can be represented as
∂∂t
�ρiYi
�þ∇
�ρiUY i
�¼ �∇Jiþri ð4Þ
Table 1Lamp emission rate in the absorbable UV range for different bands.
Wavelength range (nm) Lamp emissivepower (W m�2)
Band 1: ð226oυ o280Þ 410Band 2: ð281oυ o315Þ 488.6Band 3: ð316oυ o387:5Þ 506.2Total absorbable power 1404.8
Y. Boyjoo et al. / Chemical Engineering Science 111 (2014) 266–277 267
where Ji and ri are the diffusion flux and net rate of production/destruction of species i respectively. The diffusion coefficient (D) ofthe organic species in water at 300 K was taken as 1�10�9 m2 s�1
(Delgado, 2007).
3.3. The radiation transport equation (RTE)
The radiation balance for an incremental distance, ds, withinthe reactor can be represented by Cassano and Alfano (2000) andPareek et al. (2008)
dIυ ðs;ΩÞds
¼ �κυ Iυ ðs;ΩÞ�sυ Iυ ðs;ΩÞþ 14πsυ
Z 4π
0pðΩ0-ΩÞIυ ðs;Ω0ÞdΩ0
ð5Þwhere, Iυ ðs;ΩÞ is a beam of monochromatic radiation intensitytravelling in the medium in the direction Ω along the path s, κυand sυ are the absorption and scattering coefficients of themedium respectively and pðΩ0-ΩÞ is a phase function represent-ing the probability of incident radiation due to in-scattering ontothe element from all other directions surrounding the element.The absorption and scattering coefficients and phase function areall optical parameters that are imparted by the TiO2 particles in thewastewater medium. Expressions for these parameters are pre-sented in 3.3.1.
3.3.1. Optical propertiesThe values of the scattering and absorption coefficients can be
related to the catalyst loading (Wcat, g m�3) and the wavelengthaveraged specific scattering and absorption coefficients respec-tively (⟨sn
v⟩ and ⟨knv⟩ in m2 g�1). These are represented by thefollowing relationships for TiO2 particles (Romero et al., 1997)
sυ ¼ ⟨sn
υ ⟩Wcat ð6Þ
κυ ¼ ⟨κnυ ⟩Wcat ð7ÞIn this work, the relatively newly developed Aeroxides P25 TiO2
was used, which had enhanced photocatalytic activity comparedto standard P25 TiO2 (2011). Previous experimental studies usingthe same reactor (Evonik Industries, 2011, Boyjoo et al., 2013a)demonstrated that the absorption coefficient (Eq. (7)) was wave-length dependent. As a result, the absorption coefficients for3 wavelength bands were determined (Eqs. 8–10). Moreover, sincethe particle size of the catalyst was similar to that of Degussa P25TiO2, the wavelength average over the whole wavelength range, asmeasured by Cabrera et al. for Degussa P25 TiO2 was used andfound to be satisfactory for the scattering coefficient (Boyjoo et al.,2013a) (Eq. (11)).
Band 1 : κ1 ¼ 0:66Wcat ð8Þ
Band 2 : κ2 ¼ 0:68Wcat ð9Þ
Band 3 : κ3 ¼ 0:70Wcat ð10Þ
s1�3 ¼ 5:448Wcat ð11ÞThe other optical property to be considered is the phase function,for which the linear anisotropic form was used (Fiveland, 1984)
pðΩ0-ΩÞ ¼ 1þA cos θ ð12Þwhere A¼ �1; 0 and 1 for backward, isotropic and forwardscattering respectively.
The phase function parameter (constant A in Eq. (12)) has arelatively low sensitivity on the light intensity distribution withina photocatalytic reactor (Pareek et al., 2003a, 2008; Yu et al.,2008). Pareek et al. (2003a) investigated the effect of the phasefunction parameter on Aldrich TiO2 in a slurry reactor. It was foundthat at low catalyst loading (0.03 g L�1), backward scattering was
favoured while at higher catalyst loading, isotropic scatteringbecame dominant. Nonetheless, in most cases, isotropic scatteringgave a mean absolute percentage error of less than 10% whencompared to experimental values of radial incident intensity.Furthermore, when comparing the two extremes of scattering(A¼�1 and 1), the maximum difference in volume averagedintensity for four different catalyst loadings was less than 2.5%for non-reflecting and 10% for reflecting walls. From these findings,isotropic scattering (A¼0) was used in this analysis.
3.4. Rate of chemical reaction
In a slurry reactor with large diameter such as the one used inthis research, it is expected that all reaction regimes (half order,transitional order and first order) take place. The rate of photo-catalytic reaction for any regime is related to the LVREA as follows:
�rp ¼ kðf ½P�ÞðLVREAÞm ð13Þwhere k is a reaction rate constant, f ½P� is a function of the pollutantconcentration and the values of m are 0.5, between 0.5 and 1 and1 for half order, transitional and first order reaction regimesrespectively. Generally, the kinetics of pollutant degradation, f ½P�,can be represented by a Langmuir–Hinshelwood or first order model.
The LVREA for a wavelength or wavelength band υ, at any pointis expressed as
LVREAυðx; y; zÞ ¼ κυ
Z Ω ¼ 4π
Ω ¼ 0Iυ ðx; y; z;ΩÞdΩ ð14Þ
such that the total LVREA at any point for the absorbablewavelength range is expressed as
LVREA ðx; y; zÞ ¼ ∑υr υmax
LVREAυðx; y; zÞ ð15Þ
The reaction rate depends on the LVREA which in turn depends onthe catalyst loading within the reaction medium. Since experi-ments showed that the pollutant concentration only changed veryslightly with time for approximately the first 20 min of TOCdegradation (Boyjoo, 2013; Boyjoo et al., 2012), the TOC concen-tration was assumed to vary linearly with time, i.e., the rate of TOCdegradation was zero order for the first 20 min of TOC reduction.As a result, Eq. (13) can be simplified as
�rp ¼ k0ðLVREAÞm ð16Þwhere k0 encompasses the zero order reaction rate constant.
In this study, the transitional reaction regime will be ignored asit will be assumed that the main regimes existing within thereactor are of half and first order. Hence for a reaction domain thathas been discretised into smaller volumes, the total average ratedue to both regimes is (Boyjoo et al., 2013b)
⟨�rp⟩¼1VW
½k0hZ
LVREA ðVW Þ0:5dVW ; Ih r Io Imax
þk0f
ZLVREA ðVW ÞdVW ;Io Ih � ð17Þ
where VW is the volume occupied by the wastewater, k0h and k0f arethe half and first order reaction rate constants, Imax is the max-imum incident light intensity, which occurs at the lamp surfaceand Ih is the minimum incident intensity at which half orderreaction takes place.
4. Modelling
The Eulerian–Eulerian model was used to simulate the threephase flow (water–TiO2 particles-air). The standard κ�ε turbu-lence model was used (since the concentrations of the secondaryphases were dilute (Fluent, 2005)), with standard wall functions.
Y. Boyjoo et al. / Chemical Engineering Science 111 (2014) 266–277268
The momentum equations for the individual phases were solvedusing an extension of the SIMPLE algorithm (phase-coupled-SIMPLE). The overall continuity was used as a pressure–velocitycoupling (Ranade, 2002) criterion. The TiO2 phase was simulatedwith the granular Eulerian model whereby the particulate phasewas treated as liquid droplets. In the granular model, the solidphase momentum equation is modified by introducing severaladditional terms that account for the physical and rheologicalproperties of the particles. In this model, particle coalescence wasignored and the diameter was constant at 2:1� 10�8 m. Thepacking limit for TiO2 particles was taken as 0.55 (Turian et al.,1997) and the restitution coefficient was zero, from the works of(Gondret et al., 2002, Marshall, 2011) that describe collisions ofparticles in a viscous fluid. The granular shear viscosity wasdetermined using the approach of Gidaspow et al. (Fluent, 2005)while the granular bulk viscosity was expressed according to themodel proposed by Lun et al. (Fluent, 2005).
Radiation modelling was performed using the discrete ordinatemethod (DOM). The DOM transforms the integro-differential formof the RTE into a system of algebraic equations that can be solvedby machine computation. In the DOM, the radiation field is dividedinto a number of discrete directions and the RTE is written andsolved separately for each of the directions. Fluent uses a variant ofthe DOM called the finite volume (FV) method. The solution of theRTE was solved by discretising each control volume from Fig. 1(right) into 72 directions (solid angles) and a pixelation of 1�1.
4.1. Computational domain
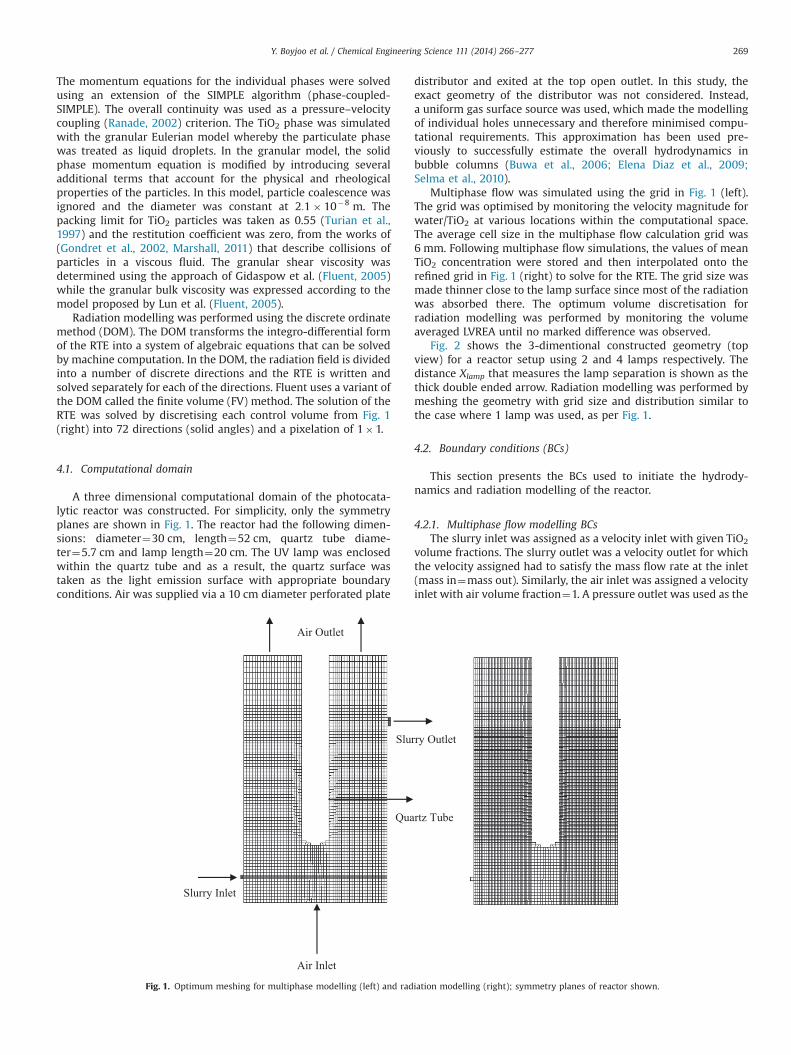
A three dimensional computational domain of the photocata-lytic reactor was constructed. For simplicity, only the symmetryplanes are shown in Fig. 1. The reactor had the following dimen-sions: diameter¼30 cm, length¼52 cm, quartz tube diame-ter¼5.7 cm and lamp length¼20 cm. The UV lamp was enclosedwithin the quartz tube and as a result, the quartz surface wastaken as the light emission surface with appropriate boundaryconditions. Air was supplied via a 10 cm diameter perforated plate
distributor and exited at the top open outlet. In this study, theexact geometry of the distributor was not considered. Instead,a uniform gas surface source was used, which made the modellingof individual holes unnecessary and therefore minimised compu-tational requirements. This approximation has been used pre-viously to successfully estimate the overall hydrodynamics inbubble columns (Buwa et al., 2006; Elena Diaz et al., 2009;Selma et al., 2010).
Multiphase flow was simulated using the grid in Fig. 1 (left).The grid was optimised by monitoring the velocity magnitude forwater/TiO2 at various locations within the computational space.The average cell size in the multiphase flow calculation grid was6 mm. Following multiphase flow simulations, the values of meanTiO2 concentration were stored and then interpolated onto therefined grid in Fig. 1 (right) to solve for the RTE. The grid size wasmade thinner close to the lamp surface since most of the radiationwas absorbed there. The optimum volume discretisation forradiation modelling was performed by monitoring the volumeaveraged LVREA until no marked difference was observed.
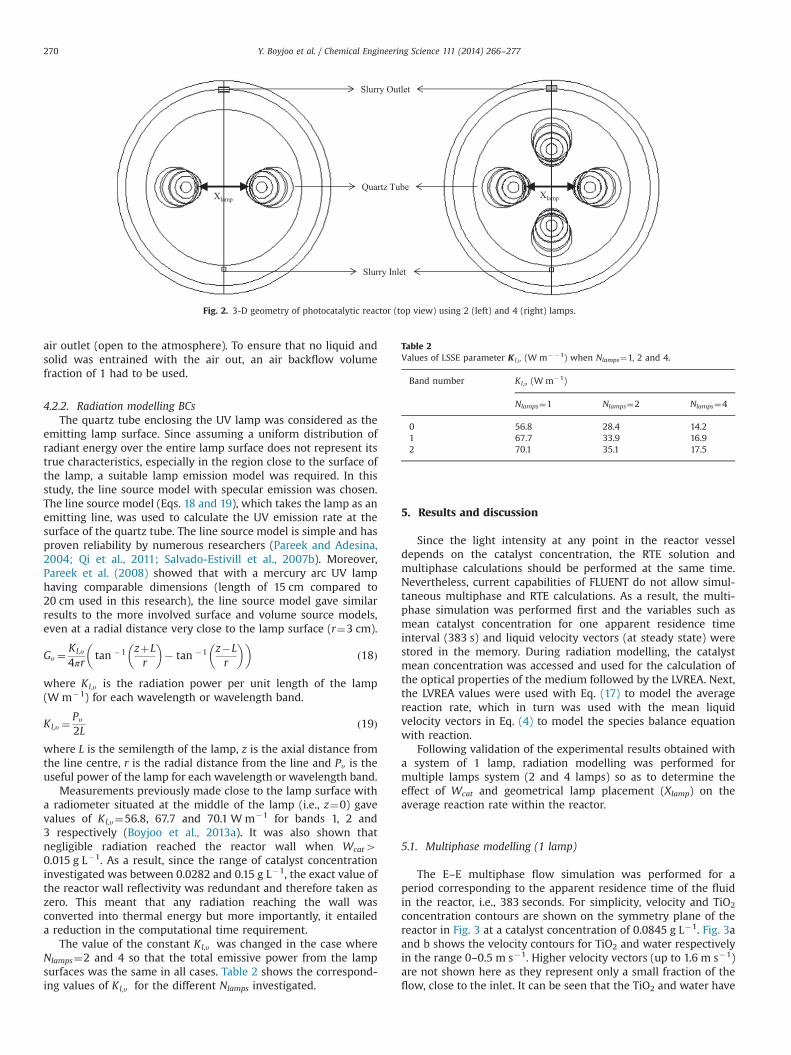
Fig. 2 shows the 3-dimentional constructed geometry (topview) for a reactor setup using 2 and 4 lamps respectively. Thedistance Xlamp that measures the lamp separation is shown as thethick double ended arrow. Radiation modelling was performed bymeshing the geometry with grid size and distribution similar tothe case where 1 lamp was used, as per Fig. 1.
4.2. Boundary conditions (BCs)
This section presents the BCs used to initiate the hydrody-namics and radiation modelling of the reactor.
4.2.1. Multiphase flow modelling BCsThe slurry inlet was assigned as a velocity inlet with given TiO2
volume fractions. The slurry outlet was a velocity outlet for whichthe velocity assigned had to satisfy the mass flow rate at the inlet(mass in¼mass out). Similarly, the air inlet was assigned a velocityinlet with air volume fraction¼1. A pressure outlet was used as the
Air Inlet
Slurry Inlet
Slurry Outlet
Air Outlet
Quartz Tube
Fig. 1. Optimum meshing for multiphase modelling (left) and radiation modelling (right); symmetry planes of reactor shown.
Y. Boyjoo et al. / Chemical Engineering Science 111 (2014) 266–277 269
air outlet (open to the atmosphere). To ensure that no liquid andsolid was entrained with the air out, an air backflow volumefraction of 1 had to be used.
4.2.2. Radiation modelling BCsThe quartz tube enclosing the UV lamp was considered as the
emitting lamp surface. Since assuming a uniform distribution ofradiant energy over the entire lamp surface does not represent itstrue characteristics, especially in the region close to the surface ofthe lamp, a suitable lamp emission model was required. In thisstudy, the line source model with specular emission was chosen.The line source model (Eqs. 18 and 19), which takes the lamp as anemitting line, was used to calculate the UV emission rate at thesurface of the quartz tube. The line source model is simple and hasproven reliability by numerous researchers (Pareek and Adesina,2004; Qi et al., 2011; Salvado-Estivill et al., 2007b). Moreover,Pareek et al. (2008) showed that with a mercury arc UV lamphaving comparable dimensions (length of 15 cm compared to20 cm used in this research), the line source model gave similarresults to the more involved surface and volume source models,even at a radial distance very close to the lamp surface (r¼3 cm).
Gυ ¼Kl;υ
4πrtan �1 zþL
r
� �� tan �1 z�L
r
� �� �ð18Þ
where Kl;υ is the radiation power per unit length of the lamp(W m�1) for each wavelength or wavelength band.
Kl;υ ¼Pυ
2Lð19Þ
where L is the semilength of the lamp, z is the axial distance fromthe line centre, r is the radial distance from the line and Pυ is theuseful power of the lamp for each wavelength or wavelength band.
Measurements previously made close to the lamp surface witha radiometer situated at the middle of the lamp (i.e., z¼0) gavevalues of Kl;υ¼56.8, 67.7 and 70.1 Wm�1 for bands 1, 2 and3 respectively (Boyjoo et al., 2013a). It was also shown thatnegligible radiation reached the reactor wall when Wcat40.015 g L�1. As a result, since the range of catalyst concentrationinvestigated was between 0.0282 and 0.15 g L�1, the exact value ofthe reactor wall reflectivity was redundant and therefore taken aszero. This meant that any radiation reaching the wall wasconverted into thermal energy but more importantly, it entaileda reduction in the computational time requirement.
The value of the constant Kl;υ was changed in the case whereNlamps¼2 and 4 so that the total emissive power from the lampsurfaces was the same in all cases. Table 2 shows the correspond-ing values of Kl;υ for the different Nlamps investigated.
5. Results and discussion
Since the light intensity at any point in the reactor vesseldepends on the catalyst concentration, the RTE solution andmultiphase calculations should be performed at the same time.Nevertheless, current capabilities of FLUENT do not allow simul-taneous multiphase and RTE calculations. As a result, the multi-phase simulation was performed first and the variables such asmean catalyst concentration for one apparent residence timeinterval (383 s) and liquid velocity vectors (at steady state) werestored in the memory. During radiation modelling, the catalystmean concentration was accessed and used for the calculation ofthe optical properties of the medium followed by the LVREA. Next,the LVREA values were used with Eq. (17) to model the averagereaction rate, which in turn was used with the mean liquidvelocity vectors in Eq. (4) to model the species balance equationwith reaction.
Following validation of the experimental results obtained witha system of 1 lamp, radiation modelling was performed formultiple lamps system (2 and 4 lamps) so as to determine theeffect of Wcat and geometrical lamp placement (Xlamp) on theaverage reaction rate within the reactor.
5.1. Multiphase modelling (1 lamp)
The E–E multiphase flow simulation was performed for aperiod corresponding to the apparent residence time of the fluidin the reactor, i.e., 383 seconds. For simplicity, velocity and TiO2
concentration contours are shown on the symmetry plane of thereactor in Fig. 3 at a catalyst concentration of 0.0845 g L�1. Fig. 3aand b shows the velocity contours for TiO2 and water respectivelyin the range 0–0.5 m s�1. Higher velocity vectors (up to 1.6 m s�1)are not shown here as they represent only a small fraction of theflow, close to the inlet. It can be seen that the TiO2 and water have
Quartz Tube
Slurry Outlet
Slurry Inlet
Xlamp Xlamp
Fig. 2. 3-D geometry of photocatalytic reactor (top view) using 2 (left) and 4 (right) lamps.
Table 2Values of LSSE parameter K l;υ (W m��1) when Nlamps¼1, 2 and 4.
Band number Kl;υ (W m�1)
Nlamps¼1 Nlamps¼2 Nlamps¼4
0 56.8 28.4 14.21 67.7 33.9 16.92 70.1 35.1 17.5
Y. Boyjoo et al. / Chemical Engineering Science 111 (2014) 266–277270
similar velocity contours. The small size of the TiO2 particlesmeans that they get dragged along with the water flow, which isconsistent with observations made by Pareek et al. (2003b) whoperformed similar simulations. Due to the high inlet flow rate,recirculation zones (shown in the plane normal to the symmetryplane, (Fig. 3c)) were formed on both sides of the lamp assembly,meaning that a large portion of the reaction medium remainedwithin the reactor. The backflow of water near the gas outlet inFig. 3b represents the reverse flow of water particles, occurringdue to the pressure outlet boundary condition specified inSection 4.2.1 which stated that the exiting gas was free of solidsand liquid. The TiO2 mean concentration contours in Fig. 3d showa uniform catalyst concentration distribution within the reactionmedium.
5.2. Radiation modelling (1 lamp)
Radiation modelling was performed for catalyst concentrationsin the range 0.0282–0.15 g L�1. Fig. 4a and b shows 3-D contours ofincident radiation when Wcat is 0.0845 and 0.0282 g L�1 respec-tively. It can be seen that the shielding effect caused by an increasedamount of catalyst in Fig. 4a reduces the amount of useful incidentradiation down to a narrow strip close to the lamp surface. As aresult, as Wcat increased, most of the reaction space received verylittle radiation. Fig. 5a shows the corresponding contours of LVREA(on the symmetry plane) when Wcat¼0.0282 g L�1. Since thecatalyst distribution within the reaction space was essentially uni-form (Fig. 3d), the contours of LVREA were qualitatively similar tothe incident radiation contours in Fig. 4b.
Fig. 3. Simulation results obtained with Wcat¼0.0845 g L�1, air flow rate¼1.8 L min�1 and liquid flow rate¼4.45 L min�1; (a) velocity vectors (scale on left, m s�1) of TiO2
particles at steady state, (b) velocity vectors (scale on left, m s�1) of water at steady state on x–z plane, (c) velocity vectors (scale on left, m s�1) of water at steady state ony–z plane, and (d) mean TiO2 concentration (scale on left, g L�1) contours for apparent residence time (383 s).
Y. Boyjoo et al. / Chemical Engineering Science 111 (2014) 266–277 271
The variation of the LVREA with Wcat is presented in Fig. 6. TheLVREA increases steeply with increase in the catalyst loading up toa Wcat of around 0.03 g L�1, after which the increase in LVREAbecomes marginal. The very high absorption capacity of the TiO2
catalyst means that a low catalyst concentration is required withinthe reactor and from Fig. 6, a Wcat of greater than 0.03 g L�1
appears to be unnecessary as the shielding effect occurring withincreased catalyst concentration gives rise to a reduced illumina-tion volume within the reactor. This can be visualised with Fig. 4aand b whereby at the higher Wcat of 0.0845 g L�1, Fig. 4a, theLVREA is very high but within a very small volume of the reactor.From Fig. 6, it appears that the experiments have been carried outat catalyst concentrations whereby light shielding becomes appar-ent. It is expected that at Wcato0.0282 g L�1, an optimum con-centration should exist at which a larger volume of the reactor isilluminated, leading to a higher reaction rate.
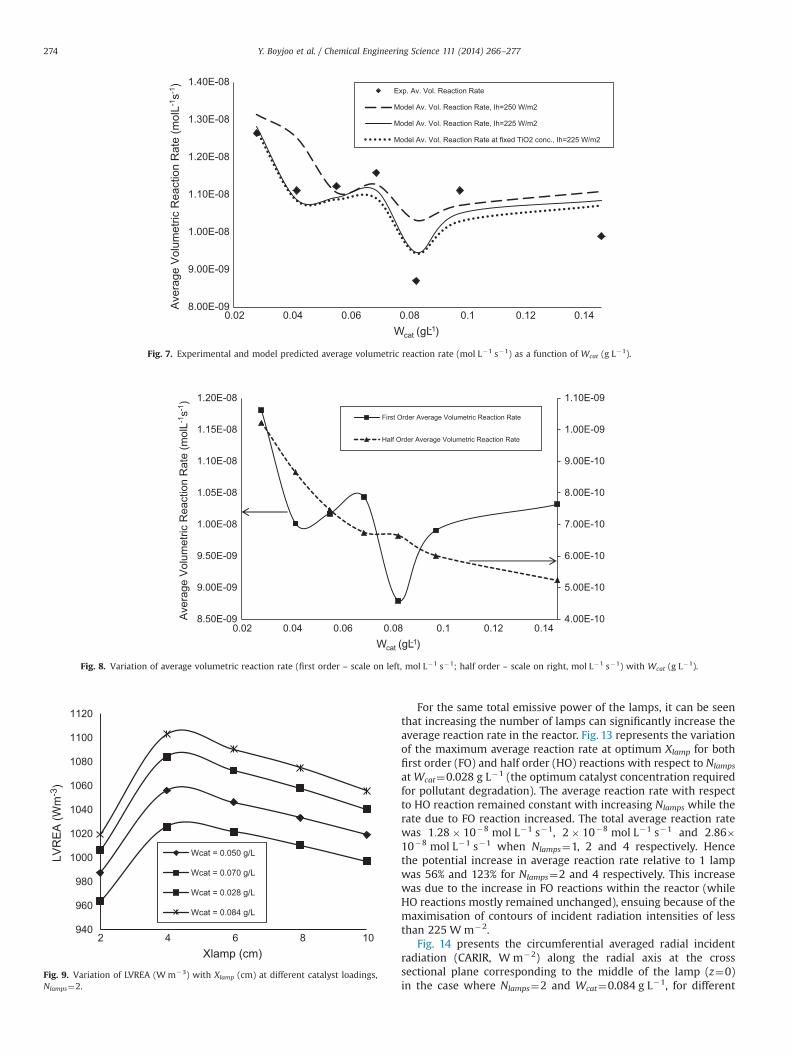
A trial and error procedure was performed so as to determine thevalue of Ih followed by k0h and kf' from Eq. (17). Fig. 7 shows theexperimental and model fitted values of the average volumetricreaction rate (mol L�1 s�1) for the range of Wcat investigated. Thebest fit was obtained when Ih ¼ 225 W m�2, k0h ¼ 1:7� 10�10
kmol W�0:5 m�1:5 s�1 and k0f ¼ 6:8� 10�11 kmol W�1 s�1. Forcomparison, the best fit when Ih ¼ 250 W m�2 is also presented(dashed line). Fig. 7 also presents the results obtained when using themodel with a constant catalyst concentration within the reactor(dotted line). This means that the assumption of a well distributedcatalyst concentration is pertinent and could potentially save onsimulation time. From Fig. 7, the proposed model provided a satisfac-tory fit to the experimental data within the range investigated. Themodel also shows that a radiant flux of Ih ¼ 250 W m�2 as aminimum limit to half order reaction cannot be generalised to alltypes of photocatalytic reactions but will instead depend on thepollutant species, reactor design, type of catalyst and type of UVsource used. A Pearson coefficient of 0.88 between experimental andpredicted data in Fig. 7 indicated that the proposed model satisfacto-rily described the experimental observations.
Fig. 5b and c shows the contours of half order and first orderreaction rate respectively when Wcat¼0.0282 g L�1. Despite thehigh value of radiation intensity and corresponding LVREA inthe region of half order reaction, the square root dependency of
the reaction rate in the region closest to the lamp surface meansthat the effective degradation rate of pollutants in that region islower than in the first order reaction region. This is due to the highrate of electron–hole recombination in regions of high radiationintensity, which drastically reduces the oxidation potential of thecatalyst particles.
Fig. 5d shows the contours of oxidised TOC concentration (interms of mass fraction) at Wcat¼0.0282 g L�1. The mass fractionrange between 8� 10�9 and 8:12� 10�9 is presented here forclarity. It can be seen that more carbon was oxidised on the righthand side of the reactor as compared to the left hand side, due tothe longer path taken by the water from the inlet to the outlet(Fig. 3b).
Fig. 8 shows the reaction rate due to first order and half orderreactions respectively. It can be seen that the overall reaction ratewas largely dependent upon first order reactions. The magnitudeof the first order volumetric reaction rate within the reactor wasbetween 12 and 20 times that of half order reaction, despite thehigher rate constant for half order reactions (k0h=k
0f ¼ 2:5). The
related average volumetric reaction rate for half order reaction waslower due to the square root dependency with respect to theLVREA that occurs due to the high rate of electron-hole recombi-nation in the regions of high light intensity, close to the lampsurface, i.e., when I4225 W m�2.
5.3. Multi-lamps simulations
Multiphase modelling was not performed in the case of multi-ple lamps since the rate was zero order with respect to pollutantconcentration and the assumption of a uniform catalyst concen-tration within the reactor was applicable. Hence only radiationmodelling was performed to determine its effect on the averagereaction rate.
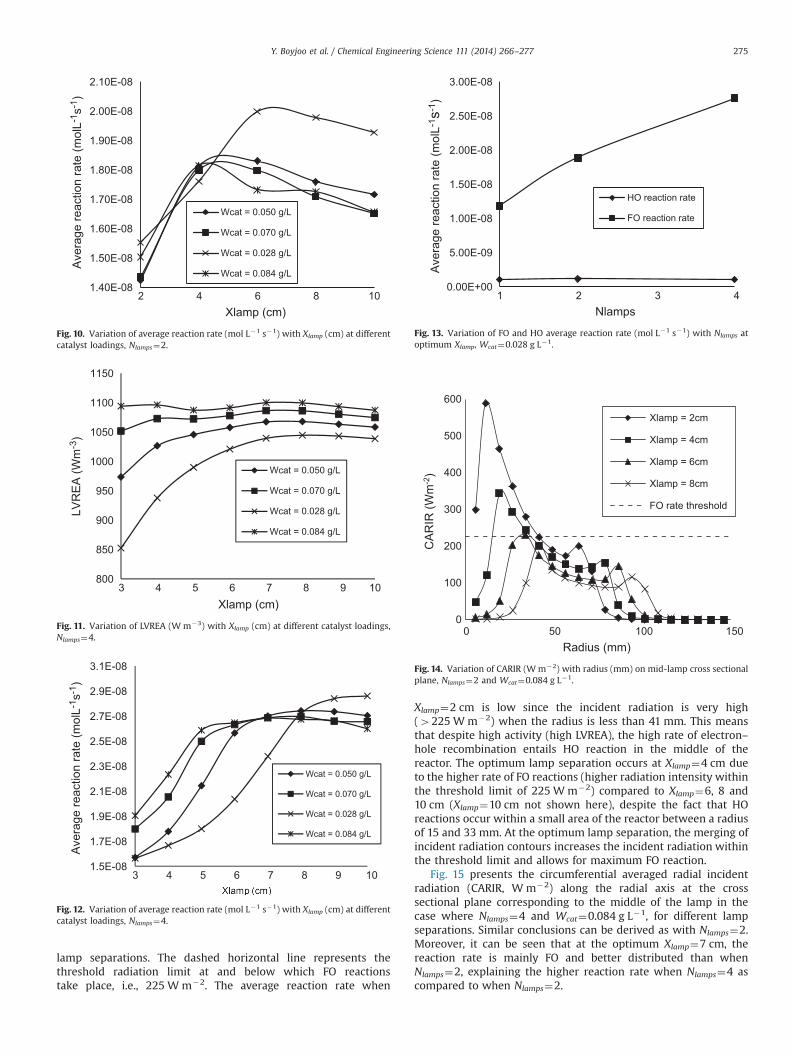
Fig. 9 shows the variation of the LVREA with Xlamp for the rangeof Wcat investigated. It shows that an optimum LVREA occurs atXlamp¼4 cm, irrespective of the catalyst concentration within thereactor, confirming the qualitative predictions obtained previouslywith 2D simulations (Boyjoo et al., 2013a).
The average reaction rate was calculated using Eq. (17) and ispresented in Fig. 10. Interestingly, the maximum average reaction
Fig. 4. (a) Incident radiation contours when Wcat¼0.0845 g L�1 (scale on left, W m�2), and (b) incident radiation contours when Wcat¼0.0282 g L�1 (scale on left, W m�2).
Y. Boyjoo et al. / Chemical Engineering Science 111 (2014) 266–277272
rate did not necessarily appear at Xlamp¼4 cm as per the occur-rence of the optimum LVREA. At the lower Wcat of 0.028 g L�1 and0.050 g L�1, the maximum reaction rate occurred at Xlamp¼6 cmwhile at higher Wcat of 0.070 g L�1 and 0.084 g L�1, the optimumlamp separation was 4 cm.
The LVREA and average reaction rate when Nlamps¼4 is shownin Figs. 11 and 12 respectively. Within the range of Xlamp and Wcat
investigated, LVREA was dependent upon Wcat. Maximum reactionrate occurred at Xlamp¼10 cm when Wcat¼0.028 g L�1,Xlamp¼8 cm when Wcat¼0.050 and 0.070 g L�1 and Xlamp¼7 cmwhen Wcat¼0.084 g L�1. The decrease in the average reaction ratepast the optimum Xlamp was sharper in a system of 2 lampscompared with that of 4 lamps due to improved illumination ofthe reactor volume when using 4 lamps.
Fig. 5. (a) LVREA contours when Wcat¼0.0282 g L�1 (scale on left, Wm�3), (b) half order reaction rate contours when Wcat¼0.0282 g L�1 (scale on left, mol L�1 s�1), (c) firstorder reaction rate contours when Wcat¼0.0282 g L�1 (scale on left, mol L�1 s�1) and (d) oxidised carbon concentration contours when Wcat¼0.0282 g L�1 (scale on left,mass fraction); all contours shown on symmetry plane. UV lamp placed within quartz tube as shown.
0
200
400
600
800
1000
1200
0 0.02 0.04 0.06 0.08 0.1 0.12 0.14
Vol
ume
Ave
rage
LV
RE
A (W
m-3
)
Wcat (g L-1)
Fig. 6. Variation of the LVREA (Wm�3) with Wcat (g L�1).
Y. Boyjoo et al. / Chemical Engineering Science 111 (2014) 266–277 273
For the same total emissive power of the lamps, it can be seenthat increasing the number of lamps can significantly increase theaverage reaction rate in the reactor. Fig. 13 represents the variationof the maximum average reaction rate at optimum Xlamp for bothfirst order (FO) and half order (HO) reactions with respect to Nlamps
atWcat¼0.028 g L�1 (the optimum catalyst concentration requiredfor pollutant degradation). The average reaction rate with respectto HO reaction remained constant with increasing Nlamps while therate due to FO reaction increased. The total average reaction ratewas 1:28� 10�8 mol L�1 s�1, 2� 10�8 mol L�1 s�1 and 2:86�10�8 mol L�1 s�1 when Nlamps¼1, 2 and 4 respectively. Hencethe potential increase in average reaction rate relative to 1 lampwas 56% and 123% for Nlamps¼2 and 4 respectively. This increasewas due to the increase in FO reactions within the reactor (whileHO reactions mostly remained unchanged), ensuing because of themaximisation of contours of incident radiation intensities of lessthan 225 W m�2.
Fig. 14 presents the circumferential averaged radial incidentradiation (CARIR, W m�2) along the radial axis at the crosssectional plane corresponding to the middle of the lamp (z¼0)in the case where Nlamps¼2 and Wcat¼0.084 g L�1, for different
8.00E-09
9.00E-09
1.00E-08
1.10E-08
1.20E-08
1.30E-08
1.40E-08
0.02 0.04 0.06 0.08 0.1 0.12 0.14
Ave
rage
Vol
umet
ric R
eact
ion
Rat
e (m
olL-1
s-1)
Wcat (gL-1)
Exp. Av. Vol. Reaction Rate
Model Av. Vol. Reaction Rate, Ih=250 W/m2
Model Av. Vol. Reaction Rate, Ih=225 W/m2
Model Av. Vol. Reaction Rate at fixed TiO2 conc., Ih=225 W/m2
Fig. 7. Experimental and model predicted average volumetric reaction rate (mol L�1 s�1) as a function of Wcat (g L�1).
4.00E-10
5.00E-10
6.00E-10
7.00E-10
8.00E-10
9.00E-10
1.00E-09
1.10E-09
8.50E-09
9.00E-09
9.50E-09
1.00E-08
1.05E-08
1.10E-08
1.15E-08
1.20E-08
0.02 0.04 0.06 0.08 0.1 0.12 0.14
Ave
rage
Vol
umet
ric R
eact
ion
Rat
e (m
olL-1
s-1)
Wcat (gL-1)
First Order Average Volumetric Reaction Rate
Half Order Average Volumetric Reaction Rate
Fig. 8. Variation of average volumetric reaction rate (first order – scale on left, mol L�1 s�1; half order – scale on right, mol L�1 s�1) with Wcat (g L�1).
940
960
980
1000
1020
1040
1060
1080
1100
1120
2 4 6 8 10
LVR
EA
(Wm
-3)
Xlamp (cm)
Wcat = 0.050 g/L
Wcat = 0.070 g/L
Wcat = 0.028 g/L
Wcat = 0.084 g/L
Fig. 9. Variation of LVREA (Wm�3) with Xlamp (cm) at different catalyst loadings,Nlamps¼2.
Y. Boyjoo et al. / Chemical Engineering Science 111 (2014) 266–277274
lamp separations. The dashed horizontal line represents thethreshold radiation limit at and below which FO reactionstake place, i.e., 225 W m�2. The average reaction rate when
Xlamp¼2 cm is low since the incident radiation is very high(4225 W m�2) when the radius is less than 41 mm. This meansthat despite high activity (high LVREA), the high rate of electron–hole recombination entails HO reaction in the middle of thereactor. The optimum lamp separation occurs at Xlamp¼4 cm dueto the higher rate of FO reactions (higher radiation intensity withinthe threshold limit of 225 W m�2) compared to Xlamp¼6, 8 and10 cm (Xlamp¼10 cm not shown here), despite the fact that HOreactions occur within a small area of the reactor between a radiusof 15 and 33 mm. At the optimum lamp separation, the merging ofincident radiation contours increases the incident radiation withinthe threshold limit and allows for maximum FO reaction.
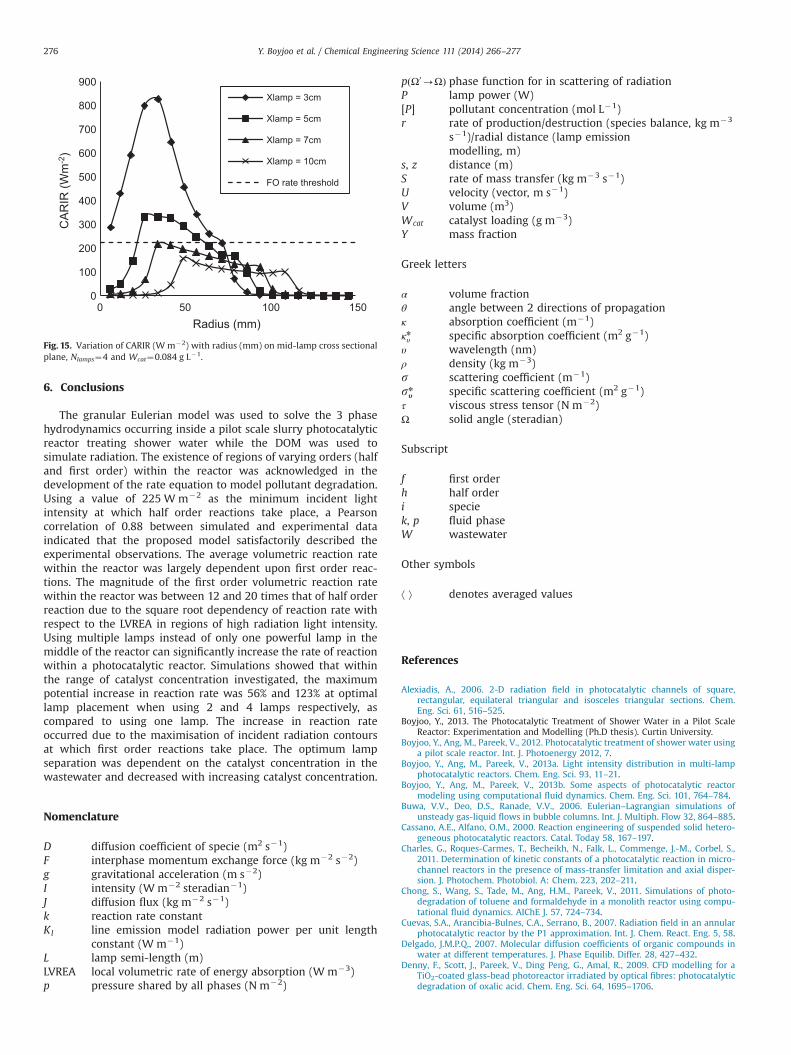
Fig. 15 presents the circumferential averaged radial incidentradiation (CARIR, W m�2) along the radial axis at the crosssectional plane corresponding to the middle of the lamp in thecase where Nlamps¼4 and Wcat¼0.084 g L�1, for different lampseparations. Similar conclusions can be derived as with Nlamps¼2.Moreover, it can be seen that at the optimum Xlamp¼7 cm, thereaction rate is mainly FO and better distributed than whenNlamps¼2, explaining the higher reaction rate when Nlamps¼4 ascompared to when Nlamps¼2.
1.40E-08
1.50E-08
1.60E-08
1.70E-08
1.80E-08
1.90E-08
2.00E-08
2.10E-08
2 4 6 8 10
Ave
rage
reac
tion
rate
(mol
L-1 s
-1)
Xlamp (cm)
Wcat = 0.050 g/L
Wcat = 0.070 g/L
Wcat = 0.028 g/L
Wcat = 0.084 g/L
Fig. 10. Variation of average reaction rate (mol L�1 s�1) with Xlamp (cm) at differentcatalyst loadings, Nlamps¼2.
800
850
900
950
1000
1050
1100
1150
3 4 5 6 7 8 9 10
LVR
EA
(Wm
-3)
Xlamp (cm)
Wcat = 0.050 g/L
Wcat = 0.070 g/L
Wcat = 0.028 g/L
Wcat = 0.084 g/L
Fig. 11. Variation of LVREA (W m�3) with Xlamp (cm) at different catalyst loadings,Nlamps¼4.
1.5E-08
1.7E-08
1.9E-08
2.1E-08
2.3E-08
2.5E-08
2.7E-08
2.9E-08
3.1E-08
3 4 5 6 7 8 9 10
Ave
rage
reac
tion
rate
(mol
L-1 s
-1)
Wcat = 0.050 g/L
Wcat = 0.070 g/L
Wcat = 0.028 g/L
Wcat = 0.084 g/L
Fig. 12. Variation of average reaction rate (mol L�1 s�1) with Xlamp (cm) at differentcatalyst loadings, Nlamps¼4.
0.00E+00
5.00E-09
1.00E-08
1.50E-08
2.00E-08
2.50E-08
3.00E-08
1 2 3 4
Ave
rage
reac
tion
rate
(mol
L-1 s
-1)
Nlamps
HO reaction rate
FO reaction rate
Fig. 13. Variation of FO and HO average reaction rate (mol L�1 s�1) with Nlamps atoptimum Xlamp, Wcat¼0.028 g L�1.
0
100
200
300
400
500
600
0 50 100 150
CA
RIR
(Wm
-2)
Radius (mm)
Xlamp = 2cm
Xlamp = 4cm
Xlamp = 6cm
Xlamp = 8cm
FO rate threshold
Fig. 14. Variation of CARIR (Wm�2) with radius (mm) on mid-lamp cross sectionalplane, Nlamps¼2 and Wcat¼0.084 g L�1.
Y. Boyjoo et al. / Chemical Engineering Science 111 (2014) 266–277 275
6. Conclusions
The granular Eulerian model was used to solve the 3 phasehydrodynamics occurring inside a pilot scale slurry photocatalyticreactor treating shower water while the DOM was used tosimulate radiation. The existence of regions of varying orders (halfand first order) within the reactor was acknowledged in thedevelopment of the rate equation to model pollutant degradation.Using a value of 225 W m�2 as the minimum incident lightintensity at which half order reactions take place, a Pearsoncorrelation of 0.88 between simulated and experimental dataindicated that the proposed model satisfactorily described theexperimental observations. The average volumetric reaction ratewithin the reactor was largely dependent upon first order reac-tions. The magnitude of the first order volumetric reaction ratewithin the reactor was between 12 and 20 times that of half orderreaction due to the square root dependency of reaction rate withrespect to the LVREA in regions of high radiation light intensity.Using multiple lamps instead of only one powerful lamp in themiddle of the reactor can significantly increase the rate of reactionwithin a photocatalytic reactor. Simulations showed that withinthe range of catalyst concentration investigated, the maximumpotential increase in reaction rate was 56% and 123% at optimallamp placement when using 2 and 4 lamps respectively, ascompared to using one lamp. The increase in reaction rateoccurred due to the maximisation of incident radiation contoursat which first order reactions take place. The optimum lampseparation was dependent on the catalyst concentration in thewastewater and decreased with increasing catalyst concentration.
Nomenclature
D diffusion coefficient of specie (m2 s�1)F interphase momentum exchange force (kg m�2 s�2)g gravitational acceleration (m s�2)I intensity (W m�2 steradian�1)J diffusion flux (kg m�2 s�1)k reaction rate constantKl line emission model radiation power per unit length
constant (W m�1)L lamp semi-length (m)LVREA local volumetric rate of energy absorption (W m�3)p pressure shared by all phases (N m�2)
pðΩ0-ΩÞ phase function for in scattering of radiationP lamp power (W)[P] pollutant concentration (mol L�1)r rate of production/destruction (species balance, kg m�3
s�1)/radial distance (lamp emissionmodelling, m)
s, z distance (m)S rate of mass transfer (kg m�3 s�1)U velocity (vector, m s�1)V volume (m3)Wcat catalyst loading (g m�3)Y mass fraction
Greek letters
α volume fractionθ angle between 2 directions of propagationκ absorption coefficient (m�1)κnυ specific absorption coefficient (m2 g�1)υ wavelength (nm)ρ density (kg m�3)s scattering coefficient (m�1)snυ specific scattering coefficient (m2 g�1)
f first orderh half orderi speciek, p fluid phaseW wastewater
Other symbols
⟨ ⟩ denotes averaged values
References
Alexiadis, A., 2006. 2-D radiation field in photocatalytic channels of square,rectangular, equilateral triangular and isosceles triangular sections. Chem.Eng. Sci. 61, 516–525.
Boyjoo, Y., 2013. The Photocatalytic Treatment of Shower Water in a Pilot ScaleReactor: Experimentation and Modelling (Ph.D thesis). Curtin University.
Boyjoo, Y., Ang, M., Pareek, V., 2012. Photocatalytic treatment of shower water usinga pilot scale reactor. Int. J. Photoenergy 2012, 7.
Boyjoo, Y., Ang, M., Pareek, V., 2013a. Light intensity distribution in multi-lampphotocatalytic reactors. Chem. Eng. Sci. 93, 11–21.
Boyjoo, Y., Ang, M., Pareek, V., 2013b. Some aspects of photocatalytic reactormodeling using computational fluid dynamics. Chem. Eng. Sci. 101, 764–784.
Charles, G., Roques-Carmes, T., Becheikh, N., Falk, L., Commenge, J.-M., Corbel, S.,2011. Determination of kinetic constants of a photocatalytic reaction in micro-channel reactors in the presence of mass-transfer limitation and axial disper-sion. J. Photochem. Photobiol. A: Chem. 223, 202–211.
Chong, S., Wang, S., Tade, M., Ang, H.M., Pareek, V., 2011. Simulations of photo-degradation of toluene and formaldehyde in a monolith reactor using compu-tational fluid dynamics. AIChE J. 57, 724–734.
Cuevas, S.A., Arancibia-Bulnes, C.A., Serrano, B., 2007. Radiation field in an annularphotocatalytic reactor by the P1 approximation. Int. J. Chem. React. Eng. 5, 58.
Delgado, J.M.P.Q., 2007. Molecular diffusion coefficients of organic compounds inwater at different temperatures. J. Phase Equilib. Differ. 28, 427–432.
Denny, F., Scott, J., Pareek, V., Ding Peng, G., Amal, R., 2009. CFD modelling for aTiO2-coated glass-bead photoreactor irradiated by optical fibres: photocatalyticdegradation of oxalic acid. Chem. Eng. Sci. 64, 1695–1706.
0
100
200
300
400
500
600
700
800
900
0 50 100 150
CA
RIR
(Wm
-2)
Radius (mm)
Xlamp = 3cm
Xlamp = 5cm
Xlamp = 7cm
Xlamp = 10cm
FO rate threshold
Fig. 15. Variation of CARIR (W m�2) with radius (mm) on mid-lamp cross sectionalplane, Nlamps¼4 and Wcat¼0.084 g L�1.
Y. Boyjoo et al. / Chemical Engineering Science 111 (2014) 266–277276
Denny, F., Scott, J., Pareek, V., Peng, G.-D., Amal, R., 2010. Computational fluiddynamics modelling and optimal configuring of a channelled optical fibrephotoreactor. Chem. Eng. Sci. 65, 5029–5040.
Dhotre, M.T., Niceno, B., Smith, B.L., 2008. Large eddy simulation of a bubble columnusing dynamic sub-grid scale model. Chem. Eng. J. 136, 337–348.
Duran, J.E., Mohseni, M., Taghipour, F., 2011. Computational fluid dynamicsmodeling of immobilised photocatalytic reactors for water treatment. AIChE J.
Elena Diaz, M., Montes, F.J., Galan, M.A., 2009. Influence of the lift force closures onthe numerical simulation of bubble plumes in a rectangular bubble column.Chem. Eng. Sci. 64, 930–944.
Evonik Industries, 2011. Inorganic materials for catalyst innovation. AEROSIL,AEROXIDE and SIPERNAT metal oxides and silica based materials industryinformation 2242.
Fiveland, W.A., 1984. Discrete-ordinates solutions of the radiative transportequation for rectangular enclosures. J. Heat Transf. 106, 699.
Fluent, M., 2005. Version 6.2. 16, Fluent Inc.Gondret, P., Lance, M., Petit, L., 2002. Bouncing motion of spherical particles in
Passalia, C., Alfano, O.M., Brandi, R.J., 2011. Modeling and experimental verificationof a corrugated plate photocatalytic reactor using computational fluiddynamics. Ind. Eng. Chem. Res. 50, 9077–9086.
Qi, N., Zhang, H., Jin, B., Zhang, K., 2011. CFD modelling of hydrodynamics anddegradation kinetics in an annular slurry photocatalytic reactor for wastewatertreatment. Chem. Eng. J.
Ranade, V.V., 2002. Computational Flow Modeling for Chemical Reactor Engineer-ing. Academic Press, San Diego, CA, USA.
Romero, R.L., Alfano, O.M., Cassano, A.E., 1997. Cylindrical photocatalytic reactors.Radiation absorption and scattering effects produced by suspended fineparticles in an annular space. Ind. Eng. Chem. Res. 36, 3094–3109.
Romero, R.L., Alfano, O.M., Cassano, A.E., 2003. Radiation field in an annular, slurry photo-catalytic reactor. 2. Model and experiments. Ind. Eng. Chem. Res. 42, 2479–2488.
Salvado-Estivill, I., Brucato, A., Puma, G.L., 2007a. Two-dimensional modeling of aflat-plate photocatalytic reactor for oxidation of indoor air pollutants. Ind. Eng.Chem. Res. 46, 7489–7496.
Salvado-Estivill, I., Hargreaves, D.M., Puma, G.L., 2007b. Evaluation of the intrinsicphotocatalytic oxidation kinetics of indoor air pollutants. Environ. Sci. Technol.41, 2028–2035.
Selma, B., Bannari, R., Proulx, P., 2010. A full integration of a dispersion and interfaceclosures in the standard k-[epsilon] model of turbulence. Chem. Eng. Sci. 65,5417–5428.
Tabib, M.V., Roy, S.A., Joshi, J.B., 2008. CFD simulation of bubble column—an analysisof interphase forces and turbulence models. Chem. Eng. J. 139, 589–614.
Trujillo, F.J., Safinski, T., Adesina, A.A., 2007. CFD analysis of the radiation distribu-tion in a new immobilised catalyst bubble column externally illuminatedphotoreactor. J. Sol. Energy Eng. 129, 27.
Trujillo, F.J., Safinski, T., Adesina, A.A., 2010. Oxidative photomineralization ofdichloroacetic acid in an externally-irradiated rectangular bubble tank reactor:computational fluid dynamics modeling and experimental verification studies.Ind. Eng. Chem. Res. 49, 6722–6734.
Turian, R.M., Ma, T.W., Hsu, F.L.G., Sung, D.J., 1997. Characterization, settling, andrheology of concentrated fine particulate mineral slurries. Powder Technol. 93,219–233.
Yu, B., Deng, B., Kim, C.N., 2008. Performance evaluation of P-1 model in aphotocatalytic reactor. Chem. Eng. Sci. 63, 5552–5558.
Y. Boyjoo et al. / Chemical Engineering Science 111 (2014) 266–277 277