CFD simulation of methane dispersion and innovative methane management in underground mining faces Jundika C. Kurnia a,b , Agus P. Sasmito a,b,c,⇑ , Arun S. Mujumdar a,d a Minerals Metals and Material Technology Centre, National University of Singapore, 9 Engineering Drive 1, Singapore 117576, Singapore b Mechanical Engineering, Masdar Institute of Science and Technology, Masdar City, Abu Dhabi, P.O. Box 54334, United Arab Emirates c Department of Mining, Metals and Materials Engineering, McGill University, 3610 University Street, Montreal, Quebec H3A 2B2, Canada d Department of Bioresource Engineering, McGill University, 111 Lakeshore Road Sainte-Anne-de-Bellevue, Québec H9X 3V9, Canada article info Article history: Received 3 February 2013 Received in revised form 2 October 2013 Accepted 27 November 2013 Available online xxxx Keywords: Discrete sources Flow divider Methane emission Underground mine Ventilation abstract This study addresses methane dispersion in a mine tunnel with discrete methane sources and various methods to handle it. Air flow behavior and methane dispersion in the tunnel are simulated utilizing the computational fluid dynamics (CFD) approach. Various possible conditions which may occur in a mine tunnel are investigated. Simulation results indicate that methane dispersion inside the mine tunnel is influenced significantly by the number as well as location of the sources and quantity of methane released from each source. Fur- thermore, application of an innovative flow divider which comprises volumetric flow con- trol and flow director, is investigated. It is found that by properly directing the ventilation flow to the location where methane is accumulating can reduce methane concentration below the safe level. In addition, it is noted that focusing the ventilation flow at a point is more effective as compared to dispersing it at several points. This study provides some new ideas for designing an ‘‘intelligent’’ underground mine ventilation system which can cost-effectively maintain methane concentration below the critical value. Ó 2014 Elsevier Inc. All rights reserved. 1. Introduction One of the main concerns during underground mine operations is the large amount of methane released in the face area in most coal mines as well as other mines. For decades, methane has been a major safety hazard in underground mining. Methane is the prime cause of mining disasters around the globe. Most explosions in underground coal mine occur when an explosive methane–air mixture develops in the mine tunnel. Numerous methane-related incidents and accidents with fatalities has attracted significant attention all over the world [1], highlighting the importance of an effective mine ventila- tion to ensure a safe and productive environment in an underground mine whilst keeping energy usage and operating cost at minimum. In effort to better understand flow behavior and methane dispersion in underground mines and develop better ventilation systems, numerous studies of underground mine ventilation have been conducted and reported in the literature. Nakayama et al. [2] developed a CFD model for methane gas distribution in mining face. They validated their model by using experimen- tal results by Ichinose et al. [3] who conducted an in situ measurement and CFD simulation to examine methane gas distribution in the mining face zone. An important finding of Nakayama’s study is that methane gas concentration was found higher at location transversely in and along the corner space where the face end meets the ceiling and the floor as well as the 0307-904X/$ - see front matter Ó 2014 Elsevier Inc. All rights reserved. http://dx.doi.org/10.1016/j.apm.2013.11.067 ⇑ Corresponding author at: Department of Mining, Metals and Materials Engineering, McGill University, 3610 University Street, Montreal, Quebec H3A 2B2, Canada. E-mail addresses: [email protected](J.C. Kurnia), [email protected](A.P. Sasmito). Applied Mathematical Modelling xxx (2014) xxx–xxx Contents lists available at ScienceDirect Applied Mathematical Modelling journal homepage: www.elsevier.com/locate/apm Please cite this article in press as: J.C. Kurnia et al., CFD simulation of methane dispersion and innovative methane management in under- ground mining faces, Appl. Math. Modell. (2014), http://dx.doi.org/10.1016/j.apm.2013.11.067
Transcript
Applied Mathematical Modelling xxx (2014) xxx–xxx
Contents lists available at ScienceDirect
Applied Mathematical Modelling
journal homepage: www.elsevier .com/locate /apm
CFD simulation of methane dispersion and innovative methanemanagement in underground mining faces
0307-904X/$ - see front matter � 2014 Elsevier Inc. All rights reserved.http://dx.doi.org/10.1016/j.apm.2013.11.067
⇑ Corresponding author at: Department of Mining, Metals and Materials Engineering, McGill University, 3610 University Street, Montreal, Que2B2, Canada.
Please cite this article in press as: J.C. Kurnia et al., CFD simulation of methane dispersion and innovative methane management inground mining faces, Appl. Math. Modell. (2014), http://dx.doi.org/10.1016/j.apm.2013.11.067
Jundika C. Kurnia a,b, Agus P. Sasmito a,b,c,⇑, Arun S. Mujumdar a,d
a Minerals Metals and Material Technology Centre, National University of Singapore, 9 Engineering Drive 1, Singapore 117576, Singaporeb Mechanical Engineering, Masdar Institute of Science and Technology, Masdar City, Abu Dhabi, P.O. Box 54334, United Arab Emiratesc Department of Mining, Metals and Materials Engineering, McGill University, 3610 University Street, Montreal, Quebec H3A 2B2, Canadad Department of Bioresource Engineering, McGill University, 111 Lakeshore Road Sainte-Anne-de-Bellevue, Québec H9X 3V9, Canada
a r t i c l e i n f o
Article history:Received 3 February 2013Received in revised form 2 October 2013Accepted 27 November 2013Available online xxxx
This study addresses methane dispersion in a mine tunnel with discrete methane sourcesand various methods to handle it. Air flow behavior and methane dispersion in the tunnelare simulated utilizing the computational fluid dynamics (CFD) approach. Various possibleconditions which may occur in a mine tunnel are investigated. Simulation results indicatethat methane dispersion inside the mine tunnel is influenced significantly by the numberas well as location of the sources and quantity of methane released from each source. Fur-thermore, application of an innovative flow divider which comprises volumetric flow con-trol and flow director, is investigated. It is found that by properly directing the ventilationflow to the location where methane is accumulating can reduce methane concentrationbelow the safe level. In addition, it is noted that focusing the ventilation flow at a pointis more effective as compared to dispersing it at several points. This study provides somenew ideas for designing an ‘‘intelligent’’ underground mine ventilation system which cancost-effectively maintain methane concentration below the critical value.
� 2014 Elsevier Inc. All rights reserved.
1. Introduction
One of the main concerns during underground mine operations is the large amount of methane released in the face areain most coal mines as well as other mines. For decades, methane has been a major safety hazard in underground mining.Methane is the prime cause of mining disasters around the globe. Most explosions in underground coal mine occur whenan explosive methane–air mixture develops in the mine tunnel. Numerous methane-related incidents and accidents withfatalities has attracted significant attention all over the world [1], highlighting the importance of an effective mine ventila-tion to ensure a safe and productive environment in an underground mine whilst keeping energy usage and operating cost atminimum.
In effort to better understand flow behavior and methane dispersion in underground mines and develop better ventilationsystems, numerous studies of underground mine ventilation have been conducted and reported in the literature. Nakayamaet al. [2] developed a CFD model for methane gas distribution in mining face. They validated their model by using experimen-tal results by Ichinose et al. [3] who conducted an in situ measurement and CFD simulation to examine methane gasdistribution in the mining face zone. An important finding of Nakayama’s study is that methane gas concentration was foundhigher at location transversely in and along the corner space where the face end meets the ceiling and the floor as well as the
area underneath the ventilation duct. Methane is commonly associated with fire hazard in underground mines. A study byVidmar and Petelin [4] evaluated the use of CFD model for risk assessment in a road tunnel including fire simulations. Theystudied four different ventilation conditions: natural, longitudinal, transverse and semi transverse. Despite their intensive dis-cussion on various scenarios of fire in a tunnel and safety evaluation, no definite conclusions have been drawn on their study.Torano et al. [1] studied methane dispersion in an underground coal mine with an auxiliary ventilation system. To validatetheir model, they collected flow and methane emission data from 5 points in 6 cross-sections of an underground coal mineowned by Hullera Vasco Leonesa S.A Company in the North of Spain. Consistent with the finding by Kissel and Wallhagen[5], Schultz et al. [6], Haney et al. [7] and Kissel [8], they observed that a forced ventilation system is more effective in deliv-ering fresh air to the mining face as compared to ventilation system which utilizes only an exhaust fan. Torano et al. [9]showed the usefulness of CFD simulation to predict wind erosion due to dust emission in mines. Wala and co-workers[10–12] conducted experimental and numerical studies on methane distribution in the vicinity of the mining face. Theirexperiments were conducted in the ventilation test gallery of NIOSH in Pittsburgh. They investigated various scenarios whichcould occur in an underground coal mine including the box cut and slab cut scenarios. They also examined the effect of scrub-ber operation on face ventilation and methane distribution. Their studies did not arrive at any definite conclusion on the effec-tiveness of the underground mine ventilation that they investigated. However, they did highlight the importance of CFDmodel and its potential in developing an effective mine ventilation system. Recently, Sasmito et al. [13] reported a numericalstudy examining various auxiliary ventilation systems which could provide sufficient oxygen for the miner and maintainmethane concentration at safe level whilst keeping low energy usage. They also examined various cutting scenarios in under-ground mine operation. They found that proper flow stopping design could enhance gas control throughout the mines whilstmaintaining low pressure drop. In addition, they concluded that combination of brattice and exhausting system offer the bestmethane handling. Continuing Sasmito’s work, Kurnia et al. [14], carried out studies to develop mine ventilation systemswhich could efficiently control dust, methane and other hazardous gases in underground mines. Guo et al. [15] analyzedthe rock structure and gas flow simulation in underground long wall mining. They showed that methane emission sourcesvary in the different mining direction due to fracture and rock formation. Silvester et al. [16] performed computational fluiddynamics modeling on the flow ventilation, underground crushing installation and dump truck for loading and unloadingmining materials. They showed that CFD can accurately predict the airflow behavior inside the underground mining.
Similar works in ventilation with different application areas have also been conducted by many researchers: Cox et al. [17]validated CFD model with non spreading experimental fires conducted in a forced ventilated fire test cell, closed six-bed hos-pital ward and a railway tunnel, at both forced and naturally ventilated scenarios. Papakonstantinou et al. [18] numericallysimulated CO2 dispersion caused by people breathing present in the closed space. They also investigated the dispersion ofCO in a typical garage in Athens urban area utilizing CFD simulation and validated against experimental measurements
Please cite this article in press as: J.C. Kurnia et al., CFD simulation of methane dispersion and innovative methane management in under-ground mining faces, Appl. Math. Modell. (2014), http://dx.doi.org/10.1016/j.apm.2013.11.067
[19]. Papanikolou et al. [20,21] investigated numerically ventilation requirements in a garage with possible hydrogen leakagefrom fuel cell vehicle, various ventilation scenarios including natural as well as forced convection were evaluated.
In general, methane enters a mine tunnel from localized sources at high concentration [8]. As the methane emerges fromthese discrete sources, it progressively mixes with ventilation air and is diluted. Whittles et al. [22] studied the influence ofgeotechnical factors on the gas flow experienced in a UK longwall coal mine panel for which strata variation leads to per-meability difference and results in different methane gas flow rate. Recently, Torano et al. [23] showed that possible suddenmethane emission from discrete sources called ‘‘blows’’ and ‘‘outburst’’ can lead to severe mining accident. Hence, an under-standing of methane dispersion from discrete sources is important to properly design methane handling strategy and aneffective ventilation system. This study addresses methane dispersion in a mine tunnel lined with discrete methane sourcesand effective strategies to handle it. Air flow behavior and methane dispersion in the tunnel are simulated by utilizing thewell established CFD approach. Both a steady and uniform methane emission and a fixed source velocity of methane casesare simulated. Several conditions which can occur in a mine tunnel are investigated. Hence, the objective of our study aretwofold: (i) to study flow behavior and methane dispersion in an underground mine with discrete methane sources and(ii) to evaluate the installation of a flow divider, which comprise volumetric flow rate control and flow director, to splitand re-direct the flow with the aim of improving methane management.
2. Mathematical formulation
A three-dimensional model is developed for a typical mine tunnel model which is the simplest and the most used inunderground coal mining studies (please refer to Fig. 1). This tunnel geometry is taken from the previous work by Parraet al. [24]. The mine tunnel is 36 m long, 3.6 m wide and 2.9 m high. A ventilation duct with a diameter of 0.6 m is hungat 1.9 m height from the floor and 0.6 m from the tunnel wall on the access road. Its setback distance from the mining faceis 6 m. Methane is released from 14 discrete methane sources located at the mining face and tunnel wall.
2.1. Governing conservation equations
Here we solve the mass, momentum, energy and species transport equations subject to appropriate boundary conditions.Methane is released from discrete sources in the mining face and dispersed by the ventilation airflow. The steady conserva-tion equations for mass, momentum, energy and species are:
Fig. 1.previou
Pleasegroun
r � qU ¼ 0; ð1Þ
r � qUU ¼ �rpþr � ðlþ ltÞ rUþ ðrUÞT� �
� 23½ðlþ ltÞðr � UÞIþ qkI�
� �þ qg; ð2Þ
r � ðqcpUTÞ ¼ r � keff þcplt
Prt
� �rT; ð3Þ
r � ðqxiUÞ ¼ r � qDi;eff þlt
Sct
� �rxi; ð4Þ
Schematic and computational domain (mesh) of an underground mine tunnel with discrete methane sources. Tunnel geometry is taken froms work by Parra et al. (2006).
cite this article in press as: J.C. Kurnia et al., CFD simulation of methane dispersion and innovative methane management in under-d mining faces, Appl. Math. Modell. (2014), http://dx.doi.org/10.1016/j.apm.2013.11.067
Fig. 2. Graphical comparison of flow behavior at setback distance of 4 m from mining face for various turbulence models: (a) Spalart–Allmaras;(b) K-Epsilon; (c) K-Omega; and (d) Reynolds Stress Model.
where q is the fluid density, U is the fluid velocity, p is the pressure, l is the dynamic viscosity of the fluid, I is the identity orsecond order unit tensor, g is gravity acceleration, cp is the specific heat of the fluid, keff is thermal conductivity of the fluid, Tis the temperature number, xi is the mass fraction of species i (O2, CH4 and N2), Di,eff is diffusivity of species i, lt is turbulenceviscosity and Sct is the turbulence Schmidt number.
2.2. Constitutive relations
A ternary species mixture comprising oxygen, water vapor and methane exists in the ventilation air in the tunnel. Theinteraction between the species is captured in the mixture density which follows incompressible ideal gas law given by [13]
Please cite this article in press as: J.C. Kurnia et al., CFD simulation of methane dispersion and innovative methane management in under-ground mining faces, Appl. Math. Modell. (2014), http://dx.doi.org/10.1016/j.apm.2013.11.067
where R is the universal gas constant and M refers to the mixture molar mass given by
M ¼ xCH4
MCH4
þxO2
MO2
þxH2O
MH2OþxN2
MN2
� ��1
: ð6Þ
Here, Mi is the molar mass of species i. Mass fraction of nitrogen is calculated as
xN2 ¼ 1� ðxO2 þxH2O þxCH4 Þ: ð7Þ
The fluid mixture viscosity is calculated using
l ¼X
i
xiliPjxiUi;j
with i and j ¼ CH4;O2;H2O and N2; ð8Þ
where xi,j are the mole fraction of species i and j and
Ui;j ¼1ffiffiffi8p 1þMi
Mj
� �12
1þ li
lj
!12 Mi
Mj
� �14
24
35
2
: ð9Þ
The mole fractions are related to the mass fractions by
xi ¼xiMMi
: ð10Þ
In-line with the concentration unit commonly used in applicable regulations, methane concentration in this paper is pre-sented in% v/v.
2.3. Turbulence model
The most commonly used turbulence model in engineering, standard k–e, is selected in this work. This model comprisestwo-equations which solve for turbulent kinetic energy, k, and its rate of dissipation, e, which is coupled to the turbulentviscosity [25,26].
2.4. Boundary conditions
The applicable boundary conditions are as follows:
(i) At walls: the standard wall function is used in all simulations;(ii) At the duct outlet: air velocity of 12 m s�1 is prescribed at the duct outlet [24];
(iii) At the mining face: methane is released at total flow rate of 0.05 m3 s�1 [1];(iv) At the outlet: stream-wise gradient of the temperature is set to zero and the pressure is set to standard atmospheric
pressure (1 bar).
3. Numerical methodology
The computational domains were created, meshed and labeled in Gambit 2.3.16. Three different amount of mesh ofapproximately 1 � 106, 2 � 106 and 4 � 106 were implemented and compared in terms of local pressure, velocities, and
cite this article in press as: J.C. Kurnia et al., CFD simulation of methane dispersion and innovative methane management in under-d mining faces, Appl. Math. Modell. (2014), http://dx.doi.org/10.1016/j.apm.2013.11.067
Please cite this article in press as: J.C. Kurnia et al., CFD simulation of methane dispersion and innovative methane management in under-ground mining faces, Appl. Math. Modell. (2014), http://dx.doi.org/10.1016/j.apm.2013.11.067
Please cite this article in press as: J.C. Kurnia et al., CFD simulation of methane dispersion and innovative methane management in under-ground mining faces, Appl. Math. Modell. (2014), http://dx.doi.org/10.1016/j.apm.2013.11.067
methane concentration to ensure a mesh independent solution. We found that the mesh amount of around 2 � 106 givesabout 1% deviation compared to the mesh size of 4 � 106; whereas, the results from the mesh size of 1 � 106 deviate upto 12% as compared to those from the finest one. Therefore, a mesh of around 2 million elements was found to be sufficientfor the numerical investigation purposes.
The governing equations together with the constitutive relations, turbulence model and boundary conditions were solvedusing the finite volume CFD code, Fluent 6.3.26. The equations were solved with the Semi-Implicit Pressure-Linked Equation(SIMPLE) algorithm, second order upwind discretization and Algebraic Multigrid Method (AGM). On average, each simula-tion required around 1000–3000 iterations to meet convergence tolerance of 10�6 for all variables. Each run needed around6–8 h on a workstation with six cores processor, requiring 6–8 GB RAM.
4. Results and discussion
In the following section, we validate our model with experimental data from literature. We then explore various condi-tions that can occur in the mine tunnel under both constant methane emission rate and constant methane velocity fromdiscrete sources and evaluates application of an innovative flow divider to control methane dispersion.
0.00
10.00
20.00
30.00
40.00
50.00
60.00
70.00
80.00
90.00
0.00 5.00 10.00 15.00 20.00 25.00 30.00 35.00
Met
hane
con
cent
rati
on (
% v
/v)
Distance from the mining face (m)
Case 1Case 2Case 3Case 4Case 5Case 6Case 7Case 8
0.00
0.20
0.40
0.60
0.80
1.00
1.20
1.40
1.60
1.80
0.00 5.00 10.00 15.00 20.00 25.00 30.00 35.00
Met
hane
con
cent
rati
on (
% v
/v)
Distance from the mining face (m)
Case 1
Case 2
Case 3
Case 4
Case 5
Case 6
Case 7
Case 8
(a)
(b)
Fig. 5. (a) Maximum and (b) average methane concentration (% v/v) along the tunnel with discrete sources at constant methane volume flow rate.
Please cite this article in press as: J.C. Kurnia et al., CFD simulation of methane dispersion and innovative methane management in under-ground mining faces, Appl. Math. Modell. (2014), http://dx.doi.org/10.1016/j.apm.2013.11.067
Here, computational results using four commonly used turbulence models, e.g., Spallart–Almaras, standard K-Epsilon,standard K-Omega and Reynolds Stress Model (RSM) are compared with flow measurements from Parra et al. [24]; thethree-dimensional model is illustrated in Fig. 1a. For the sake of brevity, we refer the reader for details of the experimentalset-up to [24].
Table 1 shows the numerical results of error of velocity value as compared to experimental data for various models. It isseen that the choice of turbulence model is important as the predicted flow behaviour can be different by various turbulencemodels [27]. The graphical comparison of various turbulence models at distance 4 m from the mining face is presented inFig. 2. It is noted that the K-Epsilon model gives reasonably good agreement as compared to experimental data with averagerelative error of �30%. As we are interested in the overall flow behavior for design purposes, the K-Epsilon model, which hasbeen widely used in engineering application, is found to be sufficient whilst maintaining low and fast computation. Wetherefore proceed further with this turbulence model. Nonetheless, it is noted that the experimental data available has anuncertainty level of about 10% and the available experimental data are limited for thorough validation. Note also that the
0.00
10.00
20.00
30.00
40.00
50.00
0.00 5.00 10.00 15.00 20.00 25.00 30.00 35.00
Met
hane
con
cent
rati
on (
% v
/v)
Distance from the mining face (m)
Case 1
Case 2
Case 3
Case 4
Case 5
Case 6
Case 7
Case 8
0.00
0.50
1.00
1.50
2.00
2.50
0.00 5.00 10.00 15.00 20.00 25.00 30.00 35.00
Met
hane
con
cent
rati
on (
% v
/v)
Distance from the mining face (m)
Case 1 Case 2 Case 3 Case 4
Case 5 Case 6 Case 7 Case 8
(a)
(b)
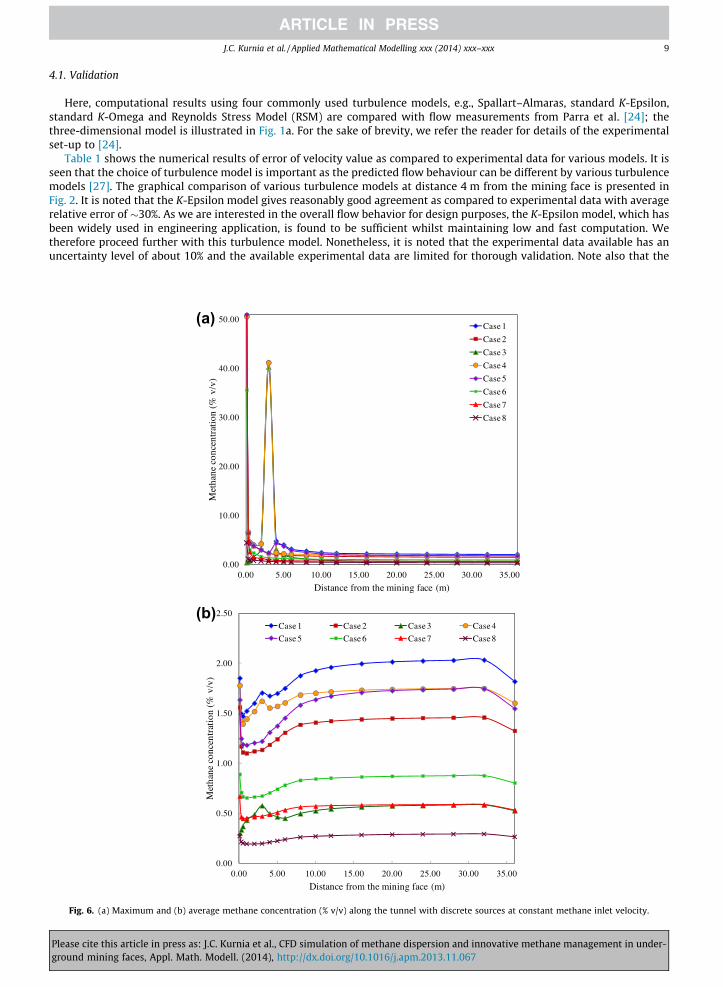
Fig. 6. (a) Maximum and (b) average methane concentration (% v/v) along the tunnel with discrete sources at constant methane inlet velocity.
Please cite this article in press as: J.C. Kurnia et al., CFD simulation of methane dispersion and innovative methane management in under-ground mining faces, Appl. Math. Modell. (2014), http://dx.doi.org/10.1016/j.apm.2013.11.067
second order upwind numerical scheme may not be sufficient for flows with considerable natural convection, thus, flow ori-ented numerical schemes [28] may be required, which will be focus in our future direction.
4.2. Constant rate methane emission
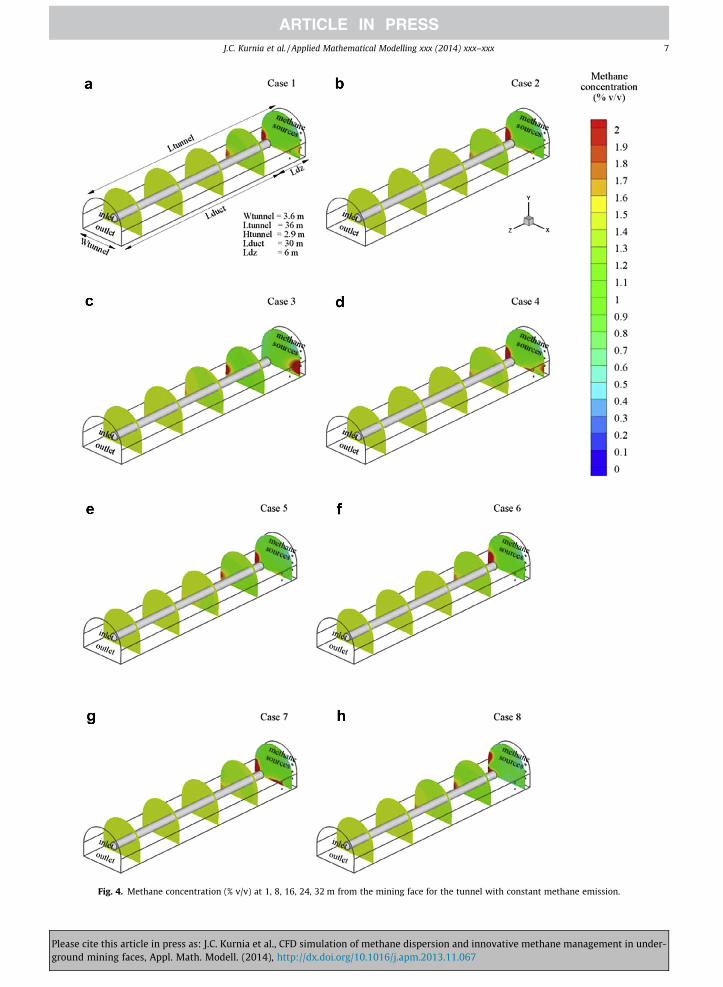
Eight possible methane release scenario from 14 methane sources (more combinations were explored but are not pre-sented in this paper) were investigated (please refer to Table 2). Velocity contours for 8 cases are presented in Fig. 3. Theinfluence of discrete methane sources on the ventilation airflow in the channel is seen to be negligible. This is expectedas the rate of methane released from the mining wall is about several order-of-magnitude lower than that of ventilationair; thus, the flow behavior inside the mining tunnel is not affected. On contrary, we observe that methane distributionin the tunnel is considerably affected by variation of methane sources, especially at the area near to the mining face. At loca-tions far from the mining face, however, methane concentration is relatively uniform and the influence of the location of themethane source is negligible; see Fig. 4 for details.
From Fig. 5, it is noted that variation of the discrete sources from which methane is released affects methane distributionin the front section of the mine tunnel (area near the mining face). Overall, methane concentration in the front section of thetunnel mine is higher when all sources release methane (note that the amount of methane released is held constant at0.05 m3 s�1). Closer inspection reveals that the maximum methane concentration throughout the tunnel (Fig. 5a) reachesfar above its explosive limit (5.5% v/v) which indicates that emission source significantly affect the methane distributionalong the mining tunnel. Case 3 yields the highest methane concentration at location near to the mining face with the max-imum concentration reaches up to 90% v/v, followed by case 4 and case 1 with maximum concentration of 35% v/v and 30%,respectively; whereas case 8 shows the lowest maximum methane concentration at less than 1% at location near the miningface, followed by case 5. This can be attributed to the fact that in case 3, methane are released from the side wall of the tunnel
Fig. 7. Schematic of an underground mine tunnel with rectangular ventilation duct with flow divider installed on the outlet. Tunnel geometry is taken fromprevious work by Parra et al. (2006).
Table 3Ventilation duct outlet direction (outlet velocity at all section is kept at 11.8 m s�1).
Case 1a Circular duct normal direction [0, 0, �1]Case 2 Normal [0,0,�1] Normal [0, 0,�1] Normal [0,0,�1] Normal [0,0,�1]Case 3 Normal [0,0,�1] Bottom [0,�1,�1] Bottom [0,�1,�1] Normal [0,0,�1]Case 4 Bottom [0,�1,�1] Normal [0, 0,�1] Normal [0,0,�1] Bottom [0,�1,�1]Case 5 Bottom right [1,�1,�1] Normal [0, 0, �1] Normal [0,0,�1] Bottom left [�1,�1,�1]Case 6 Normal [0,0,�1] Bottom right [1,�1,�1] Bottom left [�1,�1,�1] Normal [0,0,�1]Case 7 Bottom right [1,�1,�1] Bottom [0,�1,�1] Normal [0,0,�1] Bottom left [�1,�1,�1]Case 8 Bottom right [1,�1,�1] Top [0,0.5,�1] Top [0,0.5,�1] Bottom left [�1,�1,�1]Case 9 Bottom right [1,�1,�1] Top [0,0.5,�1] Normal [0,0,�1] Bottom left [�1,�1,�1]Case 10 Bottom [0,�1,�1] Top [0,0.5,�1] Top [0,0.5,�1] Bottom [0,�1,�1]Case 11 Top [0,0.5,�1] Bottom right [1,�1,�1] Bottom left [�1,�1,�1] Top [0,0.5,�1]Case 12 Top [0,0.5,�1] Bottom [0,�1,�1] Bottom [0,�1,�1] Top [0,0.5,�1]
a Case 1 is the base case with circular ventilation duct.
Please cite this article in press as: J.C. Kurnia et al., CFD simulation of methane dispersion and innovative methane management in under-ground mining faces, Appl. Math. Modell. (2014), http://dx.doi.org/10.1016/j.apm.2013.11.067
Please cite this article in press as: J.C. Kurnia et al., CFD simulation of methane dispersion and innovative methane management in under-ground mining faces, Appl. Math. Modell. (2014), http://dx.doi.org/10.1016/j.apm.2013.11.067
Fig. 9. Methane concentration (% v/v) at plane 1, 8, 16, 24, 32 m from the mining face for the tunnel with various ventilation outlet airflow direction.
Please cite this article in press as: J.C. Kurnia et al., CFD simulation of methane dispersion and innovative methane management in under-ground mining faces, Appl. Math. Modell. (2014), http://dx.doi.org/10.1016/j.apm.2013.11.067
which is not directly exposed to the air flow from the ventilation duct. Hence, methane are accumulated at this location. Atlocations far from the mining face (beyond 25 m from the face), methane concentration for all configurations is nearly thesame at around 1.3–1.4% v/v, indicating negligible effect of various discrete sources on methane concentration at this loca-tion. On average, however, methane concentration for all cases is below its explosive limit (see Fig. 5b).
4.3. Constant methane velocity
Proceeding further, we investigate methane distribution in the mining face when methane released from various sourcesat a constant velocity of 0.5 m s�1. Similar to the previous study for constant rate methane emission, eight possible methanerelease scenario from 14 methane sources are examined, as presented in Table 2. Similar to constant rate methane emission
0.000
5.000
10.000
15.000
20.000
25.000
30.000
35.000
40.000
45.000
50.000
0 5 10 15 20 25 30 35
Max
imum
met
hane
con
cent
rati
on (
% v
/v)
Distance from the mining face (m)
Case 1
Case 2
Case 3
Case 4
Case 5
Case 6
Case 7
Case 8
Case 9
Case 10
Case 11
Case 12
0.000
2.000
4.000
6.000
8.000
10.000
12.000
14.000
0 5 10 15 20 25 30 35
Ave
rage
met
hane
con
cent
rati
on (
% v
/v)
Distance from the mining face (m)
Case 1
Case 2
Case 3
Case 4
Case 5
Case 6
Case 7
Case 8
Case 9
Case 10
Case 11
Case 12
(a)
(b)
Fig. 10. (a) Maximum and (b) average methane concentration (% v/v) along the tunnel with various ventilation outlet airflow direction.
Please cite this article in press as: J.C. Kurnia et al., CFD simulation of methane dispersion and innovative methane management in under-ground mining faces, Appl. Math. Modell. (2014), http://dx.doi.org/10.1016/j.apm.2013.11.067
cases, the influence of discrete methane sources on the ventilation airflow in the channel is negligible due to the low velocityof methane released from the discrete sources (not shown here).
As expected, methane distribution in the mine tunnel is significantly affected by location of the sources from which meth-ane is emitted. Since all sources emitted methane at the same velocity, a larger number of sources results in higher methaneconcentration in the mine tunnel. Similar to the constant rate emission case, at locations far from the mining face, methaneconcentration is relatively uniform. Computed methane concentration along the tunnel are presented in Fig. 6, which displayexpected trend. High methane concentration up to more than 40% is observed in cases 3 and 4 which is considered as unsafefor mining operations to be carried out. The maximum methane concentration for other cases (cases 1, 2, and 5) is found tobe lower at around 5%. This concentration, however, is very close to the explosive limit which may lead to explosion. Cases 6,7 and 8 are found to have maximum methane concentration below the explosive limit which is safe for mining operation;see Fig. 6a for details.
Looking to the average methane concentration in Fig. 6b, all cases are found to have average methane concentration be-low explosive limit of 5.5% v/v. the highest average concentration is observed for case 1 with concentration around 2%, fol-lowed by case 4, 5, 2, 6, 7 and 8 with average concentration of 1.6%, 1.5%, 1.3%, 0.7%, 0.5%, 0.45%, and 0.25%, respectively.Although the average methane concentrations fall below the explosive limit, one should also consider maximum local dis-tribution of methane concentration to ensure safety operation. Clearly, the location and quantity of methane emission from
Table 4Ventilation duct outlet flow direction and distribution (total volumetric flow rate were kept constant at 3.4 m3 s�1).
Case 1 Normal [0, 0, �1] 11.8 ms�1 Normal [0, 0, �1] 11.8 ms�1 Normal [0, 0, �1] 11.8 ms�1 Normal [0, 0, �1] 11.8 ms�1
Case 2 Normal [0, 0, �1] 7.9 ms�1 Normal [0, 0, �1] 15.7 ms�1 Normal [0, 0, �1] 15.7 ms�1 Normal [0, 0, �1] 7.9 ms�1
Case 3 Normal [0, 0,�1] 11.8 ms�1 Normal [0, 0, �1] 7.9 ms�1 Normal [0, 0, �1] 7.9 ms�1 Normal [0, 0, �1] 11.8 ms�1
Case 4 Left [�0.1,0,�1] 11.8 ms�1 Normal [0, 0, �1] 11.8 ms�1 Normal [0, 0, �1] 11.8 ms�1 Right [0.1,0,�1] 11.8 ms�1
Fig. 11. Velocity contours (m s�1) at plane 0.6 m from the mine floor for the tunnel with non-uniform volumetric ventilation flow distribution.
Please cite this article in press as: J.C. Kurnia et al., CFD simulation of methane dispersion and innovative methane management in under-ground mining faces, Appl. Math. Modell. (2014), http://dx.doi.org/10.1016/j.apm.2013.11.067
mining wall is an important factor to consider when designing ventilation system. It can also be deduced that, in this par-ticular case, typical conventional design of ventilation systems in underground mines may not be able to sufficiently dilutemethane emission when local emission from one or more location emission points are suddenly changes and not uniformlydistributed.
4.4. Effect of ventilation flow director
In the previous section, we have shown that the conventional ventilation design cannot dilute the methane emission to asafe level when the methane emission and quantity is not uniform. Here we propose and evaluate application of a flow di-vider in the mine ventilation system. For this purpose, the circular ventilation duct is replaced with square duct installedwith flow divider to split and direct the flow and moved to the center position at the same height, as shown in Fig 7. First,the effect of airflow direction is evaluated. The base configuration using circular ventilation duct dispensing air at 11.8 m s�1
(which corresponds to volumetric flow rate of 3.4 m3 s�1) is set as the reference (case 1). Eleven possible scenarios (case 2 –case 12) were investigated on this preliminary study (please refer to Table 3 for detail flow direction). Note that other ductgeometries can also be considered with this basic concept.
From Figs. 8 and 9, application of flow divider to direct the flow leaving the ventilation duct significantly affects airflowpatterns in the mine tunnel which, in turn, affect methane dispersion in the tunnel. The influence of this variation is moreprominent in the front section of the mine tunnel where methane distribution is directly affected by the airflow from theventilation duct. Looking into the methane concentration at various cross-sections in the mine tunnel, as displayed inFig. 10, it can be seen that directing the flow can lower the methane concentration. Case 5 offers the best methane handlingoutcome as compared to the base-case, mirrored by the lower methane concentration along the mine tunnel. It should benoted, however, that inappropriate direction of ventilation air can worsen methane accumulation inside the tunnel as rep-resented by cases 8 and 10. It is seen that the methane concentration is higher (above explosive limit) as compared to thebase-case due to wrong flow direction which is not able to dilute methane from the specific source. Thus, it can be deducedthat directing the ventilation flow towards the methane source improves gas control inside the mining. However, carefulconsideration has to be taken into account as wrong direction of ventilation air leads to higher methane accumulation.
Fig. 12. Methane concentration (% v/v) at plane 1, 8, 16, 24, 32 m from the mining face for the tunnel with non-uniform volumetric ventilation flowdistribution.
Please cite this article in press as: J.C. Kurnia et al., CFD simulation of methane dispersion and innovative methane management in under-ground mining faces, Appl. Math. Modell. (2014), http://dx.doi.org/10.1016/j.apm.2013.11.067
For good design of gas control, it is suggested to implement sensor, actuator and control system to detect the methane sourceand therefore direct the ventilation flow accordingly. A model-based intelligent ventilation scheme is needed for optimalresults in practice.
4.5. Effect of ventilation flow distribution
We have evaluated the effectiveness of flow dividers to direct the flow where all sections are supplied the same amount ofventilation air at same velocity. We now evaluate the effectiveness of this flow divider when the airflow is not uniformlydistributed (volumetric flow rate were kept constant at 3.4 m3 s�1). Detail on flow distributions is summarized in Table 4.Similar to the previous section (effect of flow direction), application of flow divider to control flow distribution in each chan-nel shows significant influence on the airflow profiles in the mine tunnel which, in turn, change the methane dispersion inthe tunnel, as can be inferred from Figs. 11 and 12. The influence of this variation is more prominent on the front section ofthe mine tunnel where methane distribution is directly affected by the airflow from the ventilation duct. For case 2, a lowvelocity region is observed in the central zone of the tunnel. In addition, a relatively large hot spot area (area with high meth-ane concentration) is observed in the mining face for this case. A smaller hot spot zone is also observed in other cases.
Please cite this article in press as: J.C. Kurnia et al., CFD simulation of methane dispersion and innovative methane management in under-ground mining faces, Appl. Math. Modell. (2014), http://dx.doi.org/10.1016/j.apm.2013.11.067
Fig. 13 shows that all methods maintain methane level below the explosion limit (5% methane concentration) with cases2, 3 and 4 having comparable performance in reducing methane concentration on the mining face area. These results indi-cate that focusing the ventilation flow at a point is more effective as compared to dispersing it at several points. Additionalinvestigation is needed to obtain optimal ventilation duct design and operating parameters (e.g., number of separator, veloc-ity for each section, direction of ventilation airflow from the duct section)
5. Conclusion
A mathematical model for methane dispersion in an underground mine tunnel is presented and selected results are dis-cussed. Both constant rate methane emission and constant source velocity of methane are simulated. Simulation results indi-cate that methane dispersion inside mine tunnel is significantly influenced by the number and location of the methanesources and the amount of methane released from each sources. In addition this work highlights the importance of methanemonitoring to detect the locations of methane source for effective control of methane concentration which is essential indesigning an effective mine ventilation system.
Furthermore, application of flow dividers which comprises a volumetric flow control and a flow director, is investigated. Itis found that by properly directing the ventilation flow to the location where methane is accumulated can reduce methaneconcentration. In addition, it is noted that focusing the ventilation flow at a point is more effective as compared to dispersingit at several points. More studies are now being conducted to obtain an optimum design which could save energy usage andin turn carbon tax.
Having discussion on both sensor side (detecting methane release location) and actuator side (applying flow divider tosplit and direct the flow to specific location), this study provide some new ideas for designing an ‘‘intelligent’’ undergroundmine ventilation system which can cost-effectively maintain methane concentration below the critical value by directingsufficient ventilation air only to a certain location where methane concentration is high hence reducing the energy costand in turn operational cost and carbon footprint cost. A model-based mine ventilation system is expected to yield large div-idends to underground mine operators.
Acknowledgements
This work was financially supported by the Singapore Economic Development Board (EDB) through Minerals Metals andMaterials Technology Centre (M3TC) Research Grant R-261-501-013-414.
References
[1] J. Torano, S. Torno, M. Menendez, M. Gent, J. Velasco, Models of methane behaviour in auxiliary ventilation of underground coal mining, Int. J. Coal Geol.80 (2009) 35–43.
[2] S. Nakayama, B.Y. Kim, Y.D. Jo, Simulation of methane gas distribution by computational fluid dynamics, in: H. Xie, T.S. Golosinski (Eds.), Proceedings ofthe Mining Science and Technology Symposium, 29–31 August 1999, Beijing, China, Balkema Publisher (Taylor & Francis Group), Rotterdam, 1999, pp.259–262.
[3] M. Ichinose, S. Nakayama, K. Uchino, M. Inoue, In-situ measurement and simulastion by CFD of methane gas distribution at heading faces, J. Min. Mater.Process Inst. Jpn. 11 (1998) 17–23.
[4] P. Vidmar, S. Petelin, Application of CFD method for risk assessment in road tunnels, Eng. Appl. Comput. Fluid 1 (2007) 273–278.[5] F.N. Kissel, R.E. Wallhagen, Some new approaches to improve ventilation of the working face, in: Proceedings of the Fourth Symposium on Surface
Mining and Reclamation: NCA/BCR Coal Conference and Expo III., 19–21 October 1976, Kentucky, USA, National Coal Association, Kentucky, 1976, pp.325–338.
[6] M.J. Schultz, D.A .Beiter, T.R. Watkins, J.N. Baran, Face ventilation investigation, Technical report, Clark Elkorn Coal Company, Safety and HealthTechnology Center, Pittsburg, 1993.
[7] R.A. Haney, S.J. Giglioti, J.L. Banfield, Face ventilation system performance in low-height coal seam, in: H.L. Hartman (Ed.), Proceedings of the First U.S.Mine Ventilation Symposium, 29–31 March 1982, Alabama, USA, Society for Mining Metallurgy, Alabama, 1982.
[8] N. Kissel, Handbook for Methane Control in Mining, National Institute for Occupational Safety and Health, Pittsburgh, 2006.[9] J.A. Torano, R. Rodriguez, I. Diego, J.M. Rivas, A. Pelegry, Influence of the pile shape on wind erosion CFD emission simulation, Appl. Math. Model. 31
(2007) 2487–2502.[10] A.M. Wala, J. Jacob, J. Brown, G. Huang, New approaches to mine-face ventilation, Min. Eng. Littleton 55 (2003) 25–30.[11] A.M. Wala, S. Vytla, C.D. Taylor, G. Huang, Mine face ventilation: a comparison of CFD results against benchmark experiments for the CFD code
validation, Min. Eng. Littleton 59 (2007) 1–7.[12] A.M. Wala, S. Vytla, G. Huang, C.D. Taylor, Study on the effect of scrubber on the face ventilation, in: K.G. Wallace (Ed.), Proceeding of the 12th North
American Mine Ventilation Symposium, 9–11 June 2008, Reno, Nevada, USA, pp. 281–286.[13] A.P. Sasmito, E. Birgersson, H.C. Ly, A.S. Mujumdar, Some approaches to improve ventilation system in underground coal mines environment – A
computational fluid dynamic study, Tunn. Undergr. Sp. Tech. 34 (2013) 82–95.[14] J.C. Kurnia, A.S. Mujumdar, Technical reports on underground mine ventilation project, Mineral Metal and Material Technology Center, Singapore,
2012, Available at http://www.eng.nus.edu.sg/m3tc/pub_reports.html (last accessed 16 January 2013).[15] H. Guo, L. Yuan, B. Shen, Q. Qua, J. Xue, Mining-induced strata stress changes, fractures and gas flow dynamics in multi-seam longwall mining, Int. J.
Rock Mech. Min. Sci. 50 (2012) 94–101.[16] S.A. Silvester, I.S. Lowndes, S.W. Kingman, A. Arroussi, Improved dust capture methods for crushing plant, Appl. Math. Model. 31 (2007) 311–331.[17] G. Cox, S. Kumar, N.C. Markatos, Some field model validation studies, in: Proc. of the first International Symposium on Fire Safety Sci., 1986, pp. 159–
171.[18] K.A. Papakonstantinou, C.T. Kiranoudis, N.C. Markatos, Numerical simulation of CO2 dispersion in an auditorium, Energy Build. 34 (2002) 245–250.[19] K.A. Papakonstantinou, A. Chaloulakou, A. Duci, N. Vlachakis, N.C. Markatos, Air quality in underground garage: computational and experimental
investigation of ventilation effectiveness, Energy Build. 35 (2003) 933–940.
Please cite this article in press as: J.C. Kurnia et al., CFD simulation of methane dispersion and innovative methane management in under-ground mining faces, Appl. Math. Modell. (2014), http://dx.doi.org/10.1016/j.apm.2013.11.067
[20] E.A. Papanikolou, A.G. Venetsanos, M. Heitsch, D. Baraldi, A. Huser, J. Pujol, J. Garcia, N.C. Markatos, HySafe SBEP-V20: numerical studies of releaseexperiments inside a naturally ventilated residential garage, Int. J. Hydrogen Energy 35 (2010) 4747–4757.
[21] E. Papanikolou, A.G. Venetsanos, G.M. Cherciara, M. Carcassi, N. Markatos, CFD simulations on small hydrogen releases inside a ventilated facility andassessment of ventilation efficiency, Int. J. Hydrogen Energy 36 (2011) 2597–2605.
[22] D.N. Whittles, I.S. Lowndes, S.W. Kingman, C. Yates, S. Jobling, Influence of geotechnical factors on gas flow experienced in a UK longwall coal minepanel, Int. J. Rock Mech. Min. Sci. 43 (2006) 369–387.
[23] J. Torano, S. Torno, E. Alvarez, P. Riesgo, Application of outburst risk indices in the underground coal mines by sublevel caving, Int. J. Rock Mech. Min.Sci. 50 (2012) 94–101.
[24] M.T. Parra, J.M. Villafruela, F. Castro, C. Mendez, Numerical and experimental analysis of different ventilation systems in deep mines, Build Environ. 41(2006) 87–93.
[25] B.E. Launder, D.B. Spalding, The numerical computation of turbulent flows, Comput. Methods Appl. Mech. 3 (1974) 269–289.[26] D.C. Wilcox, Turbulence Modeling for CFD, DCW Industries, California, 2006.[27] N.C. Markatos, Computer simulation techniques for turbulent flows, Encyclopedia Fluid Mech. 6 (1987) 1221–1275.[28] M.K. Patel, M. Cross, N.C. Markatos, An assessment of flow oriented schemes for reducing ‘false diffusion’, Int. J. Numer. Methods Eng. 26 (1988) 2279–
2304.
Please cite this article in press as: J.C. Kurnia et al., CFD simulation of methane dispersion and innovative methane management in under-ground mining faces, Appl. Math. Modell. (2014), http://dx.doi.org/10.1016/j.apm.2013.11.067