b Universidad Industrial de Santander, Bucaramanga, Colombia. [email protected]
Received: June 12th, 2017. Received in revised form: December 4th, 2017. Accepted: December 18th, 2017. Abstract The simulation of an industrial boiler in CFD (Computational Fluid Dynamics) is usually done by stages due to the extensive size and the different physical phenomena that occur in different locations of the equipment. In this work, the simulation of an industrial grate boiler is done in three stages, one for the primary air circuit, another one for the secondary air circuit and the final one is the furnace. The combustion of sugarcane bagasse is a complex phenomenon that involves moisture vaporization, devolatilization and char combustion, in order to account for those phenomena, bagasse particles were modeled in a Eulerian-Lagrangian approach. The simulations were performed in commercial software ANSYS FLUENT and the devolatilization model were programmed in C language as a User Defined Function (UDF). When the results of the simulations were compared with experimental data, a satisfactory agreement was observed. Simulations were performed with primary and secondary air inlets modifications in order to optimize the boiler performance, the results of those simulations showed significant improvement in the combustion parameters. Keywords: mathematical modeling; numerical simulation; biomass combustion; discrete phase.
Simulación en CFD de la combustión de bagazo de caña en una caldera industrial con parrilla
Resumen La simulación de una caldera industrial en CFD se realiza, usualmente, por etapas debido al gran tamaño y a los diferentes fenómenos físicos que ocurren dentro del equipo. En este trabajo, la simulación de una caldera industrial de parrilla se realiza en tres etapas, la primera es el circuito de aire primario, la segunda es el circuito de aire secundario y la tercera corresponde a la caldera. La combustión de bagazo de caña es un fenómeno complejo que involucra vaporización de la humedad, devolatilización y combustión del carbón, de forma que para evaluar esos fenómenos las partículas de bagazo fueron modeladas en un marco Euleriano-Lagrangiano. Las simulaciones fueron desarrolladas en el software comercial ANSYS FLUENT y la tasa de devolatilización fue programada en lenguaje C como una función definida por el usuario. Cuando los resultados de las simulaciones se compararon con datos experimentales, se observó una concordancia satisfactoria. Se realizaron simulaciones con modificaciones en las entradas de aire primario y secundario buscando optimizar el funcionamiento de la caldera y los resultados de esas simulaciones presentaron una mejoría significativa en los parámetros de combustión. Palabras clave: modelamiento matemático; simulación numérica; combustión de biomasa; fase discreta.
1. Introduction The use of sugarcane bagasse as a fuel for steam
generation is widely used throughout South America because, besides the production of sugar, the sugarcane juices are converted into ethanol. In countries as Colombia, ethanol
How to cite: Diaz-Mateus, F.A., Alvarez-Castro, H.C. and Chaves-Guerrero, A., CFD simulation of sugarcane bagasse combustion in an industrial grate boiler. DYNA, 85(204), pp. 169-176, March, 2018.
is mixed with regular gasoline up to 20%, while in Brazil, ethanol is sold as fuel and most vehicles can run indifferently on ethanol or gasoline. Brazil is by far the largest producer of sugarcane in the world, producing more than 730 million tons in 2014 [1] and the second largest producer of ethanol in the world [2].
Diaz-Mateus et al / Revista DYNA, 85(204), pp. 169-176, March, 2018.
170
Steam generation throughout the world has traditionally ran on pulverized coal, and the modeling of this combustion can be considered a mature technology. It is common in countries as Colombia that industrial boilers shift from pulverized coal to pulverized bagasse due to the increase availability and lower price of this biofuel. However, since most of the work on combustion modeling in boilers has been done on coal, it is still difficult to obtain in the literature certain parameters necessary to properly model the bagasse combustion.
The major difference between coal and bagasse is probably the water content. Since the moisture content in coal is usually below 10%, in the bagasse can be up to 56% and, in most cases, is not economically beneficial to dry it out, and it is used as received. This causes a significant load of water in the flue gases and a reduction of the adiabatic flame temperature [3]. Kaewpradap, Yoksenakul & Jugjai [3] assure that a bagasse with moisture content over 56% leads to unstable combustion. According to Shrivastav & Hussain [4] each 1% reduction in the bagasse moisture increases 0.5% the efficiency of the boiler.
Another major difference between coal and bagasse is the volatile content, biomass always has greater volatiles content, even when compared to low-rank coals [5]. The ratio of volatile matter to fixed carbon is typically greater than 4.0 for biomass and lower than 1.0 for coal [6]. This makes devolatilization models and volatile composition of significant importance in the modeling of bagasse combustion. Devolatilization is usually modeled as a first order single rate Arrhenius equation such as presented by Ferreira et al. [7], Zahirovic, Scharler & Obernberger [8], Jin et al. [9], Aboyade et al. [10] and Sanchez & Mendieta [11]. However, according to Smith [12] this single rate models cannot accurately represent the devolatilization rate. Centeno-González et al. [5] presented a two-stage devolatilization model and it is used in this work. Molecular weight of volatiles has been suggested in the range of 20 g/mol [13] up to 30 g/mol [5].
Bagasse particles are in most cases, modeled in a Eulerian-Lagrangian approach, also known as discrete phase [5,6,8,9,12,13]. In this model, the particles are tracked in a continuous phase to which exchange mass and heat. It is recommended that the volume fraction of particles to be below 10% [14], however in grate boilers, the bagasse particles piled up above the grate and unfulfilled that condition. In this particular case, the particles do not behave as a discrete phase and a full Eulerian approach would be more appropriate (also known as granular phase). However, the use of granular phase represents a huge increase in computational effort since governing equations have to be solve for both phases (continuous and granular), while in discrete phase, governing equations are solved only for the continuous phase and particles are tracked every certain number of iterations. The size of an industrial boiler makes almost prohibitive the use of a granular phase for the fuel particles due to the computational effort, one of the few simulations presented in the literature in this manner is from Ferreira et al. [7]. Nevertheless, the issue of the pilling of particles above the grate can be managed, as it will be presented further in this work.
The simulation of an industrial boiler by CFD commercial software ANSYS FLUENT is presented in this work. Due to the size of the boiler, it was divided into three models, the primary air circuit, the secondary air circuit and the furnace. The primary and secondary air are connected to the furnace by profiles of velocity, temperature, turbulent kinetic energy and dissipation rate. A baseline simulation was performed trying to reproduce the main operational parameters, once the results of the simulation reproduced the experimental data with a satisfactory agreement; an optimization of the boiler performance was accomplished. Primary and secondary air inlets were modified and the results of the optimization simulation showed a significant improvement of the operational parameters when compared to the baseline simulation.
2. Flow geometries
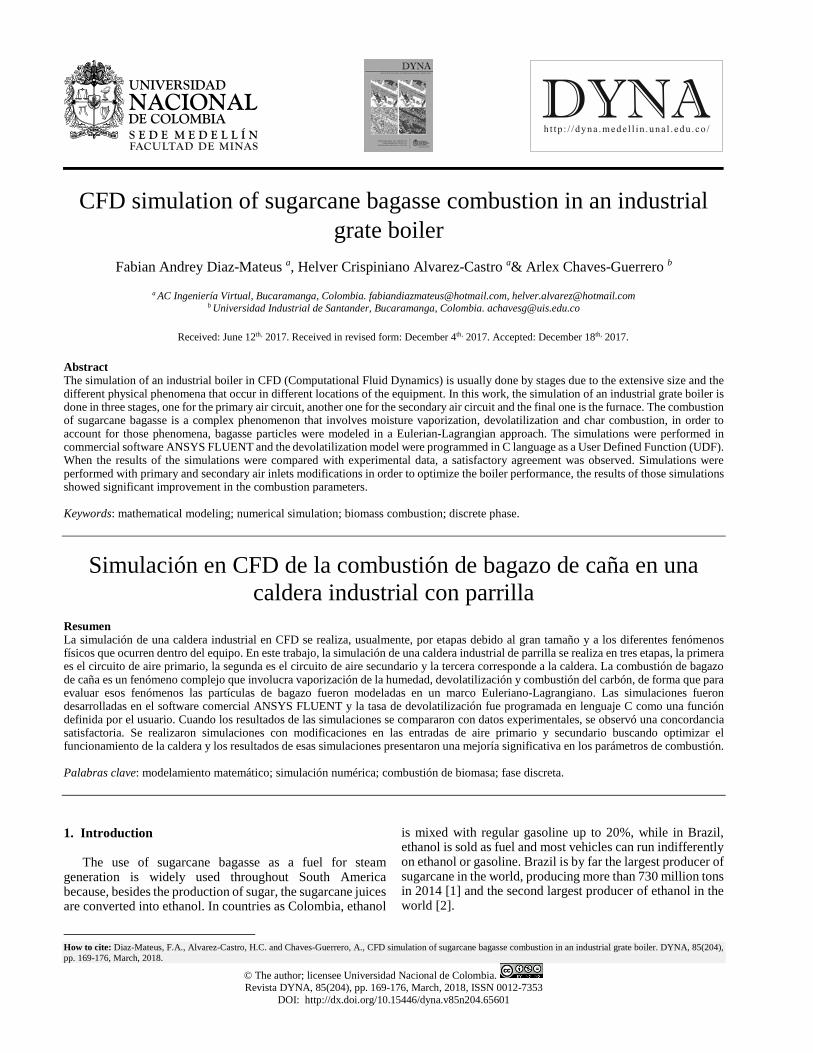
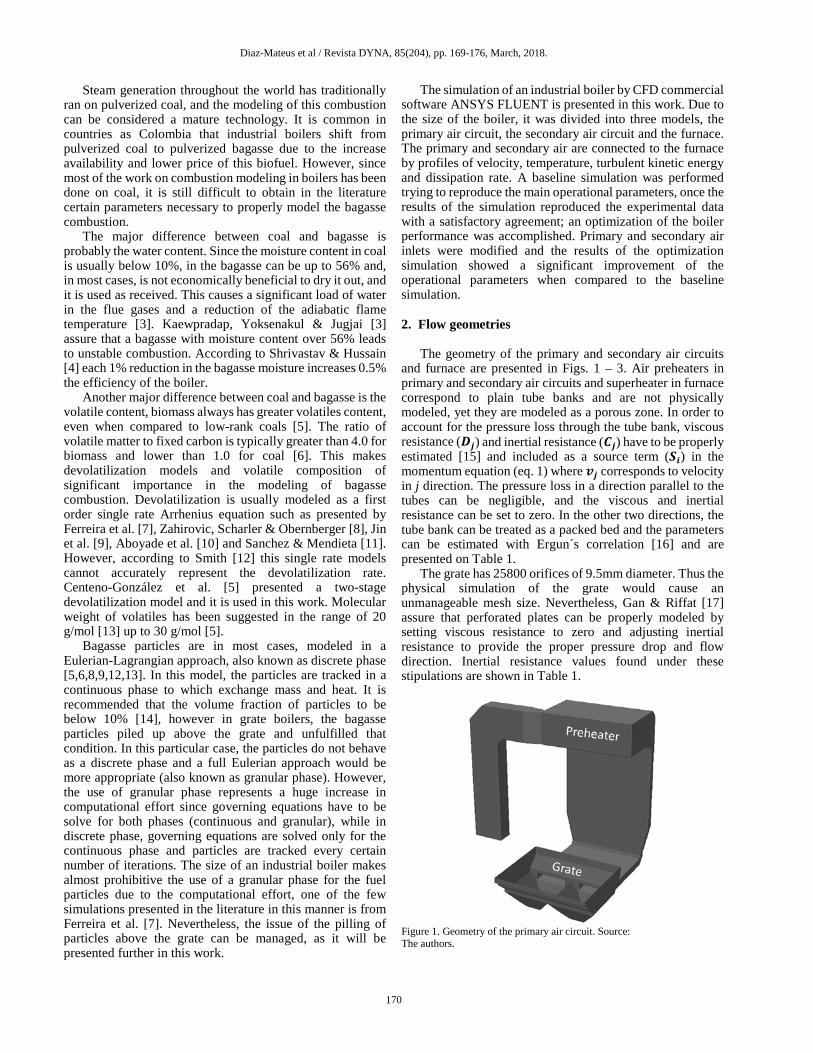
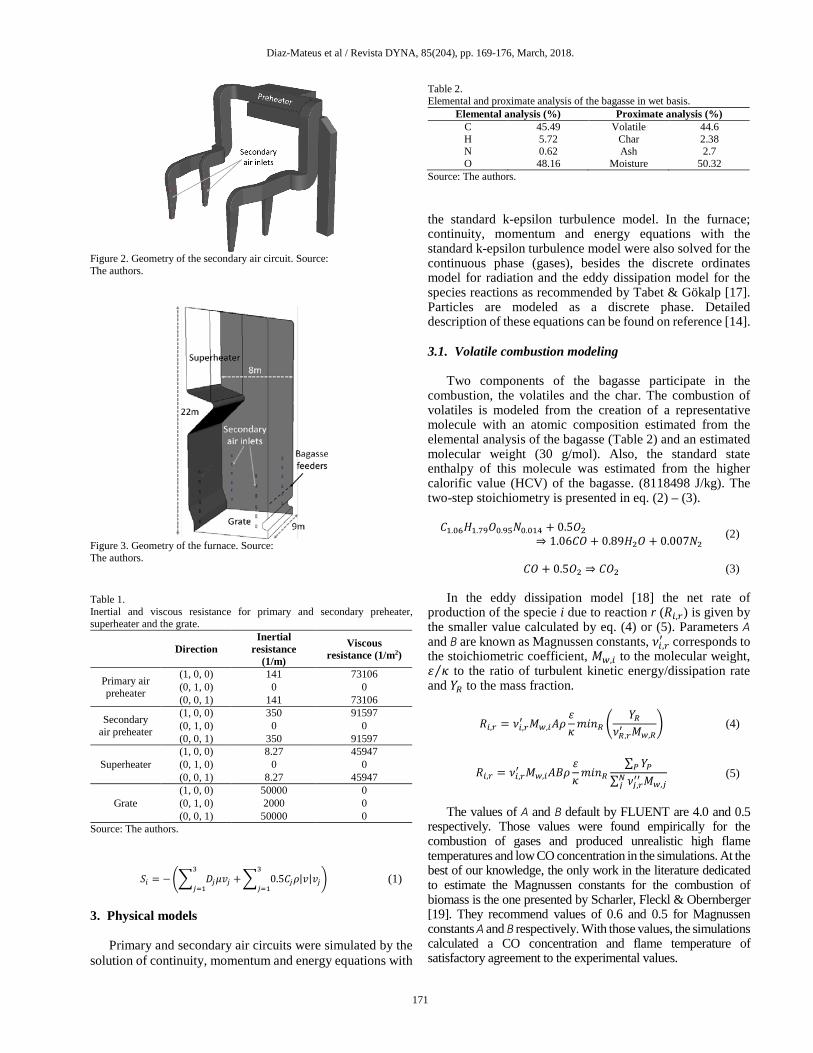
The geometry of the primary and secondary air circuits
and furnace are presented in Figs. 1 – 3. Air preheaters in primary and secondary air circuits and superheater in furnace correspond to plain tube banks and are not physically modeled, yet they are modeled as a porous zone. In order to account for the pressure loss through the tube bank, viscous resistance (𝑫𝑫𝒋𝒋) and inertial resistance (𝑪𝑪𝒋𝒋) have to be properly estimated [15] and included as a source term (𝑺𝑺𝒊𝒊) in the momentum equation (eq. 1) where 𝒗𝒗𝒋𝒋 corresponds to velocity in j direction. The pressure loss in a direction parallel to the tubes can be negligible, and the viscous and inertial resistance can be set to zero. In the other two directions, the tube bank can be treated as a packed bed and the parameters can be estimated with Ergun´s correlation [16] and are presented on Table 1.
The grate has 25800 orifices of 9.5mm diameter. Thus the physical simulation of the grate would cause an unmanageable mesh size. Nevertheless, Gan & Riffat [17] assure that perforated plates can be properly modeled by setting viscous resistance to zero and adjusting inertial resistance to provide the proper pressure drop and flow direction. Inertial resistance values found under these stipulations are shown in Table 1.
Figure 1. Geometry of the primary air circuit. Source: The authors.
Diaz-Mateus et al / Revista DYNA, 85(204), pp. 169-176, March, 2018.
171
Figure 2. Geometry of the secondary air circuit. Source: The authors.
Figure 3. Geometry of the furnace. Source: The authors.
Table 1. Inertial and viscous resistance for primary and secondary preheater, superheater and the grate.
Primary and secondary air circuits were simulated by the
solution of continuity, momentum and energy equations with
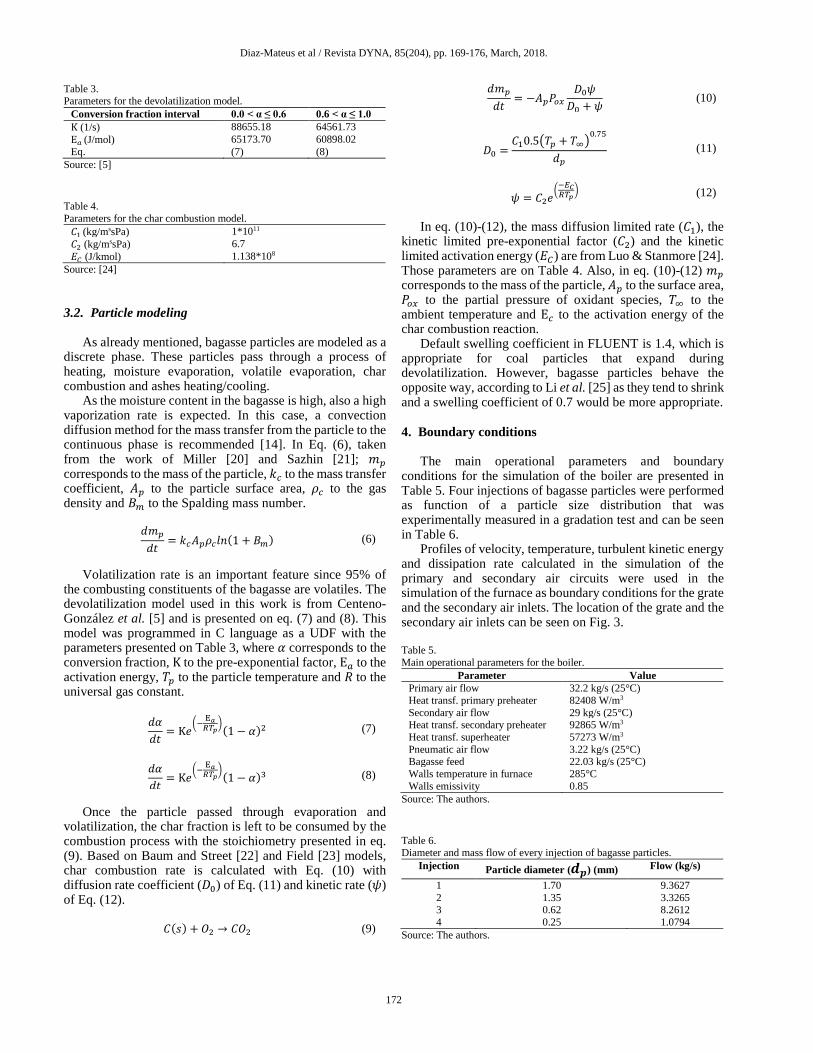
Table 2. Elemental and proximate analysis of the bagasse in wet basis.
Elemental analysis (%) Proximate analysis (%) C 45.49 Volatile 44.6 H 5.72 Char 2.38 N 0.62 Ash 2.7 O 48.16 Moisture 50.32
Source: The authors.
the standard k-epsilon turbulence model. In the furnace; continuity, momentum and energy equations with the standard k-epsilon turbulence model were also solved for the continuous phase (gases), besides the discrete ordinates model for radiation and the eddy dissipation model for the species reactions as recommended by Tabet & Gökalp [17]. Particles are modeled as a discrete phase. Detailed description of these equations can be found on reference [14].
3.1. Volatile combustion modeling
Two components of the bagasse participate in the
combustion, the volatiles and the char. The combustion of volatiles is modeled from the creation of a representative molecule with an atomic composition estimated from the elemental analysis of the bagasse (Table 2) and an estimated molecular weight (30 g/mol). Also, the standard state enthalpy of this molecule was estimated from the higher calorific value (HCV) of the bagasse. (8118498 J/kg). The two-step stoichiometry is presented in eq. (2) – (3).
𝐶𝐶1.06𝐻𝐻1.79𝑂𝑂0.95𝑁𝑁0.014 + 0.5𝑂𝑂2
⇒ 1.06𝐶𝐶𝑂𝑂 + 0.89𝐻𝐻2𝑂𝑂 + 0.007𝑁𝑁2 (2)
𝐶𝐶𝑂𝑂 + 0.5𝑂𝑂2 ⇒ 𝐶𝐶𝑂𝑂2 (3)
In the eddy dissipation model [18] the net rate of
production of the specie i due to reaction r (𝑅𝑅𝑖𝑖,𝑟𝑟) is given by the smaller value calculated by eq. (4) or (5). Parameters A and B are known as Magnussen constants, 𝜈𝜈𝑖𝑖 ,𝑟𝑟′ corresponds to the stoichiometric coefficient, 𝑀𝑀𝑤𝑤,𝑖𝑖 to the molecular weight, 𝜀𝜀 𝜅𝜅⁄ to the ratio of turbulent kinetic energy/dissipation rate and 𝑌𝑌𝑅𝑅 to the mass fraction.
𝑅𝑅𝑖𝑖,𝑟𝑟 = 𝜈𝜈𝑖𝑖,𝑟𝑟′ 𝑀𝑀𝑤𝑤,𝑖𝑖𝐴𝐴𝜌𝜌𝜀𝜀𝜅𝜅𝑚𝑚𝑚𝑚𝑚𝑚𝑅𝑅 �
𝑌𝑌𝑅𝑅𝜈𝜈𝑅𝑅,𝑟𝑟′ 𝑀𝑀𝑤𝑤,𝑅𝑅
� (4)
𝑅𝑅𝑖𝑖,𝑟𝑟 = 𝜈𝜈𝑖𝑖,𝑟𝑟′ 𝑀𝑀𝑤𝑤,𝑖𝑖𝐴𝐴𝐴𝐴𝜌𝜌𝜀𝜀𝜅𝜅𝑚𝑚𝑚𝑚𝑚𝑚𝑅𝑅
∑ 𝑌𝑌𝑃𝑃𝑃𝑃
∑ 𝜈𝜈𝑗𝑗,𝑟𝑟′′ 𝑀𝑀𝑤𝑤,𝑗𝑗
𝑁𝑁𝑗𝑗
(5)
The values of A and B default by FLUENT are 4.0 and 0.5
respectively. Those values were found empirically for the combustion of gases and produced unrealistic high flame temperatures and low CO concentration in the simulations. At the best of our knowledge, the only work in the literature dedicated to estimate the Magnussen constants for the combustion of biomass is the one presented by Scharler, Fleckl & Obernberger [19]. They recommend values of 0.6 and 0.5 for Magnussen constants A and B respectively. With those values, the simulations calculated a CO concentration and flame temperature of satisfactory agreement to the experimental values.
Diaz-Mateus et al / Revista DYNA, 85(204), pp. 169-176, March, 2018.
172
Table 3. Parameters for the devolatilization model.
Table 4. Parameters for the char combustion model. 𝐶𝐶1 (kg/mssPa) 1*1011
𝐶𝐶2 (kg/mssPa) 6.7 𝐸𝐸𝐶𝐶 (J/kmol) 1.138*108
Source: [24]
3.2. Particle modeling As already mentioned, bagasse particles are modeled as a
discrete phase. These particles pass through a process of heating, moisture evaporation, volatile evaporation, char combustion and ashes heating/cooling.
As the moisture content in the bagasse is high, also a high vaporization rate is expected. In this case, a convection diffusion method for the mass transfer from the particle to the continuous phase is recommended [14]. In Eq. (6), taken from the work of Miller [20] and Sazhin [21]; 𝑚𝑚𝑝𝑝 corresponds to the mass of the particle, 𝑘𝑘𝑐𝑐 to the mass transfer coefficient, 𝐴𝐴𝑝𝑝 to the particle surface area, 𝜌𝜌𝑐𝑐 to the gas density and 𝐴𝐴𝑚𝑚 to the Spalding mass number.
𝑑𝑑𝑚𝑚𝑝𝑝
𝑑𝑑𝑑𝑑 = 𝑘𝑘𝑐𝑐𝐴𝐴𝑝𝑝𝜌𝜌𝑐𝑐𝑙𝑙𝑚𝑚(1 + 𝐴𝐴𝑚𝑚) (6)
Volatilization rate is an important feature since 95% of
the combusting constituents of the bagasse are volatiles. The devolatilization model used in this work is from Centeno-González et al. [5] and is presented on eq. (7) and (8). This model was programmed in C language as a UDF with the parameters presented on Table 3, where 𝛼𝛼 corresponds to the conversion fraction, K to the pre-exponential factor, E𝑎𝑎 to the activation energy, 𝑇𝑇𝑝𝑝 to the particle temperature and 𝑅𝑅 to the universal gas constant.
𝑑𝑑𝛼𝛼𝑑𝑑𝑑𝑑 = K𝑒𝑒
�− E𝑎𝑎𝑅𝑅𝑇𝑇𝑝𝑝
�(1 − 𝛼𝛼)2 (7)
𝑑𝑑𝛼𝛼𝑑𝑑𝑑𝑑 = K𝑒𝑒
�− E𝑎𝑎𝑅𝑅𝑇𝑇𝑝𝑝
�(1 − 𝛼𝛼)3 (8)
Once the particle passed through evaporation and
volatilization, the char fraction is left to be consumed by the combustion process with the stoichiometry presented in eq. (9). Based on Baum and Street [22] and Field [23] models, char combustion rate is calculated with Eq. (10) with diffusion rate coefficient (𝐷𝐷0) of Eq. (11) and kinetic rate (𝜓𝜓) of Eq. (12).
𝐶𝐶(𝑠𝑠) + 𝑂𝑂2 → 𝐶𝐶𝑂𝑂2 (9)
𝑑𝑑𝑚𝑚𝑝𝑝
𝑑𝑑𝑑𝑑 = −𝐴𝐴𝑝𝑝𝑃𝑃𝑜𝑜𝑜𝑜𝐷𝐷0𝜓𝜓𝐷𝐷0 + 𝜓𝜓 (10)
𝐷𝐷0 =𝐶𝐶10.5�𝑇𝑇𝑝𝑝 + 𝑇𝑇∞�
0.75
𝑑𝑑𝑝𝑝 (11)
𝜓𝜓 = 𝐶𝐶2𝑒𝑒�−𝐸𝐸𝐶𝐶𝑅𝑅𝑇𝑇𝑝𝑝
� (12) In eq. (10)-(12), the mass diffusion limited rate (𝐶𝐶1), the
kinetic limited pre-exponential factor (𝐶𝐶2) and the kinetic limited activation energy (𝐸𝐸𝐶𝐶) are from Luo & Stanmore [24]. Those parameters are on Table 4. Also, in eq. (10)-(12) 𝑚𝑚𝑝𝑝 corresponds to the mass of the particle, 𝐴𝐴𝑝𝑝 to the surface area, 𝑃𝑃𝑜𝑜𝑜𝑜 to the partial pressure of oxidant species, 𝑇𝑇∞ to the ambient temperature and E𝑐𝑐 to the activation energy of the char combustion reaction.
Default swelling coefficient in FLUENT is 1.4, which is appropriate for coal particles that expand during devolatilization. However, bagasse particles behave the opposite way, according to Li et al. [25] as they tend to shrink and a swelling coefficient of 0.7 would be more appropriate.
4. Boundary conditions
The main operational parameters and boundary
conditions for the simulation of the boiler are presented in Table 5. Four injections of bagasse particles were performed as function of a particle size distribution that was experimentally measured in a gradation test and can be seen in Table 6.
Profiles of velocity, temperature, turbulent kinetic energy and dissipation rate calculated in the simulation of the primary and secondary air circuits were used in the simulation of the furnace as boundary conditions for the grate and the secondary air inlets. The location of the grate and the secondary air inlets can be seen on Fig. 3.
Table 5. Main operational parameters for the boiler.
Parameter Value Primary air flow 32.2 kg/s (25°C) Heat transf. primary preheater 82408 W/m3
Diaz-Mateus et al / Revista DYNA, 85(204), pp. 169-176, March, 2018.
173
It is seen on the operation of the boiler how the bagasse particles tend to pile up above the grate, in order to emulate this behavior in the discrete phase model, it is necessary to trap the particles in the grate. In the rest of the boundaries, particles are reflected except in the outlet, where they scape.
5. Results and analysis
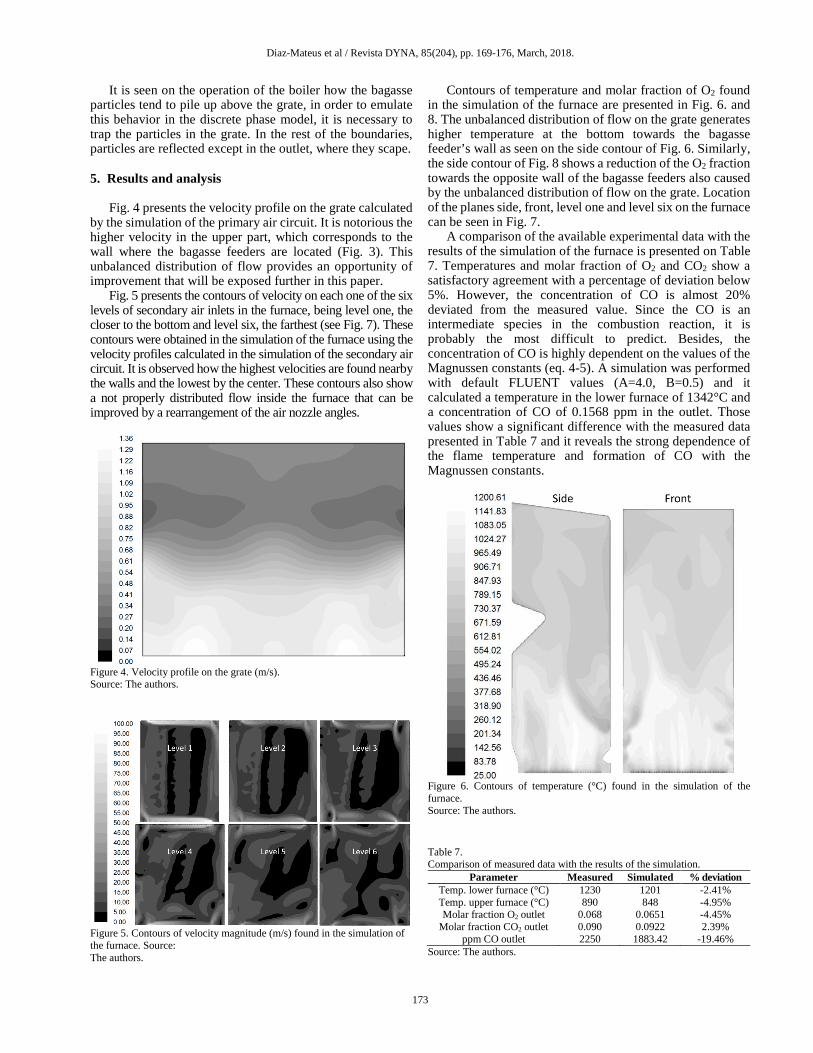
Fig. 4 presents the velocity profile on the grate calculated
by the simulation of the primary air circuit. It is notorious the higher velocity in the upper part, which corresponds to the wall where the bagasse feeders are located (Fig. 3). This unbalanced distribution of flow provides an opportunity of improvement that will be exposed further in this paper.
Fig. 5 presents the contours of velocity on each one of the six levels of secondary air inlets in the furnace, being level one, the closer to the bottom and level six, the farthest (see Fig. 7). These contours were obtained in the simulation of the furnace using the velocity profiles calculated in the simulation of the secondary air circuit. It is observed how the highest velocities are found nearby the walls and the lowest by the center. These contours also show a not properly distributed flow inside the furnace that can be improved by a rearrangement of the air nozzle angles.
Figure 4. Velocity profile on the grate (m/s). Source: The authors.
Figure 5. Contours of velocity magnitude (m/s) found in the simulation of the furnace. Source: The authors.
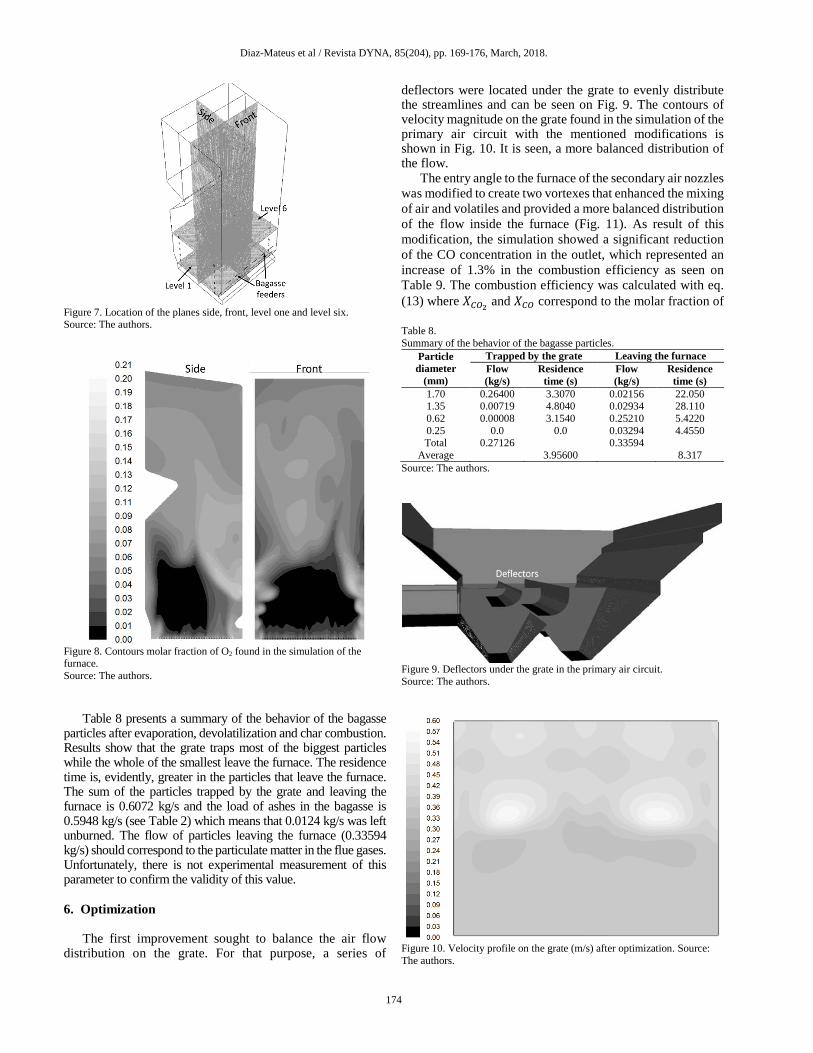
Contours of temperature and molar fraction of O2 found in the simulation of the furnace are presented in Fig. 6. and 8. The unbalanced distribution of flow on the grate generates higher temperature at the bottom towards the bagasse feeder’s wall as seen on the side contour of Fig. 6. Similarly, the side contour of Fig. 8 shows a reduction of the O2 fraction towards the opposite wall of the bagasse feeders also caused by the unbalanced distribution of flow on the grate. Location of the planes side, front, level one and level six on the furnace can be seen in Fig. 7.
A comparison of the available experimental data with the results of the simulation of the furnace is presented on Table 7. Temperatures and molar fraction of O2 and CO2 show a satisfactory agreement with a percentage of deviation below 5%. However, the concentration of CO is almost 20% deviated from the measured value. Since the CO is an intermediate species in the combustion reaction, it is probably the most difficult to predict. Besides, the concentration of CO is highly dependent on the values of the Magnussen constants (eq. 4-5). A simulation was performed with default FLUENT values (A=4.0, B=0.5) and it calculated a temperature in the lower furnace of 1342°C and a concentration of CO of 0.1568 ppm in the outlet. Those values show a significant difference with the measured data presented in Table 7 and it reveals the strong dependence of the flame temperature and formation of CO with the Magnussen constants.
Figure 6. Contours of temperature (°C) found in the simulation of the furnace. Source: The authors.
Table 7. Comparison of measured data with the results of the simulation.
Molar fraction CO2 outlet 0.090 0.0922 2.39% ppm CO outlet 2250 1883.42 -19.46%
Source: The authors.
Diaz-Mateus et al / Revista DYNA, 85(204), pp. 169-176, March, 2018.
174
Figure 7. Location of the planes side, front, level one and level six. Source: The authors.
Figure 8. Contours molar fraction of O2 found in the simulation of the furnace. Source: The authors.
Table 8 presents a summary of the behavior of the bagasse
particles after evaporation, devolatilization and char combustion. Results show that the grate traps most of the biggest particles while the whole of the smallest leave the furnace. The residence time is, evidently, greater in the particles that leave the furnace. The sum of the particles trapped by the grate and leaving the furnace is 0.6072 kg/s and the load of ashes in the bagasse is 0.5948 kg/s (see Table 2) which means that 0.0124 kg/s was left unburned. The flow of particles leaving the furnace (0.33594 kg/s) should correspond to the particulate matter in the flue gases. Unfortunately, there is not experimental measurement of this parameter to confirm the validity of this value.
6. Optimization
The first improvement sought to balance the air flow
distribution on the grate. For that purpose, a series of
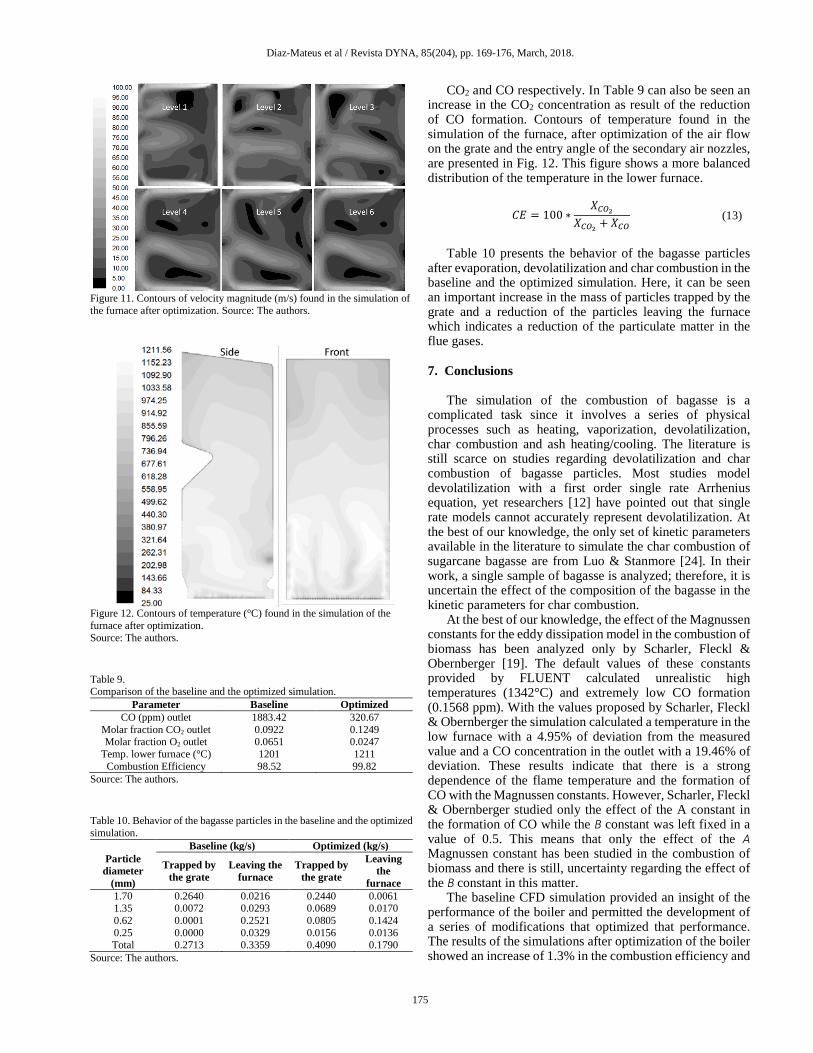
deflectors were located under the grate to evenly distribute the streamlines and can be seen on Fig. 9. The contours of velocity magnitude on the grate found in the simulation of the primary air circuit with the mentioned modifications is shown in Fig. 10. It is seen, a more balanced distribution of the flow.
The entry angle to the furnace of the secondary air nozzles was modified to create two vortexes that enhanced the mixing of air and volatiles and provided a more balanced distribution of the flow inside the furnace (Fig. 11). As result of this modification, the simulation showed a significant reduction of the CO concentration in the outlet, which represented an increase of 1.3% in the combustion efficiency as seen on Table 9. The combustion efficiency was calculated with eq. (13) where 𝑋𝑋𝐶𝐶𝐶𝐶2 and 𝑋𝑋𝐶𝐶𝐶𝐶 correspond to the molar fraction of
Table 8. Summary of the behavior of the bagasse particles.
Particle diameter
(mm)
Trapped by the grate Leaving the furnace Flow (kg/s)
CO2 and CO respectively. In Table 9 can also be seen an increase in the CO2 concentration as result of the reduction of CO formation. Contours of temperature found in the simulation of the furnace, after optimization of the air flow on the grate and the entry angle of the secondary air nozzles, are presented in Fig. 12. This figure shows a more balanced distribution of the temperature in the lower furnace.
𝐶𝐶𝐸𝐸 = 100 ∗𝑋𝑋𝐶𝐶𝐶𝐶2
𝑋𝑋𝐶𝐶𝐶𝐶2 + 𝑋𝑋𝐶𝐶𝐶𝐶 (13)
Table 10 presents the behavior of the bagasse particles
after evaporation, devolatilization and char combustion in the baseline and the optimized simulation. Here, it can be seen an important increase in the mass of particles trapped by the grate and a reduction of the particles leaving the furnace which indicates a reduction of the particulate matter in the flue gases.
7. Conclusions
The simulation of the combustion of bagasse is a
complicated task since it involves a series of physical processes such as heating, vaporization, devolatilization, char combustion and ash heating/cooling. The literature is still scarce on studies regarding devolatilization and char combustion of bagasse particles. Most studies model devolatilization with a first order single rate Arrhenius equation, yet researchers [12] have pointed out that single rate models cannot accurately represent devolatilization. At the best of our knowledge, the only set of kinetic parameters available in the literature to simulate the char combustion of sugarcane bagasse are from Luo & Stanmore [24]. In their work, a single sample of bagasse is analyzed; therefore, it is uncertain the effect of the composition of the bagasse in the kinetic parameters for char combustion.
At the best of our knowledge, the effect of the Magnussen constants for the eddy dissipation model in the combustion of biomass has been analyzed only by Scharler, Fleckl & Obernberger [19]. The default values of these constants provided by FLUENT calculated unrealistic high temperatures (1342°C) and extremely low CO formation (0.1568 ppm). With the values proposed by Scharler, Fleckl & Obernberger the simulation calculated a temperature in the low furnace with a 4.95% of deviation from the measured value and a CO concentration in the outlet with a 19.46% of deviation. These results indicate that there is a strong dependence of the flame temperature and the formation of CO with the Magnussen constants. However, Scharler, Fleckl & Obernberger studied only the effect of the A constant in the formation of CO while the B constant was left fixed in a value of 0.5. This means that only the effect of the A Magnussen constant has been studied in the combustion of biomass and there is still, uncertainty regarding the effect of the B constant in this matter.
The baseline CFD simulation provided an insight of the performance of the boiler and permitted the development of a series of modifications that optimized that performance. The results of the simulations after optimization of the boiler showed an increase of 1.3% in the combustion efficiency and
Diaz-Mateus et al / Revista DYNA, 85(204), pp. 169-176, March, 2018.
176
a reduction of 53% in the particulate matter in the flue gases.
Acknowledgments The authors wish to acknowledge BIOCONDENSADOS
(Cali, Colombia) for providing the experimental data used in this work.
References
[1] Alexandratos, N. and Bruinsma, J., World agriculture towards
2030/2050: The 2012 revision, FAO Agricultural Development Economics Division, 2012.
[2] Global Ethanol Production. [online]. Available at: https://www.afdc.energy.gov/data/10331. 2017.
[3] Kaewpradap, A., Yoksenakul, W. and Jugjai, S., Effects of moisture content in simulated bagasse by equilibrium analysis. Proceedings of the 4th TSME International Conference on Mechanical Engineering (TSME-ICOME). October, 2013.
[4] Shrivastav, S. and Hussain, I., Design of bagasse dryer to recover energy of water tube boiler in a sugar factory. International Journal of Science and Research (IJSR), 2(8), pp. 356-358, 2013.
[5] Centeno-Gonzáleza, F., Silva-Lora, E.D., Villa-Nova, H.F., Mendes Neto, L.J., Martínez-Reyes, A.M., Ratner, A. and Ghamari, M., CFD modeling of combustion of sugarcane bagasse in an industrial boiler. Fuel, 193, pp. 31-38, 2017. DOI: 10.1016/j.fuel.2016.11.105
[6] Demirbas, A., Potential applications of renewable energy sources, biomass combustion problems in boiler power systems and combustion related environmental issues. Prog. Energy Combust. Sci., 31, pp. 171-192, 2005. DOI: 10.1016/j.pecs.2005.02.002
[7] Ferreira, D.J.O., Sosa-Arnao, J.H., Moreira, B.C., Paes-Rangel, L. and Park, S.W., A comprehensive CFD model for sugar-cane bagasse heterogeneous combustion in a grate boiler system. International Journal of Chemical, Molecular, Nuclear, Materials and Metallurgical Engineering, 9(5), pp. 593-600, 2015. DOI: 10.1999/1307-6892/10001615
[8] Zahirovic, S., Scharler, R. and Obernberger, I., Advanced CFD modelling of pulverised biomass combustion. Proc. of the Internat. Conf. Science in Thermal and Chemical Biomass Conversion. pp. 267-283, 2006.
[9] Jin, B., Yan, L., Higgins, B. and Liu, G., CFD Modeling of biomass combustion for conversion application. NALCO Mobotec Clearwater Coal Conference, 2011. DOI: 10.3390/ijms9061108
[10] Aboyadea, A.O., Hugo, T.J., Carriera, M., Meyer, E.L., Stahl, R., Knoetzea, J.H. and Görgens, J.F., Non-isothermal kinetic analysis of the devolatilization of corn cobs and sugarcane bagasse in an inert atmosphere. Thermochimica Acta, 517, pp. 81-89, 2011. DOI: 10.1016/j.tca.2011.01.035
[11] Sánchez-Castro, Z. and Mendieta-Menjura, O.A., Setting of a mathematical model for the sugarcane bagasse combustion in a Ward-Cimpa chamber. Corpoica Cienc. Tecnol. Agropecu., 15(2), pp. 133-151, 2014.
[12] Smith, J.D., Foundations of a three-dimensional model for predicting coal combustion characteristics in industrial power generation plants. In: Dept of Chemical Engineering. Provo, Utah, USA: Brigham Young University, 1990.
[13] Yin, C., Kaer, S.K., Rosendahl, L., Hvid, S.L., Modeling of pulverized coal and biomass co-firing in a 150 KW swirling stabilized burner and experimental validation. In: Proceedings of the international conference on powder engineering-09. (ICOPE-09). Kobe, Japan; November 16–20, 2009. DOI: 10.1299/jsmeicope.2009.2._2-305_
[14] ANSYS FLUENT User Manual, release 16.0. ANSYS Inc. [15] Torresi, M., Saponaro, A., Camporeale, S.M. and Fortunato, B., CFD
analysis of the flow through tube banks of HRSG. Proceedings of ASME Turbo Expo 2008: Power for Land, Sea and Air, 2008.
[16] Ergun, S., Fluid flow through packed columns. Chem. Eng. Prog. 48(2), pp. 89-94, 1952.
[17] Tabet, F. and Gökalp, I., Review on CFD based models for co-firing coal and biomass. Renewable and Sustainable Energy Reviews. 51, pp. 1101-1114, 2015. DOI: 10.1016/j.rser.2015.07.045
[18] Magnussen, B.F. and Hjertager, B.H., On mathematical models of turbulent combustion with special emphasis on soot formation and combustion. In 16th Symp. (Int’l.) on Combustion. The Combustion Institute, 1976. DOI: 10.1016/S0082-0784(77)80366-4
[19] Scharler, R., Fleckl, T. and Obernberger, I., Modification of a magnussen constant of the Eddy dissipation model for biomass grate furnaces by means of hot gas in-situ FT-IR absorption spectroscopy. Progress in Computational Fluid Dynamics, 3(4), pp. 102-111, 2003. DOI: 10.1504/PCFD.2003.003776
[20] Miller, R.S., Harstad, K. and Bellan, J., Evaluation of equilibrium and non-equilibrium evaporation models for many droplet gas-liquid flow simulations. International Journal of Multiphase Flow. 24(6), pp. 1025-1055, 1998. DOI: 10.1016/S0301-9322(98)00028-7
[21] Sazhin, S.S., Advanced models of fuel droplet heating and evaporation. Progress in Energy and Combustion Science. Elsevier Science. 32, pp. 162-214, 2006. DOI: 10.1016/j.pecs.2005.11.001
[22] Baum, M.M. and Street, P.J., Predicting the combustion behaviour of coal particles. Combust Sci Technol. 3, pp. 231-243, 1971. DOI: 10.1080/00102207108952290
[23] Field, M.A., Rate of combustion of size-graded fractions of char from a low-rank coal between 1200 K and 2000 K. Combust Flame. 13, pp. 237-252, 1969. DOI: 10.1016/0010-2180(69)90002-9
[24] Luo, M, and Stanmore, B., The combustion characteristics of char from pulverized bagasse. Fuel. 71(9), pp. 1074-1076, 1992. DOI: 10.1016/0016-2361(92)90117-7
[25] Li, J., Paul, M.C., Younger, P.L. Watson, I. Hossain, M. and Welch, S., Characterization of biomass combustion at high temperatures based on an upgraded single particle model. Applied Energy. 156, pp. 749-755, 2015. DOI: 10.1016/j.apenergy.2015.04.027
F.A. Diaz-Mateus, received the BSc. Eng in Chemical Engineering in 2004, from the Universidad Industrial de Santander, Bucaramanga Colombia. The MSc. degree in Chemical Engineering in 2008, from the Universidade Estadual de Campinas, Campinas, Brazil. The PhD degree in Chemical Engineering in 2016 from the Universidad Industrial de Santander, Bucaramanga, Colombia. He has over 10 years of experience working as a consultant for different companies in computational simulation, programming and numerical modelling. Currently, he serves as technical manager of AC Ingenieria Virtual. ORCID: 0000-0001-9637-109X H.C. Alvarez-Castro, graduated the BSc. in Chemical Engineering at Industrial University of Santander-UIS- Colombia, 2007. He completed his MSc. in Chemical Engineering (2011) and his PhD in Chemical Engineering (2014) at University of Campinas - UNICAMP -. He has experience in chemical engineering, focusing on computational fluid dynamics (CFD), stirred tanks, petrochemical processes, heat transfer, besides with training and skills in design, process simulation, economic analysis, development of technology products and research among others. Currently, he serves as commercial manager of AC Ingenieria Virtual. ORCID: 0000-0002-3180-1420 A. Chaves-Guerrero, he is a BSc. Chemical Engineer and Sp. in Thermal Sciences of the Universidad del Valle, Cali Colombia. He received his MSc. degree in Mechanical Engineering and his PhD degree from the University of Puerto Rico, Mayagüez, Puerto Rico. He is currently professor of the School of Chemical Engineering in the Universidad Industrial de Santander, Colombia. His research is focused on ferrohydrodynamic, magneto-rheology, and simulation of transport phenomena. ORCID: 0000-0003-4481-4818