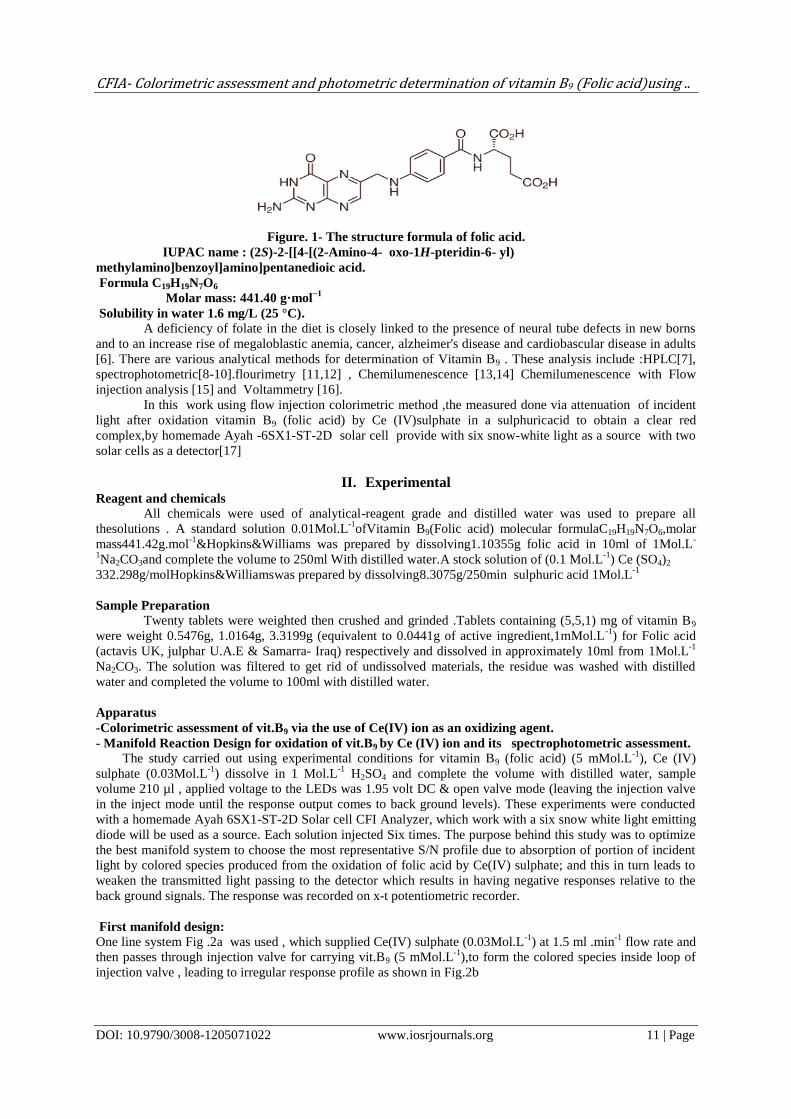
IOSR Journal of Pharmacy and Biological Sciences (IOSR-JPBS)
e-ISSN:2278-3008, p-ISSN:2319-7676. Volume 12, Issue 5 Ver. VII (Sep. – Oct. 2017), PP 10-22
www.iosrjournals.org
DOI: 10.9790/3008-1205071022 www.iosrjournals.org 10 | Page
CFIA- Colorimetric assessment and photometric determination of
vitamin B9 (Folic acid)using LEDs as a source of irradiation and
two solar cells as an energy transducer
Proph. Nagam S. Turkey Al-Awadi ,Rana A. Kamal Aldeen Department of chemistry ,College of Science ,University of Baghdad ,Baghdad ,Iraq.
Abstract: A specific, new, sensitive and simple method has been used for the determination of vitamin B9(Folic
acid )in pure and pharmaceutical formulations by continuous flow injection analysis .The method is based on
oxidation vitamin B9 by Ce(IV) sulphate in sulphuric acid to obtain a red complex, using homemadeAyah-6SX1-
ST-2D solar cell CFIA. Optimum parameters have been studied to increase the sensitivity and limit of detection
for this developed method. The linear range for the instrument response versus vitamin B9 concentration was
(0.1-5) mMol.L-1
while the L.O.D was 5.544µg/sample, the correlation coefficient ( r ) was 0.9953 while
percentage linearity ( r2% ) was 99.07%. RSD% for the repeatability (n=8) was less than 0.5%for the
determination of vitamin B9 at concentration (0.9, 5) mMol.L-1
respectively .The method was applied
successfully for the determination of vitamin B9 in pharmaceutical preparation .A comparison was made
between two methods: newly proposed method and the reference claimed method UV-SP spectrophotometry at
ʎmax=255 nm, of analysis using the standard addition method, via the use paired t-test and there was no
significant between the two methods at 95% confidence level.
Keywords: Vitamin B9, flow injection analysis , Colorimetry ,homemade instrument.
----------------------------------------------------------------------------------------------------------------------------- ---------- Date of Submission: 11-10-2017 Date of acceptance: 27-10-2017
----------------------------------------------------------------------------------------------------------------------------- ----------
I. Introduction Folate, forms of which are known as folic acid and vitamin B9, is one of the B vitamins[1].That is
normally found in foods such as dried beans, peas, lentils, oranges, whole-wheat products, liver, asparagus,
beets, broccoli, brussels sprouts, and spinach. Folic acid helps your body produce and maintain new cells, and
also helps prevent changes to DNA that may lead to cancer.
As a medication, folic acid is used to treat folic acid deficiency and certain types of anemia (lack of red
blood cells) caused by folic acid deficiency. The recommended daily intake level of folate is
400 micrograms from foods or dietary supplements[2] .It is also used as a supplement by women
during pregnancy to prevent neural tube defects (NTDs) in the baby [3].
The physical and chemical properties of folic acid Folic acid also known as vitamin M. Pale orange-yellow crystals or flakes. About 250 ℃ darken not
melt occurs carbonization. Dissolved in hot dilute hydrochloric acid and sulfur, slightly soluble in acetic acid,
phenol pyridine, alkali hydroxide and alkali carbonate solution, slightly soluble in methanol, insoluble in ethanol
and butanol, and insoluble in ether, acetone, chloroform and benzene. About dissolved 1% in a 25 ° C water
solubility of only 0.0016mg/mL, boiling, 1G folic acid in 10mL of water suspension, pH of 4.8-4.8. But folic
acid sodium salt easily soluble in water, but its sodium salt dissolved in water by light decomposes
pteridineaminobenzoyl sodium glutamate. Folic acid is stable in the air, but by the ultraviolet light that the
decomposition of losing its vitality. Thermally unstable in acidic solution, but in the neutral and alkaline
environment is very stable and heated under 100 ° C for 1 hour will not be damaged[4].
Folic acid (FA) chemically: (s)-2-(2-((2-amino-4-hydroxy pteridine-6-yl) methyl amino) benzamido)
pentandioic acid one of the water soluble B vitamins. It is degraded in aqueous solution by sunlight, ultraviolet
and visible light. It has little native fluorescence, it can be turned into a strongly fluorescene compound by
oxidation. Folic acid is made up of bicyclic joined by peptide linkage to a single molecule of L-glutamic acid as
shown in Figure .1[5].
CFIA- Colorimetric assessment and photometric determination of vitamin B9 (Folic acid)using ..
DOI: 10.9790/3008-1205071022 www.iosrjournals.org 11 | Page
Figure. 1- The structure formula of folic acid.
IUPAC name : (2S)-2-[[4-[(2-Amino-4- oxo-1H-pteridin-6- yl)
methylamino]benzoyl]amino]pentanedioic acid.
Formula C19H19N7O6
Molar mass: 441.40 g·mol−1
Solubility in water 1.6 mg/L (25 °C).
A deficiency of folate in the diet is closely linked to the presence of neural tube defects in new borns
and to an increase rise of megaloblastic anemia, cancer, alzheimer's disease and cardiobascular disease in adults
[6]. There are various analytical methods for determination of Vitamin B9 . These analysis include :HPLC[7],
spectrophotometric[8-10].flourimetry [11,12] , Chemilumenescence [13,14] Chemilumenescence with Flow
injection analysis [15] and Voltammetry [16].
In this work using flow injection colorimetric method ,the measured done via attenuation of incident
light after oxidation vitamin B9 (folic acid) by Ce (IV)sulphate in a sulphuricacid to obtain a clear red
complex,by homemade Ayah -6SX1-ST-2D solar cell provide with six snow-white light as a source with two
solar cells as a detector[17]
II. Experimental Reagent and chemicals
All chemicals were used of analytical-reagent grade and distilled water was used to prepare all
thesolutions . A standard solution 0.01Mol.L-1
ofVitamin B9(Folic acid) molecular formulaC19H19N7O6,molar
mass441.42g.mol-1
&Hopkins&Williams was prepared by dissolving1.10355g folic acid in 10ml of 1Mol.L-
1Na2CO3and complete the volume to 250ml With distilled water.A stock solution of (0.1 Mol.L
-1) Ce (SO4)2
332.298g/molHopkins&Williamswas prepared by dissolving8.3075g/250min sulphuric acid 1Mol.L-1
Sample Preparation
Twenty tablets were weighted then crushed and grinded .Tablets containing (5,5,1) mg of vitamin B9
were weight 0.5476g, 1.0164g, 3.3199g (equivalent to 0.0441g of active ingredient,1mMol.L-1
) for Folic acid
(actavis UK, julphar U.A.E & Samarra- Iraq) respectively and dissolved in approximately 10ml from 1Mol.L-1
Na2CO3. The solution was filtered to get rid of undissolved materials, the residue was washed with distilled
water and completed the volume to 100ml with distilled water.
Apparatus
-Colorimetric assessment of vit.B9 via the use of Ce(IV) ion as an oxidizing agent.
- Manifold Reaction Design for oxidation of vit.B9 by Ce (IV) ion and its spectrophotometric assessment. The study carried out using experimental conditions for vitamin B9 (folic acid) (5 mMol.L
-1), Ce (IV)
sulphate (0.03Mol.L-1
) dissolve in 1 Mol.L-1
H2SO4 and complete the volume with distilled water, sample
volume 210 µl , applied voltage to the LEDs was 1.95 volt DC & open valve mode (leaving the injection valve
in the inject mode until the response output comes to back ground levels). These experiments were conducted
with a homemade Ayah 6SX1-ST-2D Solar cell CFI Analyzer, which work with a six snow white light emitting
diode will be used as a source. Each solution injected Six times. The purpose behind this study was to optimize
the best manifold system to choose the most representative S/N profile due to absorption of portion of incident
light by colored species produced from the oxidation of folic acid by Ce(IV) sulphate; and this in turn leads to
weaken the transmitted light passing to the detector which results in having negative responses relative to the
back ground signals. The response was recorded on x-t potentiometric recorder.
First manifold design:
One line system Fig .2a was used , which supplied Ce(IV) sulphate (0.03Mol.L-1
) at 1.5 ml .min-1
flow rate and
then passes through injection valve for carrying vit.B9 (5 mMol.L-1
),to form the colored species inside loop of
injection valve , leading to irregular response profile as shown in Fig.2b
CFIA- Colorimetric assessment and photometric determination of vitamin B9 (Folic acid)using ..
DOI: 10.9790/3008-1205071022 www.iosrjournals.org 12 | Page
Second manifold design:
The manifold is of two lines (Fig. 3a): The first line supplied with distilled water as a carrier stream at 1.4 ml
.min -1
which leads to the injection valve for carrying 210 µl sample volume of vit. B9 (5 mMol.L-1
), the second
line supplied Ce(IV) sulphate (0.03Mol.L-1
) at 1.5 ml .min -1
as a reagent. Both of lines met at Y-junction point
with an outlet for reactants product from red colored species which passes through Ayah 6SX1-ST-2D Solar cell
CFI Analyzer. Two lines system gave a regular reproducible & smooth response profile (Fig.3b).
On the above mentioned basis the two line manifold is the most appropriate manifold design. due to completion
of mixing and oxidation to form the colored plug in comparison with one line manifold system as in here the
mixing occur in the injection valve via sample plug loop which in reality a short area-volume to obtain a distinct
mixing (i.e., homogenous reaction –mixing )for a complete coloured specimen. A deformed profile of response-
time was the output; therefore, it was cancelled throughout this process of research piece of work.
A proposed mechanism for the oxidation of vit.B9 with Ce(IV)sulphate in sulphuric acid can be represented
according to the following steps[18 -21 ].
Step 1: The primary reactive species of Ce(IV) sulphate in acidic medium can be resultfrom the equation:
CFIA- Colorimetric assessment and photometric determination of vitamin B9 (Folic acid)using ..
DOI: 10.9790/3008-1205071022 www.iosrjournals.org 13 | Page
Schematic.1: Proposed mechanism of vit.B9–Ce(IV)Sulphate –H3O+system.
–Selection of optimum chemical and physical parameters leading to highestpossible S/N profile and signal
that will relayed on for next comingexperiments .
-Chemical parameters
-Effect ofCe (IV) sulphate Concentration on absorbance of colouredspecies.
Using different concentration of Ce (IV) sulphate 0.001-0.1 Mol.L-1
while 5mMol.L-1
of B9 and 210µl
sample volume was injected on the stream (distilled water ) at a flow rate 1.4 ,1.5 ml.min-1
for carrier stream and
reagent respectively . The applied voltage to the LEDs was 1.95 volt DC. Each measurement was repeated for
three times. The response profile for this study as shown in Fig.4a . It was noticed ; that the height response
profile of coloured species increase when the incident light decrease with increase Ce(IV)sulphate concentration
up to 0.07 Mol.L-1
, while at higher concentration ˃ 0.07Mol.L-1
lead to decrease of response height .It might be
due to increase of the density of the colored product which work as an internal filter that prevent the remaining
light intensity after absorption process by the colored species from passes to the solar cell detector . Fig 4b
shows the plot of results using Ayah 6SX1-ST-2D solar cell CFI Analyzer. Therefore 0.07Mol.L-1
Ce(IV)
sulphate concentration was chosen as the optimum concentration for next coming experiments .
-Effect of added sulphuric acid
A series of sulphuric acid solutions were prepared (0.1-1) Mol.L-1
in addition to distilled water, which is
used as a carrier stream to study the effect of added H2SO4 concentration on Ce(IV)-vit.B9-H3O+system and just
to kept the oxidizing agent in its soluble form. 5mMol.L-1
of vit.B9, 210µl of sample volume was used for this
study. Fig.5a shows the effect of H2SO4 concentration on height of response profile. Fig.5b was obtained, in
which that the increase of absorbance expressed as an energy transducer response of colored species with
increasing concentration of sulphuric acid. A slight increment was noticed in absorbance reading 7.78% relative
to distilled water back ground when using 0.7 Mol.L-1
concentration of H2SO4.In order to compromise in having
increased sensitivity maintaining Ce(IV) sulphate in its soluble form and catalyst action of the reaction; 0.7
Mol.L-1
sulphuric acid was the most satisfactory choice.
Fig.5: Effect of added sulphuric acid on:
a-Response profile versus time
b-Energy transducer response by attenuation of incident light using 210µl and 1.4,1.5ml.min-flow
rate for carrier stream and reagent respectively.
a a
CFIA- Colorimetric assessment and photometric determination of vitamin B9 (Folic acid)using ..
DOI: 10.9790/3008-1205071022 www.iosrjournals.org 14 | Page
-physical parameters
-Effect of flow rate Variation of flow rates 0.2- 2.8 ml.min
-1 for carrier stream (H2SO4 0.7Mol.L
-1 was chosen to be a good
carrier stream instead of distilled water from the last study before) and 0.4- 3ml.min-1
for reagent; (Ce(IV)
sulphate 0.07Mol.L-1
). Controlled by the peristaltic pump for determination of vit. B9 at 5 mMol.L-1
concentration was studied; While keeping other changeable constant.i.e.; 210µl sample volume , open valve
mode, and applied voltage to the LEDs was 1.95 volt DC .Fig.6a shows that at low flow rate there was an
increase in peak height & wider base width this might be attributed to the increase dispersion & area of colored
segment in flow cell that causes a longer time duration of colored species in front of detector. While at higher
pump speed ˃ 25; (1.8, 2) ml .min -1
for carrier stream and reagent respectively; causing irregular S/N response
profile might be due to complete of coloured species formation in the flow cell; therefore the speed of
25(1.8ml.min-1
flow rate for carrier stream)will be used for the more clear response. Table.1 summarized the
result, Fig.6b shows the optimum flow rate.
Fig.6: Effect of flow rate on: a- Response profile versus time.
b- Energy transducer response by attenuation of incidentlight.
Table.1: Effect of flow rate on the measurement of energy transducer response using 210µl sample
volume and 5 mMol.L-1
of vit.B9.
F1: line no. 1 for carrier stream, F2: line no.2 for reagent, t: Arrival time from injection valve reaching to
measuring cell (sec),ΔtB :Base width of response (sec), t0.05/2,2=4.303
–Effect of sample volume
The optimum flow rate 1.8, 2 ml .min -1
for carrier stream(H2SO4 0.7Mol.L-1
) & reagent
( Ce(IV) sulphate 0.07Mol.L-1
) respectively and vit. B9 of 5mMol.L-1
concentration was used .The injected
volume of sample was varied in the range 110-310 µl by changing the length of the sample loop in the injection
valve , applied voltage to the LEDs was 1.95 volt DC. It was found that an increase in the volume led to a
CFIA- Colorimetric assessment and photometric determination of vitamin B9 (Folic acid)using ..
DOI: 10.9790/3008-1205071022 www.iosrjournals.org 15 | Page
significant increase in sensitivity and more perceptible than low volumes as shown in Fig.7a which shows that
the optimum sample volume of 251.2 µl gave a regular responses for the absorption of incident light, this
indicate to complete reaction and consumption of the chemicals when 251.2 µl will be used as an optimum
sample volume as shown in fig .7b. The obtained results were tabulated in Table.2.
Fig.7: Effect of sample volume on: a- Response profile vs. time.
b - Energy transducer response by absorbance of incident lightusing
coloured species.
Table.2: Effect of sample volume on the measurement of energy transducer response using open valve
mode. t0.05/2,n-1=4.303 for n=3
4.3.2. B.2.2.3-Effect of purge time
A study was carried out to determine the optimum duration of the injection time . Allowed permissible
time for purging of the sample segment from the injection valve ranging (3-24 Sec in addition to open valve
mode (30 Sec))was used in this study. The optimum parameters achieved in previous section were kept at
constant . Fig.8a,b shows the continuation of the height response with increase of injection time up to 13 second
. The decrease in height of response when using less than 13 sec which might be attributed to the incomplete
purge time of sample from sample loop in the injection valve, after 13 sec the peak heights became irregular
when the response output comes to back ground levels. Therefore; 13 second chosen as an optimum purge time
for the departure of the sample segment completely from the injection valve.
Fig .8: Effect of the variation purge time on: a- Response profile versus time
b- Energy transducer response by absorbance of incident
lightusing colourd species.
- Effect of coil length
tB Δ
Sec
Reliability (two tailed)
at 95%
yi±t0.05/2,n-1σn-1/ 𝑛
RSD%
Energy transducer response
expressed as an average
peak heights (n=3) yi in
mV
Sample
volume
µl
Length of
loop
Cm
r=0.5mm
60 576±2.534 0.177 576 110.0 14.0
63 672±2.410 0.144 672 160.0 20.4
66 784±2.683 0.138 784 210.0 26.8
68 824±2.559 0.125 824 251.2 32.0
74 848±2.534 0.120 848 310.0 39.5
CFIA- Colorimetric assessment and photometric determination of vitamin B9 (Folic acid)using ..
DOI: 10.9790/3008-1205071022 www.iosrjournals.org 16 | Page
Using B9(5mMol.L-1
)-Ce (IV) Sulfate (0.07 Mol.L-1
)-H2SO4 (0.7 Mol.L-1
) system and purge time is 13
sec , the effect of reaction coil was studied .The reaction coil length has a large role in the homogenization and
completion of chemical reaction. Different coil length (0 – 50) cm was used , this range of lengths comprises a
volume of 0-392.5 µl which connected after Y-junction directly in flow system. Fig.9a,b shows that a decrease
in peak height with increase coil length ,at the same time increase of the base width(∆tB) . Therefore; two lines
manifold system without reaction coil necessary for completion of oxidation vit. B9 by Ce (IV) sulfate in acidic
medium.
Fig .9: Effect of variation coil length on: a- Response profile versus time.
b- Energy transducer response by absorbance of incident light
using colour species.
-Effect of Intensity of incident light
Variation of light source intensity on the efficiency for determination of vit.B9 5 mMol.L-1
was studied while
keeping all other changeable fixed (Ce (IV) sulphate 0.07Mol.L-1
as a reagent , H2SO4 0.7Mol.L-1
as a carrier
stream ,251.2 µl sample volume , flow rate 1.8,2 ml.min-1
for carrier stream and reagent respectively &purge
time 13 sec , the applied voltages to the LEDs were used (1.27-2.10) volt DC, by variation of light intensity
reads by AVO- meter. Fig.10a shows the response height.Fig.10b shows that an increase in the peak height with
increase intensity of light source So 2.08 volt DC. was selected as the optimum voltage for the snow white light
emitted diodes( LEDs)to prolong the efficiency of the instrument.
Fig.10: Effect of variation Intensity on : a- Response profile versus time
b- Energy transducer response by attenuation of incident light
- Scatter plot calibration curve for variation of vitamin B9 versusenergy transducer response
Using the optimum chemical and physical parameters, a series of vit.B9 solutions ranging 0.1 -8 mMol.L-1
were
prepared, each measurement was repeated three times successive. Fig.11 a shows response profile & height for
each vit. B9 concentration. A scatter plot diagram shows that a linear calibration graph range for the variation of
CFIA- Colorimetric assessment and photometric determination of vitamin B9 (Folic acid)using ..
DOI: 10.9790/3008-1205071022 www.iosrjournals.org 17 | Page
the energy transducer response of Ayah 6SXI-ST-2D solar cell CFI Analyzer with vit.B9 concentration was
ranging from 0.1 -5 mMol.L-1
with correlation coefficient (r):0.9953 as shown in Fig.11b. The results obtained
were tabulated in Table.3. It was noticed, above 5 mMol.L-1
a broad in the peak maxima was observed and
increase of the base width (∆tB) , this cause a deviation of correlation coefficient (deviate from linearity ) ; most
probablydue to the high intensity of the colored species in front of detector and due to the effect of inner filter
of colored species present in solution, which were results from the oxidation of vit.B9 by Ce(IV)sulfate in acidic
medium causing a decrease in transmitted light to the solar cell .
Table .3 Summed up the data of linear regression for the variation of energy transducer response with
vitamin B9 concentration using first degree equation of the form ŷ=a+bx at optimum conditions . In addition to
calculate t-value at 95% confidence level which larger than tabulated t-value indicating clearing that the
linearity against non -linearity is accepted
Fig 11: a- Profile of calibration curve for the variation of vitamin B9 concentration on the responseversus
time.
b- Linear calibration graph for the variation of vitamin B9 concentration on the energy transducer
response by reflection of incident light expressed by linear equation usingAyah 6SX1-ST-2D solar cell
CFI Analyzer (Developed method), ȳi :practical value,Ŷi:estimated value
Table. 3 : Summary of linear regression equation results for the variation of instrument response with
vitamin B9 concentration.
[B2] mMol.L-1
[B9]=mMol.L-1
Ab
sor
ba
nc
e
Residu
al
ȳi –Ŷi
CFIA- Colorimetric assessment and photometric determination of vitamin B9 (Folic acid)using ..
DOI: 10.9790/3008-1205071022 www.iosrjournals.org 18 | Page
Ŷ: Estimated response (mV) for n=3 expressed as an average peaks heights of linear equation of the form
Ŷ=a+bx or absorbance value, r: Correlation coefficient, r2
: Coefficient of determination, r2%: Linearity
percentage,
Developed method: using 6SX1-ST-2D CFIA.
- Limit of detection (LOD)
A study was carried out to calculate the limit of detection of vitamin B9 through three methods:
Practically: based on the gradual dilution for the minimum concentration .
Theoretical: based on the value of slope and from the linear regression plot. Table .4summarizes the results of
vitamin B9using251.2µl sample volume.
Table .4: Limit of detection for vitamin B9 at optimum parameter using 251.2µl as an injection sample.
X: value of LOD based on slope, SB: standard deviation of blank repeated for 13 times, Yb: average
response for blank = intercept, Sb: standard deviation equal to Sy/x(residual).
-Repeatability
The relative standard deviation expressed as percentage which is equally to the repeatability of the
measurement. A repeated measurements for eight successive injections were measured at fixed concentrations
of vitamin B9 , while mainly two concentrations were used (0.9 ,5) mMol.L-1
. Fig. 12 is shown response profile
of repeatability at 0.9 and 5 mMol.L-1
respectively the obtained results is tabulated in Table.5which shows that
the percentage relative standarddeviation was less than 0.5% .
Fig .12: Profile of repeatability response for both vitamin B9 concentration0.9&5mMol.L
-1 respectively
forn=8.
Table .5: Repeatability of vitamin B9 at optimum parameters with 215.2µl samplevolume via absorbance
of incident light by color species expressedas an energy transducer response for eight successive of
injected.
ȳi Average response (mV), n=number of injection, t 0.05/2,7 =2.365 .
-Analysis of vitamin B9 and treatment of data
L.O.D. (µg/sample)
Theoretical (linear equation)
based on the value of
=Yb +3Sb Ŷ
Theoretical based on the value of
slope
x=3SB/slope for n=13
Practically based on the gradual
dilution for the minimum
concentration of [B9]=0.05mMol.L-
1
60.817 0.618 5.544
CFIA- Colorimetric assessment and photometric determination of vitamin B9 (Folic acid)using ..
DOI: 10.9790/3008-1205071022 www.iosrjournals.org 19 | Page
Flow injection analysis using homemade Ayah 6SX1-ST-2D solar cellCFI Analyzer with optimum
parameters that were a achieved in previous section for thevit B9 – Ce(IV) (0.07Mol.L-1
) – H2SO4 (0.7Mol.L-1
)
system which form a red solution which used for the application of method to analyze vitamin B9 in three
different pharmaceutical formulations from different origins of suppliers. The Newly developed methodology
that measured the absorbance of incident light by coloured species expressed as an energy transducer response
was compared with classical method which based on the measurement of absorbance at λ=255nm.
A series of solutions were prepared of each pharmaceutical drug (1mMol.L-1
) by transferring 5 ml to
each six volumetric flask (10 ml ), followed by the addition of gradual volumes of standard B9 0.01Mol.L-1
(0,
0.5, 0.7, 0.9 ,1.0 ,1.5) ml to obtain (0, 0.5, 0.7, 0.9, 1.0, 1.5) mMol.L-1
for proposed method. Flask no.1 is the
sample and the same data for classical method. Results were mathematically treated for the standard addition
method. (Table.6a). Fig.13a,b&c shows a calibration curve for three samples for Newly developed methodology
using Ayah 6SX1-ST-2D solar cell CFI Analyzer.
Paired t-test [22,23,24] was carried out in two approaches as shown in table .6b. The first includes; individual t-
test was made between the mean of weight (wi) from Newly developed method with quoted value of officially
British pharmacopeia [25].
It was found that there is no significant different between two values. Second: paired t-test was used in
order to compare a Newly developed method with the classical spectrophotometric method (at λ=255nm). The
obtained results are shown in table 6b, indicating clearly that there was no significant differences between two
methods, Since the calculated t-value was less than critical tabulated t-value
CFIA- Colorimetric assessment and photometric determination of vitamin B9 (Folic acid)using ..
DOI: 10.9790/3008-1205071022 www.iosrjournals.org 20 | Page
Fig .13: Standard addition curve using Newly developed methodology for the determination of vit.B9–
Ce(IV)– H2SO4 system for three samples :
a : Actavis – UK
b: Julphar – U.A.E.
c: Samarra- Iraq .
ȳi : practical value, Ŷi : estimated value, Residual=ȳi-Ŷiin mV.
Table.6a: Standard addition results for the determination of B9 in three pharmaceutical preparation
using vit.B9– Ce(IV)– H2SO4 system.
CFIA- Colorimetric assessment and photometric determination of vitamin B9 (Folic acid)using ..
DOI: 10.9790/3008-1205071022 www.iosrjournals.org 21 | Page
* draw 5ml for new developed method and 0.5 ml for classical method from (1 mMol.L-1
-sample), Ŷ:Estimated
response in mV for developed method and absorbance for Uv-sp method, r:correlation coefficient, r2:coefficient of
determination ,r2% :linearity percentage, Uv –Sp : Uv–spectrophotometric mehod,t0.025,∞ = 1.96 𝑎𝑡 95% ,ttab=t
0..025,n-2 = 3.182 for n=5 , Wi:Mean of weight for n=20.
Table. 6b: Summary of results for practical content, efficiency for determination of vit.B9 in three samples of
pharmaceutical preparation and paired t –test
µ: quated value ( mg) ,wi:practical content(mg) ,xd : average of difference between two type of
method(developed&classical),ttab =t0.05/2,n-1=4.303 for n(No.of samples)=3.
References [1] Folic Acid Drugs, 2010, American Society of Health-System Pharmacists,, ,1stEdNewYork. [2] Guidance for Industry,2013: A food Labeling Guide (14.Appendix F: Calculate the Percent Daily Value forthe Appropriate Nutrients),
US Food and Drug Administration , vol.4 ,pp: 67-72.
[3] Bibbins-Domingo, Kirsten, Grossman, David, C., Curry, Susan, J., Davidson, Karina, W., Epling, John,W.,García, Francisco, A.R., Kemper, Alex, R., Krist, Alex, H.,Kurth,Ann, E., Landefeld, C. Seth, Mangione, Carol M., Phillips, William R., Phipps, Maureen G.,
Pignone, Michael P.and Silverstein andMichael, 2017 ,Tseng Folic AcidSupplementation for the Prevention of Neural Tube
Defects, Journalof theAmerican Medical Association, vol.317(2), pp: 183- 189. [4] Jeffrey,C., Jones & Bartlett Publishers Pommerville, ,2009, Glendale CommunityCollege,AlcamosFundamentals of Microbiology :Body
system, p: 511,ISBN 9780763787127.
[5] Green, R. &Jaconsen, D.W., 1995, Clinical implication of hyperhomocysteinemia-In:folate in healthand disease (edited by L.B. Baileg),3d Ed , Marcel Dekker. N York, P: 175.
[6] Jeong-Hwa Choi, Zoe Yates, Martin Veysey, Young-Ran Heo and Mark Lucock,2002,Benefits and risks of folic acid to the nervous
system,Journal of Neurology Neurosurgery &Psychiatry, vol. 72)5(,pp: 567-571.
[7] Hermann, E., Petros, G., Konstantinos, D. and Oleg S. ,2001, Determination of folic acid by ion-pairRP-HPLC in vitamin-
fortified fruit juices aftersolid-phase extraction,ElseviersscienceFood Chemistry, vol. 74(4), pp:521-525. [8] Nabeel, S., Dr.Shlair,H., Kafia, S. ,2015, Indirect spectrophotometricdetermination offolic acid based on theoxidation reaction and
studying some of thethermodynamicparameters, Journal of zankoiSulaimani, vol.(17),no.1,part A.
[9] Marcos, V., Ingrid, d., Francisco, d., Graziella, C., 2016, Development andvalidation of a method for the determination of folic acid in different pharmaceutiticalformulations using derivative spectrophotometry, Brazilian Journal of pharmaceutical
Sciences,vol.52 (4), pp:741-750.
[10] Naveen, K., Srinivas, U., Hanumanthchar, J. ,2017, Development and validation of spectrophotometric method for simultaneous estimation of Meclizine and Folic acid inbulk and pharmaceuticaldosage forms, PharmaTutor,vol. 5(6) , pp:29-34.
[11] Yang, W., Pei-Hua, Z., Tian, T., Jie,T., Wang, L. and Xiao-Ya,H, 2011, Synchronous fluorescence as a rapid method for the
simultaneous determination of folic acid and riboflavin in nutritional beverages, Journal of agricultural and food chemistry., vol. 59(23), pp: 12629-12634.
CFIA- Colorimetric assessment and photometric determination of vitamin B9 (Folic acid)using ..
DOI: 10.9790/3008-1205071022 www.iosrjournals.org 22 | Page
[12] Robab,H., Ali, L., Nafiseh, B. and Javad, H. ,2016, Ultrasensitive and Rapid Determination of Folic Acid Using Ag Nanoparticles
Enhanced 1, 10-Phenantroline-Terbium (III) Sensitized FluorescenceJournal of Fluorescence vol.26)5(, pp:1875-1883.
[13] Bo-Tao,z., Lixia, Z., and Jin-Ming, L. ,2008, Determination of folic acid bychemiluminescence baseon peroxomonosulfate-cobalt(II)system-ScienceDirect,Elsevier Talanta,vol.74(5),pp1154-1159.
[14] Shi-Hao, Z., PING-PING,Z. and SHI-BIN, 2010, Determination of folic acid bySolid-Phaseextraction and
FlowInjectionchemiluminescence, Asian Journal of Chemistry, vol. 22(10),pp:7557-62. [15] Issam M and Marwa A, 2012, Determination of folic acid by chemiluminescencecontinuous flow injection analysis, Journal of Kufa for
chemical science, vol.4,pp:58-70.
[16] Fatemeh, K., Abolfazl,E., Roya,S.,Vinod,K. and Yangping,W. ,2016, A fast strategyfordetermination of vitamin B9 in food and pharmaceutical samples using an ionicliquid-modified nanostructure volumetric sensor,,Sciencegov.U.S federal Science, vol.
16(6),pp:747-761.
[17] Issam, M. A.andNagam, S. T., Ayah 6SX1-ST-2D solar cell CFI Analyzer ,Patent, Present tocentral organization for standardization and quality control-Baghdad-Iraq,2014, GO1N21/00.
[18] Morrison, R.T. & Boyd, R.N.. Organic chemistry, 1987, 5th Ed., Allyn& Bacon, Inc., Boston, London, Sydney, Toronto.
[19] Jordan, W., Van barneveld H., Gerlich, O., Kleine, M. and Ullrich, 1985, J., Phenol inUllman,s Encyclopedia of Industrial Chemistry, 5th Ed.,W.Gerhared VCH verlagsgesellshaft, A19 , pp:3689-3707.
[20] Ehrfeld, W. Hessel, V. and Lӧwe. H. ,2000, Electrochemical Microreactors ,inMicrooreactors:New Technology for ModernChemistry,
Wiley-VCH, Weinheim, pp:166-169.
[21] Nematollahi, D. Rafiee, M. and Fotouhi, L. 2009, Mechanistic study of homogeneousreactions coupled with electrochemical oxidation of
catechols. J.Iran.Chem. Soc., 6(3),pp:448-476.
[22] Miler, J. C. and Miller, J. N., 1988, Statistics for Analytical Chemistry ,2ndEd.,JohnWiley andN.Y.Sons. [23] Bluman ,A.G.1997,Elementary Statistics,3rd,Ed.,WCB/MC Graw-Hill, NewYork.
[24] Murdoeh J. and Barnes J.A.,1974, Statistical tables, 2nd Ed., Macmillan, p:8.
[25] British pharmacopoeia,2003, Published by the stationary office London.
Proph. Nagam S. Turkey Al-Awadi . “CFIA- Colorimetric assessment and photometric
determination of vitamin B9 (Folic acid)Using LEDs as a source of irradiation and two solar
cells as an energy transducer .” IOSR Journal of Pharmacy and Biological Sciences (IOSR-
JPBS) , vol. 12, no. 5, 2017, pp. 10–22.