51
Principles for Revising Subnational Public Finance Laws A Report by the Portuguese Public Finance Council 18 September 2012 Report No. 2/2012

Principles for Revising Subnational
Public Finance Laws
A Report by the Portuguese Public Finance Council
18 September 2012
Report No. 2/2012

The Portuguese Public Finance Council
Teodora Cardoso (Chair)
Jürgen von Hagen (Vice chair)
Rui Nuno Baleiras
George Kopits
Carlos Marinheiro
This publication is available for download at www.cfp.pt in both English and Portuguese languages.
TABLE OF CONTE NTS
LIST OF FIGURES ....................................................................................................................................... ii
LIST OF CHARTS ........................................................................................................................................ ii
LIST OF TABLES ......................................................................................................................................... ii
Corrigenda ............................................................................................................................................... iii
Executive Summary .................................................................................................................................. v
1. Introduction .................................................................................................................................... 1
2. The Assignment Problem in Designing Local Public Finances ......................................................... 2
2.1 Basic principles .............................................................................................................. 2
2.2 Political ownership and accountability ......................................................................... 4
2.3 Fiscal framework stability.............................................................................................. 4
2.4 Expenditure assignment ................................................................................................ 5
3. Revenue Assignment ....................................................................................................................... 6
3.1 Principles ....................................................................................................................... 6
3.2 User charges .................................................................................................................. 8
3.3 Government fragmentation ........................................................................................ 10
3.4 Subnational debt and sustainability ............................................................................ 11
4. Institutional and Economic Background of Portuguese Subnational Jurisdictions ....................... 13
5. Public Finance State of Play of Portuguese Subnational Governments ........................................ 15
5.1 Overall financial positions ........................................................................................... 15
5.2 Expenditures................................................................................................................ 16
5.3 Regional government revenues .................................................................................. 18
5.4 Local government revenues ........................................................................................ 18
5.5 Accounting at the subnational government levels ..................................................... 20
5.6 Data discrepancies ...................................................................................................... 21
6. Concluding Remarks ...................................................................................................................... 22
6.1 Accounting, reporting and monitoring ........................................................................ 22
6.2 Political ownership of subnational revenues and their uses ...................................... 23
6.3 Medium-term budgeting ............................................................................................. 24
References ............................................................................................................................................. 26
Appendix: Statistical Information .......................................................................................................... 29
A1. Figures ......................................................................................................................... 29
A2. Charts .......................................................................................................................... 31
A3. Tables .......................................................................................................................... 35

ii
LIST OF FIGURES
Figure 1—Resident population density (Inhab/Km2) in Portugal, by "concelhos", 2008 ___________ 29
Figure 2—Per capita purchasing power index in Portugal, by "concelhos", 2007 ________________ 30
Figure 3—Overall index of regional development (Portugal = 100), NUTS 3, 2008 ______________ 30
LIST OF CHARTS
Chart 1—Municipalities’ debt, 2006 to 2010 ____________________________________________ 31
Chart 2—Top-10 and Bottom-10 of municipal effective expenditure, 2009 ____________________ 31
Chart 3—Top-10 and Bottom-10 of per capita municipal effective expenditure, 2009 ___________ 32
Chart 4—Economic breakdown of municipal effective expenditure, 2009 _____________________ 32
Chart 5—Municipal effective expenditure, 2006 to 2010 __________________________________ 33
Chart 6—Municipal effective revenue, 2006 to 2010 _____________________________________ 33
Chart 7—Economic breakdown of municipal effective revenue, 2009 ________________________ 34
LIST OF TABLES
Table 1—Commitments to pay versus short-term debt: an illustration with Portuguese municipal data __________________________________________________________________ 35
Table 2—GDP per capita in 2009, Portuguese NUTS levels 1 and 2 regions ____________________ 35
Table 3—Geographic features of subnational administrations ______________________________ 36
Table 4—General Government consolidated account (cash basis), 2011 ______________________ 36
Table 5—Subnational balance and debt in national accounts, 2008 to 2011 ___________________ 37
Table 6—Own powers of the Autonomous Regions ______________________________________ 38
Table 7—Own powers of municipalities _______________________________________________ 38
Table 8—Statistical features of municipal total effective expenditure distribution, 2009 _________ 39
Table 9—Own revenue and transfers as % of total effective revenue: municipal distribution parameters, 2009 _______________________________________________________________ 39
Table 10—Municipalised Services' debt, 2008 to 2010 ____________________________________ 40
Table 11—Liabilities of the Local Enterprise Sector, 2009 and 2010 __________________________ 40
Table 12—Further examples of data discrepancies _______________________________________ 40

Corrigenda
The table below describes the errors that have been corrected since the preliminary version of the
document identified above was published. Page and paragraph numbers in the table refer to the
preliminary version. Editorial changes with no impact on text meaning are not listed.
Page No. Paragraph No. Where it was read It should read
Cover 3 Preliminary version—18 September
2012 18 September 2012
v 10 (trade debt and government frag-
mentation)
(debt to suppliers, government
fragmentation, exceptions)
7 1 assignment of individual taxes assignment of particular taxes
11 1 opportunities for hiding opportunities for neglecting
18 4 merely nine percent merely 14 percent
21 1 of which 94% of which 64%
21 1 trade debt represented trade debt (i.e., debt to suppliers)
represented
24 14 (trade debt and government frag-
mentation)
(debt to suppliers, government
fragmentation, exceptions to the
rule comprehensiveness)

Executive Summary
The Portuguese Government has announced its commitment to submit to the Parliament until the
end of 2012 draft laws on local public finance and regional public finance. A technical Working Group
has been created to propose the new legal instruments. In this Report, the Portuguese Public Finance
Council (CFP), which is represented at the Accompanying Commission branch of this group, aims at
providing the public at large and political stakeholders in particular with an updated synthesis of the
state of local and regional public finances, together with a set of economic principles that should help
framing the subsequent discussion on policy options by citizens and legislators.
Subnational governments play a crucial role in the economic development by providing a large varie-
ty of collective goods and services. Their fiscal responsibilities correspond chiefly to the allocative
function, which recommends a strong connection easily perceived by voters and taxpayers between
the quality and quantity of services they get and the resources they pay. In order to make that con-
nection, transparency of subnational public finances is of key importance. Furthermore, these are the
government levels where differences in economic conditions across jurisdictions are most visible.
Transfers from the central government to subnational governments are important to reduce the
consequences of the large differences across subnational economies and achieve an acceptable de-
gree of equity. Such transfers must be designed to preserve the incentives for good policies at the
local and regional levels and they must be stable and reliable to facilitate rational planning at these
layers of government. Finally, subnational governments should follow medium-term budgeting rules
to avoid financial distress and excessive debt.
By combining normative guidelines and empirical background, at least three critical areas for reform
emerge in this Report:
(1) Weaknesses and inconsistencies in subnational government accounting, reporting and moni-toring imply a low degree of transparency at these levels of government, which makes it hard to monitor fiscal developments, to hold subnational governments accountable for their per-formance and to disentangle responsible from irresponsible conduct.
(2) The strong dependence of subnational governments on transfers from the central govern-ment and the very narrow room for manoeuvre they have to adjust their revenues to chang-ing circumstances imply a lack of political ownership of subnational government revenues and their uses. As a result, the respective voters neither have the incentive nor the possibility to hold subnational policy makers accountable for their fiscal performance.
(3) Medium-term budgeting barely exists at the subnational levels. As a result, the consistency of local and regional public finances with Portugal’s commitment as a country to maintaining sustainable public finances is hardly assured and rational, forward-looking public sector man-agement is difficult at these government levels.
vi
Regarding the first area, sustainability requires that each unit of government run effective accounting
systems on both cash and accruals bases. In order to deliver the right information for sound, for-
ward-looking management decisions, and to monitor the compliance with fiscal rules in force, ac-
counting information should be i) consistent, ii) comparable across time and government units, iii)
comprehensive and iv) transparent. Current shortcomings recommend changes in the following di-
rections:
criteria harmonization—charts of accounts, including accounting rules and accompanying implementation handbooks, need some adjustments so as to minimise the margin for arbi-trary interpretation;
account consolidation across entities and government layers (including central administra-tion)—government fragmentation needs to be replaced by a comprehensive view of the en-tire set of entities held by each government unit (a municipality or a regional government): municipalised services, autonomous funds and services, local and regional companies. The idea is to evolve towards true consolidated accounts as has been the case of firms for many years;
data pooling—a unified public finance warehouse would minimise compliance costs for re-porting entities, improve transparency, reduce data discrepancies and facilitate analytical work by monitoring agencies, thus improving common knowledge on subnational public fi-nance. Conditional on results, this experience could later be expanded to the other public subsectors;
treasury account unification—with the aims of optimising the management of treasury sur-pluses or shortages and enabling the integrated control of cash flows by the top political level within each municipal or regional group, all entities making up such group should share an in-tegrated structure of banking accounts allowing for their consolidation.
An important prerequisite for maintaining sound public finances is that political constituents perceive
the exact cost of the public spending they benefit from and their own contribution to it. This helps to
align public with private preferences, induces greater accountability of incumbents to voters, and
reduces the margin for blaming funding difficulties at subnational levels on higher government levels;
as a result, the public budget constraint gets harder. Portuguese subnational governments rely heavi-
ly on transfers from higher government layers, which are important to reduce inequalities in the ac-
cess capacity to own resources due to the large degree of economic heterogeneity. But the resulting
high level of vertical imbalance may mislead subnational policy-makers and their constituents about
the true relative cost of public services, leading to a transfer system that lacks consistency with the
allocative function. To enhance the political ownership of subnational public revenues and their uses,
without increasing the national tax burden, the upcoming legal reforms might consider changes in
the following directions:
for municipalities o to increase the ceiling of the Variable Participation in the personal income tax (IRS) sub-
stantially (in exchange for lower central government transfers), at least for municipalities with fiscal capacity above a threshold to be determined politically;
o as an alternative to the current variable participation, to introduce a visible local sur-charge on the net IRS collection in exchange for a reduction in central government trans-fers;
vii
o to increase the taxpayers’ perception about the consolidated intertemporal local budget constraint by changing the layout of municipal tax invoices to display the municipality’s logo and basic numerical information on local public finance;
o to grant municipal parliaments some autonomy to set parameters in the transfer-like tax-es (on automobile and rural real estate ownership, for example);
o to consider a credible calendar to reassess the base of the rural real estate property tax; o to consider the elimination of the real estate transfers tax (IMT) so as to reduce the dis-
crimination of real estate against other assets not subject to a sales duty and to cancel any increases in the tax burden arising from the reassessment of property tax bases;
for regional governments o to increase regional discretion over tax parameters; o to partially replace transfers from the central government with own taxes; o to increase the visibility of own revenues before regional constituencies; o to consider lessons from the implementation of Madeira’s economic and financial ad-
justment programme.
It is important to reinforce a forward-looking stance of public finance management at the local and
regional levels of government. Stable fiscal rules embedded in a medium-term framework could
serve this purpose. Current laws already have fiscal rules but they need to be revisited. On the one
hand, they contain some loopholes (debt to suppliers, government fragmentation, exceptions). On
the other hand, they tend to be replaced every year by new centrally-imposed constraints, with the
result that discretion prevails over the rules. The strong bias towards annual budget management in
the current framework hides important intertemporal effects of fiscal decisions and, therefore, fails
to provide policy-makers and managers with a proper long-term outlook, consistent with the dynam-
ic public budget constraint. The budgetary framework law currently in place already sets a medium-
term framework for central administration (art. 12-D). This could be extended to the local and re-
gional subsectors, taking into consideration lessons from the on-going implementation and the CFP
recommendations in its Report of 21 May 2012.
The medium-term framework should contain rules for some fiscal indicators. Debt limits would help
each government unit to adopt fundable annual budgets (i.e., to secure financial sustainability). For
reasons spelled out in the Report, current debt service caps should be replaced by ceilings for the
stock of debt or the ratio of debt to revenues. A fully comprehensive debt definition should be im-
plemented, as the Eurostat criterion is insufficient. Spending limits defined for a fiscal cycle of several
years would serve the double purpose of helping to enforce fiscal discipline and to provide focal
points for a public debate over the size of government and its major activities. Generally, fiscal tar-
gets and limits should be mandatory, with deviations allowed only under well defined, exceptional
circumstances.
A medium-term budgeting framework with debt and spending limits would also strengthen fiscal
coordination across and within government layers. If the general government as a whole fails to
meet its targets under the European fiscal framework and faces penalties imposed on the country as
a whole, all government units failing their targets should be obliged to contribute to the penalty
viii
payment in proportion to their failures to meet the respective fiscal targets. Also, predefined adjust-
ment mechanisms for governments violating their fiscal discipline rules (see below) should be de-
signed so as to help the general government as a whole to restore its compliance with targets. This
approach would reward responsible behaviour, make failures at the country level less likely and im-
prove fiscal sustainability.
Finally, fiscal targets must be credible to be effective. They must come with both penalties for violat-
ing the targets and mechanisms of adjustment to bring governments back on track. While financial
sanctions against deviating from fiscal targets have been foreseen in the Portuguese public finance
laws for years, some rethinking of the effectiveness of the existing arrangements, under which finan-
cial penalties take the form of temporary withholdings of central government transfers to the rele-
vant subnational government, seems advisable. Predefined mechanisms of adjustment are necessary
to assure both the general public and the creditors that a speedy return to target will occur.
Other policy measures may be envisaged to solve the challenges in the above areas. Obviously, this
Report does not intend to exhaust the subject. With its publication, the CFP wishes to stimulate the
debate over the necessary changes and the appropriate policy options for their implementation.
1
1. Introduction
The Portuguese Public Finance Council (CFP) is responsible for undertaking an “independent assess-
ment of the consistency, compliance and sustainability of public finances and to enhance, through
increased transparency, the quality of democracy and economic policy decision-making”—article 4 of
Law No. 54/2011, of 19 October. The assessment of the financial condition of local and regional gov-
ernments is one of its tasks—article 6. The Government has announced its commitment to submit to
the Parliament until the end of 2012 draft laws on local public finance and regional public finance—
third review to the Memorandum of Economic and Financial Policies, MEFP (2012). A technical Work-
ing Group was set by the Government (Resolution No. 8/2012, of 13 February) to propose the new
legal instruments. CFP is represented at the Accompanying Commission branch of this group, whose
role it is to issue opinions and make recommendations on the proposals to be drafted by the Tech-
nical Secretariat branch.
More recently, the Government has stressed the need to adapt subnational finance laws to the
Budgetary Framework Law, which itself will also be subject to a review (see Ordinance/“Portaria” No.
103/2012, of 17 April). The Fiscal Strategy Document (DEO, 2012, p. 46) stated the will to cover mul-
tiple issues and made a specific reference to reducing government fragmentation and introducing
political responsibility mechanisms for financial decision-makers.
Under these circumstances, this Report aims at giving citizens at large and policy makers in particular
some guidance and information to consider in their decision-making process. At this early stage of
the debate, the CFP covers the relevant economic principles for structuring a sound public finance
environment for local and regional governments in Portugal. It also reviews the current institutional,
economic and fiscal realities of subnational jurisdictions.
By combining normative guidelines and empirical data, a number of critical areas for reform emerge.
This Report highlights three areas in particular:
(1) Weaknesses and inconsistencies in local and regional government accounting, reporting and monitoring imply a low degree of transparency at these levels of government, which makes it hard to monitor fiscal developments, to hold subnational governments accountable for their performance and to disentangle responsible from irresponsible conduct.
(2) The strong dependence of local and regional governments on transfers from the central gov-ernment and the very narrow room for manoeuvre they have to adjust their revenues to changing circumstances imply a lack of political ownership of subnational government reve-nues and their uses. As a result, local and regional voters neither have the incentive nor the possibility to hold their policy makers accountable for their fiscal performance.
(3) Medium-term budgeting is weak at the subnational levels. As a result, the consistency of subnational public finances with Portugal’s commitment as a country to maintaining sustain-
2
able public finances is hardly assured and rational, forward-looking public sector manage-ment is difficult at these government levels.
Many policy measures may be envisaged to solve the challenges in these areas. Obviously, this Re-
port does not intend to exhaust the subject. With its publication the CFP wishes to stimulate the de-
bate over the necessary changes and the appropriate policy options for their implementation.
The Report makes use of information available up until 16 July 2012. No further information on the
authorities’ intentions was known at this time. A first meeting of the CFP with the Technical Secretar-
iat is scheduled for next September.
The Report is organised as follows. Section 2 discusses the principles underlying the efficient alloca-
tion of public functions across government tiers. The need to finance the expenditure responsibilities
of subnational authorities is considered in Section 3, together with the normative guidelines that
help to structure the possible revenue tools. A bird’s eye view over Portuguese regional and local
economies and their institutional background is offered in Section 4, which helps to understand the
requirements and constraints of actual subnational public finance design. Section 5 offers a fiscal
state of play of local and regional governments, with an analysis of aggregate and individual data.
Section 6 concludes and proposes a number of policy options the political decision-makers may wish
to consider during the legal revision process. For the sake of space and arguments, most numerical
information is deferred to a statistical appendix. For the same reasons, the discussion in subsequent
sections refers explicitly to “local” governments and “local” constituencies but, unless otherwise
noticed, the arguments apply, mutatis mutandis, to “regional” authorities and electorates as well.
2. The Assignment Problem in Designing Local Public Finances
2.1 Basic principles
Following Musgrave’s (1959) famous classification, the three main economic functions of public fi-
nances are: stabilisation of the business cycle, redistribution of incomes and wealth, and allocation,
i.e., determining which and how much goods and services the public sector provides. The assignment
problem in public finance refers to the questions of which level of government should fulfil which of
these functions and which level of government should be responsible for collecting the revenues to
finance them. The basic approach to solving this problem is the fiscal equivalence principle (Olson,
1969).1 It says that the geographical incidence of the benefits of a public policy should coincide as
much as possible with the jurisdiction of the government operating and financing it.
Fiscal equivalence rules out both “externalities” and “internalities.” Externalities occur when some of
the benefits or costs of a policy fall on citizens of other jurisdiction(s). Assuming that it cares only for
1 Musgrave (1986) calls this the principle of reciprocity.
3
the welfare of citizens in its own jurisdiction, the government operating the policy would not take
such externalities into account and fail to achieve a welfare optimum for the country as a whole.2
Internalities occur when the benefits of a policy fall on the citizens of an area which is smaller than
the jurisdiction of the government administering it. In this case, those who benefit from the policy do
not fully pay for it and demand more of it than they would otherwise.3 If the government responds to
such demands, it again fails to achieve a welfare optimum. Thus, the exact correspondence of the
region benefitting from a program and the region paying for it assures efficient outcomes in the pro-
vision of public goods and services. Fiscal equivalence demands that public policies with important
regional externalities should be administered and financed by higher-level governments, while poli-
cies with no or small externalities should be administered by lower-level governments. The principle
establishes a preference neither for centralised nor for decentralised government per se. On the con-
trary, it implies that too much centralisation is just as inefficient as too much decentralisation.
It is generally recognized that macroeconomic stabilization should be assigned entirely to a country’s
central government. Similarly, redistributive policies aiming at a greater degree of economic equity,
such as those dealing with employment, health and pension insurance, are generally recognized to
belong to the central government. This leaves the broad range of allocative policies—reaching, for
example, from local roads to national highways and from local schools to universities— and the rev-
enue sources needed to finance them, which must be assigned to the local, regional and central lev-
els of government.
Many of the public goods and services considered under the assignment problem are produced with
significant economies of scale, i.e., unit costs are smaller if a larger number of citizens or a larger area
is served by the same provider. Economies of scale create a trade-off between increasing cost effi-
ciency due to a larger geographical area of incidence and decreasing allocative efficiency due to devi-
ations from fiscal equivalence and a balance of these two counteracting forces must be found.
The welfare gains fiscal equivalence seeks to achieve can only be reaped if governments at all levels
respond to the desires of their citizens regarding the quality and level of the provision of public goods
and services. This requires that politicians have sufficiently strong political incentives to deliver what
voters demand and voters must be able to judge the performance of their governments. Assignment
rules must be transparent and stable over time to create such conditions. Voters must understand
which policies are determined at which level of government and under what kind of financing and
administrative constraints. Otherwise, they cannot hold politicians accountable to the promises they
2 For example, if national defence were left to local government to organize, local governments would disre-
gard the fact that protecting themselves protects neighbouring cities. Some would spend too little, others would try to free-ride on big cities and there would be no hope to achieve an efficient level of national defence.
3 For example, if local infrastructure projects are paid for from the national budget, local citizens will overesti-
mate the economic return and demand more bridges and streets than they would otherwise.

4
make when running for election. Similarly, democratic accountability deteriorates, if the responsibili-
ties of subnational governments or their financial constraints change frequently.
2.2 Political ownership and accountability
Fiscal equivalence makes local governments responsible for local public goods and services and re-
gional governments for regional public goods and services. The close correspondence between those
who benefit from a local policy and those who pay for it strengthens the motivation of voters in local
elections to hold their local governments accountable for their performance in delivering public
goods and services. The fact that local governments are responsible for the provision of local public
goods and services to their local citizens promotes their political interest in high quality and efficien-
cy in this area. Thus, fiscal equivalence promotes political ownership of and democratic accountabil-
ity for the provision of local public goods and services.
In contrast, when most local public spending is the result of political decisions taken at some higher
level and local governments are merely executing these policies, they lose the incentive to do so
responsibly, knowing that they will not be held accountable for bad results, and voters lose the in-
centive to monitor the behaviour of local governments. Similarly, when local governments have no
control over their revenues and depend entirely on transfers from above, voters will see no connec-
tion between their tax bills and the provision of local public goods and services. Instead, they will
perceive local spending on such services as a free lunch and demand ever more of it, with ultimate
pressures on the higher-level government for larger transfers. Thus, it is important that local gov-
ernments have enough autonomy on both sides of their budgets. Mutatis mutandis, the same applies
to regional governments and regional constituencies.
2.3 Fiscal framework stability
Financial provisions for local governments that change frequently and at the discretion of higher
level governments make it hard for local governments to pursue consistent policies and achieve a
high degree of efficiency. The more higher-level governments intervene in local government budget
constraints and the more volatility they create in doing so, the more they weaken the incentives and
the capacity of local governments to conduct responsible and sustainable policies. Therefore, budget
constraints of subnational governments and the rules governing their development over time should
be clearly defined and foreseeable.
Furthermore, unstable local fiscal frameworks can lead to problems of soft budget constraints. If the
resources they receive from the central government change frequently and in unforeseeable ways,
local governments will be tempted to overspend their financial allocations when the latter are low
and then turn to the central government for additional resources, threatening to close down sensi-
tive public services unless they obtain more funds. The more financially dependent local govern-
ments are from the central government, the more they can take the central government hostage,
5
leaving it with no choice but to come forward with additional transfers. Thus, the dark side of volatile
and discretionary transfers from the central governments is the development of soft budget con-
straints at the local level. But soft budget constraints encourage local governments to regularly spend
beyond their initial budgetary allocations. A pervasive culture of soft budget constraints makes the
trade-off between the benefits and costs of public goods and services at the local level increasingly
irrelevant for local decision makers and their political constituencies, with the consequence of grow-
ing and increasingly inefficient spending at the local level. What seems to be a regime of tight central
government control over local finances turns into its opposite.
2.4 Expenditure assignment
The efficiency principle behind fiscal equivalence requires that public policies respond to the prefer-
ences of the citizens. In fact, the possibility of responding to differences in local preferences is a key
justification for the decentralisation of government. This view is the essence of Oates’ (1972) Decen-
tralisation Theorem, which says that, in the absence of externalities and economies of scale, decen-
tralized government in which local and regional governments provide different packages of taxes and
public goods and allow citizens to choose the combination they like best, cannot do worse than cen-
tralized government. In the presence of strong differences in local preferences over public goods and
services, decentralized government is likely to do much better than centralized government.4
Externalities create a trade-off between the efficiency gained by moving policies to higher levels of
government and the welfare lost by not responding to preference or cost heterogeneity at the local
level. The presence of economies of scale in the provision of public services leads to a similar trade-
off between adjusting to preference heterogeneity and reducing provision costs. As long as prefer-
ences are homogenous, economies of scale suggest assigning the policy to a higher-level jurisdiction
to exhaust all possible cost advantages. But if preferences differ, the welfare costs of uniformity can
exceed the efficiency gains from centralisation. This provides a criterion for deciding on the adequate
level of provision of public services. Taking into account externalities and economies of scale, this
argument leads to a version of the principle of subsidiarity which, for example, underlies the assign-
ment of public tasks in the European Union: public policies for which regional preferences are hetero-
geneous should be allocated to the lowest level of government that can provide these goods efficient-
ly.5
Since the upcoming reform of local and regional public finances in Portugal will focus primarily on the
revenues of subnational governments leaving expenditure assignment largely unchanged, we do not
want to dwell on this subject more than spelling out these principles.
4 Local idiosyncrasies in technology or input prices may also call for decentralisation of the allocative function.
5 Pisani-Ferry and von Hagen (2003).
6
3. Revenue Assignment
3.1 Principles
Fiscal equivalence demands that, at all levels of government, citizens are charged the full cost of the
public goods and services they receive. This suggests a decentralized system of taxation in which all
governments have enough own resources to cover their expenditures from taxes collected in their
own jurisdictions. This implies that local governments should not use taxes the incidence of which
falls outside their own jurisdictions such as corporate profit taxes. For example, a local tax on an
electrical power plant whose output is consumed in other jurisdictions does not qualify as an eligible
local tax because its burden is mainly borne by non-residents (tax export).
However, if tax payers are mobile, decentralized taxation entails important externalities: a reduction
in the tax rate set by one local government attracts tax payers from other jurisdictions. As a result,
the tax base and tax revenues of other local governments fall. The combination of tax payer mobility
and decentralized taxation thus exposes local governments to tax competition, which, in a race to the
bottom, may lead to excessively low tax rates and, as a result, insufficient quantities and quality of
local public goods and services everywhere. In addition, tax distortions arise if some tax bases are
mobile while others are not, and governments tax mobile factors less than immobile ones.
Furthermore, local governments should use taxes with revenues which are not too volatile over time,
as this would expose their budgets to region-specific economic ups and downs without the benefit of
stabilization. Local land and property taxes are probably the most preferable local taxes from this
perspective.
Finally, we must take into account the need to ensure the political ownership of revenues, which
requires local governments to have adequate decision-making power over levies visibly enough be-
fore the pockets of their constituents.
All these arguments recommend policy makers to find out an appropriate balance between the con-
flicting forces. The traditional response to these problems combines tax harmonisation among local
governments with vertical grants from higher to lower-level governments (Olson, 1969; Break, 1980),
along with the introduction of other own revenues, such as user charges. Limiting regional differ-
ences in tax rates reduces inefficient competition for tax resources. Vertical grants can be designed
to achieve a greater degree of horizontal equity among citizens in different local jurisdictions, reduc-
ing the differences between fiscal needs (the per capita local government expenditures necessary to
achieve a desired standard of public goods and services) and tax capacity (the potential per capita tax
revenues that can be collected at standard tax rates) and paying larger transfers to local govern-
ments in poorer regions. Furthermore, they can be designed to induce local governments to produce
public goods at cost-minimising levels.
7
Once this role of vertical transfers has been acknowledged, fiscal equivalence has no implications for
the assignment of particular taxes to specific levels of government at all. What matters is that each
government owns enough resources to finance the activities it is responsible for, in the sense that it
can make real choices regarding the goods and services it provides. Economies of scale in the collec-
tion and administration of taxes suggest assigning the responsibility for tax collection to the central
government but they are entirely compatible with assigning local governments some autonomy to
set tax parameters, such as rates and exemptions.
Vertical transfers from the central government to local governments raise a number of issues. First,
they can be designed as unconditional (block) grants calculated on a per capita basis for the residents
belonging to each local jurisdiction, or as conditional grants requiring the local government to under-
take the provision of certain goods or services. Block grants allow local governments to choose their
optimal combination of public goods and services in accordance with the preferences of their citi-
zens. In contrast, by paying conditional grants the central government induces the local governments
to provide more of a certain public good or service which they consider less desirable than the cen-
tral government.
Second, conditional grants can be designed as matching or non-matching grants. In addition to rais-
ing the local government’s total revenues, matching grants change the relative cost of the public
good or service in question, which can be used to compensate the local government for positive ex-
ternalities benefitting other local governments. However, a wide-spread use of conditional grants
implies a large degree of intervention of the central government into the choices of local govern-
ments with the result that the latter lose political ownership of and accountability for the policies
they implement. This becomes even more problematic if the conditions are defined in terms of in-
puts into a given policy rather than outputs. For example, an input-based conditional grant might
subsidize the number of teachers in a city, while an output-based grant would pay a subsidy based on
the number of successful graduates from its schools, leaving the local government the choice of how
many teachers and other personnel are needed to achieve this goal. Input-based conditional grants
weaken the local government’s interest in and accountability for efficient provision of public goods
and services.
Assigning the responsibility for tax collection to the central government while keeping the responsi-
bility for the provision of many public goods and services at the local level implies a large degree of
vertical imbalance, i.e., lower-level governments become financially very dependent on the central
government. This is indeed true in many unitary states. Such a high degree of vertical imbalance can
have important negative consequences. On the one hand, it can destroy the principle that citizen-
voters pay for the services they receive, thereby reducing transparency and political accountability.
On the other hand, it can make local governments too dependent on the discretion of the central
government and weaken their political ownership of and accountability for the policies they pursue.
Vertical transfer systems should be designed in a way that preserves transparency, political owner-

8
ship and democratic accountability of local governments as much as possible. On this respect, trans-
fer programmes should not disincentive beneficiary governments to resort to own revenues.
Furthermore, international experience suggests that a high degree of vertical imbalance invites stra-
tegic behaviour on the part of the local governments. Local governments may be tempted to over-
spend their budgets and then turn to the central government for more transfers. Clearly, the less
own resources local government have (as a percentage of total expenditure), the more effectively
they can threaten the central government with closing down essential and highly politically sensitive
local services – such as local schools or hospitals – and the central government may be unable to
refuse additional transfers for fear of the political consequences of closing down such services. Thus,
a high degree of vertical imbalance may result in “soft budget constraints” at the local level, which
invite irresponsible fiscal behaviour. A sufficiently strong own revenue base of local governments
together with the possibility to adjust tax rates and other parameters at the local level protects the
central government against the emergence of soft budget constraints and preserves the accountabil-
ity of local governments for their fiscal performance to the respective voters.
3.2 User charges
User charges are the most faithful illustration of the fiscal equivalence principle on the revenue side.
They can be imposed on all goods and services where the operator can physically prevent the access
of an individual user—if payment is not received, service is not delivered. Piped water delivery and
museum entrances are good examples of such services. However, there are services where it is hard
or even technically unfeasible to restrain the consumer’s access. Street cleaning and street lighting
are examples. Individual consumption levels are not observable and the provision costs cannot be
charged to individual users as a result.6 User charges help promoting efficient resource allocation
inasmuch as they give municipal and regional managers information about the demand for subna-
tional public goods and services.
Surprisingly perhaps, many services typically provided by local governments throughout the world do
not meet the non-rivalry in consumption property of public goods. Indeed, some of the most visible
local services look very much like private goods. Piped water and gas distribution, car parking lots,
housing and primary education are prominent examples. Several kinds of market failures can justify
government intervention in such cases. First, substantial scale economies preclude competition in
the distribution of piped water, gas, or electrical power, causing local authorities to run these ser-
vices directly or to regulate their private operation. Second, important externalities may be at stake.
6 Technical progress changes over time the set of goods subject to consumers’ excludability. Some years ago,
physical tolls were necessary to make highways such a good. The unfeasibility of physical tolls on urban streets prevented their direct financing by car drivers. Nowadays, electronic metering and payment of car passages can be applied to virtually any road segment, such as an urban street, thus enforcing payment as the facility is used.

9
For example, the under provision of piped water, garbage collection, sewage and similar services may
result in the spread of diseases. Here, a concern for public health makes society willing to pay more
for the provision of such services than individual consumers. Similarly, society as a whole benefits
from primary education over and above the private benefit of each pupil, which justifies public inter-
vention. In these cases, public provision amounts to public production of inherently private goods or
the public regulation of their private production. Either way, local governments get involved in pric-
ing these goods and services.
It is essential to bear in mind that there is a right price or user charge for goods and services when
consumers are excludable. Efficient pricing requires that the user charge equals the marginal cost of
producing the good or service under consideration. Consumers then individually choose their optimal
levels of consumption such that the user charge equals the marginal benefit they enjoy.
When consumers are not excludable, all consumers are by definition provided with the same quanti-
ty of the good or service. Efficient resource allocation requires choosing the quantity for which the
marginal cost of providing the good or service equals the sum of the marginal benefits of all consum-
ers.7 If each consumer pays a charge exactly equal to the marginal benefit she derives from the effi-
cient quantity, the resulting revenue matches total cost. This optimal pricing rule is known as Lindahl
taxation. However, it is difficult to implement in practice, since consumers have every incentive to
understate their marginal benefits to pay a lower user charge.8 In view of this, uniform user charges
have to be set for all consumers such that the full cost of production is recovered.9
Local and regional authorities often introduce redistributive criteria into the setting of user charges.
Take Lisbon piped water pricing as an illustration. The charge for each m3 per month evolves as fol-
lows: € 0.1929 for the first 5 m3, € 0.6338 between 6 and 20 m3, € 1.4650 between 21 and 25 m3, and
€ 1.8380 above 25 m3.10 The underlying motivation is that wealthier households consume more wa-
7 This is known as the Samuelsonian rule for the efficient output determination in the case of a public good.
8 This problem is not exclusive to user charges. In general, any tax system whose individual rates are based on
the willingness to pay fail sto reveal the true demand for non-rival goods—Barbosa (1997), pp. 61–63.
9 Specific goods or services may present particular challenges, such as scale economies and externalities, whose
adequate consideration in terms of pricing requires detailed analysis and additional recommendations. There is a vast literature on these issues. On transportation, see Button (1993), Fisher (1996), Ch. 19 and, for a spatial economics approach, consult Pontes (2001); on education, see Fisher (1996), Ch. 19; on urban water services, see Bahl and Linn (1992), Ch. 10; on air traffic control, see Bryant (1996) for a newspaper account of changes in US charging; on electricity, telephone services, social housing, and collection and disposal of solid waste, see Bahl and Linn (1992), Ch. 11; on health care in developing countries, see Tibandebage (1999); on roads and
rural transport infrastructure, with an emphasis in developing countries, see Calvo (1998) and Heggie and
Vickers (1998).
10 Price structure in force in June 2012 for common household consumers, value added tax (VAT) included.
Prices are higher for business customers. Recently, the service provider introduced an additional tariff structure that adjusts the price for the size of the household while keeping a progressive block structure. There is also a monthly flat rate per size of meters (ranging from 4.10 euros for a 15 mm calibre to 2,064.29 euros for a 300
10
ter than poorer ones and so the above charge structure acts like a progressive tax. However, house-
hold water consumption may be a weak proxy for income. A family of eight poor people may con-
sume more than a family of two wealthy people. Furthermore, income distribution is inherently an
interpersonal income allocation matter and should not be mixed with the issue of providing public
goods and services. If the political aim is to redistribute income, governments should redistribute
income, using the appropriate policy instruments such as social security measures.
As indicated in Section 2, income redistribution should not be assigned to local or regional govern-
ments. In addition, the redistributive capacity of user charges on typical local public services is very
low, since they account for a very small fraction only of household expenditures. For example, in a
survey of large cities in developing countries, the share of piped-water charges in household expend-
itures was shown to be below three per cent in most low-income households.11 With such small tariff
burdens, the equity gain of tariff reductions for the poor is rather low, while the efficiency loss can be
significant.
3.3 Government fragmentation
Over the last two decades, a growing number of governments at all levels have set up specialised
entities to undertake the provision of particular goods and services. From bureaucratic bodies em-
powered with administrative, financial and asset autonomy to companies fully owned by a govern-
ment unit, to concessions partially or fully granted to private partners, to public, private or mixed
property foundations, a vast array of institutional solutions now exists in many countries. This variety
is often called government fragmentation. Quite frequently, central governments pioneered this
route but regional and local governments rapidly followed the lead.
From an efficiency point of view, there are good and bad reasons for delegating public functions to
such entities. The operational requirements of public provision, even in the case of most public
goods, parallels very much those faced by private provision. Focus on customers, flexibility to con-
tract in goods and factor markets, accrual accounting with rigorous monitoring of cost and revenue
centres, capacity to attract and retain talented workers, all these elements are easier to implement
in firm-like organisations than in a traditional civil service unit.
mm calibre, in the case of household consumers).The water consumption in Lisbon is also used as a proxy for sewerage use. Hence, two additional, uniform rates are included in piped water invoices: a monthly flat rate of 0.3151 euros per m
3 and a daily rate of 0.0410 euros. The central government uses the water invoice to charge
an environmental tax of 0.0294 euros plus VAT earmarked for regional water basin management.
11 Shares decrease as household income rises. The data were computed by K. Hubbel and are quoted in Bahl
and Linn (1992). The surveyed cities were São Paulo (Brazil), Bogotá and Cartagena (Colombia), Addis Ababa (Ethiopia), Kingston (Jamaica), Nairobi (Kenya), Seoul (Rep. of Korea), Mexico City (Mexico), Lima (Peru), Manila (Philippines), and Bangkok (Thailand). Although dated (period 1970–1972), the figures provide “a good indica-tion of the order of magnitude and degree of variation commonly observed”—Bahl and Linn (1992), p. 286, footnote 1.
11
For the purpose of this Report, what matters are the implications of this development for the sus-
tainability of subnational public finances. On the positive side, delegating activities away from tradi-
tional administration units may lead to lower provision costs as a result of a more efficient organisa-
tion. The presence of different operators doing the same thing for different geographies and disclos-
ing public information about their operations provides benchmarks to assess best practices. Compe-
tition, at least for the award of a concession, may help to offer consumers better commercial deals.
On the negative side, the resulting fragmentation of government can reduce the transparency of
public finances, especially when the newly created entities are not fully included in the accounts of
the governments operating them. This creates opportunities for neglecting public sector deficits and
debts which undermines the effectiveness of deficit and debt limits and makes monitoring the fi-
nances of the general government sector more difficult.
3.4 Subnational debt and sustainability
The fiscal equivalence principle implies that expenditures whose benefits are spread over many years
and whose costs are concentrated in the first few years should not be financed entirely out of cur-
rent taxes. Future tax payers should contribute to their financing. This can be achieved by financing
part of today’s expenditures with public debt. A bridge, for example, requires capital expenditures
during the construction phase and delivers services for many years afterwards. Future generations
will benefit from it and, therefore, should pay for part of it. Otherwise, current tax payers will resist
public capital expenditures, resulting in under-provision of public investment. This reasoning leads to
the golden rule of public finance—e.g., Eichengreen and von Hagen (1995), p. 30—according to which
public debt should be used to finance public investment spending but not current expenditures
which mainly generate benefits today alone. Although this rule is rather coarse in practice, as some
current expenditures, such as teachers’ and doctors’ salaries, have long-term benefits, too, it yields a
useful guideline for financing decisions. In practice, it requires a rigorous definition of capital expend-
itures, which is not simple and is subject to accounting manipulation.
Arguing that local public investment should be partly financed by debt is not the same as arguing that
local governments should be allowed to issue debt in their own right, since the central government
might borrow on their behalf. This would make sense especially if the central government, due to its
larger size and the greater stability of its tax base, can borrow at better terms than local govern-
ments. One might think that it would be useful to subject local governments to the disciplinary forces
of financial markets. However, local governments are often too small to issue bonds at reasonable
terms, and experience shows that borrowing through (local) banks results in much weaker discipline
than borrowing through competitive bond markets. If the central government borrows on behalf of
local governments, it should charge them the same interest rate it has to pay itself. Subsidizing local
borrowing by the central government will lead to excessive local public investment and, ultimately,
too much borrowing by the central government.
12
Whether or not local governments should be allowed to borrow in their own right is also a question
of fiscal governance. On the one hand, local governments can use debt strategically to extract more
resources from the central government. They may run up debts which they are unable to pay back
given their own tax resources and force the central government to bail them out. The less own re-
sources local governments have and the less discretion they have over the parameters of their reve-
nues and expenditures, the less the central government can deny bailouts to local governments in
financial distress and hold them accountable for their fiscal profligacy, and the more restricted local
governments should be in their ability to borrow. On the other hand, restricting local public debt
requires not only formal debt limits but also tight monitoring of local public accounts to assure that
local governments do not accumulate hidden debts through payment arrears and off-budget entities.
If local governments are allowed to borrow in their own right, institutional rules and mechanisms
should exist to rectify situations of excessive borrowing and hold the local governments accountable.
For example, under chapter 9 of the U.S. Bankruptcy Code municipal governments can be put under
a form of receivership and protection against their creditors similar to private corporations. In Ger-
many, cities with excessive debts can be put under the financial and administrative control of their
state governments, depriving the mayor and the city council of their executive powers.
Local economies and the tax bases of local governments’ are necessarily more volatile than the na-
tional economy and the central governments’ tax base. This implies that local government borrowing
must adhere to stricter standards of prudency than central government borrowing. Inadequate con-
trol over spending aggregates or unrealistic revenue forecasts ultimately end up on debt stock in-
creases.
Take the case of arrears in public procurement payments. Invoices corresponding to goods or ser-
vices delivered to a government unit stand unpaid after the overdue date and add to short-term
debt. Although there may still exist some reliability problems with accrual accounting in Portuguese
municipalities, it is interesting to note the high correlation and large proximity between unpaid
commitments and short-term debt in Table 1. This is a problem found typically in government units
lacking important features of sound fiscal management. At least four reasons seem to favour the
emergence of payment arrears. First, fiscal decision-making procedures that fail to acknowledge in-
tertemporal budget relations. If a trade order in placed in year t with due date in year t+1 is not ac-
counted for at the time when the payment commitment is assumed (i.e., year t), it is likely to land as
a surprise in next year’s implementation when the invoice is presented for payment. Failure to re-
serve enough cash in year t+1 to honour the previous commitment triggers an arrear.
Second, even when there is a record of previous payment commitments, there may be failures to
reserve adequate funding, if it is not integrated within the accounting software. This is typically the
case of accounting systems that operate on a cash basis only. Ideally, all government units should
adopt accounting rules enabling full integration of cash and accrual accounting. Both provide useful
information and together they give managers and policy-makers an insightful view of the dynamic

13
fiscal interactions. Differences between the two perspectives can be substantial. For example, ac-
cording to Carvalho et al. (2012, p. 71), payments in 2010 by all Portuguese municipalities amounted
to 7.9 billion euros, whereas commitments in that year were 10.7 billion euros.
Third, the absence of multi-annual expenditure ceilings reduces managers’ and politicians’ attention
to monitor unpaid commitments.
Fourth, even when fiscal rules such as limits for expenditure, deficit, or debt exist, there may be slip-
pages, if the definition of the relevant budgetary aggregates is incomplete. For example, a debt limit
that does not include bills unpaid by governments creates an incentive for them to accumulate ar-
rears as a form of debt which would be prohibited otherwise. European experiences with creative
accounting since the beginning of the euro suggest that this is a widespread problem in most coun-
tries (von Hagen and Wolff, 2006).
Finally, if local governments are allowed to borrow in their own right, they should share in the re-
sponsibility for national obligations regarding limits on public debt. In Poland, for example, local gov-
ernments are not allowed to increase the local budget deficit relative to local revenues, if the coun-
try’s aggregate debt-to-GDP ratio exceeds 50 percent. In Germany, state governments are subject to
a rule balancing the budget over the business cycle in the same way the central government is. This
assures that subnational government debt does not undermine the central government’s efforts to
comply with international obligations.
4. Institutional and Economic Background of Portuguese Subnational Jurisdictions
There are two tiers of subnational government in Portugal. The regional tier consists of the two ar-
chipelagos, Azores and Madeira, through a political authority on each, directly elected and with juris-
diction over the respective territory. The local tier comprises four levels: districts, supra-municipal,
municipal and parochial. The first is under extinction and the second is formed by voluntary clubs of
municipalities. Their finance and responsibilities emanate very much from the participating munici-
palities. The political bodies of these associations are made of municipal politicians. Only municipali-
ties and parishes have their political representatives directly elected.12 There are 308 territorial units
(“concelhos”) subject to municipal jurisdiction, of which 278 are on the mainland and 30 on the two
archipelagos. The following paragraphs highlight some important economic facts of local and region-
al jurisdictions, as the economy constrains substantially the range of viable public finance configura-
tions. Statistical data referred to in this and the following sections are documented in the Appendix.
12 For the year 2000, Baleiras (2005) estimated the following shares of each level on total local consolidated
expenditure (revenue): 0.02% (0.01%) for districts, 7.76% (4.41%) for parishes, and 92.22% (95.58%) for munic-ipalities. Substantial changes over time on these weights are not expected. So, the municipal tier is the local government layer this Report focuses on.

14
Table 2 reports per capita GDPs for Portuguese NUTS-213 regions. There is a considerable degree of
heterogeneity across regions. Per capita GDP ranges from € 12,600, or 64 percent of the EU-27 aver-
age, in the Norte region to € 22,300, or 112 percent of the EU-27 average, in the Lisbon region. The
geographical features suggest how physical heterogeneity goes hand in hand with economic asym-
metries, particularly as we move downwards along territorial disaggregation. In Table 3, we see how
population across NUTS-2 regions varies a lot, too, with 3.75 million individuals in the Norte region
but only 0.76 and 0.43 million in Alentejo and Algarve, respectively. Populations are even smaller in
the archipelagos, with nearly 0.25 million on each. Population density, an important variable for ag-
glomeration effects and economies of scale, both in economic development and in the provision of
many public services, ranges from 23.8 people per km2 in Alentejo to 944.5 people per km2 in Lisbon.
Moving down to the level of “concelho”, Figure 1 illustrates the distribution of population density
across Portugal. There are 106 “concelhos” with a population density below 40% of the mainland
average of 113.8 individuals. These locations amount to 60.5% of the mainland surface and house
only 10.8% of the aggregate population of 10.1 million residents. 58 “concelhos” have less than 20
inhabitants per km2; they are mainly located in the northeast, along the border with Spain or all over
the Alentejo region. Most “concelhos” in Azores and Madeira are of this nature too, although the
regional averages there are relatively high (105.4 in Azores and 308.5 in Madeira). This spatial demo-
graphic asymmetry translates into an economic asymmetry as well. Jobs are fewer and less qualified
in low population-density territories and, not surprisingly, incomes per capita are lower.
Figure 2 shows the distribution of purchasing power per inhabitant.14 Purchasing power is smaller in
central and northern mainland, where 19 “concelhos” are below 50% of the national average. The
(unweighted) purchasing power mean in the 106 “concelhos” below 40% of the mainland population
density corresponds to 64.0 % of the national average. The role of urbanisation is evident, with high-
er per capita purchasing power in district capital cities (marked in the map) and, of course, in the
metropolitan areas of Lisbon and Oporto. The more urbanised “concelhos” in Azores and Madeira
also outperform the average but clearly not as much as in terms of population density.
Finally, Figure 3 indicates the regional distribution of the overall level of economic development.
Economic development is measured by a synthetic indicator—the Regional Development Composite
Index (ISDR)—which weighs equally three development dimensions: competitiveness, cohesion and
13 “Nomenclature of Territorial Units for Statistics” classifies the EU territory into regions at three different
levels of aggregation. 14 Purchasing power is a proxy for private spending at the “concelho” level; it is a composite indicator produced
by the official statistical office of Portugal (INE—Statistics Portugal) out of a factor analysis model and combin-ing variables correlated with income, such as taxable income, amount of ATM cash withdrawals, housing mort-gage loans, expenditure on restaurants and number of registered motor car ownerships. The national (main-land plus archipelagos) average is normalised to 100 and Figure 2 depicts each “concelho” per capita purchas-ing power as a percentage of the national average. See more data and methodological details at Statistics Por-tugal (2009).
15
environmental quality.15 Life quality, or economic development, in one place is higher the more
competitive, cohesive and environmentally sound the site is and this is what ISDR aims at measuring.
Three regions only (NUTS level 3) stand above the national average: Grande Lisboa, Pinhal Litoral and
Minho-Lima, all along the coastline. However, contrary to conventional wisdom, there is no clear
coast-border asymmetry in the mainland. Intermediate development cases are found in border terri-
tories in Centro and Alentejo, along with Algarve, as well as in regions close to the ocean. The most
problematic cases lie in the Azores archipelago, Northern interior (Tâmega, Alto Trás-os-Montes and
Douro) and Central interior (Pinhal Interior Sul and Pinhal Interior Norte).
5. Public Finance State of Play of Portuguese Subnational Govern-ments
5.1 Overall financial positions
Table 4 compares the 2011 aggregate finances of regional and local governments to general govern-
ment finances. Taken together, regional and local governments accounted for 13 percent of effective
revenues and 12 percent of effective public spending of Portuguese general government. Within the
subnational sector, all local governments together are much larger than the two regional govern-
ments; they account for 75 percent of subnational government effective revenues and 74 percent of
subnational government effective expenditures.16 In 2011, regional and local governments had bal-
anced budgets on aggregate.
Table 5 reports the aggregate annual net lending of regional and local governments based on accru-
als rather than cash accounting as in Table 4. Of the two regional governments, Madeira had moder-
ate deficits in 2008 and 2009 and quite large deficits in 2010 and 2011.17 As a result, Madeira’s public
debt increased to € 3.7 billion in 2011. In contrast, the regional government of Azores maintained
budgets close to balance over this period and, with € 0.7 billion, a much lower level of debt. Accord-
ing to the same table, the aggregate deficit of local governments peaked at € 922 million in 2009 and
15 See Stiglitz et al. (2009), for example, on the importance of departing from GDP to complementary measures
of economic performance. Each dimension in the ISDR is itself a synthesis of several indicators. Territorial com-petitiveness aggregates the impact of variables that contribute to market shares of activities located in the territory (human capital endowment, advanced infrastructure level, agglomeration economies, etc.). Territorial cohesion measures the population access to goods and services provided out of collective facilities (health, education, water, sewerage, mobility) and social inclusion (ethnical integration, unemployment, crime, income inequalities, longevity). Finally, the environmental quality index intends to express the quality and sustainability of natural resources use (air, soil and noise pollutant emissions, water quality, ecological reserve areas, energy efficiency). The unweighted average of the three partial indices provides an overall assessment of each region’s state of economic development. The ISDR and the evolution of all partial indices are described in Vala and Pinho (2001).
16 Data for seven municipalities are missing in Table 4 but they are too small to change these shares.
17 These high deficits reflect mostly item reclassifications (of unrecorded expenditure in previous years and of
guaranteed debt to regional enterprises).
16
then turned quickly into a surplus of € 420 million in 2011. Thus, local governments achieved a fiscal
adjustment of 19 percent of 2011 effective revenues in just two years. Nevertheless, local govern-
ments had built up a considerable stock of debt reaching € 5.7 billion by the end of 2011.
Chart 1 shows the development of aggregate debt at the local level from 2006 to 2010 and its com-
position by maturity. In 2006, two thirds of municipal debt was medium to long term. By 2010, this
share had fallen to 62 percent. Indeed, short-term debt shows a substantial growth of 44% until
2010, against 15% for medium-and long-term debt. This is in line with earlier indications about ar-
rears. On this point, the CFP recommends the national authorities to study how debt affects large
and small municipalities. Remembering the correlation between size and prosperity of municipalities
pointed out above, it is not indifferent (in terms of financial sustainability) to conclude that the per
capita debt amount or the share of debt on revenues is larger the smaller the municipality is because
access to own revenues to pay debt back is very unevenly distributed. This remark is very important
for sustainability reasons. Also, it may be very useful to understand how effective the current ar-
rangements have been to deal with local governments in financial distress. Lessons from this analysis
may provide hints to reinforce the incentives of local administrations to regain and maintain sustain-
able financial positions.
5.2 Expenditures
Table 6 presents the policy areas for which regional governments are responsible. Broadly speaking,
they have legislative autonomy over their jurisdictions on almost all expenditure areas. Spending
responsibilities are assigned in the Constitution and the Politico-Administrative Statute of each re-
gion—EPA-A (2009) for Azores and EPA-M (1999) for Madeira. The assignment of responsibilities to
the regional governments generally conforms to what one would expect from economic principles.
The expenditure assignment of municipalities is summarised in Table 7. Broadly speaking, the alloca-
tion of expenditure responsibilities again corresponds to economic principles. Local governments are
solely responsible for some expenditure domains (primary education buildings, urban road network,
etc.) whereas in other areas responsibilities are shared with either regional or central authorities.18
Chart 2 illustrates the distribution of public spending across concelhos, by showing the top 10 and
the lowest 10 local governments in 2009. Heterogeneity is large across the entire distribution. With €
626 million, Lisbon had the highest amount of public spending, more than six times that of the 10th
largest local government, Matosinhos. The lowest level of spending was € 1.5 million in Corvo. The
relative differences among the lowest ten concelhos are somewhat smaller than that among the top
ten.
18 Comprehensive information on expenditure assignment can be found in Baleiras (2009, pp. 755–760).
17
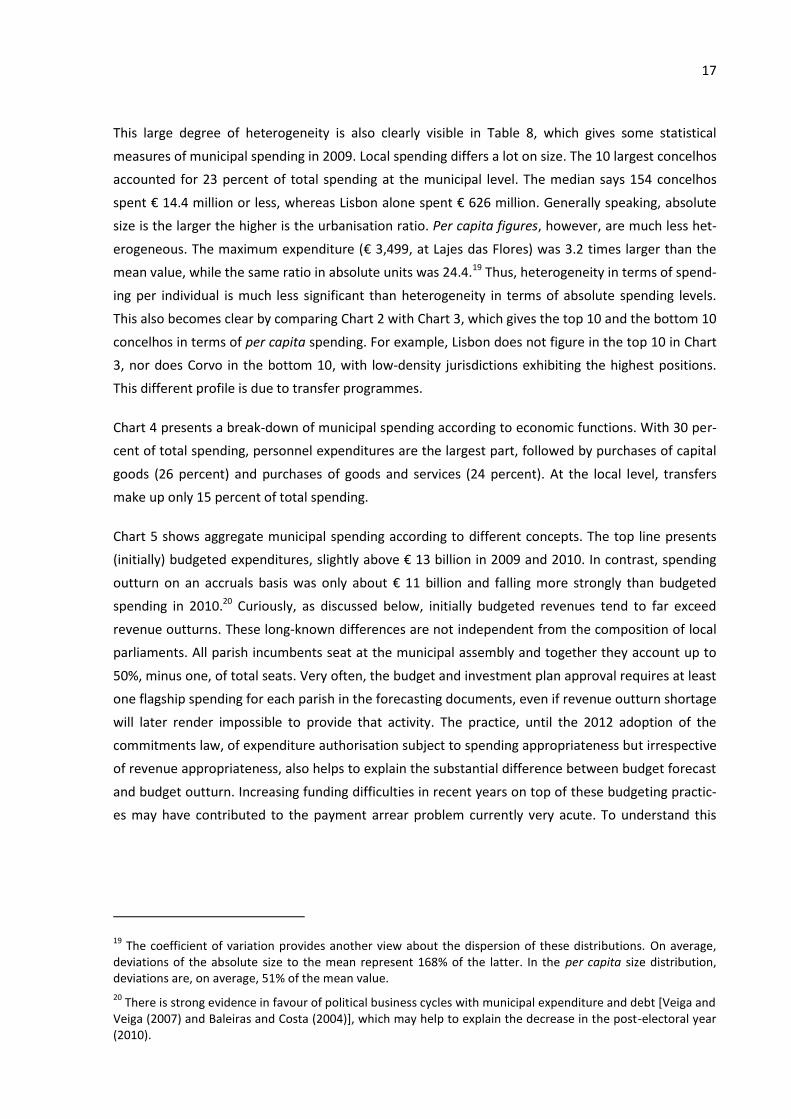
This large degree of heterogeneity is also clearly visible in Table 8, which gives some statistical
measures of municipal spending in 2009. Local spending differs a lot on size. The 10 largest concelhos
accounted for 23 percent of total spending at the municipal level. The median says 154 concelhos
spent € 14.4 million or less, whereas Lisbon alone spent € 626 million. Generally speaking, absolute
size is the larger the higher is the urbanisation ratio. Per capita figures, however, are much less het-
erogeneous. The maximum expenditure (€ 3,499, at Lajes das Flores) was 3.2 times larger than the
mean value, while the same ratio in absolute units was 24.4.19 Thus, heterogeneity in terms of spend-
ing per individual is much less significant than heterogeneity in terms of absolute spending levels.
This also becomes clear by comparing Chart 2 with Chart 3, which gives the top 10 and the bottom 10
concelhos in terms of per capita spending. For example, Lisbon does not figure in the top 10 in Chart
3, nor does Corvo in the bottom 10, with low-density jurisdictions exhibiting the highest positions.
This different profile is due to transfer programmes.
Chart 4 presents a break-down of municipal spending according to economic functions. With 30 per-
cent of total spending, personnel expenditures are the largest part, followed by purchases of capital
goods (26 percent) and purchases of goods and services (24 percent). At the local level, transfers
make up only 15 percent of total spending.
Chart 5 shows aggregate municipal spending according to different concepts. The top line presents
(initially) budgeted expenditures, slightly above € 13 billion in 2009 and 2010. In contrast, spending
outturn on an accruals basis was only about € 11 billion and falling more strongly than budgeted
spending in 2010.20 Curiously, as discussed below, initially budgeted revenues tend to far exceed
revenue outturns. These long-known differences are not independent from the composition of local
parliaments. All parish incumbents seat at the municipal assembly and together they account up to
50%, minus one, of total seats. Very often, the budget and investment plan approval requires at least
one flagship spending for each parish in the forecasting documents, even if revenue outturn shortage
will later render impossible to provide that activity. The practice, until the 2012 adoption of the
commitments law, of expenditure authorisation subject to spending appropriateness but irrespective
of revenue appropriateness, also helps to explain the substantial difference between budget forecast
and budget outturn. Increasing funding difficulties in recent years on top of these budgeting practic-
es may have contributed to the payment arrear problem currently very acute. To understand this
19 The coefficient of variation provides another view about the dispersion of these distributions. On average,
deviations of the absolute size to the mean represent 168% of the latter. In the per capita size distribution, deviations are, on average, 51% of the mean value.
20 There is strong evidence in favour of political business cycles with municipal expenditure and debt [Veiga and
Veiga (2007) and Baleiras and Costa (2004)], which may help to explain the decrease in the post-electoral year (2010).
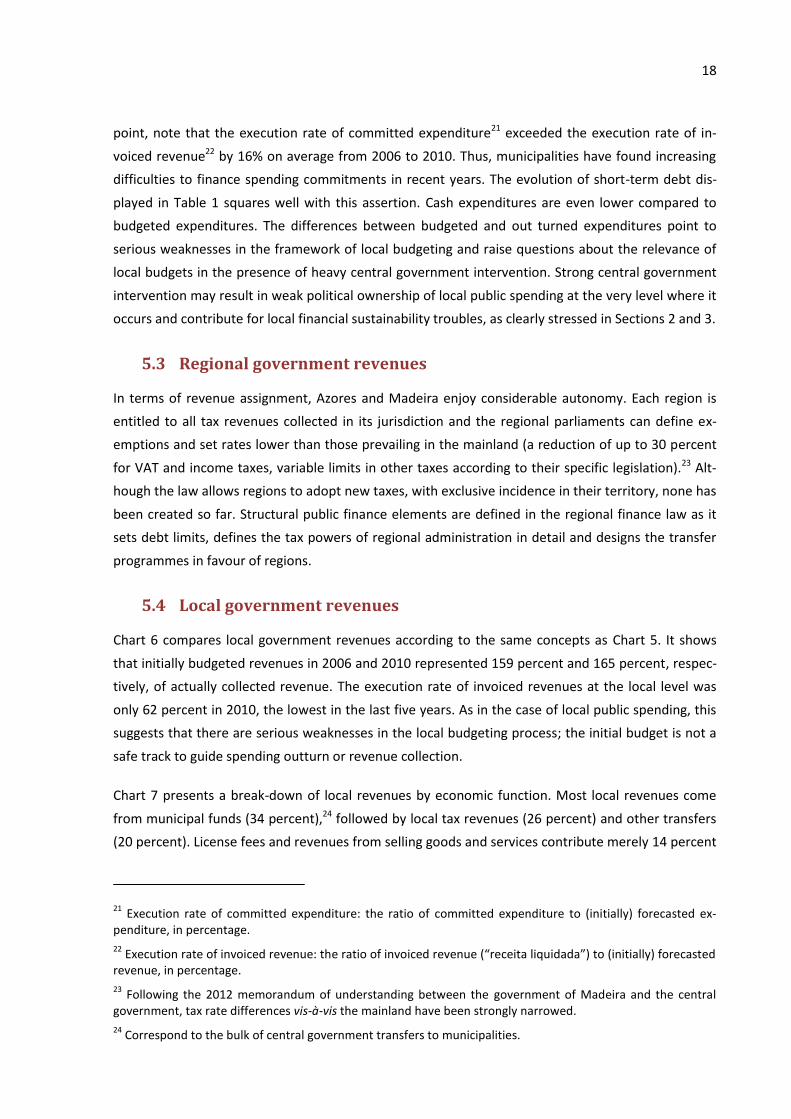
18
point, note that the execution rate of committed expenditure21 exceeded the execution rate of in-
voiced revenue22 by 16% on average from 2006 to 2010. Thus, municipalities have found increasing
difficulties to finance spending commitments in recent years. The evolution of short-term debt dis-
played in Table 1 squares well with this assertion. Cash expenditures are even lower compared to
budgeted expenditures. The differences between budgeted and out turned expenditures point to
serious weaknesses in the framework of local budgeting and raise questions about the relevance of
local budgets in the presence of heavy central government intervention. Strong central government
intervention may result in weak political ownership of local public spending at the very level where it
occurs and contribute for local financial sustainability troubles, as clearly stressed in Sections 2 and 3.
5.3 Regional government revenues
In terms of revenue assignment, Azores and Madeira enjoy considerable autonomy. Each region is
entitled to all tax revenues collected in its jurisdiction and the regional parliaments can define ex-
emptions and set rates lower than those prevailing in the mainland (a reduction of up to 30 percent
for VAT and income taxes, variable limits in other taxes according to their specific legislation).23 Alt-
hough the law allows regions to adopt new taxes, with exclusive incidence in their territory, none has
been created so far. Structural public finance elements are defined in the regional finance law as it
sets debt limits, defines the tax powers of regional administration in detail and designs the transfer
programmes in favour of regions.
5.4 Local government revenues
Chart 6 compares local government revenues according to the same concepts as Chart 5. It shows
that initially budgeted revenues in 2006 and 2010 represented 159 percent and 165 percent, respec-
tively, of actually collected revenue. The execution rate of invoiced revenues at the local level was
only 62 percent in 2010, the lowest in the last five years. As in the case of local public spending, this
suggests that there are serious weaknesses in the local budgeting process; the initial budget is not a
safe track to guide spending outturn or revenue collection.
Chart 7 presents a break-down of local revenues by economic function. Most local revenues come
from municipal funds (34 percent),24 followed by local tax revenues (26 percent) and other transfers
(20 percent). License fees and revenues from selling goods and services contribute merely 14 percent
21 Execution rate of committed expenditure: the ratio of committed expenditure to (initially) forecasted ex-
penditure, in percentage.
22 Execution rate of invoiced revenue: the ratio of invoiced revenue (“receita liquidada”) to (initially) forecasted
revenue, in percentage.
23 Following the 2012 memorandum of understanding between the government of Madeira and the central
government, tax rate differences vis-à-vis the mainland have been strongly narrowed.
24 Correspond to the bulk of central government transfers to municipalities.
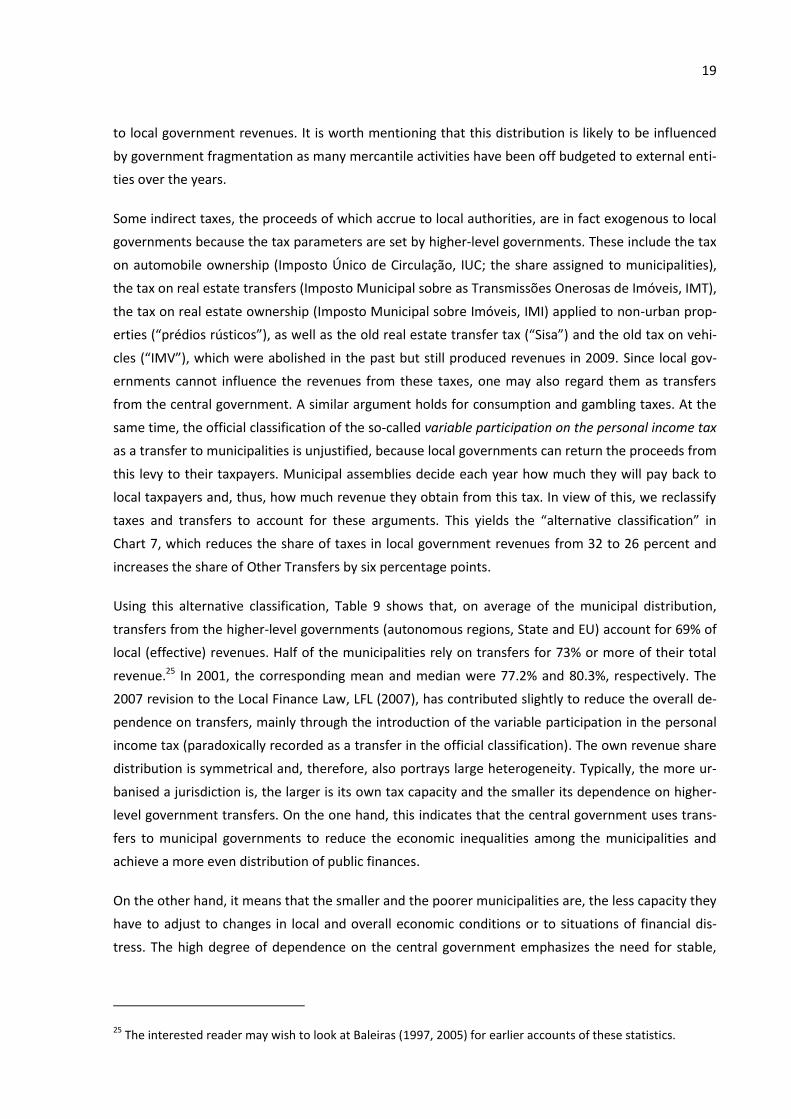
19
to local government revenues. It is worth mentioning that this distribution is likely to be influenced
by government fragmentation as many mercantile activities have been off budgeted to external enti-
ties over the years.
Some indirect taxes, the proceeds of which accrue to local authorities, are in fact exogenous to local
governments because the tax parameters are set by higher-level governments. These include the tax
on automobile ownership (Imposto Único de Circulação, IUC; the share assigned to municipalities),
the tax on real estate transfers (Imposto Municipal sobre as Transmissões Onerosas de Imóveis, IMT),
the tax on real estate ownership (Imposto Municipal sobre Imóveis, IMI) applied to non-urban prop-
erties (“prédios rústicos”), as well as the old real estate transfer tax (“Sisa”) and the old tax on vehi-
cles (“IMV”), which were abolished in the past but still produced revenues in 2009. Since local gov-
ernments cannot influence the revenues from these taxes, one may also regard them as transfers
from the central government. A similar argument holds for consumption and gambling taxes. At the
same time, the official classification of the so-called variable participation on the personal income tax
as a transfer to municipalities is unjustified, because local governments can return the proceeds from
this levy to their taxpayers. Municipal assemblies decide each year how much they will pay back to
local taxpayers and, thus, how much revenue they obtain from this tax. In view of this, we reclassify
taxes and transfers to account for these arguments. This yields the “alternative classification” in
Chart 7, which reduces the share of taxes in local government revenues from 32 to 26 percent and
increases the share of Other Transfers by six percentage points.
Using this alternative classification, Table 9 shows that, on average of the municipal distribution,
transfers from the higher-level governments (autonomous regions, State and EU) account for 69% of
local (effective) revenues. Half of the municipalities rely on transfers for 73% or more of their total
revenue.25 In 2001, the corresponding mean and median were 77.2% and 80.3%, respectively. The
2007 revision to the Local Finance Law, LFL (2007), has contributed slightly to reduce the overall de-
pendence on transfers, mainly through the introduction of the variable participation in the personal
income tax (paradoxically recorded as a transfer in the official classification). The own revenue share
distribution is symmetrical and, therefore, also portrays large heterogeneity. Typically, the more ur-
banised a jurisdiction is, the larger is its own tax capacity and the smaller its dependence on higher-
level government transfers. On the one hand, this indicates that the central government uses trans-
fers to municipal governments to reduce the economic inequalities among the municipalities and
achieve a more even distribution of public finances.
On the other hand, it means that the smaller and the poorer municipalities are, the less capacity they
have to adjust to changes in local and overall economic conditions or to situations of financial dis-
tress. The high degree of dependence on the central government emphasizes the need for stable,
25 The interested reader may wish to look at Baleiras (1997, 2005) for earlier accounts of these statistics.
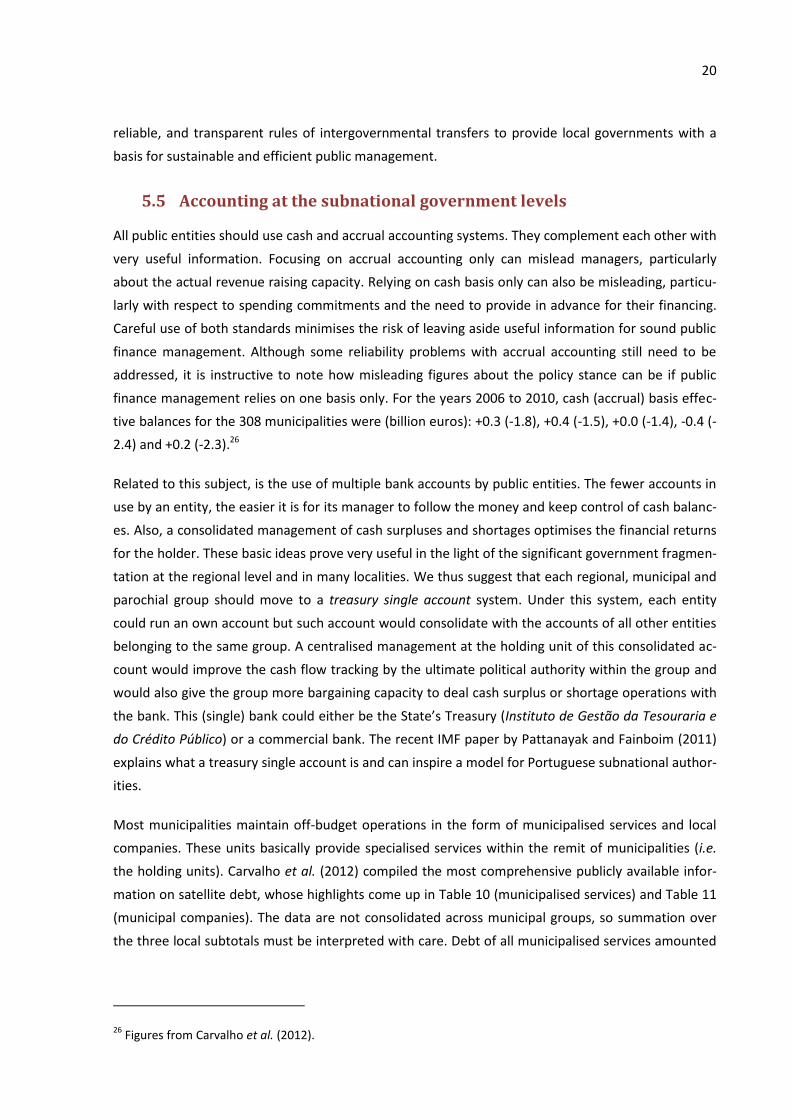
20
reliable, and transparent rules of intergovernmental transfers to provide local governments with a
basis for sustainable and efficient public management.
5.5 Accounting at the subnational government levels
All public entities should use cash and accrual accounting systems. They complement each other with
very useful information. Focusing on accrual accounting only can mislead managers, particularly
about the actual revenue raising capacity. Relying on cash basis only can also be misleading, particu-
larly with respect to spending commitments and the need to provide in advance for their financing.
Careful use of both standards minimises the risk of leaving aside useful information for sound public
finance management. Although some reliability problems with accrual accounting still need to be
addressed, it is instructive to note how misleading figures about the policy stance can be if public
finance management relies on one basis only. For the years 2006 to 2010, cash (accrual) basis effec-
tive balances for the 308 municipalities were (billion euros): +0.3 (-1.8), +0.4 (-1.5), +0.0 (-1.4), -0.4 (-
2.4) and +0.2 (-2.3).26
Related to this subject, is the use of multiple bank accounts by public entities. The fewer accounts in
use by an entity, the easier it is for its manager to follow the money and keep control of cash balanc-
es. Also, a consolidated management of cash surpluses and shortages optimises the financial returns
for the holder. These basic ideas prove very useful in the light of the significant government fragmen-
tation at the regional level and in many localities. We thus suggest that each regional, municipal and
parochial group should move to a treasury single account system. Under this system, each entity
could run an own account but such account would consolidate with the accounts of all other entities
belonging to the same group. A centralised management at the holding unit of this consolidated ac-
count would improve the cash flow tracking by the ultimate political authority within the group and
would also give the group more bargaining capacity to deal cash surplus or shortage operations with
the bank. This (single) bank could either be the State’s Treasury (Instituto de Gestão da Tesouraria e
do Crédito Público) or a commercial bank. The recent IMF paper by Pattanayak and Fainboim (2011)
explains what a treasury single account is and can inspire a model for Portuguese subnational author-
ities.
Most municipalities maintain off-budget operations in the form of municipalised services and local
companies. These units basically provide specialised services within the remit of municipalities (i.e.
the holding units). Carvalho et al. (2012) compiled the most comprehensive publicly available infor-
mation on satellite debt, whose highlights come up in Table 10 (municipalised services) and Table 11
(municipal companies). The data are not consolidated across municipal groups, so summation over
the three local subtotals must be interpreted with care. Debt of all municipalised services amounted
26 Figures from Carvalho et al. (2012).
21
to 147 M€ in 2010, of which 64% was due within a year. The Local Enterprise Sector owed 1,787 M€
in the same year, of which trade debt (i.e., debt to suppliers) represented 0.03% only.
5.6 Data discrepancies
To maintain sound public finances at the local level, it is necessary to monitor local developments in
a timely and comprehensive way. Currently, this is difficult, because the relevant data are dispersed
over a variety of sources which are often not consistent, as the preparation of this Report has
demonstrated to the CFP.
Official local public finance data are available at the websites of the Directorate-General of the Budg-
et (DGO) and the Directorate-General of Local Governments (DGAL)—“Portal Autárquico”. Both pro-
vide only cash-based, ex-post data. DGO publishes aggregate monthly data, while DGAL provides
end-year outturns by individual municipalities. Initial budgets are disclosed by neither agency. Fur-
ther information on individual governments is available from their own websites and in a yearbook
published by a consortium of two research centres funded by the chamber of chartered account-
ants.27 The preparation of this Report benefited a lot from these statistical sources and CFP acknowl-
edges the notable work of their staff. Thus, the following examples of some shortcomings should not
be read as a criticism; instead, they just reinforce our arguments in favour of a national effort to im-
proving the transparency and quality of public finance information.
The DGO’s Budget Outturn Summary Report aims at disclosing fresh (monthly) information on all
subsectors with a minimum delay. Yet, this goal comes at the price of a lack of comprehensiveness of
the data. In almost all months, the outturns of some local governments are missing. For example, the
June 2012 report presents the May account of local administration on the basis of only 238 munici-
palities. Either municipalities respond too late or in an inaccurate manner or the response deadlines
are too short to allow for full reporting. The DGAL tables are supposed to represent the closed annu-
al accounts. Yet, municipalities are allowed to report their final accounts to the Court of Auditors (CA)
at a later date, which is a source of discrepancy between information at CA and DGAL.
Further examples of data discrepancies are shown in Table 12. They reinforce the argument that the
revision of the subnational public finance laws is an opportunity to review the reporting and monitor-
ing mechanisms with a view to streamlining procedures and improving the transparency and quality
of information on these subsectors.
27 This publication, Financial Yearbook of Portuguese Municipalities, is a joint venture between two research
centres affiliated with the Minho University’s School of Economics and Business Administration and the Poly-technic Institute of Cávado and Ave and is sponsored by OTOC (“Ordem dos Técnicos Oficiais de Contas”). The latest edition is referred to in this Report as Carvalho et al. (2012). It gathers and analyses the cash and accrual accounts of all municipalities.
22
6. Concluding Remarks
The Portuguese government has stated its will to submit new local and regional public finance laws
to the Parliament by the end of the current year. This Report aims at contributing to the thinking on
which the future legal framework will be based. Sections 2 and 3 have given some normative guide-
lines. Sections 4 and 5 have reviewed the institutional and economic context of subnational authori-
ties as well as the current state of public finance at these layers of government. Bringing together the
normative principles and the empirical developments, a number of critical areas for reform emerge.
They can be grouped in three categories: (1), accounting, reporting and monitoring, (2), political
ownership of revenues, and, (3), medium-term budgeting. The rest of this section elaborates on
these and puts forward ideas on how to improve the current situation. The CFP does not wish to
make detailed proposals at this stage, as this Report’s intent is to prepare the public debate on the
directions of change. The CFP intends to comment on the specific proposals made during that debate
at a later point in time. The CFP hopes that this Report will help the decision making process by
stakeholders and legislators in the months to come, seeking to assure both the sustainability and a
high quality of subnational public finances in Portugal.
6.1 Accounting, reporting and monitoring
It is important for sustainability that each unit of government run accounting systems on effective
cash and accrual bases. Although municipalities were the first layer of government to complete the
implementation of an accrual system of accounts in Portugal, and their experience may prove useful
for the efforts currently being undertaken at the central administration level, some imperfections still
need to be addressed. Public finance information must be consistent, comparable across time and
government units, comprehensive and transparent, if it is to deliver the right information for sound,
forward-looking management decisions and to monitor the compliance with fiscal rules in force. Do-
mains to intervene include:
criteria harmonization—charts of accounts, including accounting rules and accompanying implementation handbooks, need some adjustments so as to minimise the margin for arbi-trary interpretation;
account consolidation across entities and government layers (including central administra-tion)—government fragmentation needs to be replaced by a comprehensive view of the en-tire set of entities held by each government unit (a municipality or a regional government): municipalised services, autonomous funds and services, local and regional companies. The idea is to evolve towards true consolidated accounts as has been the case of firms for many years;
data pooling—a unified public finance warehouse would minimise compliance costs for re-porting entities, improve transparency, reduce data discrepancies and facilitate analytical work by monitoring agencies, thus improving common knowledge on subnational public fi-nance. Conditional on results, this experience could later be expanded to the other public subsectors;
treasury account unification—with the aims of optimising the management of treasury sur-pluses or shortages and enabling the integrated control of cash flows by the top political level
23
within each municipal or regional group, all entities making up such group should share an in-tegrated structure of banking accounts allowing for their consolidation.
The suggestion on data pooling needs an explanation. Currently, each subnational government re-
ports data, sometimes the same variables, to different central government entities (Directorate-
General of Local Governments, Directorate-General of the Budget, Inspectorate-General of Finance,
Court of Auditors, Statistics Portugal, and probably others) in different formats and at different dates.
This requires subnational units to allocate scarce time and human resources to this end and is a
source of information inconsistency. A few years ago, the government created IES—Simplified Enter-
prise Information— to solve a similar problem with firms’ reporting of accounting, statistical and tax
information. IES is a very large data warehouse fed online directly by firms according to a stipulated
calendar. Agencies whose remits require monitoring of enterprise information can access this com-
mon pool of data and extract the information they need to carry out their duties. Scale economies in
data management by the public sector are obvious, as well as the compliance cost savings for report-
ing entities. To begin with, a Simplified Fiscal Information (IOS) could be launched for the subnational
subsectors. Parishes and intermunicipal associations, whose accounts are not easily available to the
public, could also contribute to the data warehouse. Later, with lessons from this experience, the
idea could be extended to the other public subsectors.
Effective implementation of these suggestions takes time, persistence and skilful resources as the
accuracy and reliability of information systems are an endless exercise by definition. The increasing
scarcity of qualified personnel in many areas of public administration is a serious challenge to over-
come. Perhaps it would be a good idea to identify in the coming months a detailed task list for future
implementation and set a realistic schedule for its delivery, clearly ascertaining who will be responsi-
ble for what and when. The forthcoming laws should set the targets and deadlines in order to create
the necessary commitments and application momenta.
6.2 Political ownership of subnational revenues and their uses
An important prerequisite for maintaining sound public finances is that political constituents perceive
the exact cost of the public spending they benefit from and their own contribution to it. This helps to
align public with private preferences, induces greater accountability of incumbents to voters, and
reduces the margin for blaming funding difficulties at the local level on higher government levels; as
a result, the public budget constraint gets harder. Portuguese subnational governments rely heavily
on transfers from higher government layers. On the one hand, these are important to reduce eco-
nomic inequalities due to the large degree of economic heterogeneity. On the other hand, the result-
ing high degree of vertical imbalance may mislead subnational policy-makers and their constituents
about the true relative cost of public services. To enhance the political ownership of revenues and
their uses, without increasing the national tax burden, the upcoming legal reforms might consider
the following measures:
24
for municipalities o to increase the ceiling of the Variable Participation in the personal income tax (IRS)
substantially28 (in exchange for lower central government transfers), at least for mu-nicipalities with fiscal capacity above a threshold to be determined politically;
o as an alternative to the current variable participation, to introduce a visible local sur-charge on the net IRS collection in exchange for a reduction on central government transfers;
o to increase the taxpayers’ perception about the consolidated intertemporal local budget constraint by changing the layout of municipal tax invoices to display the municipality’s logo and basic numerical information on local public finance;
o to grant municipal parliaments some autonomy to set parameters in the transfer-like taxes (on automobile ownership, at least);
o to consider a credible calendar to reassess the base of the rural real estate property tax;
o to consider the elimination of the real estate transfers tax (IMT) so as to reduce the discrimination of real estate against other assets not subject to a sales duty and to cancel any increases in the tax burden arising from the reassessment of property tax bases;
for regional governments o to increase regional discretion over tax parameters; o to partially replace transfers from the central government with own taxes; o to increase the visibility of own revenues before regional constituencies; o to consider lessons from the Madeira’s economic and financial adjustment pro-
gramme.
For both layers of government, it is important to look carefully at the economic incentives lying be-
hind central government transfer rules. In particular, apportionment formulæ should not create in-
centives for recipient governments to reduce their tax efforts. Indeed, the partial replacement of
central government transfers with subnational taxation, without increasing the tax burden, may pro-
vide an opportunity to streamlining the current formulæ (reducing the number of weights), maintain-
ing their overall redistributive stance and incorporating therein an inverse function of the effective
taxable capacity of each jurisdiction.
6.3 Medium-term budgeting
It is important to reinforce a forward-looking stance of public finance management in all layers of
government. Stable fiscal rules embodied in a medium-term framework could serve this purpose.
Current laws already have fiscal rules but they need to be revisited. On the one hand, they contain
some loopholes (debt to suppliers, government fragmentation, exceptions to rule comprehensive-
ness). On the other hand, they tend to be replaced every year by new centrally-imposed constraints,
28 The current ceiling is 5% of the IRS revenue collected by the national tax authority in the jurisdiction (after
deductions). For an average effective gross tax rate of 10% (the official figure in 2008 to 2010, according to Autoridade Tributária e Aduaneira (2012), that ceiling corresponds nearly to just 0.5% of the average taxpayer’s gross revenue.
25
with the result that discretion prevails over the rules. The strong bias towards annual budget man-
agement in the current framework hides important intertemporal effects of fiscal decisions and,
therefore, fails to provide policy-makers and managers with a proper long-term outlook, consistent
with the dynamic public budget constraint. The budgetary framework law currently in place already
sets a medium-term framework for central administration (art. 12-D). This could be extended to the
local and regional subsector, taking into consideration lessons from the on-going implementation
and the CFP recommendations in its Report of 21 May 2012.
The medium-term framework should consist of a stable multiannual fiscal environment with compat-
ible targets for debt and spending. Limits on the stock of debt would help each government to adopt
fundable annual budgets (i.e., to secure financial sustainability) while annual (primary) expenditure
ceilings would assist in fitting the government group size to the size of the respective economy. The
definition of these indicators would have to be sufficiently comprehensive to minimize the scope for
window dressing and creative accounting. Furthermore, they should be defined in a way assuring
that any government has control over the relevant fiscal aggregates. This would call for replacing the
current ceilings on debt service with ceilings for the stock of debt or the ratio of debt to revenues.
The debt definition would have to comprehend all kinds of liabilities, regardless of their uses, thus
going beyond what the Eurostat currently demands. Spending limits defined for a budgetary cycle of
several years serve the double purpose of helping to enforce fiscal discipline and to provide focal
points for a public debate over the size of government and its major activities. Generally, fiscal tar-
gets and limits should be mandatory, with deviations allowed only under well defined, exceptional
circumstances.
Such a medium-term budgeting framework can only be effective if budgeting at the local and region-
al levels is serious and realistic. The large differences between forecasted and effective municipal
spending and revenues pointed out in Section 5 suggest that local frameworks for forecasting reve-
nues and expenditures should be strengthened.
A medium-term budgeting framework with debt and spending limits would also strengthen fiscal
coordination across and within government layers. If the general government as a whole fails to
meet its targets under the European fiscal framework and faces penalties imposed on the country as
a whole, all government units failing their targets should be obliged to contribute to the penalty
payment in proportion to their failures to meet the respective fiscal targets. Also, predefined adjust-
ment mechanisms for governments violating their fiscal discipline rules (see below) should be de-
signed so as to help the general government as a whole to restore its compliance with international
targets. This approach would make failures at the country level less likely, improve fiscal sustainabil-
ity and would be more equitable. Indeed, the current arrangement under which all government units
have their funding reduced by the State budget law irrespective of their fiscal performance fails to
reward responsible behaviours, looks unfair and, ultimately, weakens the incentives for fiscal pru-
dence at the subnational levels.
26
Finally, fiscal targets must be credible to be effective. They must contain both penalties for violating
the targets and mechanisms of adjustment to bring governments back on track. While financial sanc-
tions against deviating from fiscal targets have been foreseen in the Portuguese public finance laws
for years, some rethinking of the effectiveness of the existing arrangements, under which financial
penalties take the form of temporary withholdings of central government transfers to the relevant
subnational government, seems advisable. Predefined mechanisms of adjustment are necessary to
assure both the general public and creditors that a speedy return to target will occur. In this context,
it seems useful to examine the effectiveness of the correction mechanisms embodied in the current
local public finance law (arts. 37, 41 and 42).
References
AUTORIDADE TRIBUTÁRIA E ADUANEIRA (2012), Statistics on Income Taxes: Model 3 of Income Statements, Map 13, available at http://info.portaldasfinancas.gov.pt/NR/rdonlyres/BDC44771-A98B-4313-A 76D-E4B980BDE7B5/0/Mapa13TaxaEfectivadeTributa%C3%A7%C3%A3oBrutaporTitularidade.pdf. Accessed: 16 July 2012.
BAHL, Roy W. and LINN, Johannes F. (1992), Urban Public Finance in Developing Countries, published for The World Bank, New York: Oxford University Press.
BALEIRAS, Rui Nuno (1997), Local Finance in Portugal: Rules and Performance, Universidade Nova de Lisboa, School of Economics, Working Paper No. 320, October 1997. Also published by: Portu-guese Regional Science Association, Documentos APDR, No. 8, September 1998.
BALEIRAS, Rui Nuno (2005), “Finanças Municipais” [“Municipal Finance”], in Presidency of Republic (ed., 2005), Desafios para Portugal — Seminários da Presidência da República [Challenges for Por-tugal—Seminars of the Presidency of Republic], Cruz Quebrada (Portugal): Casa das Letras, pp. 365–472 (paper) and 473–506 (discussion).
BALEIRAS, Rui Nuno (2009), “Governação Subnacional: Legitimidade Económica e Descentralização da Despesa Pública” [“Subnational Governance: Economic Legitimacy and Public Expenditure Decen-tralisation”], in José Siva Costa and Peter Nijkamp (eds.), Compêndio de Economia Regional [Regi-onal Economics Compendium], Vol. I: Teoria, Temáticas e Políticas [Theory, Issues and Policies], Cascais: Princípia, pp. 723–760 and 775–778.
BALEIRAS, Rui Nuno (2011), “How to Boost Competitiveness in Low Density Territories? The PROVERE Initiative Case”, in Rui Nuno Baleiras (ed.), Casos de Desenvolvimento Regional, Cascais: Princípia, pp. 325–365.
BALEIRAS, Rui Nuno and COSTA, José da Silva (2004), “To Be or Not To Be in Office Again: an Empirical Test of a Local Political Business Cycle Rationale”, European Journal of Political Economy, Vol. 20, Issue 3, pp. 655–671.
BARBOSA, António P. (1997), Economia Pública [Public Economics], Lisbon: McGraw-Hill.
BREAK, George (1980), Financing Government in a Federal System, Washington: Brookings Institution.
BRYANT, Adam (1996), “Who Pays for Air Traffic Control, and How?”, The New York Times, 2 May, pp. D1 and D5.
BUTTON, Kenneth J. (1993), Transport Economics, second edition, Cheltenham (UK): Edward Elgar.
CALVO, Christina M. (1998), Options for Managing and Financing Rural Transport Infrastructure, World Bank Technical Paper No. 411, Washington, D.C.: The World Bank.
27
CARVALHO, João, FERNANDES, Maria José, CAMÕES, and JORGE, Susana (2012), Anuário Financeiro dos Municípios Portugueses — 2010 [Financial Yearbook of Portuguese Municipalities—2010], Feve-reiro, Edições OTOC, Lisboa: Ordem dos Técnicos Oficiais de Contas.
DEO (2012), Documento de Estratégia Orçamental 2012–2016 [Fiscal Strategy Document 2012–2016], April, Lisbon: Ministry of Finance, available at http://www.portugal.gov.pt/media/579836/ 20120430_deo.pdf. Accessed: 16 July 2012.
DGO (2012), Budget Execution Summary–Statistical Information, February issue, Directorate-General of the Budget, Ministry of Finance, available at http://www.dgo.pt/execucaoorcamental/Paginas/ Sintese-da-Execucao-Orcamental-Mensal.aspx?Ano=2012&Mes=Fevereiro. Accessed: 17 June 2012.
EICHENGREEN, Barry and VON HAGEN, Jürgen (1995), Fiscal Policy and Monetary Union: Federalism, Fis-cal Restrictions and the No-Bailout Rule, Discussion Paper No. 12417, September, London: Centre for Economic Policy Research (CEPR).
EPA-A (2009), Estatuto Político-Administrativo da Região Autónoma dos Açores, terceira revisão, Lei n.º 2/2009, de 12 de Janeiro [Politico-Administrative Statute of the Autonomous Region of Azores, third revision, Law No. 2/2009, of 12 January], available at http://digestoconvidados.dre.pt/digesto//pdf/LEX/173/246643.PDF. Accessed: 4 July 2012.
EPA-M (1999), Estatuto Político-Administrativo da Região Autónoma da Madeira, primeira revisão, Lei n.º 130/99, de 21 de Agosto, com a alteração introduzida pela Lei n.º 12/2000, de 21 de Junho [Politico-Administrative Statute of the Autonomous Region of Madeira, first revision, Law No. 130/99, of 21 August, with the change introduced by Law No. 12/2000, of 21 June], available at http://digestoconvidados.dre.pt/digesto/(S(qawzfx45g0nz0155cgi1xlim))/Paginas/DiplomaTexto.aspx. Accessed: 4 July 2012.
EUROSTAT (2012), European Commission, online regional statistics, data available at http://epp.eurostat.ec.europa.eu/portal/page/portal/statistics/search_database. Accessed: 12 June 2012.
FISHER, Ronald C. (1996), State and Local Public Finance, second edition, Chicago: Irwin.
HEGGIE, Ian G. and VICKERS, Piers (1998), Commercial Management and Financing of Roads, World Bank Technical Paper No. 409, Washington, D.C.: The World Bank.
LAW NO. 54/2011, of 19 October, “Approves the Statutes of the Portuguese Public Finance Council, created by article 12–I of Law No. 91/2001, of 20 August (Budgetary Framework Law), republished by Law No. 22/2011, of 20 May, available in Portuguese at http://dre.pt/pdf1sdip/2011/10/ 20100/0467404678.pdf. Assessed: 16 July 2012.
LFL (2007), Law No. 2/2007, of 15 January, Local Finance Law, with the changes introduced by art. 47 of Law No. 55-A/2010, of 31 December, and art. 67 of Law No. 64-B/2011, of 31 December.
MEFP (2012), Memorandum of Economic and Financial Policies, 3rd review, Attachment 1 to the letter of intent of 15 March 2012 by the Portuguese authorities to the International Monetary Fund, available at http://www.portugal.gov.pt/media/371402/2r_mefp_20111220.pdf. Accessed: 3 May 2012.
MUSGRAVE, Richard (1959), The Theory of Public Finance, New York: McGraw-Hill.
MUSGRAVE, Richard (1986), “The Economics of Fiscal Federalism”, in Public Finance in a Democratic Society, Collected Papers of Richard Musgrave, Vol. 2, New York: New York University Press.
OATES, Wallace E. (1972), Fiscal Federalism, New York: Harcourt Brace Jovanovich.
OLSON, Mancur (1969), “The Principle of 'Fiscal Equivalence': the Division of Responsibilities Among Different Levels of Government”, The American Economic Review, Vol. 59 (2), May, pp. 479–487.
PATTANAYAK, Sailendra and FAINBOIM, Israel (2011), Treasury Single Account: An Essential Tool for Gov-ernment Cash Management, International Monetary Fund, Fiscal Affairs Department, Technical
28
Notes and Manuals, No. 11/04, August. Available at http://www.imf.org/external/pubs/ft/tnm/ 2011/tnm1104.pdf. Accessed: 15 July 2012.
PISANI-FERRY, Jean, and VON HAGEN, Jürgen (2003), “Pourquoi l’Europe ne Ressemble-t-elle pas à ce que Voudraient les Économistes?” [“Why Doesn’t Europe Look the Way Economists would Like?”], Revue Economique, Vol. 54 (3), pp. 477–487.
PONTES, José Pedro (2001), Economia do Espaço e do Transporte [The Economics of Space and Trans-port], Lisbon: Editora Vulgata.
PORTAL AUTÁRQUICO (2012), Electronic gateway to information on Portuguese local governments, maintained by Directorate-General of Local Governments, available at http://www.portalautarquico.pt/portalautarquico/Home.aspx. Accessed: 23 June 2012.
RESOLUTION OF THE COUNCIL OF MINISTERS NO. 8/2012, in Diário da República, 2nd series, No. 31, 13 Feb-ruary, available in Portuguese at http://dre.pt/pdf2sdip/2012/02/031000000/0520305205. pdf. Accessed: 15 July 2012.
STATISTICS PORTUGAL (2009), Estudo sobre o Poder de Compra Concelhio — 2007, No. VIII, Lisbon: Insti-tuto Nacional de Estatística, I.P.. Also available at http://www.ine.pt/xportal/xmain?xpid=NE&xpgid=ine_publicacoes&PUBLICACOESpub_boui=71447548&PUBLICACOEStema=00&PUBLICACOESmodo=2. Accessed: 15 June 2011.
STATISTICS PORTUGAL (2011), Electronic gateway of the Portuguese official statistics office, http://www.ine.pt/xportal/xmain?xpgid=ine_main&xpid=INE. Accessed: 14 June 2011.
STATISTICS PORTUGAL (2012), Procedimento dos Défices Excessivos, 1.ª Notificação de 2012 [Excessive Deficit Procedure, 1st Notification of 2012], 30 March, available at http://www.ine.pt/xportal/xmain?xpid=INE&xpgid=ine_destaques&DESTAQUESdest_boui=130173427&DESTAQUESmodo=2. Accessed: 5 July 2012.
STIGLITZ, Joseph E., SEN, Amartya and FITOUSSI, Jean-Paul (2009), Report by the Commission on the Measurement of Economic Performance and Social Progress, available at http://www.stiglitz-sen-fitoussi.fr/documents/rapport_anglais.pdf, Accessed: 15 June 2012.
TIBANDEBAGE, Paula (1999), “Charging for Health Care in Tanzania: Official Pricing in a Liberalized Envi-ronment”, in Maureen Mackintosh and Rathin Roy (eds.), Economic Decentralization and Public Management Reform, New Horizons in Public Policy, Cheltenham (UK): Edward Elgar, pp. 176–201.
VALA, Francisco and PINHO, Maria Manuel (2011), “Monitoring Regional Development in a Multidi-mensional Perspective: The Regional Development Composite Index (ISDR) for the Portuguese NUTS Level 3 Regions”, in Rui Nuno Baleiras (ed.), Casos de Desenvolvimento Regional, Cascais: Princípia, pp. 85–106.
VEIGA, Linda Gonçalves and VEIGA, Francisco José (2007), “Political Business Cycles at the Municipal Level”, Public Choice, Vol. 131, Numbers 1-2, pp. 45-64.
VON HAGEN, Jürgen, and WOLFF, Guntram (2006), “What do Deficits Tell us About Debt? Empirical Evi-dence on Creative Accounting with Fiscal Rules in the EU”, Journal of Banking and Finance, Vol. 30 (12), pp. 3259–3279.
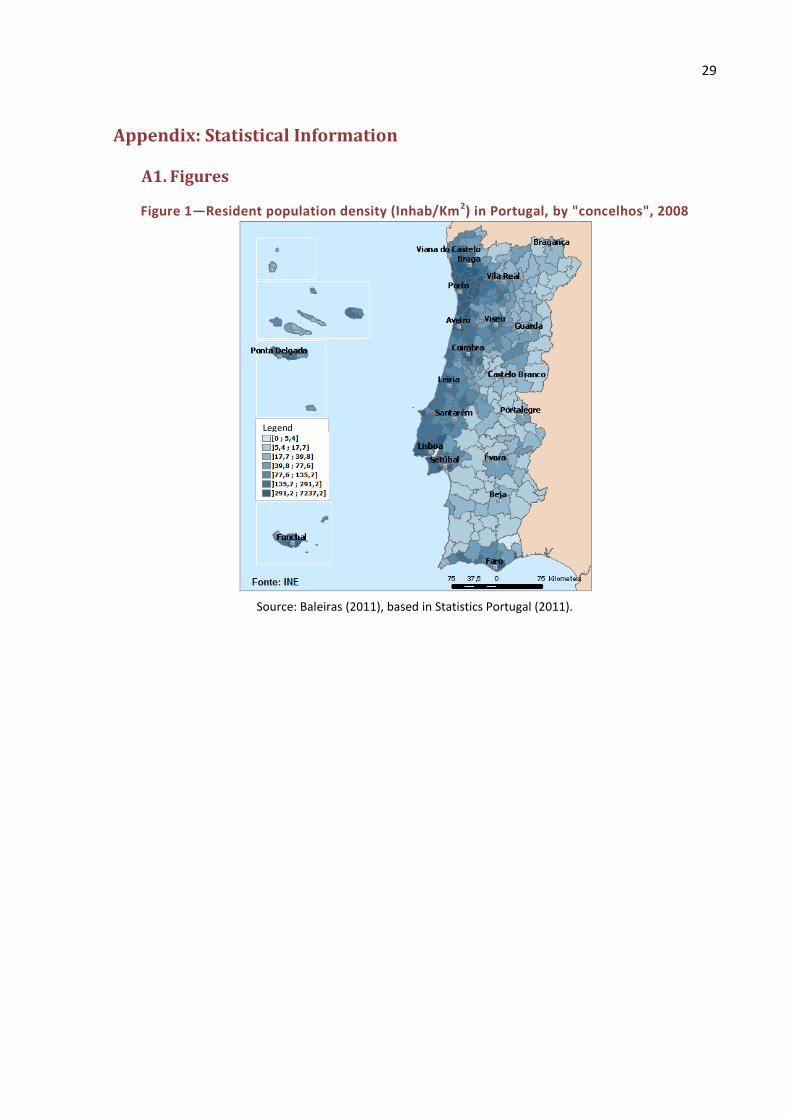
29
Appendix: Statistical Information
A1. Figures
Figure 1—Resident population density (Inhab/Km2) in Portugal, by "concelhos", 2008
Source: Baleiras (2011), based in Statistics Portugal (2011).
Legend
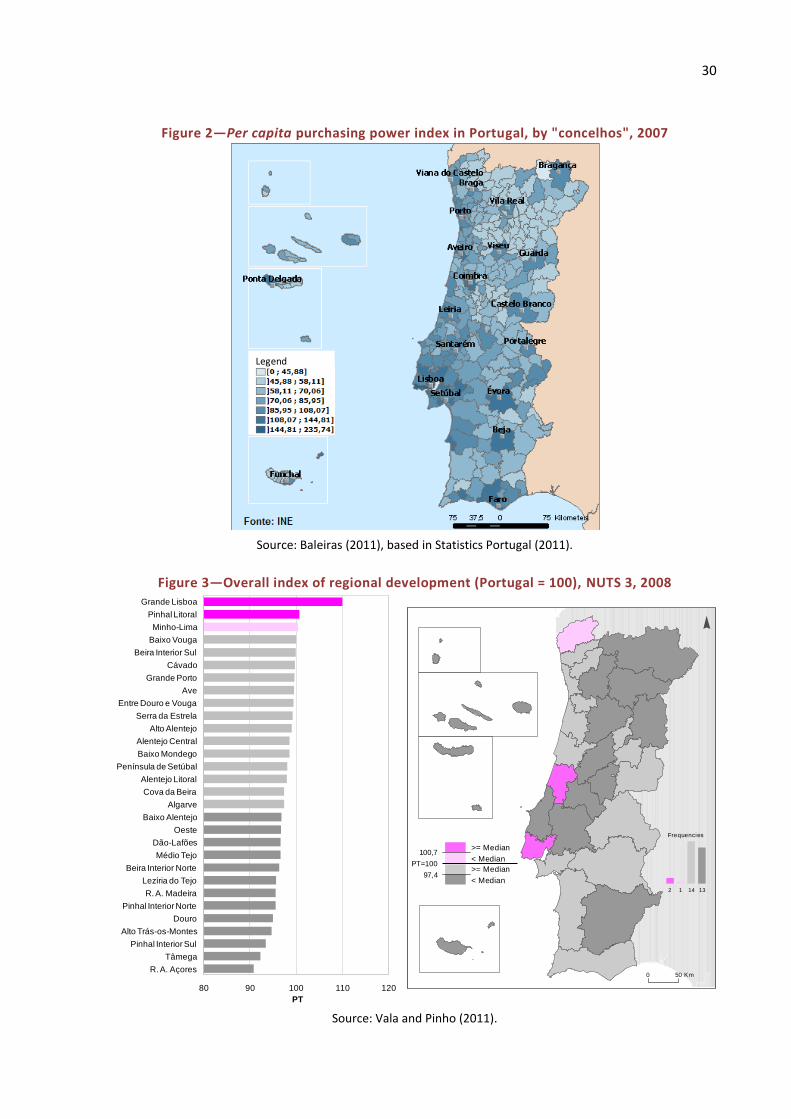
30
Figure 2—Per capita purchasing power index in Portugal, by "concelhos", 2007
Source: Baleiras (2011), based in Statistics Portugal (2011).
Figure 3—Overall index of regional development (Portugal = 100), NUTS 3, 2008
Source: Vala and Pinho (2011).
Legend
80 90 100 110 120
R. A. Açores
Tâmega
Pinhal Interior Sul
Alto Trás-os-Montes
Douro
Pinhal Interior Norte
R. A. Madeira
Lezíria do Tejo
Beira Interior Norte
Médio Tejo
Dão-Lafões
Oeste
Baixo Alentejo
Algarve
Cova da Beira
Alentejo Litoral
Península de Setúbal
Baixo Mondego
Alentejo Central
Alto Alentejo
Serra da Estrela
Entre Douro e Vouga
Ave
Grande Porto
Cávado
Beira Interior Sul
Baixo Vouga
Minho-Lima
Pinhal Litoral
Grande Lisboa
PT
50 Km0
33 1212
Frequências
551010
Frequências
Grupo 1
Grupo 2
Grupo 3
Grupo 5
Grupo 4
Grupo 6
>= Median100,7
PT=100
97,4
< Median
< Median
>= Median
131412
Frequencies8 87 7
Frequências
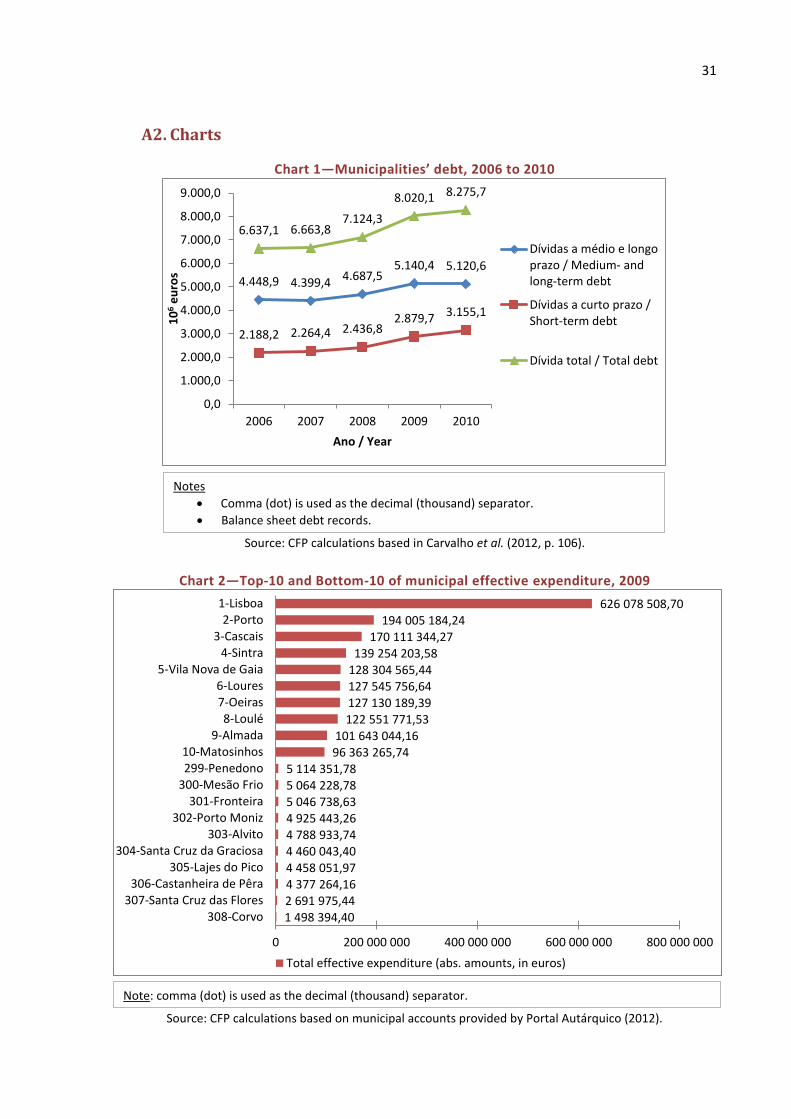
31
A2. Charts
Chart 1—Municipalities’ debt, 2006 to 2010
Source: CFP calculations based in Carvalho et al. (2012, p. 106).
Chart 2—Top-10 and Bottom-10 of municipal effective expenditure, 2009
Source: CFP calculations based on municipal accounts provided by Portal Autárquico (2012).
4.448,9 4.399,44.687,5
5.140,4 5.120,6
2.188,2 2.264,4 2.436,82.879,7 3.155,1
6.637,1 6.663,87.124,3
8.020,1 8.275,7
0,0
1.000,0
2.000,0
3.000,0
4.000,0
5.000,0
6.000,0
7.000,0
8.000,0
9.000,0
2006 2007 2008 2009 2010
10
6e
uro
s
Ano / Year
Dívidas a médio e longoprazo / Medium- andlong-term debt
Dívidas a curto prazo /Short-term debt
Dívida total / Total debt
1 498 394,40 2 691 975,44 4 377 264,16 4 458 051,97 4 460 043,40 4 788 933,74 4 925 443,26 5 046 738,63 5 064 228,78 5 114 351,78
96 363 265,74 101 643 044,16
122 551 771,53 127 130 189,39 127 545 756,64 128 304 565,44 139 254 203,58
170 111 344,27 194 005 184,24
626 078 508,70
0 200 000 000 400 000 000 600 000 000 800 000 000
308-Corvo307-Santa Cruz das Flores
306-Castanheira de Pêra305-Lajes do Pico
304-Santa Cruz da Graciosa303-Alvito
302-Porto Moniz301-Fronteira
300-Mesão Frio299-Penedono10-Matosinhos
9-Almada8-Loulé
7-Oeiras6-Loures
5-Vila Nova de Gaia4-Sintra
3-Cascais2-Porto
1-Lisboa
Total effective expenditure (abs. amounts, in euros)
Notes
Comma (dot) is used as the decimal (thousand) separator.
Balance sheet debt records.
Note: comma (dot) is used as the decimal (thousand) separator.
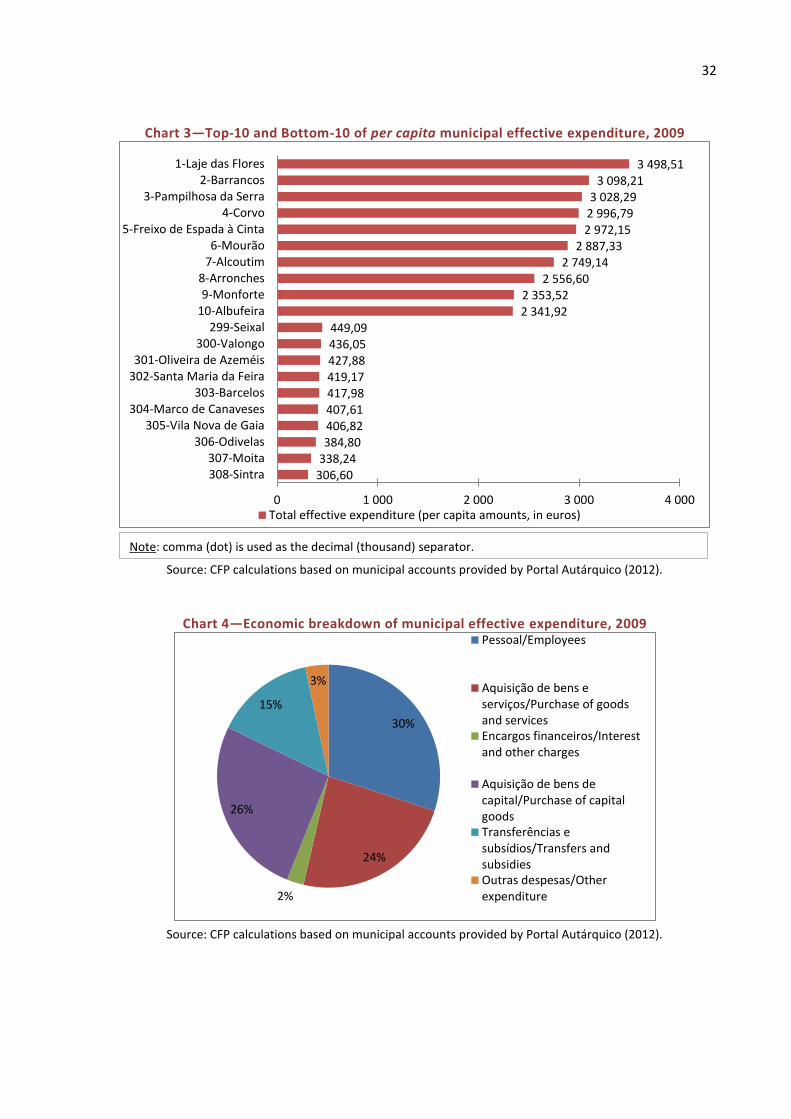
32
Chart 3—Top-10 and Bottom-10 of per capita municipal effective expenditure, 2009
Source: CFP calculations based on municipal accounts provided by Portal Autárquico (2012).
Chart 4—Economic breakdown of municipal effective expenditure, 2009
Source: CFP calculations based on municipal accounts provided by Portal Autárquico (2012).
306,60 338,24 384,80 406,82 407,61 417,98 419,17 427,88 436,05 449,09
2 341,92 2 353,52
2 556,60 2 749,14
2 887,33 2 972,15 2 996,79 3 028,29
3 098,21 3 498,51
0 1 000 2 000 3 000 4 000
308-Sintra307-Moita
306-Odivelas305-Vila Nova de Gaia
304-Marco de Canaveses303-Barcelos
302-Santa Maria da Feira301-Oliveira de Azeméis
300-Valongo299-Seixal
10-Albufeira9-Monforte
8-Arronches7-Alcoutim6-Mourão
5-Freixo de Espada à Cinta4-Corvo
3-Pampilhosa da Serra2-Barrancos
1-Laje das Flores
Total effective expenditure (per capita amounts, in euros)
30%
24%
2%
26%
15%
3%
Pessoal/Employees
Aquisição de bens eserviços/Purchase of goodsand servicesEncargos financeiros/Interestand other charges
Aquisição de bens decapital/Purchase of capitalgoodsTransferências esubsídios/Transfers andsubsidiesOutras despesas/Otherexpenditure
Note: comma (dot) is used as the decimal (thousand) separator.
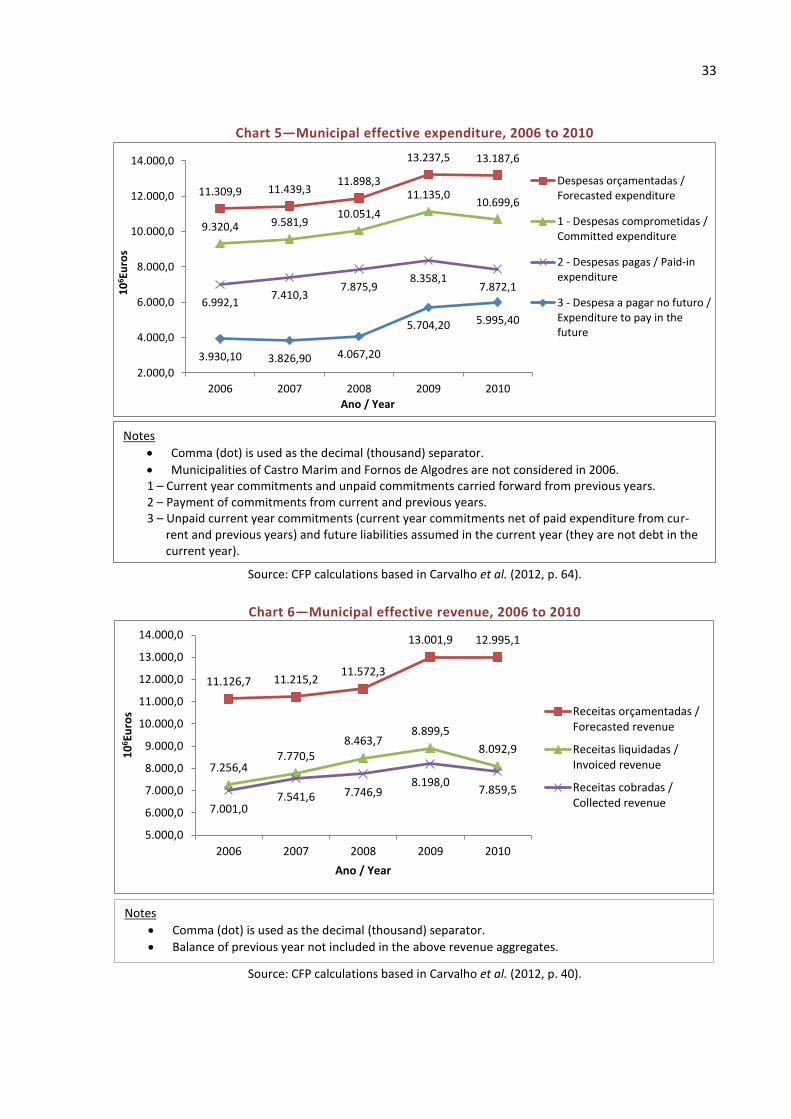
33
Chart 5—Municipal effective expenditure, 2006 to 2010
Source: CFP calculations based in Carvalho et al. (2012, p. 64).
Chart 6—Municipal effective revenue, 2006 to 2010
Source: CFP calculations based in Carvalho et al. (2012, p. 40).
11.309,9 11.439,311.898,3
13.237,5 13.187,6
9.320,4 9.581,910.051,4
11.135,010.699,6
6.992,17.410,3
7.875,98.358,1
7.872,1
3.930,10 3.826,90 4.067,20
5.704,20 5.995,40
2.000,0
4.000,0
6.000,0
8.000,0
10.000,0
12.000,0
14.000,0
2006 2007 2008 2009 2010
10
6 Eu
ros
Ano / Year
Despesas orçamentadas /Forecasted expenditure
1 - Despesas comprometidas /Committed expenditure
2 - Despesas pagas / Paid-inexpenditure
3 - Despesa a pagar no futuro /Expenditure to pay in thefuture
11.126,7 11.215,211.572,3
13.001,9 12.995,1
7.256,47.770,5
8.463,78.899,5
8.092,9
7.001,07.541,6 7.746,9
8.198,07.859,5
5.000,0
6.000,0
7.000,0
8.000,0
9.000,0
10.000,0
11.000,0
12.000,0
13.000,0
14.000,0
2006 2007 2008 2009 2010
10
6 Eu
ros
Ano / Year
Receitas orçamentadas /Forecasted revenue
Receitas liquidadas /Invoiced revenue
Receitas cobradas /Collected revenue
Notes
Comma (dot) is used as the decimal (thousand) separator.
Municipalities of Castro Marim and Fornos de Algodres are not considered in 2006. 1 – Current year commitments and unpaid commitments carried forward from previous years. 2 – Payment of commitments from current and previous years. 3 – Unpaid current year commitments (current year commitments net of paid expenditure from cur-
rent and previous years) and future liabilities assumed in the current year (they are not debt in the current year).
Notes
Comma (dot) is used as the decimal (thousand) separator.
Balance of previous year not included in the above revenue aggregates.
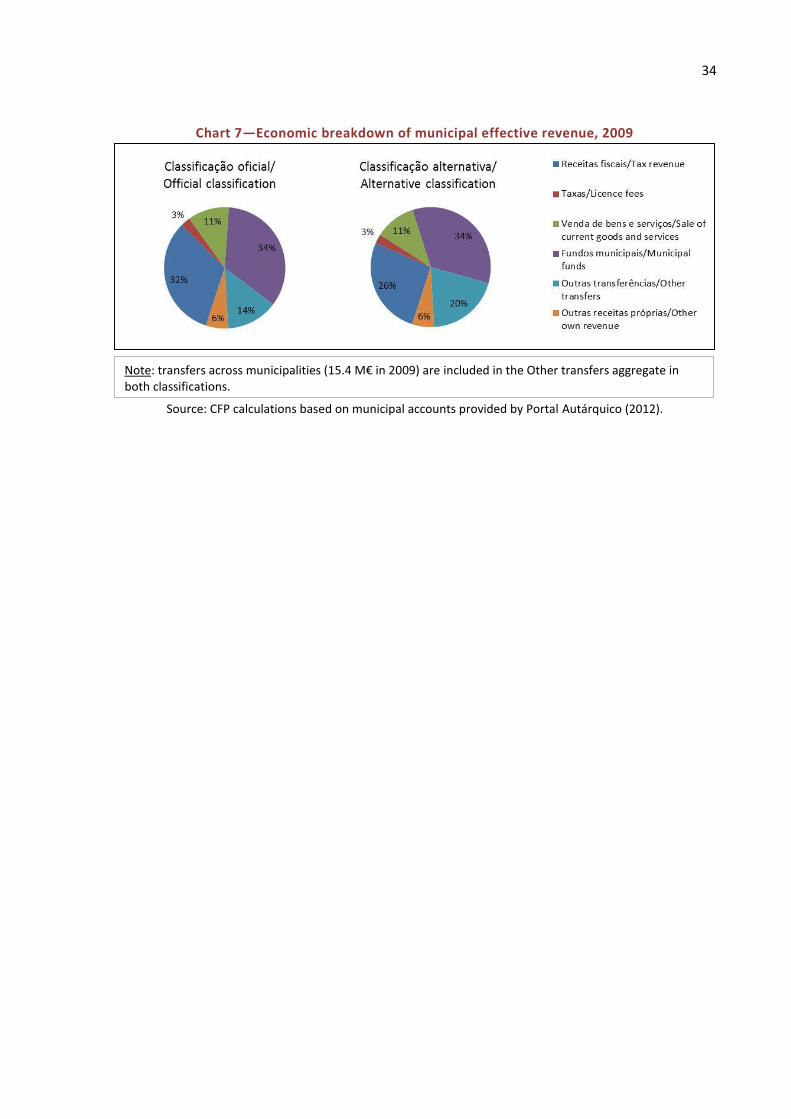
34
Chart 7—Economic breakdown of municipal effective revenue, 2009
Source: CFP calculations based on municipal accounts provided by Portal Autárquico (2012).
Note: transfers across municipalities (15.4 M€ in 2009) are included in the Other transfers aggregate in both classifications.
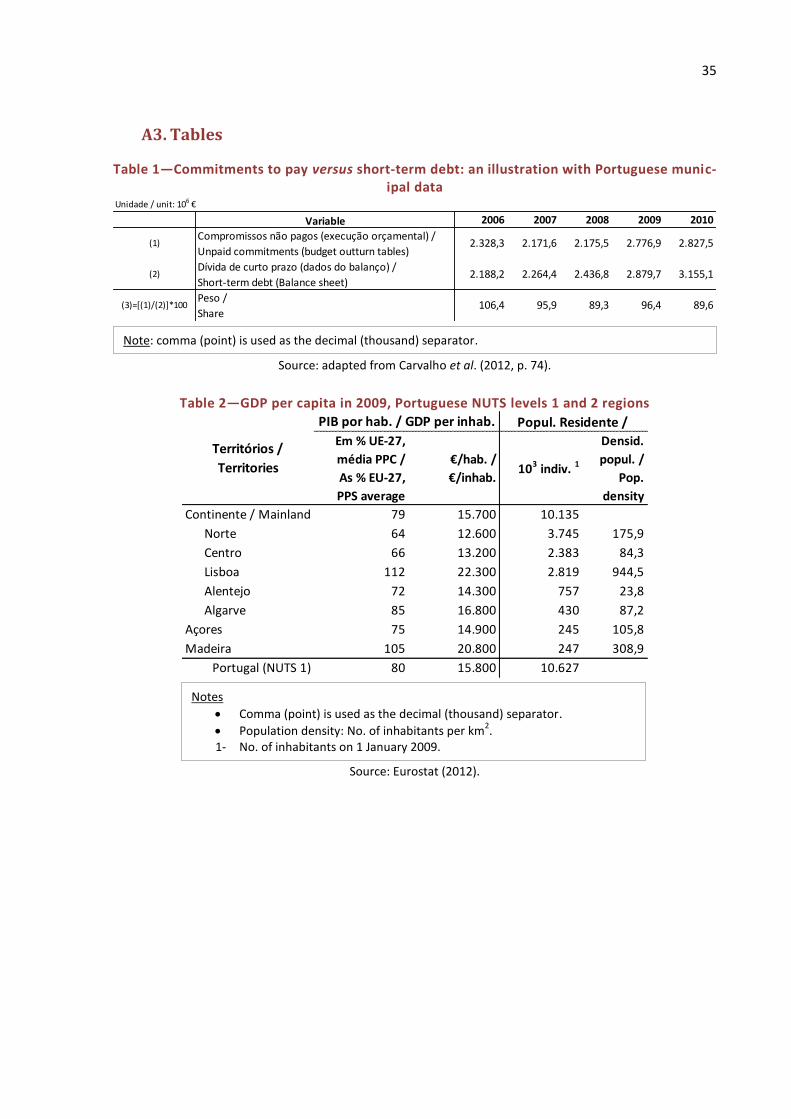
35
A3. Tables
Table 1—Commitments to pay versus short-term debt: an illustration with Portuguese munic-ipal data
Source: adapted from Carvalho et al. (2012, p. 74).
Table 2—GDP per capita in 2009, Portuguese NUTS levels 1 and 2 regions
Source: Eurostat (2012).
Unidade / unit: 106 €
Variable 2006 2007 2008 2009 2010
Compromissos não pagos (execução orçamental) /
Unpaid commitments (budget outturn tables)
Dívida de curto prazo (dados do balanço) /
Short-term debt (Balance sheet)
Peso /
Share
2.879,7 3.155,1
96,4 89,6
2.328,3 2.171,6 2.175,5 2.776,9 2.827,5
2.188,2 2.264,4 2.436,8
89,3
(1)
(2)
(3)=[(1)/(2)]*100 106,4 95,9
Em % UE-27,
média PPC /
As % EU-27,
PPS average
€/hab. /
€/inhab.103 indiv. 1
Densid.
popul. /
Pop.
density
79 15.700 10.135
Norte 64 12.600 3.745 175,9
Centro 66 13.200 2.383 84,3
Lisboa 112 22.300 2.819 944,5
Alentejo 72 14.300 757 23,8
Algarve 85 16.800 430 87,2
Açores 75 14.900 245 105,8
Madeira 105 20.800 247 308,9
80 15.800 10.627Portugal (NUTS 1)
PIB por hab. / GDP per inhab. Popul. Residente /
Territórios /
Territories
Continente / Mainland
1-No. of inhabitants on 1 January 2009.
Note: comma (point) is used as the decimal (thousand) separator.
Notes
Comma (point) is used as the decimal (thousand) separator.
Population density: No. of inhabitants per km2.
1- No. of inhabitants on 1 January 2009.
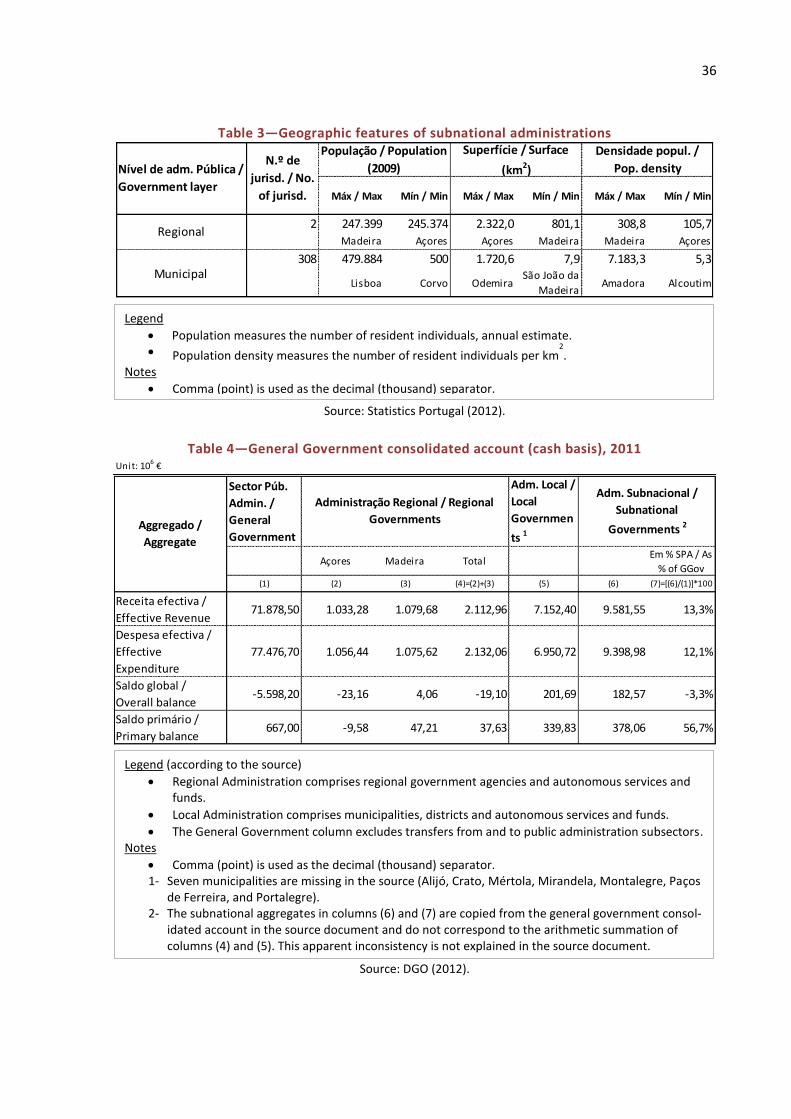
36
Table 3—Geographic features of subnational administrations
Source: Statistics Portugal (2012).
Table 4—General Government consolidated account (cash basis), 2011
Source: DGO (2012).
Máx / Max Mín / Min Máx / Max Mín / Min Máx / Max Mín / Min
2 247.399 245.374 2.322,0 801,1 308,8 105,7
Madeira Açores Açores Madeira Madeira Açores
308 479.884 500 1.720,6 7,9 7.183,3 5,3
Lisboa Corvo OdemiraSão João da
MadeiraAmadora Alcoutim
Densidade popul. /
Pop. density
Municipal
Regional
Superfície / Surface
(km2)
População / Population
(2009)Nível de adm. Pública /
Government layer
N.º de
jurisd. / No.
of jurisd.
Unit: 106 €
Sector Púb.
Admin. /
General
Government
Adm. Local /
Local
Governmen
ts 1
Açores Madeira TotalEm % SPA / As
% of GGov
(1) (2) (3) (4)=(2)+(3) (5) (6) (7)=[(6)/(1)]*100
Receita efectiva /
Effective Revenue71.878,50 1.033,28 1.079,68 2.112,96 7.152,40 9.581,55 13,3%
Despesa efectiva /
Effective
Expenditure
77.476,70 1.056,44 1.075,62 2.132,06 6.950,72 9.398,98 12,1%
Saldo global /
Overall balance-5.598,20 -23,16 4,06 -19,10 201,69 182,57 -3,3%
Saldo primário /
Primary balance667,00 -9,58 47,21 37,63 339,83 378,06 56,7%
Adm. Subnacional /
Subnational
Governments 2
Administração Regional / Regional
GovernmentsAggregado /
Aggregate
Legend Population measures the number of resident individuals, annual estimate. Population density measures the number of resident individuals per km
2.
Notes Comma (point) is used as the decimal (thousand) separator.
Legend (according to the source)
Regional Administration comprises regional government agencies and autonomous services and funds.
Local Administration comprises municipalities, districts and autonomous services and funds.
The General Government column excludes transfers from and to public administration subsectors. Notes
Comma (point) is used as the decimal (thousand) separator. 1- Seven municipalities are missing in the source (Alijó, Crato, Mértola, Mirandela, Montalegre, Paços
de Ferreira, and Portalegre). 2- The subnational aggregates in columns (6) and (7) are copied from the general government consol-
idated account in the source document and do not correspond to the arithmetic summation of columns (4) and (5). This apparent inconsistency is not explained in the source document.
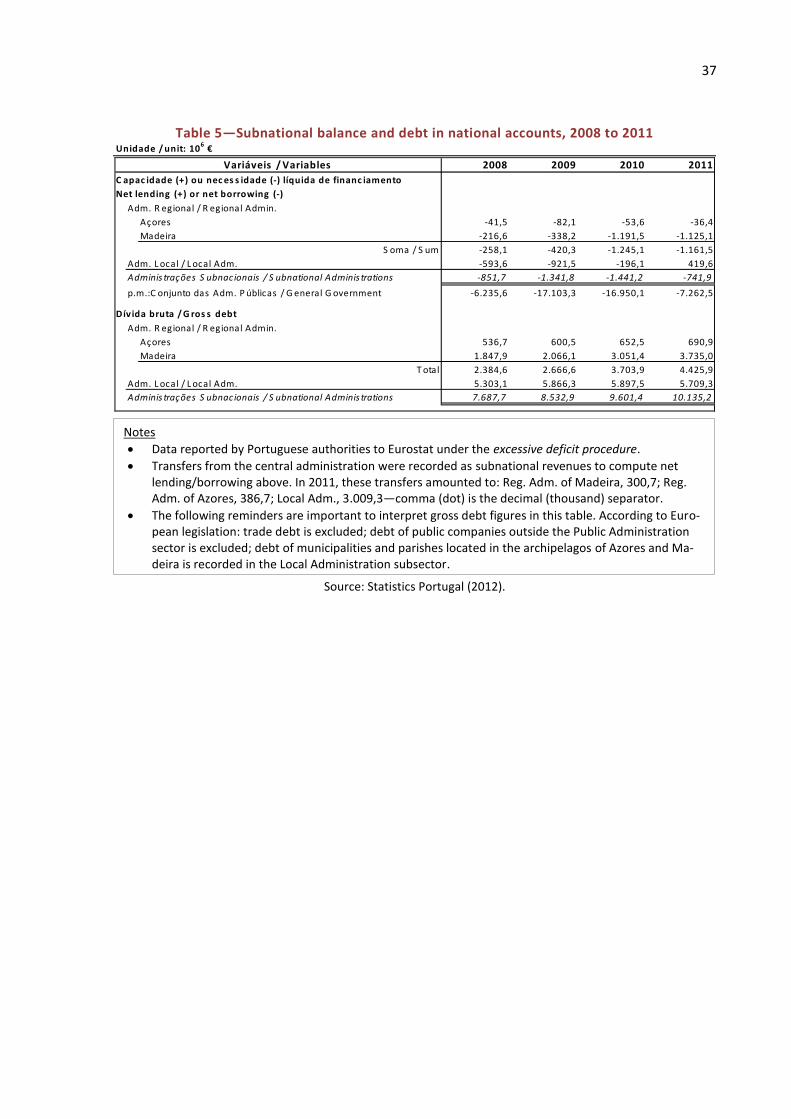
37
Table 5—Subnational balance and debt in national accounts, 2008 to 2011
Source: Statistics Portugal (2012).
Unidade / unit: 106 €
2008 2009 2010 2011
C apac idade (+) ou nec es s idade (-) líquida de financ iamento
Net lending (+) or net borrowing (-)
Adm. R egional / R egional Admin.
Açores -41,5 -82,1 -53,6 -36,4
Madeira -216,6 -338,2 -1.191,5 -1.125,1
S oma / S um -258,1 -420,3 -1.245,1 -1.161,5
Adm. L ocal / L ocal Adm. -593,6 -921,5 -196,1 419,6
Adminis trações S ubnacionais / S ubnational Adminis trations -851,7 -1.341,8 -1.441,2 -741,9
p.m.:C onjunto das Adm. P úblicas / G eneral G overnment -6.235,6 -17.103,3 -16.950,1 -7.262,5
Dívida bruta / G ros s debt
Adm. R egional / R egional Admin.
Açores 536,7 600,5 652,5 690,9
Madeira 1.847,9 2.066,1 3.051,4 3.735,0
T otal 2.384,6 2.666,6 3.703,9 4.425,9
Adm. L ocal / L ocal Adm. 5.303,1 5.866,3 5.897,5 5.709,3
Adminis trações S ubnacionais / S ubnational Adminis trations 7.687,7 8.532,9 9.601,4 10.135,2
Variáveis / Variables
Notes Data reported by Portuguese authorities to Eurostat under the excessive deficit procedure.
Transfers from the central administration were recorded as subnational revenues to compute net lending/borrowing above. In 2011, these transfers amounted to: Reg. Adm. of Madeira, 300,7; Reg. Adm. of Azores, 386,7; Local Adm., 3.009,3—comma (dot) is the decimal (thousand) separator.
The following reminders are important to interpret gross debt figures in this table. According to Euro-pean legislation: trade debt is excluded; debt of public companies outside the Public Administration sector is excluded; debt of municipalities and parishes located in the archipelagos of Azores and Ma-deira is recorded in the Local Administration subsector.
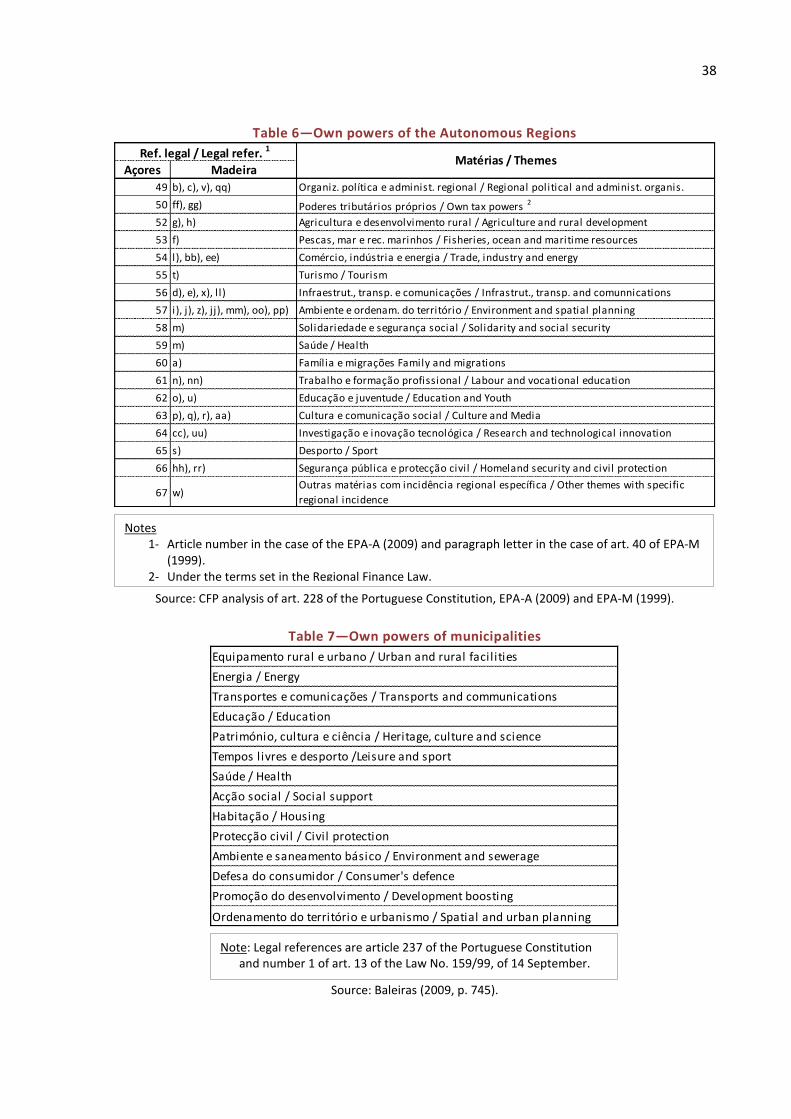
38
Table 6—Own powers of the Autonomous Regions
Source: CFP analysis of art. 228 of the Portuguese Constitution, EPA-A (2009) and EPA-M (1999).
Table 7—Own powers of municipalities
Source: Baleiras (2009, p. 745).
Açores Madeira
49 b), c), v), qq) Organiz. política e administ. regional / Regional political and administ. organis.
50 ff), gg) Poderes tributários próprios / Own tax powers 2
52 g), h) Agricultura e desenvolvimento rural / Agriculture and rural development
53 f) Pescas, mar e rec. marinhos / Fisheries, ocean and maritime resources
54 l), bb), ee) Comércio, indústria e energia / Trade, industry and energy
55 t) Turismo / Tourism
56 d), e), x), l l) Infraestrut., transp. e comunicações / Infrastrut., transp. and comunnications
57 i), j), z), jj), mm), oo), pp) Ambiente e ordenam. do território / Environment and spatial planning
58 m) Solidariedade e segurança social / Solidarity and social security
59 m) Saúde / Health
60 a) Família e migrações Family and migrations
61 n), nn) Trabalho e formação profissional / Labour and vocational education
62 o), u) Educação e juventude / Education and Youth
63 p), q), r), aa) Cultura e comunicação social / Culture and Media
64 cc), uu) Investigação e inovação tecnológica / Research and technological innovation
65 s) Desporto / Sport
66 hh), rr) Segurança pública e protecção civil / Homeland security and civil protection
67 w)Outras matérias com incidência regional específica / Other themes with specific
regional incidence
Ref. legal / Legal refer. 1Matérias / Themes
Equipamento rural e urbano / Urban and rural facil ities
Energia / Energy
Transportes e comunicações / Transports and communications
Educação / Education
Património, cultura e ciência / Heritage, culture and science
Tempos livres e desporto /Leisure and sport
Saúde / Health
Acção social / Social support
Habitação / Housing
Protecção civil / Civil protection
Ambiente e saneamento básico / Environment and sewerage
Defesa do consumidor / Consumer's defence
Promoção do desenvolvimento / Development boosting
Ordenamento do território e urbanismo / Spatial and urban planning
Notes 1- Article number in the case of the EPA-A (2009) and paragraph letter in the case of art. 40 of EPA-M
(1999). 2- Under the terms set in the Regional Finance Law.
Note: Legal references are article 237 of the Portuguese Constitution and number 1 of art. 13 of the Law No. 159/99, of 14 September.
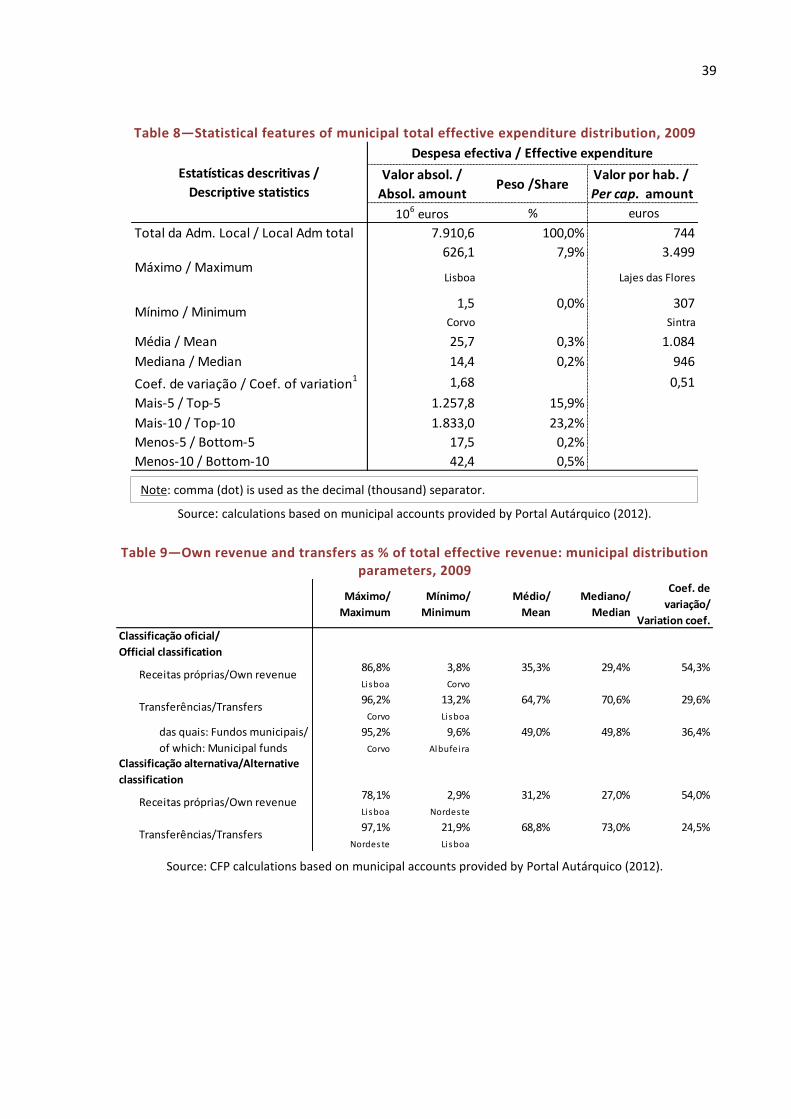
39
Table 8—Statistical features of municipal total effective expenditure distribution, 2009
Source: calculations based on municipal accounts provided by Portal Autárquico (2012).
Table 9—Own revenue and transfers as % of total effective revenue: municipal distribution parameters, 2009
Source: CFP calculations based on municipal accounts provided by Portal Autárquico (2012).
Valor absol. /
Absol. amountPeso /Share
Valor por hab. /
Per cap. amount
106 euros % euros
Total da Adm. Local / Local Adm total 7.910,6 100,0% 744
626,1 7,9% 3.499
Lisboa Lajes das Flores
1,5 0,0% 307
Corvo Sintra
Média / Mean 25,7 0,3% 1.084
Mediana / Median 14,4 0,2% 946
Coef. de variação / Coef. of variation1 1,68 0,51
Mais-5 / Top-5 1.257,8 15,9%
Mais-10 / Top-10 1.833,0 23,2%
Menos-5 / Bottom-5 17,5 0,2%
Menos-10 / Bottom-10 42,4 0,5%
Máximo / Maximum
Mínimo / Minimum
Despesa efectiva / Effective expenditure
Estatísticas descritivas /
Descriptive statistics
Máximo/
Maximum
Mínimo/
Minimum
Médio/
Mean
Mediano/
Median
Coef. de
variação/
Variation coef.
86,8% 3,8% 35,3% 29,4% 54,3%
Lisboa Corvo
96,2% 13,2% 64,7% 70,6% 29,6%
Corvo Lisboa
95,2% 9,6% 49,0% 49,8% 36,4%
Corvo Albufeira
78,1% 2,9% 31,2% 27,0% 54,0%
Lisboa Nordeste
97,1% 21,9% 68,8% 73,0% 24,5%
Nordeste Lisboa
das quais: Fundos municipais/
of which: Municipal funds
Receitas próprias/Own revenue
Transferências/Transfers
Receitas próprias/Own revenue
Transferências/Transfers
Classificação alternativa/Alternative
classification
Classificação oficial/
Official classification
Note: comma (dot) is used as the decimal (thousand) separator.
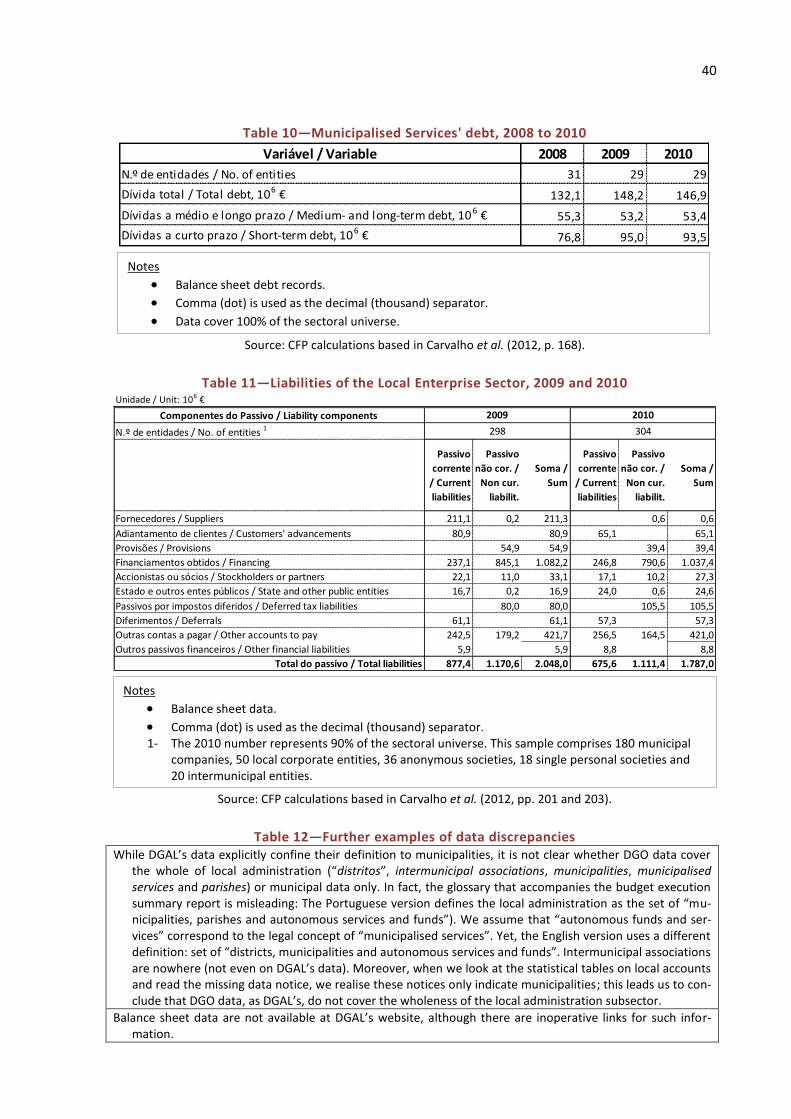
40
Table 10—Municipalised Services' debt, 2008 to 2010
Source: CFP calculations based in Carvalho et al. (2012, p. 168).
Table 11—Liabilities of the Local Enterprise Sector, 2009 and 2010
Source: CFP calculations based in Carvalho et al. (2012, pp. 201 and 203).
Table 12—Further examples of data discrepancies While DGAL’s data explicitly confine their definition to municipalities, it is not clear whether DGO data cover
the whole of local administration (“distritos”, intermunicipal associations, municipalities, municipalised services and parishes) or municipal data only. In fact, the glossary that accompanies the budget execution summary report is misleading: The Portuguese version defines the local administration as the set of “mu-nicipalities, parishes and autonomous services and funds”). We assume that “autonomous funds and ser-vices” correspond to the legal concept of “municipalised services”. Yet, the English version uses a different definition: set of “districts, municipalities and autonomous services and funds”. Intermunicipal associations are nowhere (not even on DGAL’s data). Moreover, when we look at the statistical tables on local accounts and read the missing data notice, we realise these notices only indicate municipalities; this leads us to con-clude that DGO data, as DGAL’s, do not cover the wholeness of the local administration subsector.
Balance sheet data are not available at DGAL’s website, although there are inoperative links for such infor-mation.
Variável / Variable 2008 2009 2010
N.º de entidades / No. of entities 31 29 29
Dívida total / Total debt, 106 € 132,1 148,2 146,9
Dívidas a médio e longo prazo / Medium- and long-term debt, 106 € 55,3 53,2 53,4
Dívidas a curto prazo / Short-term debt, 106 € 76,8 95,0 93,5
Unidade / Unit: 106 €
Componentes do Passivo / Liability components
N.º de entidades / No. of entities 1
Passivo
corrente
/ Current
liabilities
Passivo
não cor. /
Non cur.
liabilit.
Soma /
Sum
Passivo
corrente
/ Current
liabilities
Passivo
não cor. /
Non cur.
liabilit.
Soma /
Sum
Fornecedores / Suppliers 211,1 0,2 211,3 0,6 0,6
Adiantamento de clientes / Customers' advancements 80,9 80,9 65,1 65,1
Provisões / Provisions 54,9 54,9 39,4 39,4
Financiamentos obtidos / Financing 237,1 845,1 1.082,2 246,8 790,6 1.037,4
Accionistas ou sócios / Stockholders or partners 22,1 11,0 33,1 17,1 10,2 27,3
Estado e outros entes públicos / State and other public entities 16,7 0,2 16,9 24,0 0,6 24,6
Passivos por impostos diferidos / Deferred tax liabilities 80,0 80,0 105,5 105,5
Diferimentos / Deferrals 61,1 61,1 57,3 57,3
Outras contas a pagar / Other accounts to pay 242,5 179,2 421,7 256,5 164,5 421,0
Outros passivos financeiros / Other financial liabilities 5,9 5,9 8,8 8,8
Total do passivo / Total liabilities 877,4 1.170,6 2.048,0 675,6 1.111,4 1.787,0
2009
298 304
2010
Notes
Balance sheet debt records.
Comma (dot) is used as the decimal (thousand) separator.
Data cover 100% of the sectoral universe.
Notes
Balance sheet data.
Comma (dot) is used as the decimal (thousand) separator. 1- The 2010 number represents 90% of the sectoral universe. This sample comprises 180 municipal
companies, 50 local corporate entities, 36 anonymous societies, 18 single personal societies and 20 intermunicipal entities.
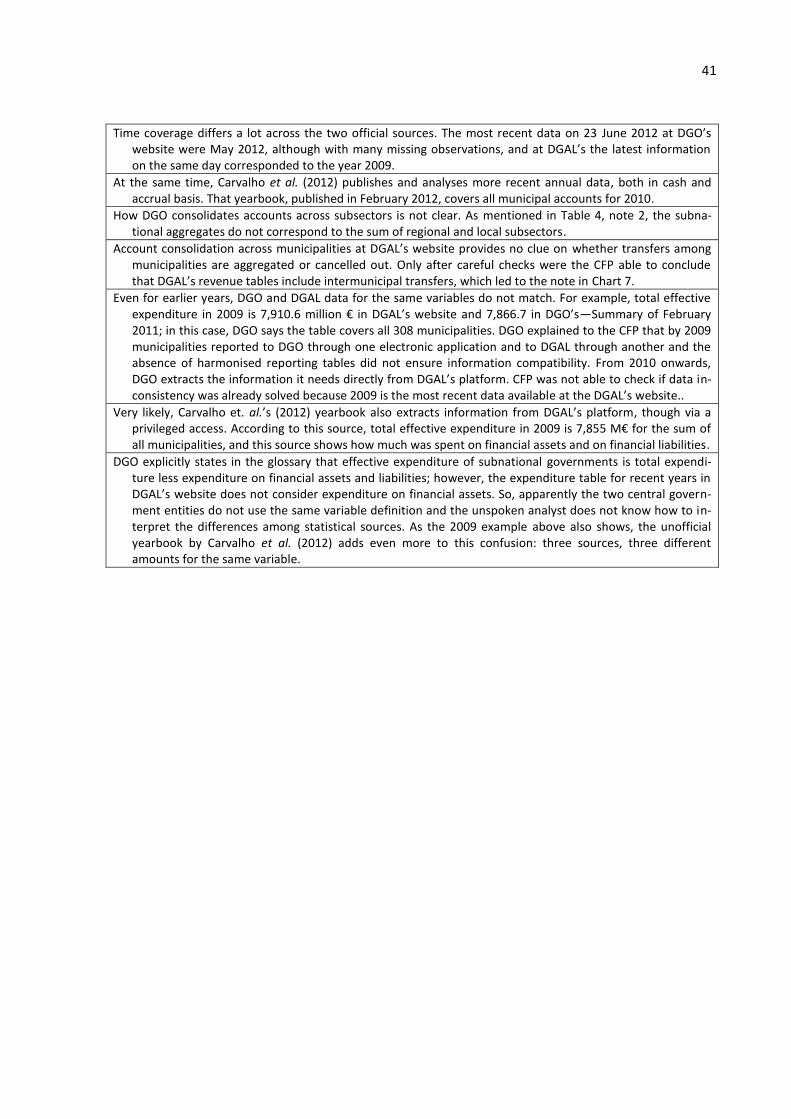
41
Time coverage differs a lot across the two official sources. The most recent data on 23 June 2012 at DGO’s website were May 2012, although with many missing observations, and at DGAL’s the latest information on the same day corresponded to the year 2009.
At the same time, Carvalho et al. (2012) publishes and analyses more recent annual data, both in cash and accrual basis. That yearbook, published in February 2012, covers all municipal accounts for 2010.
How DGO consolidates accounts across subsectors is not clear. As mentioned in Table 4, note 2, the subna-tional aggregates do not correspond to the sum of regional and local subsectors.
Account consolidation across municipalities at DGAL’s website provides no clue on whether transfers among municipalities are aggregated or cancelled out. Only after careful checks were the CFP able to conclude that DGAL’s revenue tables include intermunicipal transfers, which led to the note in Chart 7.
Even for earlier years, DGO and DGAL data for the same variables do not match. For example, total effective expenditure in 2009 is 7,910.6 million € in DGAL’s website and 7,866.7 in DGO’s—Summary of February 2011; in this case, DGO says the table covers all 308 municipalities. DGO explained to the CFP that by 2009 municipalities reported to DGO through one electronic application and to DGAL through another and the absence of harmonised reporting tables did not ensure information compatibility. From 2010 onwards, DGO extracts the information it needs directly from DGAL’s platform. CFP was not able to check if data in-consistency was already solved because 2009 is the most recent data available at the DGAL’s website..
Very likely, Carvalho et. al.’s (2012) yearbook also extracts information from DGAL’s platform, though via a privileged access. According to this source, total effective expenditure in 2009 is 7,855 M€ for the sum of all municipalities, and this source shows how much was spent on financial assets and on financial liabilities.
DGO explicitly states in the glossary that effective expenditure of subnational governments is total expendi-ture less expenditure on financial assets and liabilities; however, the expenditure table for recent years in DGAL’s website does not consider expenditure on financial assets. So, apparently the two central govern-ment entities do not use the same variable definition and the unspoken analyst does not know how to in-terpret the differences among statistical sources. As the 2009 example above also shows, the unofficial yearbook by Carvalho et al. (2012) adds even more to this confusion: three sources, three different amounts for the same variable.


