195
1 CG

1
CG
i
TABLE OF CONTENTS
SECTION A – INTRODUCTION ................................................................................ 1
1. INTRODUCTION ...........................................................................................................1
1.1 INTRODUCTION TO NELSON MANDELA BAY ......................................................1
1.1.1 The Regional Context ........................................................................... 3
1.1.2 Strategic Development Review (SDR) .................................................. 5
1.1.3 Situational Analysis of the NMBM Built Environment, 2018 ................... 5
1.2 INSTITUTIONALISING THE BUILT ENVIRONMENT PERFORMANCE PLAN IN
THE MUNICIPAL PLANNING SYSTEM.....................................................................6
1.2.1 Purpose of the BEPP ............................................................................ 6
1.2.2 Adoption of the BEPP by Council .......................................................... 7
1.2.3 Planning Alignment External and Internal: SDG’S, IUDF, BEPP, IDP,
SDF and Budget ................................................................................... 7
1.2.4 Alignment of BEPP, IDP and MSDF .................................................... 10
1.2.5 Fostering alignment and transversal Arrangements for BEPP
preparation and maintenance ............................................................. 11
1.3 CRITICAL ANALYSIS OF THE EFFECTIVENESS OF TRANSVERSAL
INSTITUTIONAL ARRANGEMENTS ...................................................................... 18
SECTION B – SPATIAL PLANNING AND TARGETING ........ ................................ 20
2. SPATIAL TARGETING AND PLANNING FOR PRIORITY SPATIAL
TARGETING AREAS ................................................................................................. 20
2.1 SPATIAL DEVELOPMENT STRATEGY......................................................... 20
2.2 INSTITUTIONAL ARRANGEMENTS FOR SPATIAL PLANNING AND
TARGETING ............................................................................................................... 96
SECTION C – CATALYTIC URBAN DEVELOPMENT PROGRAMME A ND
PREPARATION ....................................... ............................................................... 99
3. CATALYTIC URBAN DEVELOPMENT PROGRAMME ....................................... 99
3.1 PROGRAMME PREPARATION ............................................................................. 114
3.2 INTERGOVERNMENTAL PROJECT PIPELINE ................................................. 115
3.3 INSTITUTIONAL ARRANGEMENTS .................................................................... 121
3.3.1 Leadership And Good Governance ......................................................121
3.3.2 Inter-sectoral Municipal Provincial, SOE, National Consultation ...........125
3.3.3 Risk Mitigation ......................................................................................133
ii
SECTION D – CATALYTIC URBAN DEVELOPMENT RESOURCING .................134
4. INVESTMENT STRATEGIES, RESOURCING PLAN AND INSTITUTIONAL
ARRANGEMENTS ................................................................................................... 134
4.1 LONG-TERM FINANCIAL SUSTAINABILITY STRATEGY ............................134
4.2 RESOURCING THE PROJECT PIPELINE/SPATIAL BUDGET MIX .............136
4.3 INVESTMENT STRATEGY ...........................................................................148
4.3.1 Application of Grant Allocations ............................................................148
4.3.2 Proposed Urban Settlements Development Plan .................................150
4.4 VALUE OF PROGRAMMES AND PROJECTS BY SECTOR ........................150
4.5 INSTITUTIONAL ARRANGEMENTS ............................................................151
SECTION E – CATALYTIC URBAN DEVELOPMENT PROGRAMME
RESOURCING/IMPLEMENTATION ......................... .............................................154
5. LAND RELEASE, PROCUREMENT AND REGULATORY REFORM .............. 154
5.1 LAND ASSEMBLY AND RELEASE STRATEGY ...........................................154
5.2 PROCUREMENT APPROACH FOR CATALYTIC URBAN DEVELOPMENT
PROGRAMMES ............................................................................................156
5.3 REGULATORY REFORM PROGRAMME .....................................................156
5.4 INSTITUTIONAL ARRANGEMENTS .................................................................... 158
5.4.1 Capital Programme ..............................................................................158
5.4.2 Capacity Support Implementation Plan (CSIP) .......................................... 159
SECTION F – URBAN MANAGEMENT ...................... ...........................................163
6. URBAN MANAGEMENT AND INSTITUTIONAL ARRANGEMENTS ............... 163
6.1 URBAN MANAGEMENT INTERVENTIONS .................................................163
6.2 INSTITUTIONAL ARRANGEMENTS AND OPERATING BUDGET ................. 173
6.3 CONSOLIDATED OPERATING BUDGET ........................................................... 183
SECTION G – REPORTING AND EVALUATION .............. ....................................184
7. BUILT ENVIRONMENT OUTCOME INDICATORS AND TARGETS AND
THEORY OF CHANGE ............................................................................................ 184
7.1 BUILT ENVIRONMENT OUTCOME INDICATORS AND TARGETS .............184
7.2 THEORY OF CHANGE .................................................................................184
8. BIBLIOGRAPHY ...................................... ......................................................186
iii
LIST OF ANNEXURES
ANNEXURE “A” Guidance Note : Framework for the formulation of Built
Environment Plans (BEPP) and Supplementary Guidance
Note for the Built Environment Performance Plans (BEPP)
2018/19-2020/21 (National Treasury, Cities Support
Programme)
ANNEXURE “B” Strategic Development Review, 2014
ANNEXURE “C” BEPP Situational Analysis of Nelson Mandela Bay, 2018
ANNEXURE “D” 2018 /19 Strategic Planning Time Schedule
ANNEXURE “E” Development Areas Map
ANNEXURE “F” Informal Settlement Upgrading Project Matrix
ANNEXURE “G” Informal Settlement Upgrading and Relocation Projects
Map
ANNEXURE “H” Typical example of a template for one of the Catalytic
programmes
ANNEXURE “I” Catalytic Programmes Matrix
ANNEXURE “J” Inter-governmental Project Pipeline Matrix
ANNEXURE “K” Spatial Budget Mix Template
ANNEXURE “L” Built Environment Outcome Indicators and Targets
ANNEXURE “M” 2018/19 Urban Settlements Development Grant Plan
ANNEXURE “N” Sub National Doing Business Reform Action plan
ANNEXURE “O” BEPP Evaluation Framework - Self Assessment

iv
LIST OF ACRONYMS
AEL Air Emissions Licence
APDP Automotive Production and Development Programme
ATTP Assistance to the Poor
BEP Bucket Eradication Programme
BEPP
BMSTT
Built Environment Performance Plan
BEPP Multi Sectoral Task Team
BPAMS Building Plan Application Management System
BRT Bus Rapid Transport
CBD Central Business District
CDC Coega Development Corporation
CETT Corporate Environmental Task Team
CGDS
CSEZ
City Growth and Development Strategy
Coega Special Economic Zone
CITP Comprehensive Integrated Transport Plan
CoGTA Department of Cooperative Governance and Traditional
Affairs
COO Chief Operating Officer
CORPGIS Corporate Geographic Information Systems
CSEZ
CSIP
Coega Special Economic Zone
Capacity Support Implementation Plan
CSP City Support Programme
CWWTW Coega Waste Water Treatment Works
DAFF Department of Fisheries and Forestry
DBSA Development Bank of Southern Africa
DEDEAT Department of Economic Development, Environmental Affairs
and Tourism
DME Department of Minerals and Energy
DORA
DPW
Division of Revenue Act
Department of Public Works
DTI Department of Trade and Industry
DWA Department of Water Affairs
DWS Department of Water and Sanitation
EC Eastern Cape
ECSECC Eastern Cape Socio-economic Consultative Council
EDRS Economic Development & Recreational Services
v
EIA Environmental Impact Assessment
EMF Environmental Management Framework
ETC Eastern Cape Training Centre
EPRU Eastern Province Rugby Union
FWFWWTW Fish Water Flats Waste Water Treatment Works
GGP Gross Geographic Product
GIS Geographic Information Systems
GRAP 17 Generally Recognised Accounting Practices (Property, Plant
and Equipment)
GVA Gross Value Added
HAD Housing Development Agency
HDMS Housing Delivery Management System
HIV/AIDS Human Immunodeficiency Virus causing the Acquired
Immunodeficiency Syndrome
HSDG Human Settlements Development Grant
HURP Helenvale Urban Renewal Programme
ICC International Convention Centre
ICDG Integrated City Development Grant
ICLEI International Council for Local Environmental Initiatives
IDP Integrated Development Plan
SEZ Special Economic Zone
IHHSG Integrated Housing and Human Settlements Grant
ILIS Integrated Land Information System
INEP Integrated National Electrification Programme
IPTS Integrated Public Transport System
IT Information Technology
ITP Integrated Transport Plan
LAMS Land Asset Management System
LED Local Economic Development
LPMAS Land Planning Application Management System
LSDF Local Spatial Development Framework
LTGDP
LTFS
Long Term Growth and Development Plan
Long Term Financial Strategy
LUMS Land Use Management System
MBDA Mandela Bay Development Agency
MDTTT Multi-Disciplinary Technical Task Team
MIDP Motor Industry Development Programme
Multi OEM Multi Original Equipment Manufacturers Complex

vi
MOSS Metropolitan Open Space System
MPT Municipal Planning Tribunal
MRF Materials Recovery Facility
MSDF Metropolitan Spatial Development Framework
MSW Municipal Solid Waste
MURP Motherwell Urban Renewal Programme
NDP National Development Plan
NDP Neighbourhood Development Partnership
NDPG Neighbourhood Development Partnership Grant
NEMA National Environmental Management Act
NFSD National Framework for Sustainable Development
NLLS Nooitgedacht Low Level Scheme
NMBBC Nelson Mandela Bay Business Chamber
NMBM Nelson Mandela Bay Municipality
NMBM IDP Nelson Mandela Bay Municipality’s Integrated Development
Plan
NMBMM Nelson Mandela Bay Metropolitan Municipality
NMMOSS Nelson Mandela Metropolitan Open Space System
NMMU
NMU
Nelson Mandela Metropolitan University (pre 2017)
Nelson Mandela University
NSSD National Strategy for Sustainable Development
PE Port Elizabeth
NT National Treasury
PDoHS Provincial Department of Human Settlements
PICC Presidential Infrastructure Coordinating Commission
PPC Pretoria Portland Cement Company
PPF Project Preparation Facility
PRASA Public Rail Authority of South Africa
PTIG Public Transport Infrastructure Grant
PTIS Public Transport Infrastructure and Systems
PTISG Public Transport Infrastructure and Systems Grant
PTNO Public Transport Network Operator
PTOG Public Transport Operating Grant
PTP Public Transport Plan
RDP Reconstruction and Development Programme
RE Scheme Return Effluent Scheme
ROD Record of Decision
SALGA South African Local Government Association

vii
SANRAL South African National Roads Agency Limited
SAPS South African Police Services
SCU Sustainable Community Unit
SCUs Sustainable Community Units
SDBIP Service Delivery and Budget Implementation Plan
SDC Service Delivery Cluster
SDR Strategic Development Review
SEZ Special Economic Zone
SIPs Strategic Infrastructure Projects
SMP Sanitation Master Plan
SOE State Owned Enterprise
SPLUMA Spatial Planning and Land Use Management Act
SPUU Safety and Peace through Urban Upgrading Programme
SRA Special Rating Area
StatsSA Statistics South Africa
TNPA Transnet National Ports Authority
UNS Urban Network Strategy
USDG Urban Settlements Development Grant
W&S Water and Sanitation
WMP Water Master Plan
WtE Waste-to-Energy
WUL Water Use Licence
WWTW Waste Water Treatment Works

Built Environment Performance Plan (BEPP) - Nelson Mandela Bay, 2018/19 – 2020/21
1
SECTION A – INTRODUCTION
1. INTRODUCTION
1.1 INTRODUCTION TO NELSON MANDELA BAY
Nelson Mandela Bay Municipality (NMBM) is the largest of two Category A
Metropolitan Municipalities located on the Southern coast of the Eastern Cape
Province.
With a population of 1 271 776, the NMBM has approximately 17% of the
population of the Eastern Cape Province and is a major economic role player
in the Province with two ports – the Port of Port Elizabeth and the Port of
Ngqura located in the Coega Special Economic Zone (CSEZ).
Nelson Mandela Bay

Built Environment Performance Plan (BEPP) - Nelson Mandela Bay, 2018/19 – 2020/21
2
The city has a growth rate of 1.36%, (lower than that of other metropolitan
areas, such as Ekurhuleni (2.47%) and Tshwane (3.1%)), and is characterised
by a young population, with the age group of 5 to 14 years dominating.
Nelson Mandela Bay has the lowest proportion of informal households among
South African Metropolitan Municipalities, having significantly reduced the
numbers since 2001 (SACN, 2016). In addition, the average number of
people per household declined from 4, 25 in 1996 to 3, 55 in 2011.
Between 2001 and 2011, the total number of people living below the poverty
line decreased from 46% to 29% (SACN, 2016). Altogether 30% of formal
households in Nelson Mandela Bay are dependent on the municipal indigent
subsidy.
Nelson Mandela Bay is the driver of the Eastern Cape economy, contributing
41,81% of the provincial Gross Geographic Product (GGP) (Global Insight,
2013). The unemployment rate dropped from 46,4% in 2001 to 36,6% in
2011. The Eastern Cape Province’s average unemployment rate was 37.4%
in 2011 (SACN, 2016).
The largest economic sectors in Nelson Mandela Bay Metro are
manufacturing, finance, community services and transport. Community
services, trade and manufacturing sectors are the sectors that create the most
employment in the Metro. The city offers a wealth of tourism and recreation
opportunity due to its biodiversity, beaches and open spaces.
In a spatial sense the city is relatively low density with an average density of
20 residential units per hectare of developed land. The spatial pattern of the
city is one of segregation with lower incomes and higher densities
characterising the northern parts of the city and higher incomes and lower
densities to the south and west.
Built Environment Performance Plan (BEPP) - Nelson Mandela Bay, 2018/19 – 2020/21
3
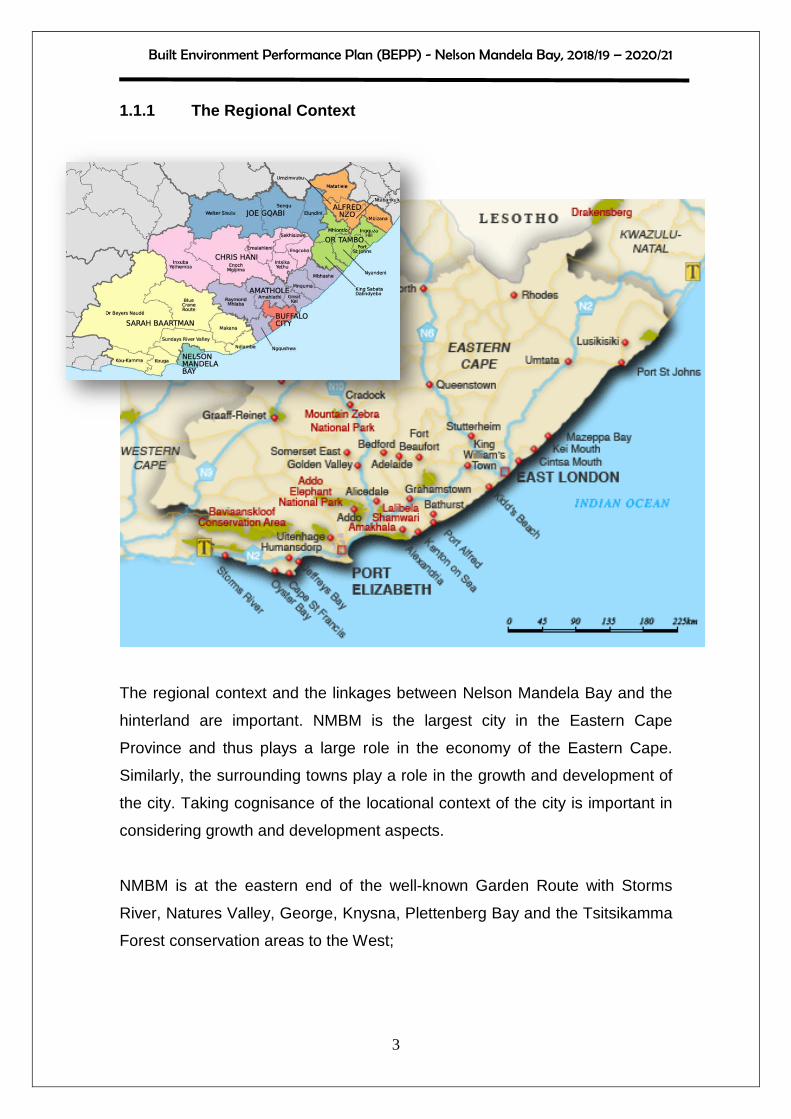
1.1.1 The Regional Context
The regional context and the linkages between Nelson Mandela Bay and the
hinterland are important. NMBM is the largest city in the Eastern Cape
Province and thus plays a large role in the economy of the Eastern Cape.
Similarly, the surrounding towns play a role in the growth and development of
the city. Taking cognisance of the locational context of the city is important in
considering growth and development aspects.
NMBM is at the eastern end of the well-known Garden Route with Storms
River, Natures Valley, George, Knysna, Plettenberg Bay and the Tsitsikamma
Forest conservation areas to the West;

Built Environment Performance Plan (BEPP) - Nelson Mandela Bay, 2018/19 – 2020/21
4
Jeffreys Bay, Oyster Bay, St Francis Bay and Cape St Francis to the
immediate West are part of the Kouga Municipality. Kouga is the energy hub
of the region with more than 280 wind turbines on several wind farms in the
area. These destinations are also popular destinations for local and
international tourists. Jeffreys Bay is internationally renowned for its surfing
opportunities and regular international surfing events are hosted at its world
famous beaches.
Willowmore, Steytlerville and the Baviaanskloof to the North West are popular
local and international eco-tourism destinations. Patensie, the Gamtoos River
valley and Hankey form part of the important agricultural hinterland. Kirkwood
and the Sundays River valley to the north are important dairy, citrus and
vegetable agriculture areas.
Game parks in the vicinity of Grahamstown as well as towns such as Graaff
Reinett, Nieu Bethesda, Cradock and the Mountain Zebra National Park to the
North - together with the Addo Elephant Park- attract many tourists.
Alexandra, Kenton-on-Sea and Port Alfred are along the route connecting
Nelson Mandela Bay with East London to the East and form part of the
popular Sunshine Coast route attractions.
Grahamstown to the North East with its Rhodes University is an academic
centre of the region and focal point for tourism in the region.
The City has an airport, with international status within five minutes of the City
centre. It is well serviced by rail linkages to Gauteng and is connected by
good quality roads to the rest of the country.
The location of NMBM in its regional context presents many advantages and
possibilities for NMBM to capitalise on the tourism trade. The city and its two
Built Environment Performance Plan (BEPP) - Nelson Mandela Bay, 2018/19 – 2020/21
5
ports further enhance its attraction for trade and industry. Agricultural produce
from the hinterland is distributed from the city.
1.1.2 Strategic Development Review (SDR)
During 2014 it was acknowledged that a number of indicators show that the
NMBM had entered a low growth trap which weakens long term prospects for
economic growth, poverty reduction, and fiscal sustainability of the
municipality. The major indicators have not changed positively from 2014 to
2018.
Economic performance of the metro is weak with low investor confidence,
joblessness and widespread economic exclusion. Although the metro has
made impressive strides in expanding access to housing and basic services,
this success itself threatens the fiscal viability of the metro over the long term
as low payment levels and rising operating costs erode its capacity to fund the
significant investments required in infrastructure extension, maintenance and
replacement.
The City Support Programme enabled a Strategic Development Review
(SDR) through engagement with the political and administrative leadership.
This review assessed the development challenges and opportunities facing
the city and initiated a strategic planning process which involved the
development of a number of possible scenarios linked to important
development choices to be made.
A copy of the approved Strategic Development Review is attached as
Annexure “B”.
1.1.3 Situational Analysis of the NMBM Built Enviro nment, 2018
A Situational analysis of the NMBM Built Environment is attached as
Annexure “C” and gives a comprehensive overview of the built environment

Built Environment Performance Plan (BEPP) - Nelson Mandela Bay, 2018/19 – 2020/21
6
circumstances of Nelson Mandela Bay according to information available in
2018. The Situational Analysis contains important contextual information for
this BEPP.
Within this context the BEPP is developed as a planning tool to align,
consolidate and focus the existing strategic planning instruments into a
spatially targeted investment and implementation plan. This is intended to
assist the city to achieve more equitable, inclusive and sustainable growth in a
spatially transformed city that overcomes imbalances of the past and
accommodates growth and redevelopment within a more sustainable and
equitable city context.
1.2 INSTITUTIONALISING THE BUILT ENVIRONMENT PERFOR MANCE
PLAN IN THE MUNICIPAL PLANNING SYSTEM
This Built Environment Performance Plan (BEPP) is prepared to conform to
the BEPP content and format provided by National Treasury in the Guidance
Note: Framework for the formulation of Built Environment Plans (BEPP) and
Supplementary Guidance Note for the Built Environment Performance Plans
(BEPP) 2018/19-2020/21. It should be read in conjunction with the prior
annual BEPP submissions for additional background information.
A copy of the Guidance Notes is attached as Annexure “A” for reference
purposes.
1.2.1 Purpose of the BEPP
The BEPP is an outcomes led plan aiming to achieve a more productive,
sustainable, inclusive and well governed City with a complementary urban
form to reduce poverty, inequality and enhance more inclusive urban growth.
The ultimate impact of the BEPP initiatives and processes should be inclusive,
sustainable economic growth.

Built Environment Performance Plan (BEPP) - Nelson Mandela Bay, 2018/19 – 2020/21
7
The BEPP is a requirement of the Division of Revenue Act (DoRA) in respect
of the various infrastructure grants related to the built environment of
metropolitan municipalities and permits access to the following conditional
grants:
• Integrated City Development Grant (ICDG)
• Urban Settlements Development Grant (USDG)
• Human Settlements Development Grant (HSDG)
• Public Transport Infrastructure Grant (PTIG)
• Neighbourhood Partnership Development Grant (NDPG)
• Integrated National Electrification Grant (INEP)
The BEPP aims to demonstrate the use of these grants for the purpose of
spatial transformation through targeting capital expenditure in areas that will
maximise the positive impact on citizens, leverage private sector investment,
and support growth and development towards a transformed spatial form and
a more compact city.
This Built Environment Performance Plan builds on the foundation for
refinement and consolidation of the prior BEPP’s particularly the 2015/16
BEPP.
1.2.2 Adoption of the BEPP by Council
A draft 2018/19 BEPP was submitted to National Treasury by 31 March 2018,
this final BEPP is submitted to National Treasury in compliance with DoRA, by
31 May 2018.
1.2.3 Planning Alignment External and Internal: SDG ’S, IUDF, BEPP,
IDP, SDF and Budget
The BEPP is to be read together with, and is complementary to, the
Municipality’s key strategic documents, including the Long Term City Growth
Built Environment Performance Plan (BEPP) - Nelson Mandela Bay, 2018/19 – 2020/21
8
and Development Plan, the Integrated Development Plan (IDP), the Budget,
the Spatial Development Framework (SDF) and the Comprehensive
Integrated Transport Plan (CITP).
The BEPP can be seen to represent the investment strategy of the
Municipality in fulfilling its objectives of equitable city development,
transformed spatial form and more compact city development.
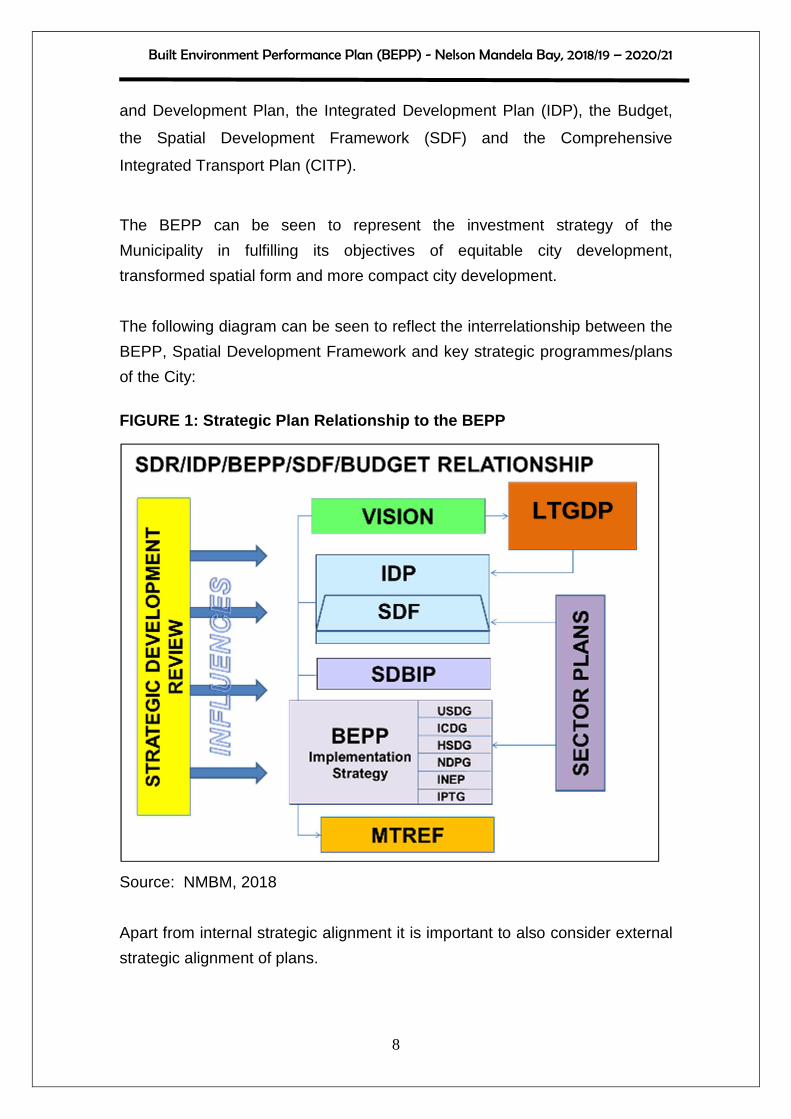
The following diagram can be seen to reflect the interrelationship between the
BEPP, Spatial Development Framework and key strategic programmes/plans
of the City:
FIGURE 1: Strategic Plan Relationship to the BEPP
Source: NMBM, 2018
Apart from internal strategic alignment it is important to also consider external
strategic alignment of plans.
LTGDP
Built Environment Performance Plan (BEPP) - Nelson Mandela Bay, 2018/19 – 2020/21
9
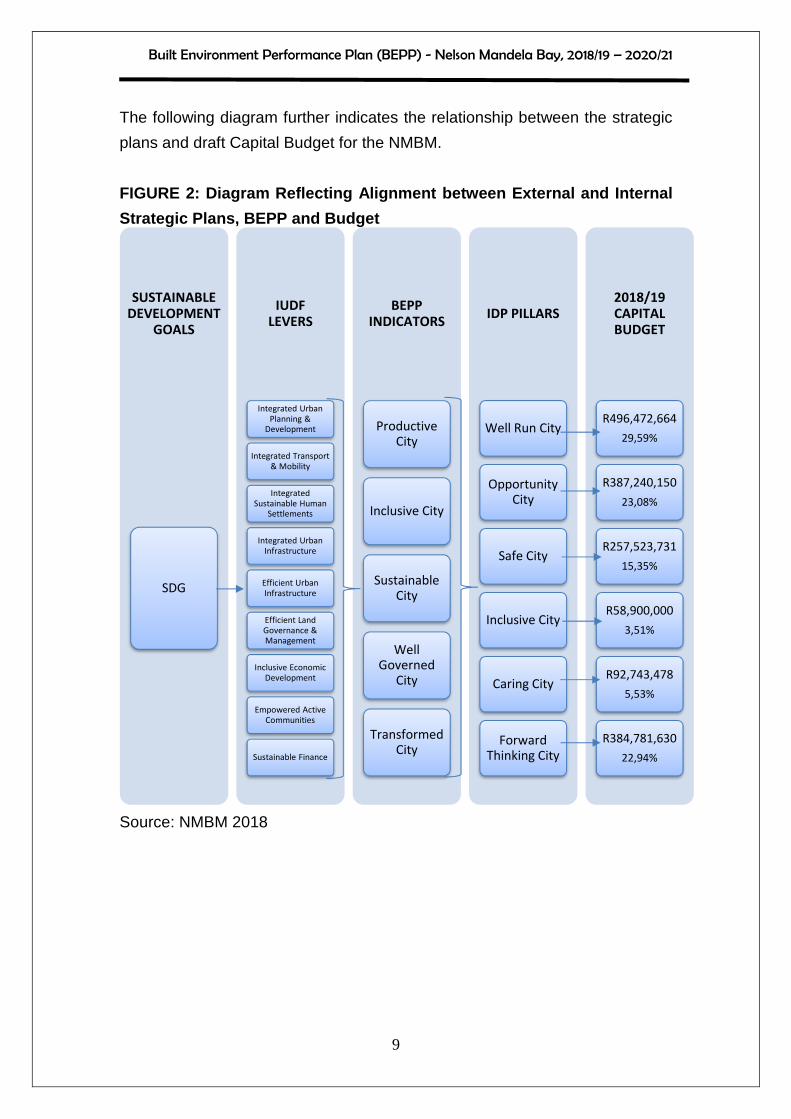
The following diagram further indicates the relationship between the strategic
plans and draft Capital Budget for the NMBM.
FIGURE 2: Diagram Reflecting Alignment between Exte rnal and Internal
Strategic Plans, BEPP and Budget
Source: NMBM 2018
SUSTAINABLE
DEVELOPMENT
GOALS
SDG
IUDF
LEVERS
Integrated Urban
Planning &
Development
Integrated Transport
& Mobility
Integrated
Sustainable Human
Settlements
Integrated Urban
Infrastructure
Efficient Urban
Infrastructure
Efficient Land
Governance &
Management
Inclusive Economic
Development
Empowered Active
Communities
Sustainable Finance
BEPP
INDICATORS
Productive
City
Inclusive City
Sustainable
City
Well
Governed
City
Transformed
City
IDP PILLARS
Well Run City
Opportunity
City
Safe City
Inclusive City
Caring City
Forward
Thinking City
2018/19
CAPITAL
BUDGET
R496,472,664
29,59%
R387,240,150
23,08%
R257,523,731
15,35%
R58,900,000
3,51%
R92,743,478
5,53%
R384,781,630
22,94%

Built Environment Performance Plan (BEPP) - Nelson Mandela Bay, 2018/19 – 2020/21
10
1.2.4 Alignment of BEPP, IDP and MSDF
The spatial strategy for transformation and integration of the City is contained
in the BEPP and its Urban Network Strategy, the Spatial Development
Framework and the Sustainable Community Planning Methodology. The
spatial strategy is expanded upon in section 2.1.1 of this report.
An alignment process between the BEPP and a revised SDF is underway to
ensure consistency in terminology and detail. This process will be completed
in the 2018/19 financial year.
The IDP contains a section that deals with the spatial strategy of the NMBM.
Integral to this section is the BEPP method and results.
The following table shows the key areas of alignment between the BEPP,
SDF and IDP.
TABLE 1: Key area of alignment between BEPP, SDF an d IDP Area of Alignment BEPP SDF IDP BUDGET BEPP method Explained Identified Covered in
Spatial Strategy N/A
UNS element: Catalytic Programmes
Identified Alignment in process
Identified Budgeted partially
UNS Element Informal Settlements upgrading
Identified Identified Identified Budgeted
UNS elements: Integration zones, Economic Nodes, Marginalised Residential Areas and informal Settlements
Identified Identified Identified Budgeted
BEPP indicators Identified and populated
Relevant cadastral identification completed and aligned.
Performance Management system recognises responsibility for relevant BEPP indicators
Capital Budget areas identified and populated
Source: NMBM 2018

Built Environment Performance Plan (BEPP) - Nelson Mandela Bay, 2018/19 – 2020/21
11
1.2.5 Fostering alignment and transversal arrangeme nts for BEPP
preparation and maintenance
A number of institutional arrangements have been put in place by the City to
increase alignment and transversal arrangements for the preparation of the
BEPP and BEPP processes. These include the following:
Vision/Mission/Brand Promise and the development of a Long-Term
Growth and Development Plan
An exercise, assisted by the City Support Programme, was undertaken in
2017 to formulate a Long Term City Growth and Development Plan (LTGDP).
This process involved the development of a Vision, Mission and Brand
Promise for the City.
A key feature of the alignment of processes has been the intensive
consultation process undertaken for the preparation of the City Growth and
Development Plan and IDP which impacts upon all strategic planning
including the BEPP.
Focus and strategic sessions with economic actors took place after a series of
questionnaires were circulated.
The consultation process ran parallel to the IDP Ward Committee meetings
that are held and included questionnaires and focus group workshops.
The Strategic Planning Processes aim to deliver on the Long Term Growth
and Development Plan (LTGDP) and the IDP which is extrapolated from the
LTGDP. The Plan was completed in early 2018.
The LTGDP is built around, and drives, the core ideology which was jointly
crafted by the Mayoral Committee in December 2016 as follows.

Built Environment Performance Plan (BEPP) - Nelson Mandela Bay, 2018/19 – 2020/21
12
Mission (purpose)
“To create Freedom, Fairness and Opportunity for all in NMBM; Stop
Corruption; Create jobs and Improve Service Delivery”
Vision
“An iconic, friendly, ocean city driven by innovation, service excellence and
economic development - a destination of choice”
Brand Promise
“One City One Future”
Core Values
• Good Governance
• Integrity
• Proactive
• Caring
• Growth Oriented
• Diversity
The six pillars
The coalition partners have agreed that the desired future of the City rests on
Six Pillars namely;
• a Well-Run City;
• an Opportunity City;
• a Safe City;
• a Caring City;
• an Inclusive City; and
• a Forward-Thinking City.
Built Environment Performance Plan (BEPP) - Nelson Mandela Bay, 2018/19 – 2020/21
13
The longer-term strategies to realise the Vision emanate from these pillars.
These six pillars are foundational to both the Long-Term Growth and
Development Plan and the Integrated Development Plan for 2017-2021 and
the subsequent IDPs. The six pillars determine what the City does today,
tomorrow and into the future.
The Metro’s political and administrative leadership, communities and
economic sector groups consulted throughout the development of the Long
Term Growth and Development Plan have ambitions for a bright future for
Nelson Mandela Bay. It is well-established that progress cannot proceed
across all fronts simultaneously and at equal pace – the essence of strategy is
the optimal prioritisation and making of choices regarding which elements of
an envisioned future are most practically pursued in each phase of its
realisation. In this way, each set of milestones can be achieved through
advance from the solid foundation of delivery preceding it.
The plan sets out broad phasing for the implementation of strategy and adopts
a fifteen-year perspective. It therefore covers the period of three Integrated
Development Plans:
• IDP 1, passed in June 2017, covering the 2017/18 to 2021/22
financial years;
• IDP 2, to be passed in June 2022, covering the 2022/23 to 2026/27
financial years; and
• IDP 3, to be passed in June 2027, covering the 2027/28 to 2031/32
financial years.
Each new IDP builds systematically on the achievements of its predecessors,
through essential progress in each of the following development focus areas:
• Governance and organization-led development
• Infrastructure-led development
• Opportunity-led development
• Development for Resilience

Built Environment Performance Plan (BEPP) - Nelson Mandela Bay, 2018/19 – 2020/21
14
• Development through lifestyle offering
• Development through conservation of our natural, built and cultural
assets
• Safety-enabled development
• People-oriented development
• Technology-led development
Establishment of a Strategic Planning Steering Comm ittee
The Municipality previously had an IDP and Budget Steering Committee to
manage the annual processes related to IDP and Budget preparation and
adoption. In recognition of the need for greater strategic alignment and the
role of the BEPP a Strategic Planning Steering Committee was established in
October 2016 to replace the former IDP and Budget Steering Committee. This
Committee is politically led by the political portfolio head of Economic
Development, Tourism and Agriculture and includes the Mayor’s Office, City
Manager, Chief Financial Officer, Chief Operating Officer as well as portfolio
Councillors and Executive Directors and relevant officials responsible for
Budget and Treasury, Economic Development, Human Settlements,
Infrastructure and Engineering, Electricity and Energy, the City Manager’s
Office and Strategic Planning.
The Terms of Reference of this Committee include oversight over:
• Development and promotion of the Municipality’s mission and vision.
• Development and promotion of a Long-term Growth and Development
Plan
• Development and review of a five-year IDP.
• Development of a medium-term budget which supports the Built
Environment Performance Plan (BEPP) and IDP, is demonstrably
funded, and demonstrably sustainable, as shown by the long term
financial model. Furthermore, its capital projects should be supported
by thorough business cases and feasibility studies.
• Ensuring alignment of the Long-term Growth and Development Plan,
Long-term Financial Plan, BEPP, IDP and Budget.
• Ensuring stakeholder support for strategic planning processes.
Built Environment Performance Plan (BEPP) - Nelson Mandela Bay, 2018/19 – 2020/21
15
The Committee meets monthly and meetings are preceded by a technical
team meeting where aspects relevant to the preparation, and specifically, the
alignment of the strategic plans and the budget are discussed.
Strategic Planning Time Schedule and Alignment Work shops
With the replacement of the IDP and Budget Steering Committee by the
Strategic Planning Steering Committee the former IDP and Budget time
schedule of activities was replaced by a Strategic Planning Time Schedule.
This Time Schedule includes key dates in the programming and alignment of
the Long Term Growth and Development Plan, BEPP, IDP and Budget and is
submitted to Council structures for approval (in accordance with the legislation
applicable to the IDP and Budget processes). This Time Schedule includes
the dates of the Strategic Planning Steering Committee meetings and makes
further provision for three Strategic Planning Workshops at critical times in the
annual planning and budgeting cycle where major strategic decisions are
taken
In preparation for the 2018/19 MTREF the second and third strategic planning
workshops were facilitated by the National treasury CSP Economic
representative.
From 1 July 2018, in preparation for the 2019/20 MTREF, the Time Schedule
will be expanded upon to include a schedule of activities in relation to the
strategic planning for the entire MTREF period and not just one year.
Furthermore, the Time Schedule will be submitted to Council for approval prior
to July in preparation for the start of the financial year.
A copy of the 2018/19 Strategic Planning Time Schedule is attached as
Annexure “D”.

Built Environment Performance Plan (BEPP) - Nelson Mandela Bay, 2018/19 – 2020/21
16
BEPP Multi-Sectoral Task Team (BMSTT) – Transversal Arrangements
The BEPP is prepared in the office of the Chief Operating Officer by the
Integrated City Development Office – Strategic Planning and Coordination.
A BEPP Multi-Sectoral Task Team is chaired by the Senior Director: Strategic
Planning and Coordination in the Office of the Chief Operating Officer. This
Task Team has been formally established for 3 years and is comprised of
senior members from all Directorates in the Municipality, who are designated
by their Executive Directors to form part of the Team and to facilitate BEPP
work and the preparation of the documents.
The team meets monthly and more regularly should it be required. The team
is comprised of representatives with the following responsibilities:
• Strategic Planning
• Performance Management
• Monitoring and Evaluation
• International and Intergovernmental Relations
• Public Health including Parks, Waste Management and the
Environment
• Sports Recreation Arts and Culture
• Safety and Security including Disaster Management
• Economic Development
• Budget and Treasury
• Economic Development
• Town Planning
• Transportation
• Development Support
• Housing Delivery
• Informal Settlements
• Electricity and Energy
Built Environment Performance Plan (BEPP) - Nelson Mandela Bay, 2018/19 – 2020/21
17
• Infrastructure and Engineering – Roads and Storm water, Water and
Sanitation
• The Mandela Bay Development Agency
The BMSTT meetings focus, inter alia, on driving suite of the suite of catalytic
programmes, Integration Zone development, major municipal projects and all
BEPP related matters. In particular, the transversal responsibility for the
programmes and development is emphasised and meetings are deliberately
constructed to foster this culture of transversal responsibility.
Some of the Task Team meetings are devoted to specific focus areas and in
the 2017/18 Financial year sessions have been dedicated to IPTS, PRASA,
Public Works and the Housing Policy change.
Performance Management with a BEPP focus
The catalytic programme suite and the implementation of spatial targeting
through the Urban Network Strategy are included in the performance
management of the city at various levels – either the IDP or the SDBIP.
All of the city transformation outcome indicators are included in the
performance management system of the municipality.
Capital Prioritisation Model
The City, for the first time, developed a draft Capital Prioritisation Model. The
model is deliberately simple and was tested in the budgeting process for the
2018/19 Financial year to a limited extent. Criteria, in relation to the model,
relate directly to the BEPP, Urban Network Strategy and the responsibility for
catalytic programmes and are included in the model. These
projects/programmes will have a higher priority rating for funding. This model
will be refined, developed and used more fully in the 2019/20 Budget
preparation process.

Built Environment Performance Plan (BEPP) - Nelson Mandela Bay, 2018/19 – 2020/21
18
More focussed Engagement with Government Department s and SOC’s
regarding the Urban Network Strategy and Catalytic Programmes
Engagement with some areas of government has become more focussed
around the municipalities Urban Network Strategy and Catalytic Programme.
The specific areas of focus are detailed elsewhere in this report but include
Public Works Department, Human Settlements Department, PRASA, ACSA,
SANRAL, National Department of Transport, Provincial and National
Treasury.
1.3 CRITICAL ANALYSIS OF THE EFFECTIVENESS OF
TRANSVERSAL INSTITUTIONAL ARRANGEMENTS
The NMBM has made great strides in setting up deliberate institutional
arrangements for managing transversal management priorities. Strategic
Planning coordination functions are currently performed through the Strategic
Planning Steering Committee – at a political level, and by the Office of the
Chief Operating Officer (Strategic Planning and Coordination) at an
administrative level.
A challenge has been the absence of a formal organisational structure to
support the work of the coordinating unit which although established is not yet
formalised. This is however being addressed through the imminent adoption
of a new macro structure for the City which recognises and prioritises the
functions and upon adoption will allow staff to be appropriately deployed.
In preparing the 2018/19 BEPP, Executive Directors have been made to sign
off on the inputs made by their BEPP Multi Sectoral Task Team
representatives, this has enhanced institutionalisation and accountability.
Built Environment Performance Plan (BEPP) - Nelson Mandela Bay, 2018/19 – 2020/21
19
A major positive difference has been made in the 2018/19 planning year by
the better integration of performance management, and capital budget
prioritisation aspects in the strategic planning cycle. By incorporating aspects
into performance management the administration will have to take their
responsibilities in this regard more seriously.
Changing the institutional thinking around transversal responsibility for
development programmes is a process which is ongoing, however the
processes and content of key meetings such as the City Budget Fora, Mid-
Year Reviews and Budget and Benchmarking sessions are useful to reinforce
the message.

Built Environment Performance Plan (BEPP) - Nelson Mandela Bay, 2018/19 – 2020/21
20
SECTION B – SPATIAL PLANNING AND TARGETING
2. SPATIAL TARGETING AND PLANNING FOR PRIORITY SPAT IAL
TARGETING AREAS
2.1 SPATIAL DEVELOPMENT STRATEGY
The NMBM Spatial Development Strategy is articulated in a number of
documents. These are identified and elaborated upon below.
2.1.1 Metropolitan Spatial Development Framework (M SDF)
To ensure sustainable growth and development in Nelson Mandela Bay, it is
vital that all strategic planning processes are aligned and fully integrated, so
that development does not take place in an ad hoc or fragmented manner.
Key to this, is the Long Term Growth and Development Plan, mission and
vision discussed above.
The Long Term Growth and Development Plan informs future integrated
development planning, which in turn informs the Spatial Development
Framework of the Municipality. The Metropolitan Spatial Development
Framework (MSDF), contains a number of key sector plans that are
necessary for development.
The Metropolitan Spatial Development Framework in turn informs the Local
Spatial Development Frameworks (LSDFs), which are more specific and
location bound. Within the Local Spatial Development Plans are more
detailed plans for specific precincts.
These frameworks are supported by an Integrated Land Use Management
System (LUMS). The diagram below reflects these linkages:

Built Environment Performance Plan (BEPP) - Nelson Mandela Bay, 2018/19 – 2020/21
21
FIGURE 3: Relationship between Strategic Documents of the NMBM
Source: NMBM, 2018
The Metropolitan Spatial Development Framework outlines the desired spatial
form of the metropolitan area. Statutorily, it is a decision making tool, however
it also highlights priority investment and development areas. The MSDF is an
integral component of the IDP and is a spatial representation of the IDP.
LTGDP
Built Environment Performance Plan (BEPP) - Nelson Mandela Bay, 2018/19 – 2020/21
22
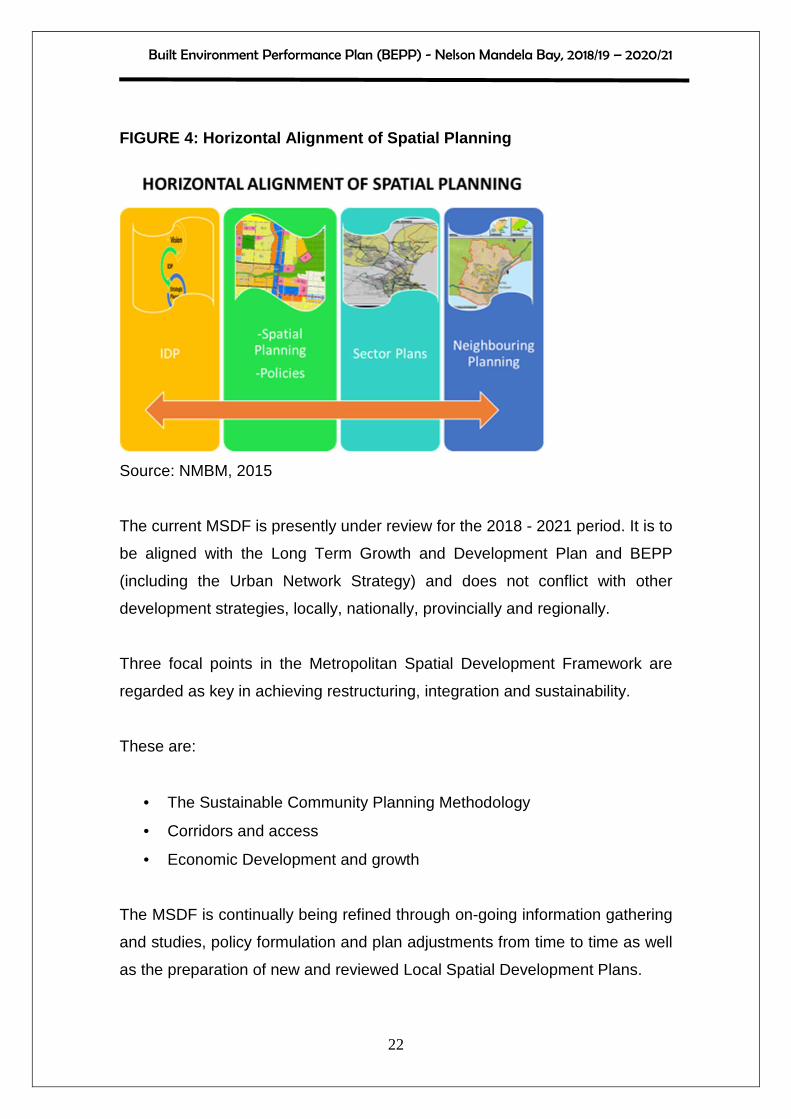
FIGURE 4: Horizontal Alignment of Spatial Planning
Source: NMBM, 2015
The current MSDF is presently under review for the 2018 - 2021 period. It is to
be aligned with the Long Term Growth and Development Plan and BEPP
(including the Urban Network Strategy) and does not conflict with other
development strategies, locally, nationally, provincially and regionally.
Three focal points in the Metropolitan Spatial Development Framework are
regarded as key in achieving restructuring, integration and sustainability.
These are:
• The Sustainable Community Planning Methodology
• Corridors and access
• Economic Development and growth
The MSDF is continually being refined through on-going information gathering
and studies, policy formulation and plan adjustments from time to time as well
as the preparation of new and reviewed Local Spatial Development Plans.

Built Environment Performance Plan (BEPP) - Nelson Mandela Bay, 2018/19 – 2020/21
23
Drawing from the MSDF, the BEPP identifies the urban Network Strategy as
the primary spatial targeting instrument to prioritise investment (and thereby
development), in a coherent and systematic manner, incorporating all role
players in areas where economic development is most needed and where
inclusive growth and development can result.
MSDF sector plans
The Metropolitan Municipalities are legally required to prepare a number of
sector plans. These, and others not statutorily required, in turn are
incorporated into the MSDF and have major spatial implications for the MSDF.
These are as follows:
(a) Coastal Management Plan
(b) Coastal Development Line (Hazard Line) Study
(c) Disaster Management Plan
(d) Environmental Management Framework
(e) Infrastructure Development Plan
(f) Comprehensive Integrated Transport Plan
(g) Integrated Waste Management Plan
(h) Local Economic Development Strategy
(i) Metropolitan Open Space System
(j) Integrated Public Transport Plan
(k) Tourism Master Plan
(l) Integrated HIV and AIDS Plan
(m) Water Master Plan
(n) Sewerage Master Plan
(o) Human Settlements Plan
It is the intention of the BEPP and BEPP processes to ensure increasingly
greater alignment between the sector plans and the spatially targeted areas in
the Urban Network Strategy in order to achieve the same development
outcomes as will be measured by the indicators discussed later in this report.

Built Environment Performance Plan (BEPP) - Nelson Mandela Bay, 2018/19 – 2020/21
24
These development outcomes relate to increasingly inclusive urban growth
that systematically reduces inequality and poverty.
Specifically, the Comprehensive Integrated Transport Plan (CITP), Integrated
Public Transport Plan (IPTP) and Human Settlements Plans require strategic
alignment.
The NMBM is presently in the midst of preparing a revised CITP, IPTP and
Human Settlements Plan specifically to further the alignment. These are
discussed later in this report. The Spatial Development Framework of the Municipality is reflected in the
plan below. The plan specifically shows the following aspects, which are dealt
with in more detail in the Spatial Development Framework Report:
• Urban growth areas, phased over time
• Urban edge, beyond which development is limited
• Major development nodes
• Major transport routes, including corridors for investment and
development
• Environmentally protected areas
• The low-income housing programme

Built Environment Performance Plan (BEPP) - Nelson Mandela Bay, 2018/19 – 2020/21
25
FIGURE 5: Metropolitan Spatial Development Framewor k, 2009
Source: NMBM, 2009

Built Environment Performance Plan (BEPP) - Nelson Mandela Bay, 2018/19 – 2020/21
26
2.1.2 Urban Network Strategy and Prioritisation of Integration Zones
2.1.2.1 Identification of Urban Network Elements
The Urban Network Strategy (UNS) framework was approved by the Council
as part of the 2017/18 BEPP submission. This framework was developed over
time in conjunction with the NDP-Unit at National Treasury and in accordance
with the prescribed methodology.
There has been a minor change with the extension of Integration zone 1 from
Njoli to Motherwell.
The key elements of the Urban Network Strategy are illustrated and explained
in more detail below.
FIGURE 6: Urban Network Strategy Framework
Source: NMBM, 2018

Built Environment Performance Plan (BEPP) - Nelson Mandela Bay, 2018/19 – 2020/21
27
2.1.2.1.1 Township Clusters
For the purposes of analysis, the townships of Nelson Mandela Bay have
been clustered into six township clusters. These are as follows:
Uitenhage, Despatch, KwaNobuhle and Bloemendal Clus ter:
This Cluster is comprised of wards 41; 42; 43; 44; 46; 47; 48; 49; 50; 51 and
52; as well as the two peri-urban wards, i.e.: 45 and 53. The key
demographic features of the cluster are as follows:
• Total population of 305 458 persons (StatsSA, 2011) representing
84 995 households;
• Average population density: 34,7 persons and or 8.9 households per
hectare
• 83,2% of households are living in formal dwellings; 10.4% (± 8839
households) in informal dwellings; and 6.4% (±5440 households) in
backyard accommodation (formal and informal);
• The employment rate estimated to be 31% and approximately 66% of
the population earn less than R3183 per month;
Motherwell-Wells Estate Cluster:
This cluster is comprised of wards 54: 55: 57; 59; 59; 60 and ward 56 which is
a peri-urban ward. It includes Motherwell, Swartkops, Amsterdamhoek and
Bluewater Bay and has the following key demographic features:
• Total population of 165 457 representing 46522 households (StatsSA,
2011);
Built Environment Performance Plan (BEPP) - Nelson Mandela Bay, 2018/19 – 2020/21
28
• Average population density: 52.89 persons and or 14.57 households
per hectare;
• Approximately 93,9% of households are living in formal dwellings; 2.9%
±1349 hh) in informal dwellings; and 3.2% (±1489 hh) in backyard
accommodation (formal and informal);
• The employment rate is 30% and approximately 71% of the population
earn less than R3183 per month.
Ibhayi-Bethelsdorp Cluster:
The cluster is comprised of the areas of Ibhayi, KwaDwesi, KwaMagxaki, Joe
Slovo, Govan Mbeki, New Brighton, Soweto-on-Sea, Veeplaas, Zwide,
Helenvale and Algoa Park represented by wards: 10; 13; 14; 15; 16; 17; 18;
19; 20; 21; 22; 24; 25; 26; 27; 28; 29; 30; 31; 32; 33; 34; 35; 36; 37 and 38;
and with the following key demographic features:
• Total population: 425 847 representing 107 177 households (StatsSA,
2011);
• Average population density: 78.70 persons and 20.16 households per
hectare;
• 81.9% of households are living in formal dwellings; 12.8% (±13719 hh)
in informal dwellings; and 5.3% (±5680 hh) in backyard accommodation
(formal and informal);
• The employment rate is 30% and approximately 68% of the population
earn less than R3183 per month;
CBD Cluster:
This cluster is comprised of the inner-city areas of Central, North End,
Korsten, Newton Park and Mill Park represented by wards 5; 7 and 11. The
key demographic features of this cluster area, are as follows:

Built Environment Performance Plan (BEPP) - Nelson Mandela Bay, 2018/19 – 2020/21
29
• Total population: 52 538 representing 16 251 households (StatsSA,
2011);
• Average population density: 18.78 persons and 5.71 households per
hectare;
• 94.7% of households are living in formal dwellings; 0.7% (±114 hh) in
informal dwellings; and 4.6% (±747 hh) in backyard accommodation
(formal and informal);
• The employment rate is 50% and approximately 38% of the population
earn less than R3183 per month.
Southern Areas Cluster:
This cluster is comprised of Summerstrand, South End, Humerail, Walmer,
Fairview, Theescombe and Schoenmakerskop, including wards 1: 2; 3; 4; and
6. The key demographic features of this cluster are as follows:
• Total population: 95 172 representing 33 438 households (StatsSA,
2011);
• Average population density: 10.93 persons and 3.91 households per
hectare;
• 86.2% of households live in formal dwellings; 7.9% (±2642 hh) in
informal dwellings; and 5.9% (±1973 hh) in backyard accommodation
(formal and informal);
• The employment rate is 54% and approximately 37% of the population
earn less than R3183 per month.
N2 – Western Areas Cluster:
This cluster is comprised of the areas of Fernglen, Sunridge, Westering,
Malabar, Parsonsvlei, Kabega, Framesby and Kuyga. It includes wards 8; 9;
Built Environment Performance Plan (BEPP) - Nelson Mandela Bay, 2018/19 – 2020/21
30
12; 39 and the peri-urban ward 40. The key demographic features of this
cluster are as follows:
• Total population: 107 582 representing 32 185 households (StatsSA,
2011);
• Average population density: 11.15 persons and 2.99 households per
hectare;
• 9.16% of households live in formal dwellings; 4.9% (±1577 hh) in
informal dwellings; and 3.5% (±1126 hh) in backyard accommodation
(formal and informal);
• The employment rate is 61% and approximately 28% of the population
earn less than R3183 per month.
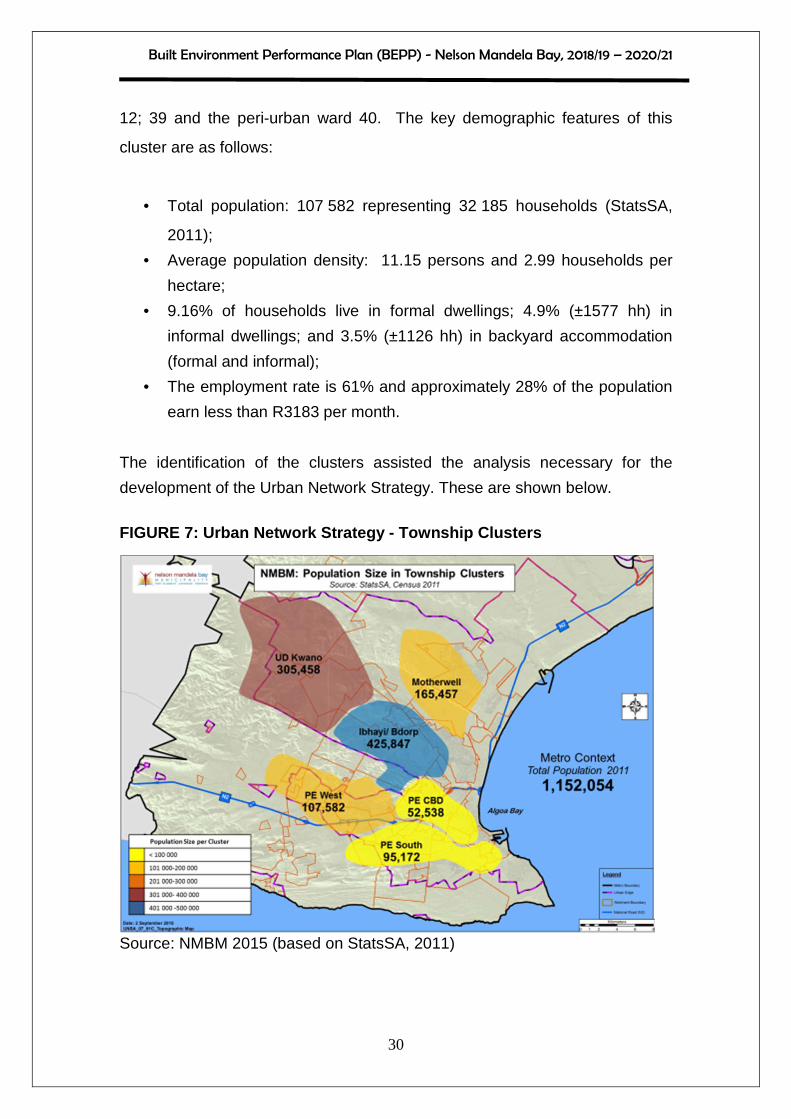
The identification of the clusters assisted the analysis necessary for the
development of the Urban Network Strategy. These are shown below.
FIGURE 7: Urban Network Strategy - Township Cluster s
Source: NMBM 2015 (based on StatsSA, 2011)
Built Environment Performance Plan (BEPP) - Nelson Mandela Bay, 2018/19 – 2020/21
31
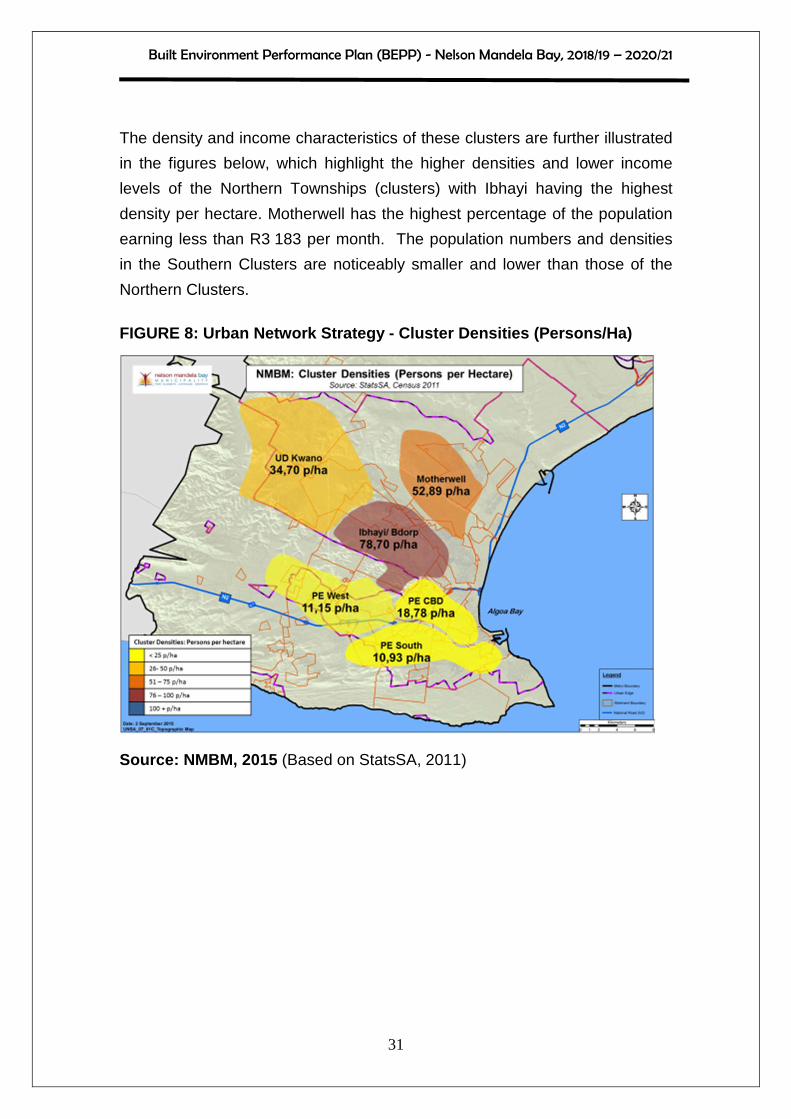
The density and income characteristics of these clusters are further illustrated
in the figures below, which highlight the higher densities and lower income
levels of the Northern Townships (clusters) with Ibhayi having the highest
density per hectare. Motherwell has the highest percentage of the population
earning less than R3 183 per month. The population numbers and densities
in the Southern Clusters are noticeably smaller and lower than those of the
Northern Clusters.
FIGURE 8: Urban Network Strategy - Cluster Densitie s (Persons/Ha)
Source: NMBM, 2015 (Based on StatsSA, 2011)
Built Environment Performance Plan (BEPP) - Nelson Mandela Bay, 2018/19 – 2020/21
32
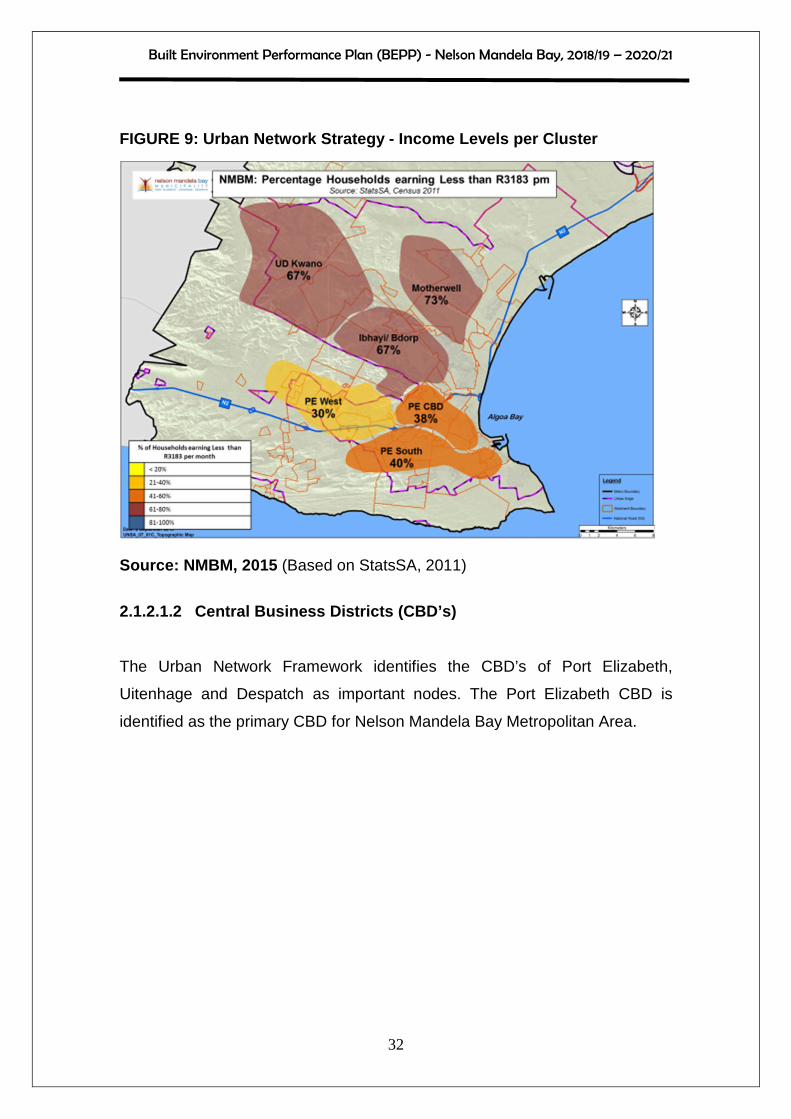
FIGURE 9: Urban Network Strategy - Income Levels pe r Cluster
Source: NMBM, 2015 (Based on StatsSA, 2011)
2.1.2.1.2 Central Business Districts (CBD’s)
The Urban Network Framework identifies the CBD’s of Port Elizabeth,
Uitenhage and Despatch as important nodes. The Port Elizabeth CBD is
identified as the primary CBD for Nelson Mandela Bay Metropolitan Area.

Built Environment Performance Plan (BEPP) - Nelson Mandela Bay, 2018/19 – 2020/21
33
FIGURE 10: Functional Area with existing Municipal Nodes (CBD's)
Source: NMBM, 2015
2.1.2.1.3 Primary Network/Transport Links
MAJOR ARTERIES
The primary transport network includes three of the five major transport
arteries, being:
Harrower/Stanford Road
This road runs in a north-westerly direction, linking the PE CBD with
Gelvandale, Helenvale, Bethelsdorp and Bloemendal (Chatty). The long-term
integrated road network planning provides for the extension of Standford
Road from its current point of termination in the Chatty/ Zanemvula
development area, to the Uitenhage CBD area. This extension is reflected in
the current planning of the Jachtvlakte / Kwanobuhle Estate residential
developments.
Built Environment Performance Plan (BEPP) - Nelson Mandela Bay, 2018/19 – 2020/21
34
Provincial Route R75
The R75 runs in a north-westerly direction and links Port Elizabeth, Despatch
and Uitenhage, as well as the townships of Ibhayi, Algoa Park, Missionvale,
Govan Mbeki, KwaDwesi and KwaMagxaki.
Khulani Corridor
The Khulani Corridor refers to the north-south linkage between PE CBD,
Ibhayi, Njoli and Motherwell along SheyaKulati, Daku and Dibanisa Roads.
Other primary arteries are:
Old Cape Road (R101)
Provincial Route R101, Old Cape road is a westerly linkage between the PE
CBD and the Western Townships of Westering, Kabega, Rowallan Park and
Bridgemeade.
Heugh/Buffelsfontein Road
This southern route links the PE CBD to the Western Coastal area of
Seaview.
William Moffet Expressway
This road is a north-south linkage between Heugh Road / Buffelsfontein Road
and Old Cape Road.
The N2
The N2 runs from West to North through the urban area, serving as a further
primary linkage between the urban areas of Nelson Mandela Bay.
These arteries/transport links form the structure of the Integrated Public
Transport System in Nelson Mandela Bay which is comprised of road and rail
network links.

Built Environment Performance Plan (BEPP) - Nelson Mandela Bay, 2018/19 – 2020/21
35
ROAD NETWORK
Public transport serves the metropolitan area along the following existing and
planned routes:
• North-South linkage between the PE CBD and Motherwell via Ibhayi
along the Khulani Corridor (SheyaKhulati, Njoli, Daku and Dibanisa
Roads).
• North-West linkage between the PE CBD and Bloemendal/Bethelsdorp
along Stanford Road, currently terminating near the Cleary Park
Shopping Centre, but with planned future extension to Uitenhage via
the Chatty, Jachtvlakte and KwaNobuhle Estate areas.
• South-West linkage between the PE CBD and the Western Suburbs via
Old Cape Road, currently terminating in the vicinity of Rowallan Park,
but with a planned future extension towards the Redhouse Chelsea
intersection, with a possible linkage to the Bay West Mall development.
RAIL NETWORK
There is an existing passenger rail link between the PE CBD and Uitenhage
via New Brighton, Sydenham, Swartkops, Redhouse and Despatch. This is
part of the Port Elizabeth – Graaff-Reinet Line.
There is an existing passenger rail link between PE CBD and
Motherwell/Markman. This is part of the Port Elizabeth – Johannesburg Line.
The planning of a future passenger rail link between Port Elizabeth CBD and
Motherwell via a proposed new Motherwell Rail Corridor parallel to Tyinira
Street (Motherwell) is well under way. There is a long-term possible linkage
between Coega and Uitenhage. This is a high-priority project driven by
PRASA and detailed route alignments and station designs are being finalised.
Environmental Impact Assessment in terms of the National Environmental
Management Act, 107 of 1998 and its regulations has also commenced.
PRASA envisages to commence with implementation during the first quarter
of 2018.
Built Environment Performance Plan (BEPP) - Nelson Mandela Bay, 2018/19 – 2020/21
36
PRASA has confirmed their long-term interest in a passenger rail link between
Port Elizabeth and Uitenhage via Bethelsdorp, Chatty, Jachtvlakte and
KwaNobuhle along a route alignment which has been in existence for a long
time. The route is however partially compromised by existing developments
which require attention at the appropriate time. A narrow-gauge rail line (Apple Express) exists between Humerail (Port Elizabeth) and Loerie, which is located west of Nelson Mandela Bay. This line originally served as a goods line between Port Elizabeth and Loerie, but fell into disuse. In December 2017, through private sector volunteerism and public sector involvement a small portion of the Apple Express line became temporarily operational for tourist purposes. There are investigations underway to operationalise the rail line between Humerail and N2/Baywest Precinct for passenger rail purposes or alternatively tourism trips. 2.1.2.1.4 Urban Hubs The Urban Network Approach (NDPG, 2013) makes provision for the identification of “urban hubs” that will serve as “town centres” for under serviced township clusters. It furthermore allows for a hierarchy of urban hubs, i.e. primary and secondary hubs.

Built Environment Performance Plan (BEPP) - Nelson Mandela Bay, 2018/19 – 2020/21
37
PRIMARY URBAN HUBS The Primary Hubs are identified as follows: FIGURE 11: Primary Urban Hubs
Source: NMBM 2015
Built Environment Performance Plan (BEPP) - Nelson Mandela Bay, 2018/19 – 2020/21
38
Port Elizabeth CBD
The Port Elizabeth CBD is the administrative centre of the City and is
recognised in the Urban Network Strategy as a Primary Hub.
Njoli/ Ibhayi Hub
Spatial targeting and the elimination of spatial inequalities, as envisaged in the
National Development Plan, is an underlying principle of the Urban Network
approach, hence the focus on catalytic development of urban hubs in under-
serviced township clusters. The Njoli Hub is identified as the Primary Hub.
This hub is identified as the Primary Hub for urban/catalytic intervention with
the objective of linking and integrating the previously segregated townships of
Ibhayi and Bethelsdorp. Its identification was informed inter alia, by:
• its importance as an historical public space for meeting and informal
trading;
• the convergence of major routes in Ibhayi;
• the development of the Njoli transportation modal interchange and hub
along the Khulani Corridor; and
• the underlying potential to creatively plan and implement public
facilities and amenities that will act as catalysts for wider and more
intensified developments that will enhance the scale of economies for
the installation of public infrastructure in these areas.
The key elements in this hub include:
• Njoli Square, a multi-million rand redevelopment initiative around the
historic Njoli Square;
Built Environment Performance Plan (BEPP) - Nelson Mandela Bay, 2018/19 – 2020/21
39
• Khulani Corridor, a major transport link and development corridor,
designed to link the Port Elizabeth CBD with the townships of Ibhayi
and Motherwell;
• Kenako Shopping Centre, which was recently completed;
• The Vista Campus of the Nelson Mandela Metropolitan University
(NMMU);
• The Eastern Cape Training Centre (ETC) opposite the Kenako Centre;
• The Dora Nginza hospital which is envisaged as a future academic
hospital for the NMMU Medical School Facility; and
• The Vistarus informal settlement next to the Vista Campus, which is to
be redeveloped as part of the Zanemvula Project;
• The Red Location Cultural Precinct which includes the Red Location
Museum of Apartheid, an art gallery, an electronic library; a
backpackers’ lodge as well as the regeneration of Singhapi Street can
be considered as a Secondary Hub to the Ibhayi/ Bethelsdorp Hub.
Zanemvula (Chatty Jachtvlakte) Hub
The Zanemvula (Chatty Jachtvlakte) Hub is identified as the second Primary
Hub. It is in great need of catalytic intervention to unlock the development
potential of this newly developed area. It is situated to the West of Njoli
around the intersection of the Bloemendal Arterial and Stanford Road.
This Hub is at the core of the green field component of the aforementioned
Zanemvula Mega Project, developed as an initiative of the National
Department of Human Settlements; Provincial Department of Human
Settlements and the Municipality. The Housing Development Agency (HDA)
is the implementing agent.
Abutting the Zanemvula (Chatty Jachtvlakte) Hub in the North is the Nelson
Mandela Bay Logistics Park. Phase 1 of the Park is fully developed and
operational and the development of Phase 2 is now identified as a catalytic
project and will provide job opportunities.
Built Environment Performance Plan (BEPP) - Nelson Mandela Bay, 2018/19 – 2020/21
40
Key elements in this hub include:
• The convergence of Standford Road, Bloemendal Arterials and the
MR448 (Old Uitenhage Road). Standford Road is one of the primary
links between the Port Elizabeth CBD and Uitenhage. The Bloemendal
Arterial on the other hand is not yet fully developed, but serves as an
important North/South linkage between the R75 and Standford Road.
MR 368 still serves as an important secondary link between Port
Elizabeth and Uitenhage and has the potential to link the Njoli and
Chatty Jachtvlakte Hubs.
• The new greenfield residential developments of Joe Slovo West;
Bethelsdorp North; Khayamnandi; the Chatty developments and the
Jachtvlakte/Kwanobuhle extensions currently in the planning stage, will
yield in the order of 54000 residential opportunities, once fully
developed. Approximately 14000 units have already been completed
and are in need of social facilities and amenities.
• There are large tracts of vacant and serviced land in the greenfield
development areas that are intended to be used for high density infill
and mixed used development including employment opportunities.
SECONDARY HUBS
The Uitenhage and Despatch CBD’s are identified as secondary hubs as a
result of their role and function as sub-regional metropolitan (sub-
metropolitan) nodes.
The Urban Network Framework includes the following Secondary Hubs:
Secondary Hub 1 (Kenako/Vista):
This hub is situated in the Ibhayi / Bethelsdorp area around the Kenako
Centre; East Cape Training Centre (ETC); Dora Nginza Provincial Hospital;
and the Vista Campus of the Nelson Mandela Metropolitan University
Built Environment Performance Plan (BEPP) - Nelson Mandela Bay, 2018/19 – 2020/21
41
(NMMU). It forms a logical link and extension to the Njoli Hub and holds
significant potential for development interventions that will link two previously
spatially (and socially) separated communities. The precinct planning for this
hub will be undertaken as part of the precinct planning which runs
concurrently with the preparation of the Ibhayi and Bethelsdorp LSDF’s.
A draft precinct plan for the Ibhayi Precinct Area has been prepared in
conjunction with the NDPG-unit of National Treasury and their consultants.
The Bethelsdorp Precinct Planning is intended to be completed before
September 2017.
Secondary Hub 2 (Red Location):
This hub is located around the Red Location Cultural Precinct which includes
the Red Location Museum of Apartheid, art gallery, electronic library; a
backpackers’ lodge as well as the regeneration of Singhapi Street. The node
will play a significant role as a cultural/ tourism node and can be directly linked
with the Port Elizabeth CBD by means of the New Brighton Railway Station
which is within walking distance. It will furthermore complement and
strengthen not only the Njoli Hub, but also the Khulani Corridor. Preliminary
precinct design concepts are included in the Draft Ibhayi Precinct Plan.
Secondary Hub 3 (Jachtvlakte/ Kwanobuhle):
Kwanobuhle Estate is a privately owned proposed development which is
about to be developed and will link the Chatty/ Jachtvlakte development with
Kwanobuhle. A significant mixed-use/ retail node is planned along Standford
Road extension in the longer term. Provision is also made for a railway
station at this juncture as part of the planned PRASA commuter rail
connection between Port Elizabeth and Uitenhage via Kwanobuhle. It could
alternatively serve as a passenger station for the alternative light rail system
planned along Standford Road. This nodal locality is therefore included as a
future and long term Secondary Hub (S3).
Built Environment Performance Plan (BEPP) - Nelson Mandela Bay, 2018/19 – 2020/21
42
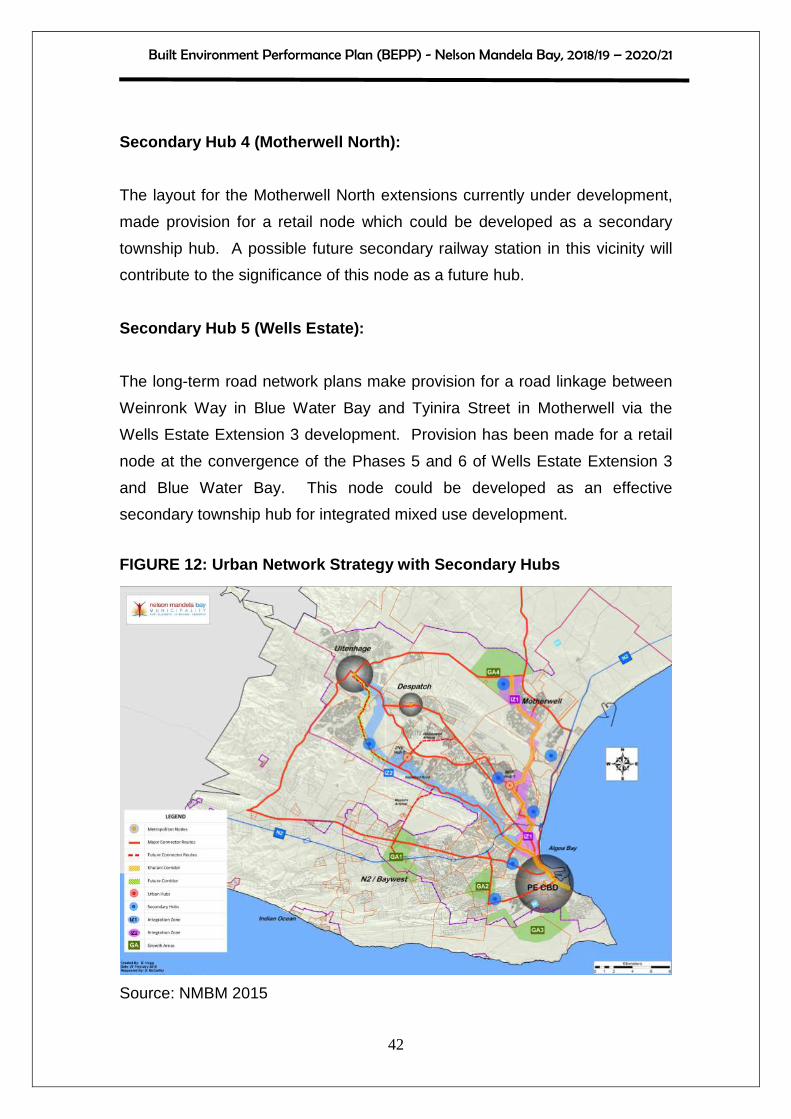
Secondary Hub 4 (Motherwell North):
The layout for the Motherwell North extensions currently under development,
made provision for a retail node which could be developed as a secondary
township hub. A possible future secondary railway station in this vicinity will
contribute to the significance of this node as a future hub.
Secondary Hub 5 (Wells Estate):
The long-term road network plans make provision for a road linkage between
Weinronk Way in Blue Water Bay and Tyinira Street in Motherwell via the
Wells Estate Extension 3 development. Provision has been made for a retail
node at the convergence of the Phases 5 and 6 of Wells Estate Extension 3
and Blue Water Bay. This node could be developed as an effective
secondary township hub for integrated mixed use development.
FIGURE 12: Urban Network Strategy with Secondary Hu bs
Source: NMBM 2015

Built Environment Performance Plan (BEPP) - Nelson Mandela Bay, 2018/19 – 2020/21
43
2.1.2.1.5 Integration Zones
The following figure illustrates the location of the two prioritised integration
zones and growth areas in the city.
FIGURE 13: Urban Network Framework with Urban Hubs and
Integration Zones
Source: NMBM, 2018
Two Integration Zones are identified linking the CBD and Primary Hubs. The
Integration Zones traverse the poorest parts of the city where catalytic
development is targeted.
The Integration Zones are described below.

Built Environment Performance Plan (BEPP) - Nelson Mandela Bay, 2018/19 – 2020/21
44
Prioritisation of Integration Zones
The Integration Zone 1 was revised from the 2017/18 BEPP to extend it to
Motherwell Secondary Hub. This was a logical extension based upon activities
taking place in the Motherwell area. Consideration has been given to the
prioritisation of the Integration Zones with the following result:
TABLE 2: Integration Zone Prioritisation
Integration Zone Priority Khulani / Njoli / Motherwell IZ1 Standford Road IZ2
It should be noted that notwithstanding this prioritisation, development in both
Integration Zones will take place simultaneously.
The Khulani/ Njoli / Motherwell Integration Zone has been prioritised above
Standford Road due to the advanced development of the two catalytic projects
of Njoli Square and the Red Location Precinct and Motherwell Passenger Rail
Corridor in that zone.
The Port Elizabeth CBD is the anchor for both Integration Zone 1 and
Integration Zone 2 and holds significant potential for inner city revitalisation
with initiatives as included in the Port Baakens Catalytic Programme.
The key strategy for the CBD is focused on transformation of the inner city to
become an inner city aligned to the New Urban Agenda and a Post- Apartheid
City. A full list of projects that will develop these objectives is incorporated in
the Inter-governmental Project Pipeline Matrix (Annexure “J”).
The projects include:
• Govan Mbeki Precinct
• Old Library

Built Environment Performance Plan (BEPP) - Nelson Mandela Bay, 2018/19 – 2020/21
45
• Baakens Valley Programme and Port Baakens Precinct Development
PE Station Upgrade
• Vuyisile Mini Node
• Fleming Street and North Union Street Upgrade
The Mandela Bay Development Agency, a wholly owned entity of the
Municipality has the CBD and Port/ Baakens Valley Precincts as its primary
focus.
The Integration Zones are described below:
Integration Zone 1 (IZ1) (CBD/Khulani/ Njoli):
This Integration Zone links the Inner City area through the Njoli Hub to
Motherwell and incorporates a the Khulani Corridor between Standford Road,
and Njoli Square and Motherwell. It includes Secondary Hubs Kenako/ Vista
and Red Location and holds potential for urban regeneration and intensified
mixed use development along the Khulani corridor and around the Njoli Hub.
A stronger link between Njoli Square and Kenako Mall must be established in
order to create an economic node. This node must be extended to link and
integrate the previously segregated townships of Ibhayi and Bethelsdorp.
Mixed-use and higher density development is encouraged along routes that
link Njoli Square, Kenako Mall, Eastern Cape Training Centre (ETC),
Straundale Industrial Area, Vista Campus, Dora Nginza hospital, and
developments at the corner of Spondo and Njoli Road in order to integrate
and strengthen the linkage between these areas.
The key strategy for this Integration Zone is focused on Accessibility and
precinct development, in-situ informal settlement upgrading and cultural /
tourism development. A full list of projects that will fit these objectives is
incorporated in the Inter-Governmental Project Pipeline matrix attached as
Annexure “J “.
Built Environment Performance Plan (BEPP) - Nelson Mandela Bay, 2018/19 – 2020/21
46
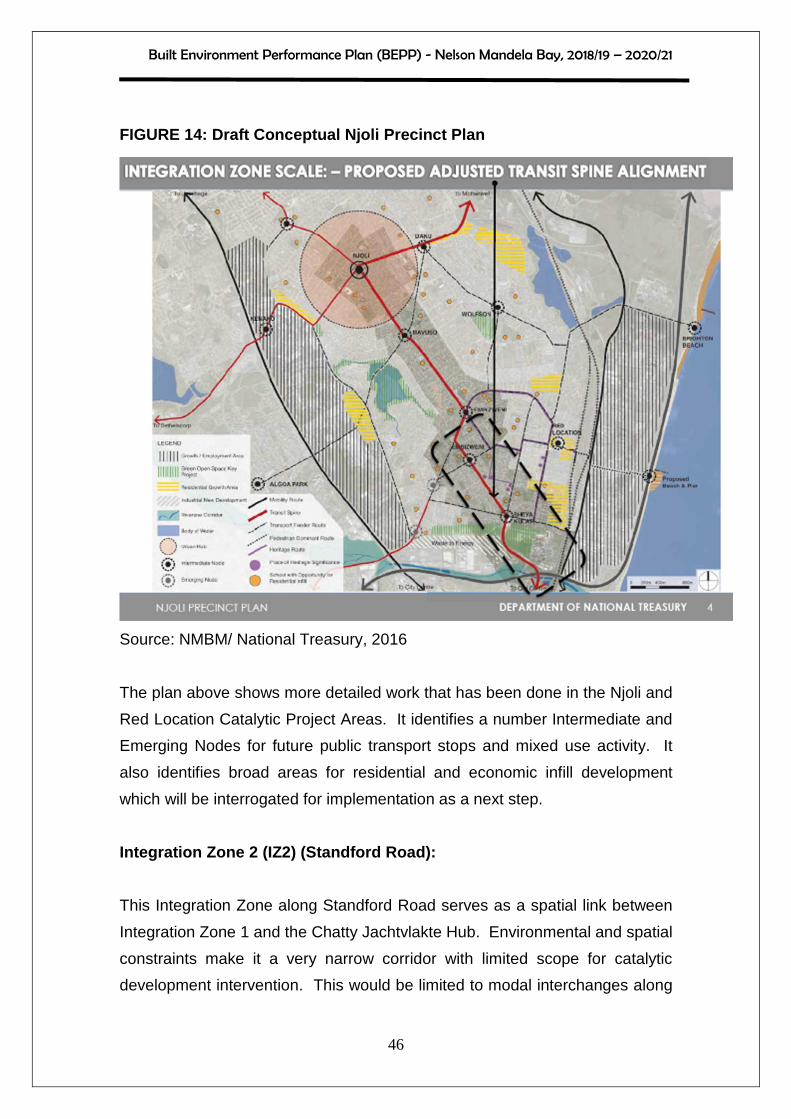
FIGURE 14: Draft Conceptual Njoli Precinct Plan
Source: NMBM/ National Treasury, 2016
The plan above shows more detailed work that has been done in the Njoli and
Red Location Catalytic Project Areas. It identifies a number Intermediate and
Emerging Nodes for future public transport stops and mixed use activity. It
also identifies broad areas for residential and economic infill development
which will be interrogated for implementation as a next step.
Integration Zone 2 (IZ2) (Standford Road):
This Integration Zone along Standford Road serves as a spatial link between
Integration Zone 1 and the Chatty Jachtvlakte Hub. Environmental and spatial
constraints make it a very narrow corridor with limited scope for catalytic
development intervention. This would be limited to modal interchanges along

Built Environment Performance Plan (BEPP) - Nelson Mandela Bay, 2018/19 – 2020/21
47
Standford Road such as the Cleary Park Modal interchange. The extent of
the Integration Zone around the Zanemvula Chatty Hub has been amended to
incorporate the Chatty/Jachtvlakte, Zanemvula and Kwanobuhle Estate
Housing Projects.
The Chatty Jachtvlakte economic node within this integration zone is in great
need of catalytic interventions to unlock the development potential of this
newly developed area. It is situated to the West of Njoli around the
intersection of the Bloemendal Arterial and Stanford Road. This Node is at the
core of the greenfields component of the Zanemvula Mega Project, developed
as an initiative of the National Department of Human Settlements; Provincial
Department of Human Settlements and the Municipality.
Key elements in this node include:
• The convergence of Standford Road, Bloemendal Arterials and the
MR448 (Old Uitenhage Road). Standford Road is one of the primary
links between the Port Elizabeth CBD and Uitenhage. The
Bloemendal Arterial on the other hand is not yet fully developed, but
serves as an important North/South linkage between the R75 and
Standford Road. MR 368 still serves as an important secondary link
between Port Elizabeth and Uitenhage and has the potential to link
the Njoli and Chatty Jachtvlakte nodes.
• An estimated 54 000 residential development opportunities in Joe
Slovo West; Bethelsdorp North; Khayamnandi; the Chatty
developments and the Jachtvlakte/Kwanobuhle is being developed
and it will provide densities adequate enough to sustain socio-
economic activities in the area.
The key strategy for this Integration Zone is focused on spatial transformation
and integrated residential development. A full list of projects that will develop
these objectives is incorporated in the Inter-governmental Project Pipeline
(Annexure “J”).

Built Environment Performance Plan (BEPP) - Nelson Mandela Bay, 2018/19 – 2020/21
48
FIGURE 15: Zanemvula Precinct Plan Concept
Source: NMBM, 2017
The plan above shows more detailed work that has been done in the
Zanemvula (Chatty) Catalytic Project Area. It identifies nodes for future public
transport stops and mixed use activity. It also identifies broad areas for
residential and economic infill development which will be interrogated for
implementation as a next step.
Built Environment Performance Plan (BEPP) - Nelson Mandela Bay, 2018/19 – 2020/21
49
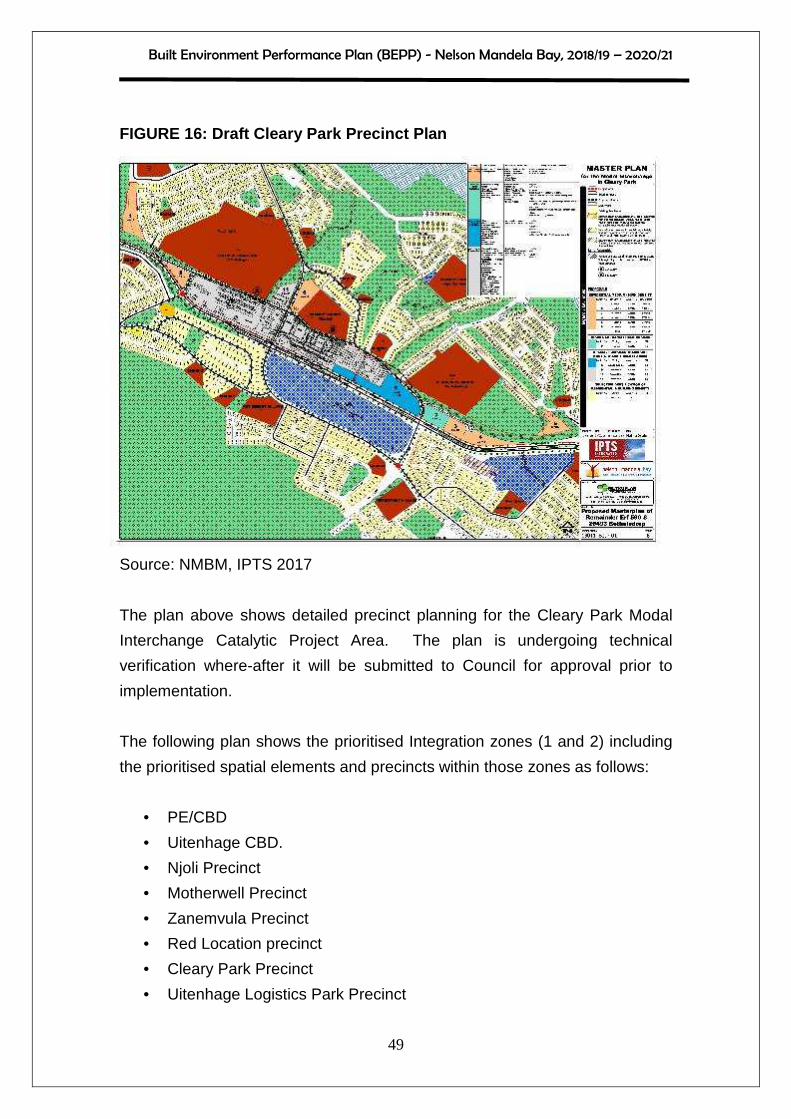
FIGURE 16: Draft Cleary Park Precinct Plan
Source: NMBM, IPTS 2017
The plan above shows detailed precinct planning for the Cleary Park Modal
Interchange Catalytic Project Area. The plan is undergoing technical
verification where-after it will be submitted to Council for approval prior to
implementation.
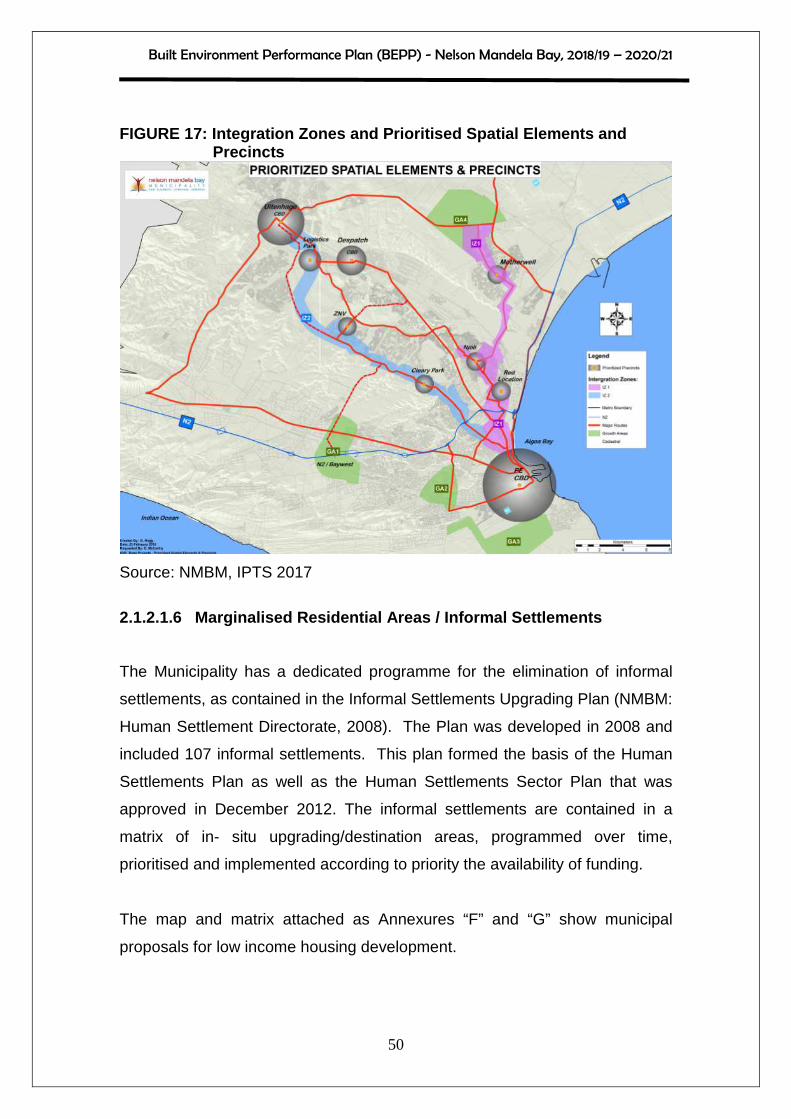
The following plan shows the prioritised Integration zones (1 and 2) including
the prioritised spatial elements and precincts within those zones as follows:
• PE/CBD
• Uitenhage CBD.
• Njoli Precinct
• Motherwell Precinct
• Zanemvula Precinct
• Red Location precinct
• Cleary Park Precinct
• Uitenhage Logistics Park Precinct
Built Environment Performance Plan (BEPP) - Nelson Mandela Bay, 2018/19 – 2020/21
50
FIGURE 17: Integration Zones and Prioritised Spatia l Elements and Precincts
Source: NMBM, IPTS 2017
2.1.2.1.6 Marginalised Residential Areas / Informal Settlements
The Municipality has a dedicated programme for the elimination of informal
settlements, as contained in the Informal Settlements Upgrading Plan (NMBM:
Human Settlement Directorate, 2008). The Plan was developed in 2008 and
included 107 informal settlements. This plan formed the basis of the Human
Settlements Plan as well as the Human Settlements Sector Plan that was
approved in December 2012. The informal settlements are contained in a
matrix of in- situ upgrading/destination areas, programmed over time,
prioritised and implemented according to priority the availability of funding.
The map and matrix attached as Annexures “F” and “G” show municipal
proposals for low income housing development.

Built Environment Performance Plan (BEPP) - Nelson Mandela Bay, 2018/19 – 2020/21
51
In terms of municipal policy, the relocation of informal settlements happens as
a last resort. Where an informal settlement can be formalised in situ, this is
done. In some instances, due to density, not everyone in an informal
settlement can be accommodated in situ. In these cases, the remaining
residents are relocated to locations situated as close-by as possible. Informal
settlements in stressed areas, such as under power lines, on tip sites, in
floodplains or other such areas, are relocated to new areas. To date 52
informal settlements have been in-situ upgraded and 16 green field sites have
been developed for relocation on an incremental basis with full water and
sanitation and basic roads. This includes more than 29 600 sites.
As part of the ongoing development of this plan the NMBM has engaged with
the National Department of Human Settlements in terms of the National
Upgrading Support Programme (NUSP) in order to assist the processes and
strategies linked to the social and technical development of informal
settlements throughout the Metro. It is planned to ensure best practice and
alignment with other Metro’s throughout the country.
The NMBM’s focus is on creating a pipeline of projects focusing on the
implementation of the national housing programmes across the City. This will
assist in making sure that we create housing opportunities that can
accommodate as many households as possible. This is also an
acknowledgement that not all residents of the City are in need of a state
subsidised low cost house (RDP house). Through the appropriate measures,
we are embarking on a programme to popularise all the national housing
programmes that are available in the market. Some of these can enhance
good working relations with the private developers and banks i.e. FLISP and
Social Housing. This will ensure that we sustain an accelerated housing
delivery programme in the City with guaranteed quality and sustainability of
housing products provided for all the residents of the City.
A programme is underway to integrate a comprehensive City wide “National
Housing Needs Register” for housing opportunities. This will help the city and
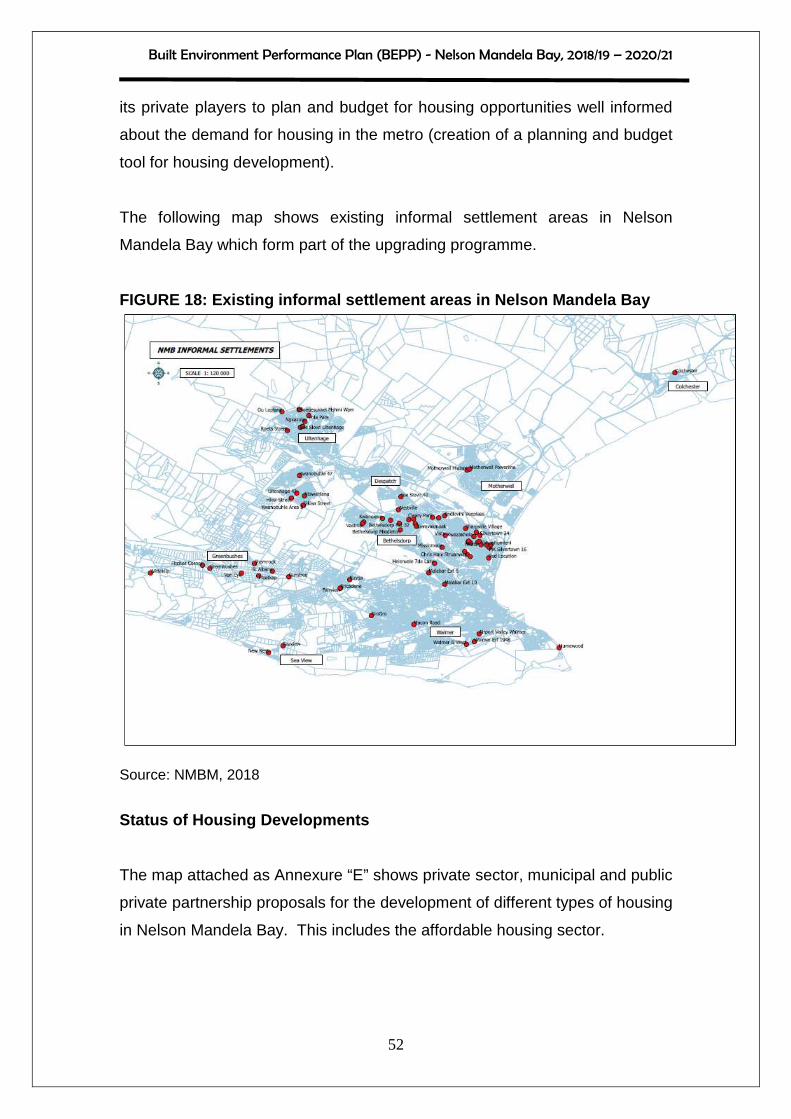
Built Environment Performance Plan (BEPP) - Nelson Mandela Bay, 2018/19 – 2020/21
52
its private players to plan and budget for housing opportunities well informed
about the demand for housing in the metro (creation of a planning and budget
tool for housing development).
The following map shows existing informal settlement areas in Nelson
Mandela Bay which form part of the upgrading programme.
FIGURE 18: Existing informal settlement areas in Ne lson Mandela Bay
Source: NMBM, 2018
Status of Housing Developments
The map attached as Annexure “E” shows private sector, municipal and public
private partnership proposals for the development of different types of housing
in Nelson Mandela Bay. This includes the affordable housing sector.
Built Environment Performance Plan (BEPP) - Nelson Mandela Bay, 2018/19 – 2020/21
53
Management and upgrading of Informal Settlements
The Informal Settlements Upgrading Plan was prepared in 2008 and makes
provision for the following:
• Elimination of the housing delivery backlog of 72 411 units (49 000
backyard shacks and 23 411 informal settlements) through the
provision of quality housing and the structured upgrading of informal
settlements.
• Upgrading of informal settlements and backyard dwellings, preferably
in-situ, and well located Greenfield developments. To date 52 in situ
informal settlements have been upgraded, and 16 Greenfield
development have been prepared for relocations.
• Providing housing opportunities for an estimated 35 000 beneficiaries
that are not being catered for in the current housing projects that are
focused on beneficiaries earning R3 500 and below per month.
• Relocation of 3 000 communities living in stressed areas (such as
flood-plain areas, tip-sites and power line areas) in terms of the
Relocation Plan, which is an integral part of the Informal Settlements
Upgrading Plan. The identification of well-located land in priority areas
and integration zones will be key.
The Informal Settlements Upgrading Plan is part of the NMBM Human
Settlements Plan. The main focus of the Plan is the full technical and social
investigation of all the informal settlements within the Metro, as well as the
categorisation of each settlement in term of needs and vulnerability.
The prioritisation of projects is based on technical readiness, including town
planning layout approvals, general plan layout approvals, environmental
approvals, completed geotechnical investigations, and the availability of bulk
infrastructure. Greenfield projects are also prioritised as destination projects
for relocation purposes.

Built Environment Performance Plan (BEPP) - Nelson Mandela Bay, 2018/19 – 2020/21
54
As part of the on-going development of this plan the NMBM has recently
engaged with the National Department of Human Settlements in terms of the
National Upgrading Support Programme (NUSP) in order to assess the
processes and strategies linked to the social and technical development of
informal settlements throughout the Metro. It is planned to ensure best
practice and alignment with other Metro’s throughout the country.
Emergency housing for households living in life-thr eatening conditions
Currently the NMBM plays a facilitation role in the establishment of
emergency shelters for communities. The NMBM identifies families in need
and submits a formal request to the Provincial Department of Human
Settlements for the approval and supply of emergency shelters in
predetermined areas.
It must be noted that the emergency relocations to serviced sites take place
with rudimentary services only. This means that the relocated families receive
bucket sanitation and water from a communal collection point at a 200 m
radius and basic gravel roads until the required top structures are completed.
Strategy for better located housing development, sp ecifically the poor.
Well located, pro-poor urban development strategies are well entrenched in
the Sustainable Community Planning Methodology of the NMBM. The
methodology focuses on actions and approaches to achieve higher levels of
functional, social and economic integration, simultaneously promoting and
improving social, economic and environmental sustainability.
The density of existing areas should be increased through infill development
on vacant land not required for other purposes. Corridor development along
public transport and other major transport routes will also increase densities in
existing areas.

Built Environment Performance Plan (BEPP) - Nelson Mandela Bay, 2018/19 – 2020/21
55
To effectively increase density and thereby reduce urban sprawl, future
densities should average at least 30 to 40 units per hectare (gross) in new
areas. Current densities average 20 units per hectare.
It is predicted that more than 80% of the future residential demand in the
Metro will be for low-income housing that is currently subsidised. In view of
the need for densification, it is this sector that will, of necessity, be most
affected. The Situational Analysis attached as Annexure “C” gives a more
detailed breakdown of the demand for housing.
The current practice of creating erven of 200 to 300m² for low-income housing
is unsustainable from an economic and land utilisation point of view.
Increased densities can decrease land and servicing infrastructure costs and
also enhance the viability of public transport systems and more importantly
access to employment, services and amenities for households.
The proposal in the context of the Nelson Mandela Bay area is as follows:
• To strengthen existing major bus routes and commuter routes by the
addition of high-density development along the routes especially in the
identified Integration Zones.
• To intensify development around existing public open spaces, where
appropriate. Intensification refers to the subdivision of the existing
appropriately located and designed brownfield erven.
Planning for Informal Settlements
The programme for informal settlements and marginalised areas is discussed
above. Local area planning takes place at the point of design of the new
township. Layouts for these developments are prepared in advance and in
accordance with the Local Spatial Development Frameworks and the
Sustainable Community Planning Methodology which are part of the Spatial
Built Environment Performance Plan (BEPP) - Nelson Mandela Bay, 2018/19 – 2020/21
56
Development Strategy of the City. Community participation in the
development of the layouts is important.
In terms of the Capacity Support Implementation Plan, a land and housing
market trend analysis has been done with a view to develop proposals to
revise the NMBM Housing Policy in a manner that is more sustainable and
meets spatial restructuring objectives. This work will verify and supplement
the work described above. A proposal has been completed and will be
introduced to the administrative and political leadership in 2018/19 financial
year with a view towards implementation of a demonstration project. The
project is more fully described elsewhere in this report in the section that deals
with the alignment of housing with the Integration Zones.
Land Identification and Release for Informal Settle ment Upgrading
The Human Settlements Plan (NMBM Human Settlement Directorate, 2012)
provides for residential development on land that is owned by the Municipality
and the development of this land is done in accordance with the Development
Readiness Matrix, which is a project management tool for the Housing
Programme.
The NMBM is in the fortunate situation of owning large areas of land. Land is
released for the Housing Programme sequentially in terms of the MSDF to
minimise expenditure on bulk infrastructure and according to statutory
approvals required for township development.
The entire Housing Programme is included in the municipal Human
Settlements Plan and the Human Settlements Plan forms part of the Human
Settlements Sector Plan of the Municipality.
The development process is shown in the figure below.

Built Environment Performance Plan (BEPP) - Nelson Mandela Bay, 2018/19 – 2020/21
57
FIGURE 19: Development Process
Attached as Annexures “F” and “G” is a map and matrix that reflects all of the
current informal settlements upgrading and relocation projects within the
Municipality. These projects take place on municipally owned land and in
some instances land is acquired for special circumstances.
Various on-going efforts are made to densify the city using existing zoned land
owned by government that is designated for uses such as schools and open
spaces. Uses can change over time and social housing and other forms of
residential use can be accommodated on underutilised sites.
The Municipality has always prepared a number of sites in advance of the
allocation of HSDG funds for development. In 2013/2014 financial year, 4012
sites were serviced, 2014/2015 financial year 4035 sites were serviced, in the
2015/2016 financial year 3003 sites were serviced, in the 2016/2017 financial
year 4004 sites were serviced and during the current financial year up to 2nd
quarter, 1043 sites have been serviced. More than 15 000 serviced sites have
been made available.
These sites will be developed using HSDG for a full top structure.

Built Environment Performance Plan (BEPP) - Nelson Mandela Bay, 2018/19 – 2020/21
58
TABLE 3: Serviced Sites available for development - May 2018
Item Project Name No. of Sites
Type of Development
Project Status
Expected Date of Readiness
1 Motherwell NU 12 350 Greenfields Serviced Ready
2 Motherwell NU 30 1405 Greenfields Serviced Ready
3 Khayamnandi Ext. Phase 1A&B 471 Greenfields Serviced Ready
4 Khayamnandi Ext. Phase 2 1013 Greenfields Serviced Ready
5 Khayamnandi Ext. Phase 3 208 Greenfields Serviced Ready
6 Khayamnandi Ext. Phase 4A 358 Greenfields Serviced Ready
7 Khayamnandi Ext. Phase 4B 372 Greenfields Serviced Ready
8 KwaNobuhle Area 11 1414 Greenfields Serviced Ready
9 Joe Slovo Uitenhage 300 In-situ Serviced Ready
10 Kwanobuhle Area 7 Ph 4 244 In-situ Serviced Ready
11 Kwanobuhle Area 8 Ph 4 266 In-situ Serviced Ready
12 Doorenhoek 40 In-situ Serviced Ready
13 Red Location 172 In-situ Serviced Ready
14 Motherwell High Density 109 In-situ Serviced Ready
15 Kwanobuhle erf 8228 111 In-situ Serviced Ready
16 Pola Park 117 In-situ Serviced Ready
17 Rosedale 249 In-situ Serviced Ready
18 Masekhane Village 125 In-situ Serviced Ready
19 Kabah Phase 6 54 In-situ Serviced Ready
20 Kwanobuhle Erf 3179 42 In-situ Serviced Ready
21 Kwanobuhle Erf 12931 & 12872 65 In-situ Serviced Ready
22 Joe Modise 15 In-situ Serviced Ready
23 Mandelaville Uitenhage 121 In-situ
Service;2d Ready
24 Kwanobuhle Erf 10015 12 In-situ Serviced Ready
25 Mk Silvertown 270 In-situ Serviced Ready
26 Mk Qaqawuli 491 In-situ Serviced Ready
Total 8519
Built Environment Performance Plan (BEPP) - Nelson Mandela Bay, 2018/19 – 2020/21
59
2.1.2.1.7 Other Marginalised Residential Areas
In addition to informal settlements there are other residential areas that are in
decline. These areas are generally characterised by deteriorating civic (where
it exists) and private infrastructure, increasing informality (backyard shacks,
informal businesses), invaded open spaces, and high levels of crime and
economic and social dysfunctionality. These areas generally have little
investment and there is a lack of private sector interest.
Measures need to be taken in these areas to revitalise them and address the
neglect. In this regard government has to act as a catalyst for private sector
involvement.
Many parts of the city can be seen to be in decline. However, the following
areas have been initially identified.
• Portions of the former Port Elizabeth CBD
• Portions of the Uitenhage CBD
• North End
• Helenvale
• Korsten / Schauderville
• Govan Mbeki
• Kleinskool/Kliprand
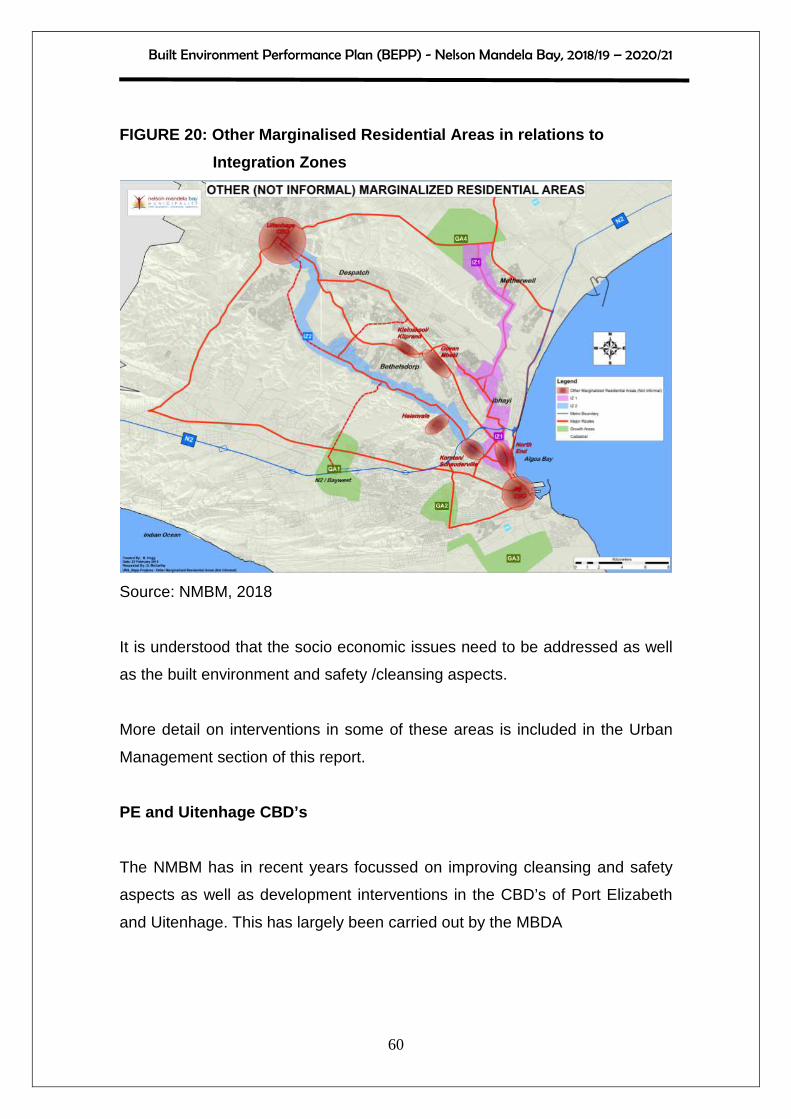
Built Environment Performance Plan (BEPP) - Nelson Mandela Bay, 2018/19 – 2020/21
60
FIGURE 20: Other Marginalised Residential Areas in relations to
Integration Zones
Source: NMBM, 2018
It is understood that the socio economic issues need to be addressed as well
as the built environment and safety /cleansing aspects.
More detail on interventions in some of these areas is included in the Urban
Management section of this report.
PE and Uitenhage CBD’s
The NMBM has in recent years focussed on improving cleansing and safety
aspects as well as development interventions in the CBD’s of Port Elizabeth
and Uitenhage. This has largely been carried out by the MBDA
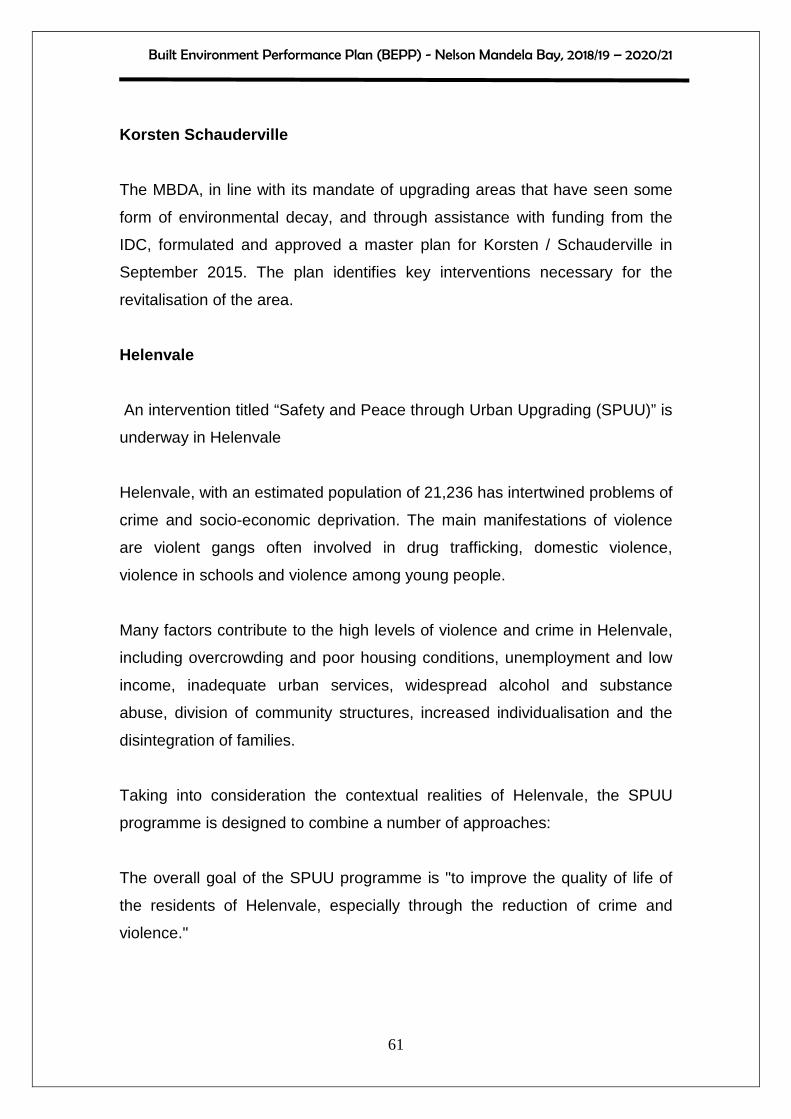
Built Environment Performance Plan (BEPP) - Nelson Mandela Bay, 2018/19 – 2020/21
61
Korsten Schauderville
The MBDA, in line with its mandate of upgrading areas that have seen some
form of environmental decay, and through assistance with funding from the
IDC, formulated and approved a master plan for Korsten / Schauderville in
September 2015. The plan identifies key interventions necessary for the
revitalisation of the area.
Helenvale
An intervention titled “Safety and Peace through Urban Upgrading (SPUU)” is
underway in Helenvale
Helenvale, with an estimated population of 21,236 has intertwined problems of
crime and socio-economic deprivation. The main manifestations of violence
are violent gangs often involved in drug trafficking, domestic violence,
violence in schools and violence among young people.
Many factors contribute to the high levels of violence and crime in Helenvale,
including overcrowding and poor housing conditions, unemployment and low
income, inadequate urban services, widespread alcohol and substance
abuse, division of community structures, increased individualisation and the
disintegration of families.
Taking into consideration the contextual realities of Helenvale, the SPUU
programme is designed to combine a number of approaches:
The overall goal of the SPUU programme is "to improve the quality of life of
the residents of Helenvale, especially through the reduction of crime and
violence."

Built Environment Performance Plan (BEPP) - Nelson Mandela Bay, 2018/19 – 2020/21
62
The programme objective is "to increase the safety of the residents with
special regard to the main component areas, namely the public space and
physical infrastructure, safer schools, youth employment, domestic violence
prevention and a pilot housing scheme”.
A distinct strategy for the development and further prioritisation of these areas
is yet to be developed largely because of the constrained finances of the
municipality.
2.1.2.1.8 Economic Nodes (Commercial and Industrial ) Identification
and Prioritisation
Economic Nodes analysis
The following maps highlight the major development areas and urban growth
directions. They show areas of new development, largely residential and
mixed-use development, the major industrial development areas, as well as
areas in which urban renewal and infill development (regeneration
development) is taking place. Growth directions are mainly west, north-west
and north.
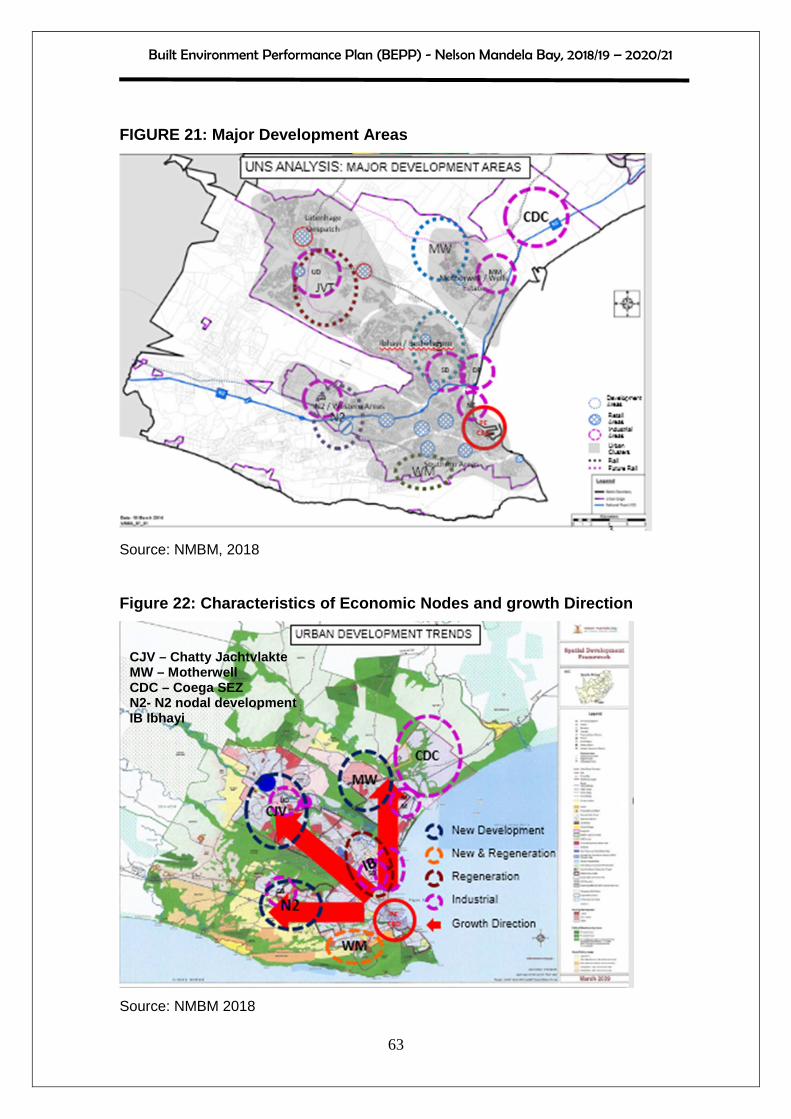
Built Environment Performance Plan (BEPP) - Nelson Mandela Bay, 2018/19 – 2020/21
63
FIGURE 21: Major Development Areas
Source: NMBM, 2018
Figure 22: Characteristics of Economic Nodes and gr owth Direction
Source: NMBM 2018
CJV – Chatty Jachtvlakte MW – Motherwell CDC – Coega SEZ N2- N2 nodal development IB Ibhayi
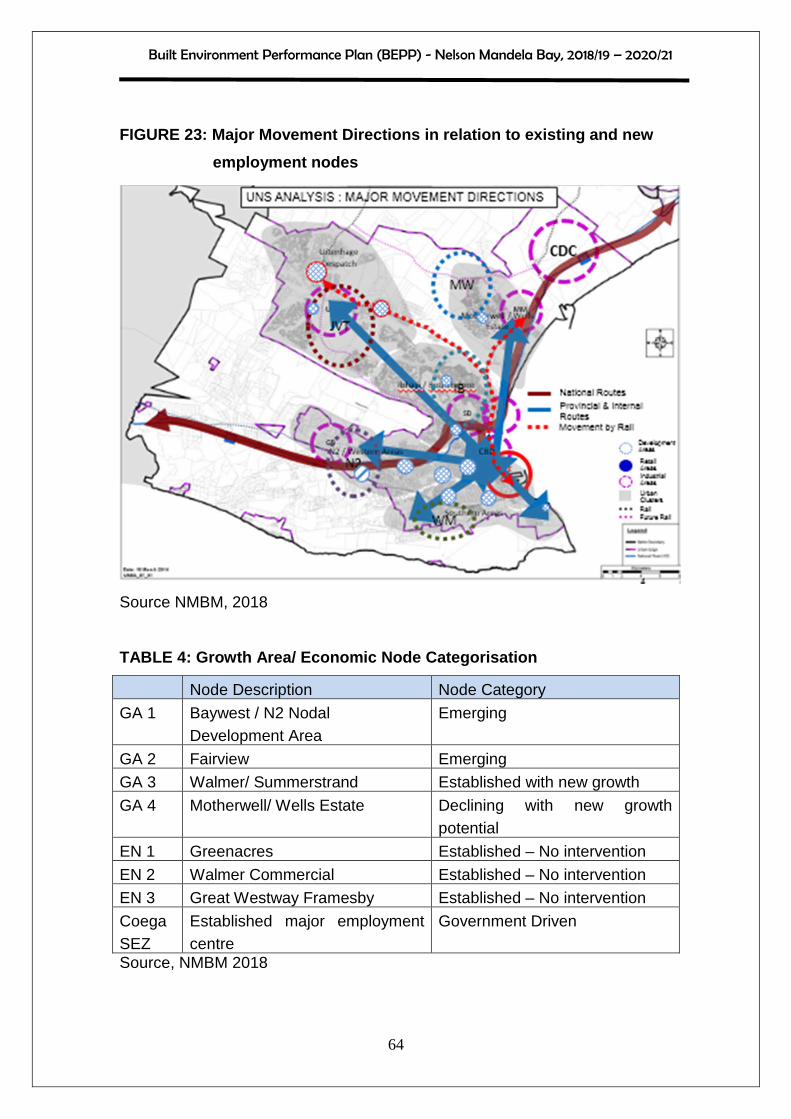
Built Environment Performance Plan (BEPP) - Nelson Mandela Bay, 2018/19 – 2020/21
64
FIGURE 23: Major Movement Directions in relation to existing and new
employment nodes
Source NMBM, 2018
TABLE 4: Growth Area/ Economic Node Categorisation
Node Description Node Category
GA 1 Baywest / N2 Nodal Development Area
Emerging
GA 2 Fairview Emerging
GA 3 Walmer/ Summerstrand Established with new growth
GA 4 Motherwell/ Wells Estate Declining with new growth potential
EN 1 Greenacres Established – No intervention
EN 2 Walmer Commercial Established – No intervention
EN 3 Great Westway Framesby Established – No intervention
Coega SEZ
Established major employment centre
Government Driven
Source, NMBM 2018
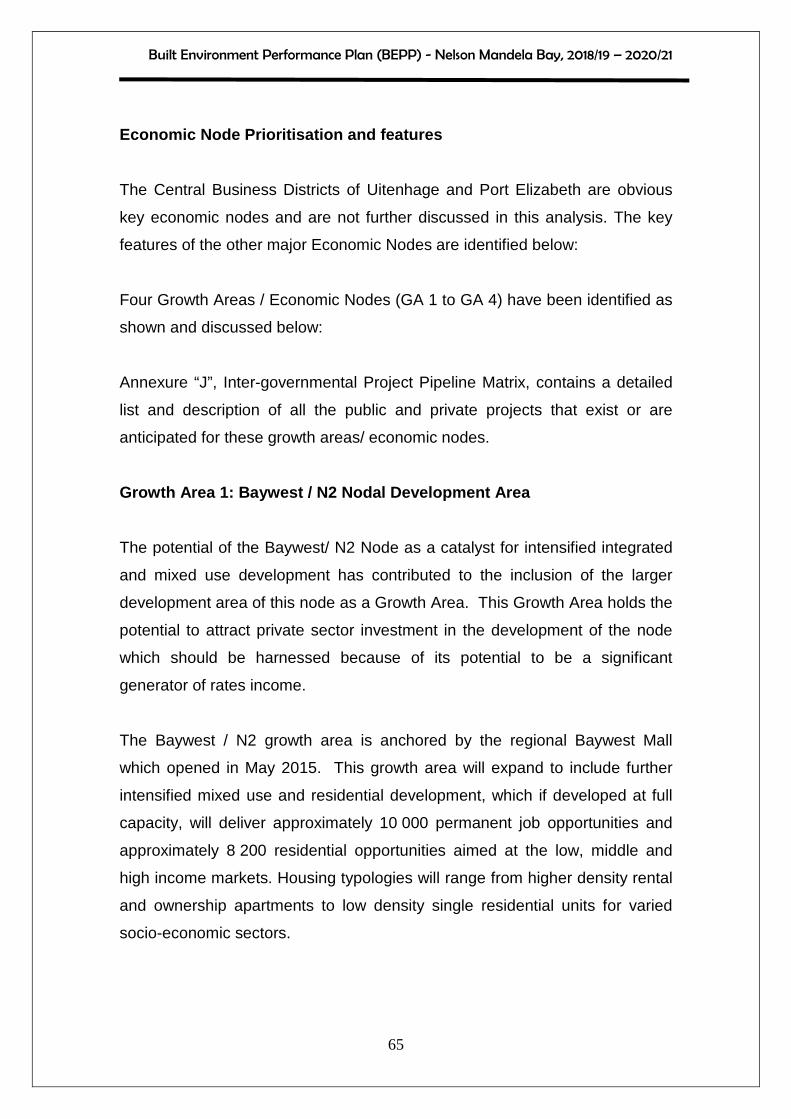
Built Environment Performance Plan (BEPP) - Nelson Mandela Bay, 2018/19 – 2020/21
65
Economic Node Prioritisation and features
The Central Business Districts of Uitenhage and Port Elizabeth are obvious
key economic nodes and are not further discussed in this analysis. The key
features of the other major Economic Nodes are identified below:
Four Growth Areas / Economic Nodes (GA 1 to GA 4) have been identified as
shown and discussed below:
Annexure “J”, Inter-governmental Project Pipeline Matrix, contains a detailed
list and description of all the public and private projects that exist or are
anticipated for these growth areas/ economic nodes.
Growth Area 1: Baywest / N2 Nodal Development Area
The potential of the Baywest/ N2 Node as a catalyst for intensified integrated
and mixed use development has contributed to the inclusion of the larger
development area of this node as a Growth Area. This Growth Area holds the
potential to attract private sector investment in the development of the node
which should be harnessed because of its potential to be a significant
generator of rates income.
The Baywest / N2 growth area is anchored by the regional Baywest Mall
which opened in May 2015. This growth area will expand to include further
intensified mixed use and residential development, which if developed at full
capacity, will deliver approximately 10 000 permanent job opportunities and
approximately 8 200 residential opportunities aimed at the low, middle and
high income markets. Housing typologies will range from higher density rental
and ownership apartments to low density single residential units for varied
socio-economic sectors.

Built Environment Performance Plan (BEPP) - Nelson Mandela Bay, 2018/19 – 2020/21
66
This growth area has also been identified as one of the National Department
of Human Settlements Catalytic projects referred to as the N2 Nodal
Development Catalytic Project.
Other developments such as the Kuyga extension, Westbrook and
Parsonsvlei form part of the larger N2 nodal development area and contribute
to additional mixed use and residential development with a potential to yield
an estimated 6 500 residential opportunities.
A direct road linkage between the Baywest/N2 Node and Chatty/Zanemvula
has been identified as a high priority in order to enhance the accessibility of
this node to the northern townships of the Metro. This is important from an
access, convenience and job opportunity perspective.
The key strategy for this Growth Area is the development of a growth node
comprising of integrated residential and economic development. Projects
include inter alia:
• Walker Drive to N2
• Western Arterial - N2 Cape Road Link
• Western Arterial - Standford Road Link
• N2 North
• Utopia Development
• Erf 432 Development
• Kuyga Extension
The high level intervention strategy of the municipality has been to enter into
service level agreements that have facilitated the development of bulk
infrastructure to allow the private sector development of the area. In addition,
the Municipality is pursuing the development of the Western Arterial as a
catalytic linkage project to link this area to the Chatty / Jachtvlakte /
Zanemvula area. All major private sector development applications in this
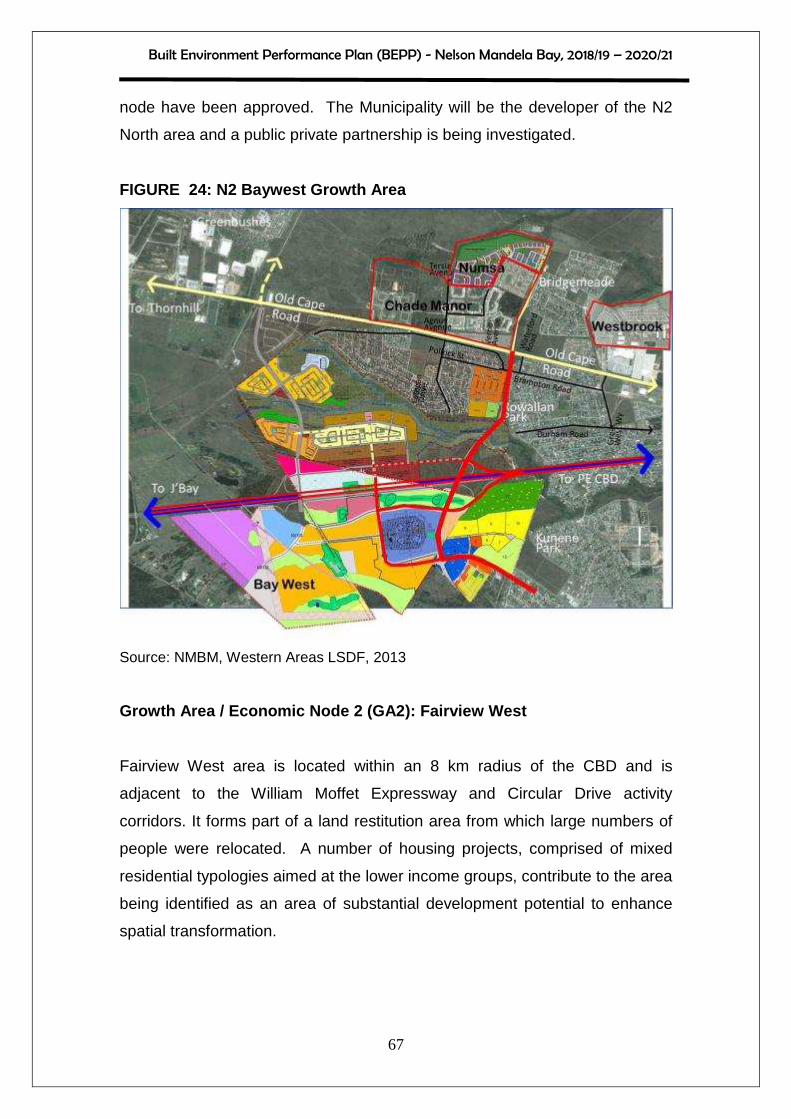
Built Environment Performance Plan (BEPP) - Nelson Mandela Bay, 2018/19 – 2020/21
67
node have been approved. The Municipality will be the developer of the N2
North area and a public private partnership is being investigated.
FIGURE 24: N2 Baywest Growth Area
Source: NMBM, Western Areas LSDF, 2013
Growth Area / Economic Node 2 (GA2): Fairview West
Fairview West area is located within an 8 km radius of the CBD and is
adjacent to the William Moffet Expressway and Circular Drive activity
corridors. It forms part of a land restitution area from which large numbers of
people were relocated. A number of housing projects, comprised of mixed
residential typologies aimed at the lower income groups, contribute to the area
being identified as an area of substantial development potential to enhance
spatial transformation.
Built Environment Performance Plan (BEPP) - Nelson Mandela Bay, 2018/19 – 2020/21
68
The key strategy for this Growth Area is focussed on densification and spatial
transformation of this node as a high density integrated and mixed housing
area. A list of projects that will develop these objectives is incorporated in the
Inter-governmental Project Pipeline Matrix (Annexure “J”). These projects
include:
• William Moffet Expressway
• Circular Drive
• Willow Road Upgrade
• Fairview Links
• Willowdene
• Fairview West
The key developments in this area are the social rental and finance linked
subsidised (FLISP) housing developments developed in 2015 and 2016.
These developments have brought higher density populations into this
emerging area. In addition, new commercial developments are taking place
along William Moffet Expressway and along Circular Drive that form the
boundaries of this node.
The intervention strategy for this growth area has been to support and
facilitate the social housing developments. The commercial developments
have been facilitated by the recently approved Local Spatial Development
Framework.
Certain bulk infrastructure is needed for the further development of this area
and is quantified in Annexure “J” which contains the detailed project list. It is
the intention of the Municipality to fund this bulk infrastructure in the medium
term.

Built Environment Performance Plan (BEPP) - Nelson Mandela Bay, 2018/19 – 2020/21
69
Growth Area / Economic Node 3 (GA3): Walmer
This Growth Area is a combination of existing well established residential and
economic development as well new integrated residential development.
The key strategy for this Growth Area is spatial transformation and integrated
residential development for lower income communities. A list of projects that
will develop these objectives is incorporated in the Inter-governmental Project
Pipeline Matrix (Annexure “J”) and includes:
• Erf 1948 Walmer Phase 1
• Erf 1948 Walmer Phase 2 PE Airport expansion
• Erf 11305 Walmer
• Walmer Development - Human Settlement (Services)
• Reinforcement of Electricity Network - Walmer Lorraine
• Industrial Site (Airport Valley) - Bulk Sewer
• Upgrading of Fountain Road - Walmer Township
• H103: Heugh Road (MR427) Widening (3rd Avenue to
• Wentworth)
• Theescombe / Gqebera Bulk Stormwater
• Stormwater retention
• Walmer Cosmo
• Driftsands Collector Sewer
• Driftsands WWWT Augmentation
• Walmer Gqebera - Urban Rejuvenation
• Possible Railway Station - Apple Express
• Allister Miller Drive
• Precinct Plan/ Walmer Gqebera
The intervention strategy of the Municipality for this area has been to
collaborate with the Provincial Department of Human Settlement to fast track
the formalisation of the informal settlements in the area. In addition, major
funding was provided for the much needed bulk infrastructure such the
Built Environment Performance Plan (BEPP) - Nelson Mandela Bay, 2018/19 – 2020/21
70
Driftsands collector sewer and stormwater management. The development
and upgrade of Fountain Road commercial facilities form part of the
interventions of this economic node. In addition, sport fields and other
amenities have been prioritised and developed. Detailed layout planning and
environmental authorisation for the major developments have been prioritised.
The development of the Walmer Links social rental and finance linked (FLISP)
housing has been made possible through the provision of municipal land.
Growth Area/ Economic Node 4 (GA4): Motherwell
Motherwell is prioritised for transformation by the Municipality, primarily
because of its history as a dormitory town. It is under serviced in terms of
economic and social facilities and amenities. Even where those facilities and
amenities exist, the quality is sub-standard. Major extensions to the township
area (Motherwell Extensions 12, 29, 30 and 31) are currently under
construction as part of the municipal human settlement programme. This
development, which is rolled out as an integrated residential development, will
yield almost 12 500 residential opportunities for approximately 50 000 people.
Significant developments in this area are the Motherwell Shopping Centre and
Clinic. Other existing facilities such as a Thusong Centre (to be redeveloped
as a Traffic Centre), the Motherwell Community Centre and the higher density
Sakhasonke Housing Project are located in this area. The node will also
serve as the terminal point for the Khulani Corridor, as well as a future modal
interchange.
This node has the potential to develop substantially particularly when the
planned Motherwell Rail Corridor is implemented. The future Motherwell rail
station will be in close proximity and forms a strong focal point in this node. It
is therefore important that this node be targeted for catalytic intervention in the
near future.

Built Environment Performance Plan (BEPP) - Nelson Mandela Bay, 2018/19 – 2020/21
71
Although planning for the area is mostly complete, detailed precinct planning
is needed around the future Motherwell Rail Corridor stations and public
transport nodes. This is currently being undertaken.
Projects include:
• Motherwell Traffic and Licensing Centre (Conversion of un-utilised and
vacant Thusong Centre)
• Motherwell Rail Corridor Phase 1 (Planning and implementation of
commuter rail link with stations between Swartkops rail line and
Motherwell NU29)
• Motherwell High Density Housing Project
• Infill Residential Development (Low Income Residential Development)
• Motherwell Modal Interchange (Planning of Modal Interchange as part
of Precinct Development and complementary to Motherwell Rail
Corridor)
• Motherwell NU31 IRDP (Greenfield Residential Development)
• Tyinira Endlovini
• Ramaphosa West
• Cultural Centre Motherwell
• Motherwell NU 29 & 30 : Roads and Stormwater Bulk Infrastructure
• Motherwell North Bulk Sewerage
• Fire Station Motherwell - Refurbishment
• Motherwell Arterial Development
• Motherwell NU 30 - Human Settlement (Services)
• Motherwell NU 31 - Human Settlement (Services)
The intervention strategy of the municipality for this area is implemented
through the Motherwell Urban Renewal Programme (MURP) which has a
dedicated office within the Economic Development, Tourism and Agriculture
Directorate that deals only with Motherwell projects and programmes, ranging
from spatial to cultural and economic interventions.
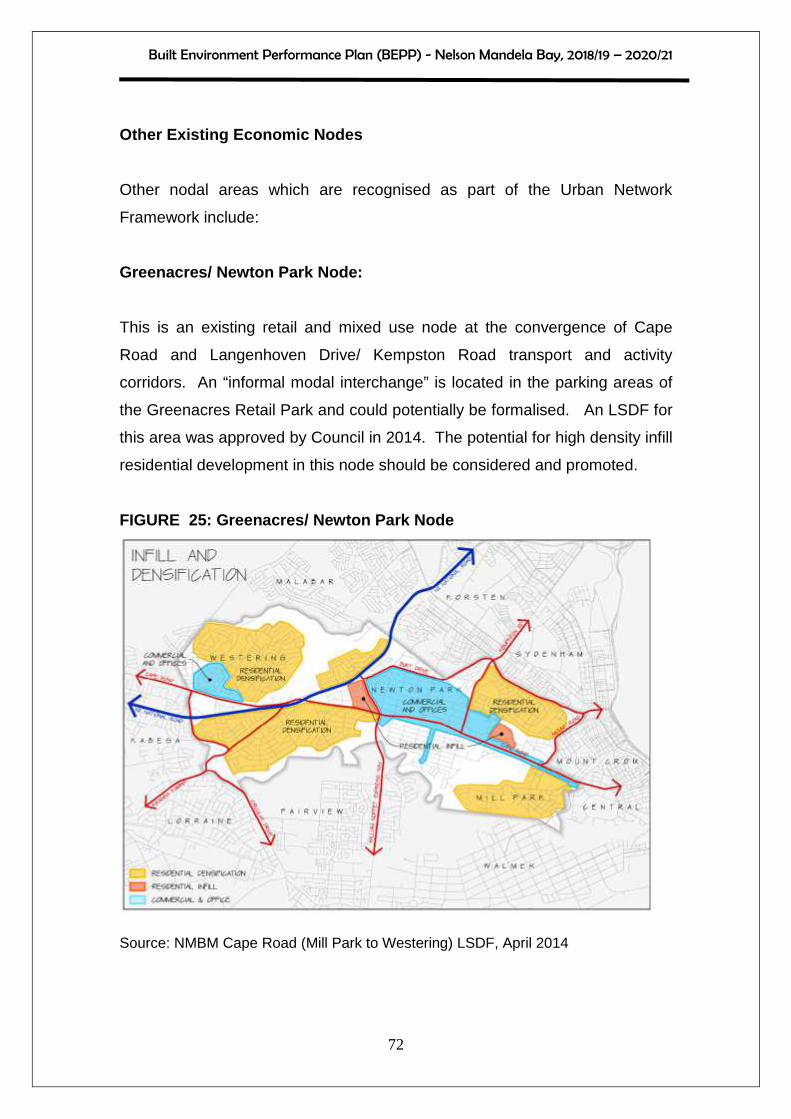
Built Environment Performance Plan (BEPP) - Nelson Mandela Bay, 2018/19 – 2020/21
72
Other Existing Economic Nodes
Other nodal areas which are recognised as part of the Urban Network
Framework include:
Greenacres/ Newton Park Node:
This is an existing retail and mixed use node at the convergence of Cape
Road and Langenhoven Drive/ Kempston Road transport and activity
corridors. An “informal modal interchange” is located in the parking areas of
the Greenacres Retail Park and could potentially be formalised. An LSDF for
this area was approved by Council in 2014. The potential for high density infill
residential development in this node should be considered and promoted.
FIGURE 25: Greenacres/ Newton Park Node
Source: NMBM Cape Road (Mill Park to Westering) LSDF, April 2014
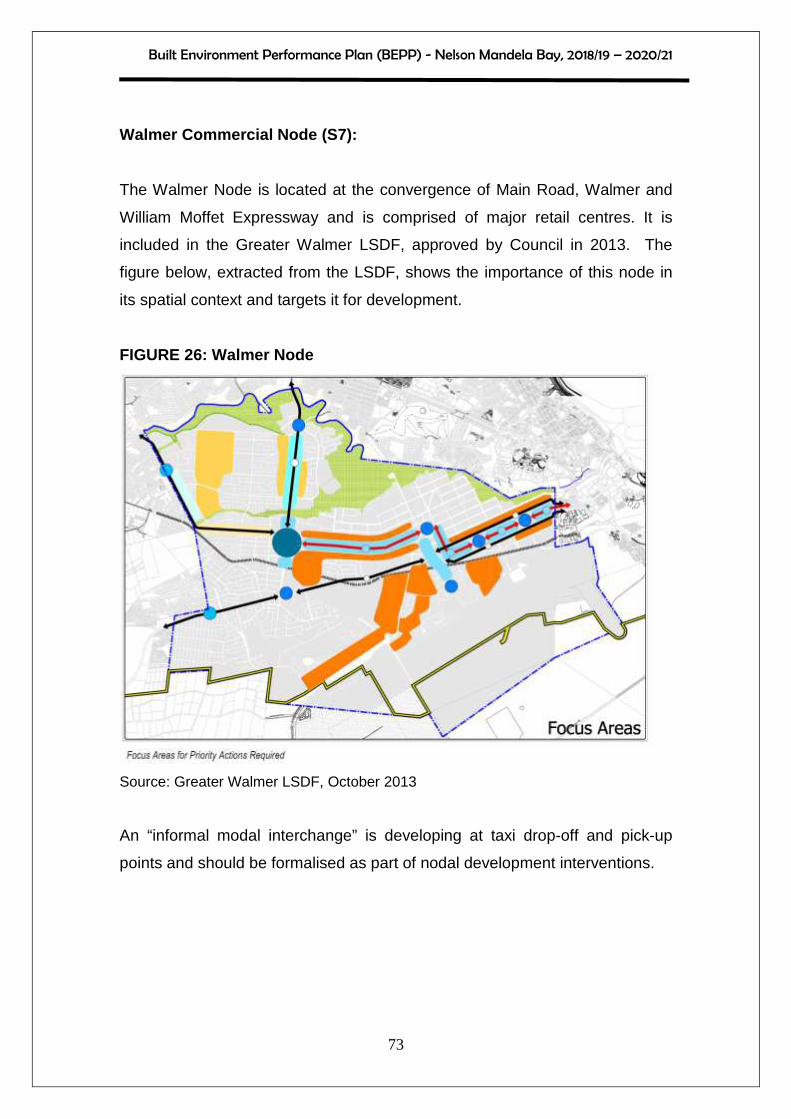
Built Environment Performance Plan (BEPP) - Nelson Mandela Bay, 2018/19 – 2020/21
73
Walmer Commercial Node (S7):
The Walmer Node is located at the convergence of Main Road, Walmer and
William Moffet Expressway and is comprised of major retail centres. It is
included in the Greater Walmer LSDF, approved by Council in 2013. The
figure below, extracted from the LSDF, shows the importance of this node in
its spatial context and targets it for development.
FIGURE 26: Walmer Node
Source: Greater Walmer LSDF, October 2013
An “informal modal interchange” is developing at taxi drop-off and pick-up
points and should be formalised as part of nodal development interventions.

Built Environment Performance Plan (BEPP) - Nelson Mandela Bay, 2018/19 – 2020/21
74
Great Westway (Makro/Framesby/Westering) Node
This node is located at the intersection of Samantha Way/Bramlin and Cape
Road. It is largely a retail node around the Makro, Metlife Plaza and Linton
Grange shopping centres. A medical centre is also located in this node.
FIGURE 27: Great Westway Node
Source: NMBM Cape Road (Mill Park to Westering) LSDF, April 2014
Coega SEZ Growth Node
The Coega Special Economic Zone (SEZ) is a government initiated catalyst
for socio economic development. The Coega SEZ has the mission of
providing a competitive investment location for supporting the establishment
of value-added business services that enable socio-economic development in
the NMBM, Eastern Cape and South Africa. The growth node is based on a
cluster model, which strategically positions related and synergistic industries
and their supply chains in close proximity to one another with a view to

Built Environment Performance Plan (BEPP) - Nelson Mandela Bay, 2018/19 – 2020/21
75
developing agglomerative economies. The Coega SEZ has 14 zones, with a
focus on (but not limited to) the following sectors:
• Metallurgical
• Business Process Outsourcing
• Automotive
• Chemicals and Petro-Chemicals
• Agro Processing and Aquaculture
• Logistics
• Energy and Green Economy
• Maritime
The Coega SEZ is developed in terms of a Development Framework Plan
which is approved by the NMBM. There are strong synergies between the
Motherwell Growth Node and the Coega SEZ Growth Node with
interdependencies in the provision of transportation, water and wastewater
infrastructure.
The following map shows the Economic Nodes identified above in relation to
the Urban Network Strategy.

Built Environment Performance Plan (BEPP) - Nelson Mandela Bay, 2018/19 – 2020/21
76
FIGURE 28: Other Existing Economic Nodes in relatio n to Integration
Zones
Source: NMBM, 2018
Other Activity Corridors
The Urban Network further identifies other existing mixed use activity corridors
that are important. These are:
1. Walmer: This corridor begins at Marine Drive as Walmer Boulevard,
increases in activity at 1st Avenue intersection, from where the road
becomes Heugh Road, and continues to the intersection of Buffelsfontein
Road and 17th Avenue.
2. Walmer Main Road: This corridor commences in Heugh Road, it runs to
Walmer Main Road, to the intersection with the William Moffet
Expressway.
Built Environment Performance Plan (BEPP) - Nelson Mandela Bay, 2018/19 – 2020/21
77
3. William Moffet Expressway: This corridor starts from the intersection of
Buffelsfontein and 17th Avenue and runs along William Moffet Expressway
to Cape Road.
4. Cape Road: This corridor starts at the intersection of William Moffet Drive
and Cape Road, and runs to Greenacres, terminating in the CBD.
Planning for Economic Nodes
Planning for the growth nodes is guided by the Local Spatial Development
Frameworks of those areas. Within those areas precinct planning and more
detailed planning takes place within the LSDF context.
Specific precinct planning is currently being undertaken for the Bethelsdorp,
Ibhayi and Motherwell precincts.
The Ibhayi Precinct plan includes significant historic nodes such as Njoli
Square, Embizweni Square, Mendi Arts Centre and Red Location. These
nodes are aligned with public transportation and pedestrian routes. These
nodes collectively provide structure and the opportunity for focal points for the
delivery of community facilities, commercial activities.
Njoli Square is a Modal Transport interchange that will be complemented with
commercial development, medical suites, a future library and civic building,
and stalls for informal traders.
Embizweni Square is a business and entertainment hub that offers an array of
businesses that play a role in the growth of the local economy. Embizweni
Square has the potential to unlock economic opportunities and it could
become branded as a tourist hub for both local and international visitors.
Already new and trendy businesses are mushrooming in the area which is a
sign of investor confidence in the township economy.

Built Environment Performance Plan (BEPP) - Nelson Mandela Bay, 2018/19 – 2020/21
78
Mendi Arts Centre was a 'blacks-only' Beer Hall during the Apartheid era. In
the early 2000s it was ear-marked for redevelopment as a community
building. Following an extensive community involvement process a project
brief was finalised in January 2011 along with comprehensive Business Plan
for the development of a Multi-Cultural Centre. The Centre is focused primarily
on the Performance Arts in the local community, providing a platform for
artists to further their development. The following components were identified
to form part of the new Centre: performance hall, visual arts studio, entrance
foyer, restaurant, office and administration component, ablution facilities and
general storage areas. The building has undergone a R25m revamp and is
close to being operationalised.
Red Location is known as the cultural node in this precinct. It includes the
Red Location Museum of Apartheid, an art gallery, an electronic library; a
backpackers’ lodge as well as the regenerated of Singhapi Street.
The development of this precinct has the potential to unblock economic
opportunities. It is not often that a precinct offers such diversity of activities. It
combines transport, commercial, arts, culture and entrainment. The precinct is
well connected to the rest of the city. It is located near work opportunities in
Struandale and Deal Party. It offers an opportunity for “work, live and play”.
2.1.2.1.9 Initiatives for the development of Other Marginalised
Residential Areas and Growth Areas / Economic Nodes
In this regard the following are some of the initiatives that are Implemented in
various areas in the NMBM which assist with the development of the
economic nodes, development areas and other marginalised residential
areas.
Built Environment Performance Plan (BEPP) - Nelson Mandela Bay, 2018/19 – 2020/21
79
Partnerships
No formal public-private partnerships in terms of legislation are in place. It is
the intention of the Municipality to explore these options, specifically for the
development of the N2 North Node.
Currently, partnerships exist in respect of the Bay West and Utopia
Developments which form part of the N2 Node Catalytic Programme. This is in
the form of municipal services agreements. The agreements commit the
developers and the Municipality to counter-funding for the provision of bulk
services to the area.
The Mandela Bay Development Agency (MBDA) is a municipal entity and
implementing partner of the Municipality. The MBDA has done extensive
work in the marginalised residential areas of Helenvale, Motherwell,
Schauderville, Korsten and portions of Ibhayi.
Seamless co-operation between the MBDA and NMBM is vital to the
successful implementation of these projects.
MBDA as well as other area based management initiatives are discussed
under the Urban Management section of this report.
Development Clusters
The Municipality through its Economic Development Tourism and Agriculture
Directorate is working with different industrial and economic clusters in order
to drive manufacturing that will ultimately create decent jobs. There are three
Industrial Clusters that the city is collaborating with in the region:
• Automotive Cluster
• Composite Cluster
• Maritime Cluster
Built Environment Performance Plan (BEPP) - Nelson Mandela Bay, 2018/19 – 2020/21
80
Automotive Cluster:
The Automotive Industry Development Centre (AIDC) provides support to the
Original Equipment Manufacturers (OEMs) and suppliers through their
programmes in order to enhance global competitiveness. Their programmes
include:
• Skills development and training
• Supplier and enterprise development
• Incubation programmes
• Energy management
Composite Cluster:
The cluster coordinates Research and Design (R&D), skills development and
industrialisation efforts to activate value chains that make use of non-corrosive
and lightweight composite technology, but covering all non-metallic polymeric
technologies including composites, plastics, elastomers and specialty
coatings.
The cluster aims to establish a dedicated non-metallic hand skill training
capability, a collaborative R&D capability in which scientists and engineers
(academia and industry) can work together on developing non-metallic
solutions that can enhance the competitiveness of existing value chains and
unlock new ones.
The aim is to cross-pollinate technology and skills between boat building,
renewable energy, automotive and aerospace using shared infrastructure.
Maritime Cluster:
The Nelson Mandela Bay Maritime Cluster was only founded in 2012 and is
still in the process of developing. Nelson Mandela Bay Maritime Cluster’s

Built Environment Performance Plan (BEPP) - Nelson Mandela Bay, 2018/19 – 2020/21
81
objective is to enhance networking opportunities between local maritime
business, government and institutions of higher learning.
The Nelson Mandela Bay Maritime Cluster strives to increase competitiveness
within the ocean economy and work towards creating opportunities for
investment and job creation.
Investment Incentives Policy
Incentives are one of the many policy tools used by governments to
encourage investments in a particular area or sector. There are various
investment incentives and other financial and non-financial support for
investment offered by government. NMBM has an approved Investment
Incentives Policy which is aligned to these national incentives and support
initiatives.
The NMBM Incentive Policy provides the necessary guiding principles, details
on incentives offered by NMBM, application processes, relevant requirements
and approval procedures, and defines roles and responsibilities to enable a
professional, consistent and transparent incentive management dispensation.
The Incentive Policy is specifically focused to attract additional investments
from new and existing investors to Nelson Mandela Bay in the following key
sectors as identified in the NMBM Economic Growth and Development
Strategy:
Manufacturing sub-sectors: fuel, petroleum, rubber products, wood and
related products:
• Automotive manufacturing sub-sector
• Tourism and hospitality
• Agriculture
• Construction
• Logistics
• Other knowledge and information sectors (incl. BPO)

Built Environment Performance Plan (BEPP) - Nelson Mandela Bay, 2018/19 – 2020/21
82
The Incentive Policy is directed at new medium to large investments, as
defined by the National Small Business Amendment Act (2003), i.e. new
investments that will create 50 or more permanent jobs and have minimum
asset values of between R2 million and R5 million, depending on the sector
the business operates within.
The biggest challenge NMBM has with the policy is the insufficient budget
available to implement all the incentives.
The Coega SEZ Growth Node represents an opportunity for applying a rates
based incentive scheme. With land being under leasehold to industrial
tenants, and the CDC being the operator and landowner of the SEZ,
opportunities are available for introducing rating categories for Coega SEZ
properties given the services agreements between the CDC and the NMBM.
Rates based incentives schemes will be investigated.
Top 50 Programme
Nelson Mandela Bay Municipality has identified the need to recognise local
companies for their contribution to economic development and growth of the
region. Despite the challenges, local cost of doing business and a globally
competitive market place the local companies continue to grow.
The NMB Top 50 Programme acknowledges these companies. The
Programme was established in 2015 and has two main objectives:
The first objective is that of recognition and retention of the top 50 NMB
companies for their contributions to the economic growth of the region across
five specific categories. Proposed categories which have been identifed
include but are not limited to: Top Exporters, Top Investors, Top New-Comers,
Long Standing Companies and Top Job Creators.

Built Environment Performance Plan (BEPP) - Nelson Mandela Bay, 2018/19 – 2020/21
83
The second objective is to extend the service offering of the Export Help desk
through the stakeholder engagement exercise in order to develop lasting
relationships with the top 50 local companies.
NMBM recognises the impact created by these local companies in their
contribution to job creation and sustainability, economic growth, increase in
exports and investments and expansions.
Since March 2016, the NMBM hosts an annual award ceremony where the
Top Companies are awarded a certificate of recognition from the Municipality.
2.1.2.1.10 Housing Project Areas and IPTS in relati on to Integration
Zones
Housing
The following map shows the location of the Integration Zones in relation to
the housing project areas. It should be noted that some housing project areas
are within Integration Zones. There are a number of housing project areas
which do not necessarily correlate well with the Urban Network Strategy
priority areas.
As has been mentioned elsewhere in this report, in order to deliver housing in
a more sustainable manner, the NMBM is undertaking, through the CSP, a
Housing Strategy Review. In particular, this will prioritise delivery of higher
density housing within UNS priority areas, i.e. Integration Zones and Growth
Nodes.
The Housing Strategy Review has begun with a high level strategic review
and formulation of recommendations for the housing component (of the
human settlement framework) in NMBM. This work was performed by
Shisaka. More detail of the findings of the review are contained in the
Situational Analysis of NMBM attached as Annexure “C”.
Built Environment Performance Plan (BEPP) - Nelson Mandela Bay, 2018/19 – 2020/21
84
The completed report details a set of recommendations and outlines a
proposed strategic shift in dealing with housing. It has not yet been adopted
by Council and is in the process of being dealt with administratively and
politically in order to take the proposals further as a reviewed Housing
Strategy for Nelson Mandela Bay.
The preliminary strategic shifts revolve around the provision of subsidised
BNG housing; the provision of serviced sites not only for qualifying BNG
households, but also for households qualifying to access the FLISP (Finance
Linked Individual Subsidy Programmes) programmes and rental housing
provision.
The focus of the current initiative is to review the housing circumstance and
strategic options as reflected in the 2015 report by Shisaka titled “Sustainable
Provision of Housing in Nelson Mandela Bay”, updated in 2017 with a view to
prepare a Draft Housing Strategy for Nelson Mandela Bay for consideration
and adoption by Council.
It is further envisaged that a demonstration phase will involve the piloting of
new innovative and different methodologies for undertaking housing delivery.
Three areas of focus are currently recommended for consideration during the
demonstration phase:
• The Regularisation and Progressive Upgrading of Informal Settlements
• Increased supply of new housing opportunities in existing areas by
existing households (household densification)
• Building the housing delivery sector
Current work in the strategic review involves the verification of the status quo
housing circumstance analysis and the alignment thereof with the planning
time frames of other NMBM strategic documents as well as other relevant
policy documents. This will be followed by drafting of a final housing strategy

Built Environment Performance Plan (BEPP) - Nelson Mandela Bay, 2018/19 – 2020/21
85
and the testing thereof with technical directorates prior to presentation to key
administrative and political structures in the NMBM.
A high level implementation plan, including provision for change management
and industry building is also incorporated in the scope of works.
It is envisaged that the aforementioned tasks will be completed during the
2018 Calendar Year.
FIGURE 29: Housing Programmes in relation to Integr ation Zones and Growth Areas
Source: NMBM, 2018

Built Environment Performance Plan (BEPP) - Nelson Mandela Bay, 2018/19 – 2020/21
86
IPTS and Public Transport Management
According to the Technical Transport Planning Guidelines for CITPs prepared
by the Department of Transport, the alignment of an Integrated Public
Transport System (IPTS) should inform land development, thereby providing
proposed developments access to existing and operational public transport
facilities. Additionally, the CITP can indicate the necessary intensification
requirements of commercial, residential and activity land-uses that would
make an IPTS viable. Low density, dispersed developments beyond the reach
of public transport corridors have numerous negative impacts on the transport
system, including long trip-times to public transport nodes, poor non-
motorised transport (NMT) opportunities and the promotion of private vehicle
use. These developments should consequently not be prioritised for
development until they are linked to the public transport system or
employment opportunities are provided within or close to the development and
urban densities are increased to sustainable levels.
The MSDF, and the individual project proposals specified by the MSDF,
should be evaluated according to the transport implications of the project
alternatives. Selection of project alternatives should be made with reference to
the performance of the proposal and transport system in terms of the following
objectives:
• Integration
• Safety
• Environmental Impact
• Economy
• Accessibility
Built Environment Performance Plan (BEPP) - Nelson Mandela Bay, 2018/19 – 2020/21
87
It is recognised that poor integration of land-uses and inadequate accessibility
to work opportunities by public transport, negatively impacts the economy and
environment through long average travel times, high fuel usage and wasted
time. This thinking is paramount to the planning of the Integration Zones and
Priority precincts.
One of the focal points of the MSDF is to develop corridors along major
transport routes. These corridors are to be flanked by mixed-use development
and supported by improved public transport routes, such as the Khulani
Corridor (Integration Zone 1) that extends from the CBD to NMBM 2010
Stadium to Njoli Square and Motherwell. These corridors thereby promote
accessibility to a number of amenities, facilities and jobs, as well as improve
mobility within the City.
The strategic development projects included in the MSDF implement the core
development focus areas. A number of Prioritised Precincts in the Urban
Network Strategy programmes, such as Njoli Square, Motherwell and
Zanemvula to name a few, include strategies to promote mixed-use
development, increase urban density and develop infill housing on currently
vacant land, especially along transport corridors.
These approaches have numerous advantages in terms of the transport
system that cover all of the objectives for projects mentioned above.
Improved integration can be assured by promoting public transport
development, which is made viable by increasing housing densities as more
people can make use of fewer public transport stops. The safety of non-
motorised transport (NMT) users is enhanced by upgrading the road reserves
as well as through densification: by placing more residences and businesses
adjacent to the access routes, human presence on the street is increased
thereby enhancing pedestrian security.

Built Environment Performance Plan (BEPP) - Nelson Mandela Bay, 2018/19 – 2020/21
88
Consideration of the potential for the Metropolitan Open Space System to
support Green Lanes for Non-Motorized Transportation (NMT) is important.
The basis for NMT is currently the NMBM CITP (2011/12), but, this plan
considers neither the concept of Green Lanes, nor the coastal bike path from
Cape Recife to Kings Beach and from Papenkuils River mouth (Smelly Creek)
to Coega.
Environmental impact is mitigated by reducing travel distances and time spent
travelling by promoting mixed-use developments and public transport. Dense,
mixed-use neighbourhoods allow economic opportunities and community
facilities to be located closer to a greater number of residents, thereby making
the provision of facilities more cost effective. Accessibility to public transport
and facilities is also improved by dense, mixed-use development strategies on
defined transport corridors.
The economic situation of the majority of residents in NMBM makes them
captive to public transport or NMT. Public transport itself encourages the use
of NMT for the initial trip phase, from home to a public transport stop, and the
final trip phase, from stop to destination. It is therefore vital for the
effectiveness of a public transport system, that NMT users can safely and
securely reach public transport. Community segregation is another issue that
should be actively dealt with by the MSDF, as segregation restricts access to
some parts of the community, reducing ability to reach public transport and
community facilities.
Trends and Demand for Transportation
Fundamental to the concept of the Integration Zones is the accessibility via
public transport. This is in accordance with the CITP objectives of:
• Integration
• Safety

Built Environment Performance Plan (BEPP) - Nelson Mandela Bay, 2018/19 – 2020/21
89
• Environmental Impact
• Economy
• Accessibility
Poor integration due to historic spatial planning and land-uses perpetuates
inadequacy in accessibility to work opportunities and other amenities by public
transport which impacts negatively on the economy, environment and other
social factors through long average travel times and high fuel usage.
The MSDF aims to develop corridors along major transport routes. The
corridors in the proposed integration zones are to be flanked by mixed-use
development and will be supported by improved public transport routes that
were identified specifically to facilitate mobility and accessibility within the
Integration Zones. The starter service as it is currently being planned mainly
subscribes to the five objectives of the CITP that seek to foster integration and
provide a safe and secure service while increasing accessibility by either
contributing or facilitating socio and economic activities within the NMBM and
beyond.
The implementation strategy for the IPTS as outlined in the Public Transport
Network Grant (PTNG) Budget Proposal for the MTEF 2018/19 to 2020/21
was mainly based on the existing public transport network of NMBM. In terms
of this strategy there is integration with human settlements at an MSDF level
and as part of the IPTS review, the NMBM intends to cascade the integration
in the implementation so that alignment with housing development plans is
achieved as per the requirements of BEPP.
It is important to note that the NMBM’s current transport planning is limited to
the MTEF period only, as apart from the data collected from the surveys
conducted in July 2016 on the Starter Service routes and the data that was
modelled from the 2004 surveys for the entire city, there is no current data
available on public transport operations.

Built Environment Performance Plan (BEPP) - Nelson Mandela Bay, 2018/19 – 2020/21
90
Consequently, the NMBM intends to conduct comprehensive Household
Travel Surveys before the end of 2018 with the intention of updating the
Public Transport Plan towards the development of a 20 year Integrated Public
Transport Strategy.
The following map shows the current transport plan- which is under review- in
relation to the top priority target areas of the Urban Network Strategy. In
particular, it demonstrates that the IPTS system is located within and
prioritises the UNS.
FIGURE 30: IPTS Routes in relation to Integration Z ones
Source: NMBM, IPTS, 2018

Built Environment Performance Plan (BEPP) - Nelson Mandela Bay, 2018/19 – 2020/21
91
National Department of Human Settlements Catalytic Projects and
Alignment with NMBM Catalytic Programme
The National Department of Human Settlements launched a programme in
2015 to identify what have been termed “Mega Catalytic Projects.” The
intention was to develop housing opportunities at scale in various locations
around South Africa through the selection and prioritisation of selected
projects nominated by Municipalities, Provinces and the private sector.
The intention was further to monitor progress at a national level and to ensure
progress with projects through a reporting system. The Housing Development
Agency was tasked with this responsibility.
Initially 5 projects were identified for NMBM these are shown on plan below.
FIGURE 31: Plan showing Initially proposed Human Se ttlements Mega
Catalytic Projects on NMBM Urban Network
Source: NMBM, 2017
• Zanemvula • KwaNobuhle • Jaghtvlakte • Algoa Park • N2 Node
Built Environment Performance Plan (BEPP) - Nelson Mandela Bay, 2018/19 – 2020/21
92
Attempts were made through the HDA to conclude Memoranda of Agreement
with the NMBM for the implementation of these projects, however, these were
not finally concluded and the National Department of Human Settlements is
reconsidering those projects that do not align with metro planning priorities
and further those that are of extended time frames. Projects to be finalised will
need to accord with the BEPP’s of municipalities.
The following projects show alignment with the NMBM’s Catalytic programme
and are identified below:
Kwanobuhle Estate
The proposed Kwanobuhle Estate development is a private sector catalytic
project and is situated near Kwanobuhle along the North Western
development spine and forms part of the Jachtvlakte Precinct Area.
It is envisaged that the development comprising of approximately 12800
residential opportunities will be developed in two stages. The first stage is
situated immediately adjacent to the Eastern part of Kwanobuhle and is
scheduled for development from 2019 to 2024, subject to all approvals being
in place prior to anticipated commencement of construction in January 2019.
Stage 2 is dependent on the installation of bulk water and sanitation, as well
as the augmentation of the Kelvin Jones Waste Water Treatment Works and
will only commence once significant progress with the development of Stage 1
has been made and when agreement has been reached between the
Municipality and the developer.
It is envisaged that a set of municipal service level agreements and
implementation protocols will be concluded between the developer, the
municipality, inter-governmental structures and possible private sector
structures in order to capture the respective roles and responsibilities as well
financial and other arrangements required for successful implementation.
Built Environment Performance Plan (BEPP) - Nelson Mandela Bay, 2018/19 – 2020/21
93
The developer is currently awaiting the environmental and land use
authorisation prior to commencement.
Jachtvlakte Sustainable Human Settlement
The Jachtvlakte Sustainable Human Settlement refers to the two-staged
development of the large land parcel situated on the North-Western
development spine between the existing Chatty Extensions (Zanemvula),
Kwanobuhle and the Uitenhage Industrial areas. It is a public driven catalytic
programme of the NMBM and will yield approximately 12000 residential
opportunities of various typologies and is aimed at a broad socio-economic
spectrum.
Stage 1 is, similar to the Stage 1 development of the Kwanobuhle Estate
project, not dependent on bulk infrastructure, whilst Stage 2 is dependent on
the same bulk requirements as the Kwanobuhle Project. It will yield between
4500 and 5000 residential opportunities and is situated immediately adjacent
to the Zanemvula Chatty development. It actually contains the portions of the
aforementioned development that could not be developed due to bulk
infrastructure constraints.
Stage 2 will continue along the Standford Road extension and will comprise of
a further 7000 to 7500 residential opportunities, as well as other mixed use
developments. It also includes an extension of the Logistics Park, which
could be developed independently from the residential development and
which could serve as an employment node for these new developments.
The development of Stage 2 will be impacted by long term development
trajectories and development potential take up in the city.
Built Environment Performance Plan (BEPP) - Nelson Mandela Bay, 2018/19 – 2020/21
94
N2 Nodal Development
The N2 node is identified, as noted elsewhere, as an NMBM Catalytic
Programme. It is also identified as one of the Growth Areas (Growth Area 1)/
Economic Nodes in the metro.
The current development status in the various components is as follows:
• Western Arterial
The development of the Western Interchange and western Arterial Link
between the N2 and Cape Road is dependent upon an appeal outcome of a
negative environmental authorisation in terms of the National Environmental
Management Act. The importance of this link road was highlighted in the
appeal submission
• Baywest Precinct
The Baywest Precinct comprises of two phases, i.e. a first phase centred
around the already functional super regional mall; and a second phase around
residential and high tech light industrial (warehousing) development.
Additional office development around the mall has already commenced and
the first thereof accommodates the new regional offices of SANRAL. It is
reported that the construction of further office blocks and the life style centre,
will be commencing in the 2018/19 reporting period, subject to economic
stability.
A residential component in Phase 1 has now obtained the necessary
authorisations in terms of SPLUMA and is reported to be commencing in the
same period. This development will essentially be comprised of medium to
high density residential development targeted at the middle to higher income
groups.
The phase 2 development is subject to bulk water and sanitation requirements
and is not foreseen to commence within the next 5 years.

Built Environment Performance Plan (BEPP) - Nelson Mandela Bay, 2018/19 – 2020/21
95
• N2 North
The proposed N2 North development is similarly dependent on the outcome of
the aforementioned appeal submitted at the end of January 2018.
• Utopia
Preparations are being made by the developers to commence with some of
the residential and retail components of the proposed mixed use and
integrated development. It is envisaged that portions thereof will be released
to private sector developers once the installation of the internal infrastructure
has been completed and the necessary completion certificates have been
issued.
Delays in take up and implementation are primarily due to the slow economy.
• Low Income Residential Development (Previously note d as Erf 432
Development)
Land assembly processes for the development of a low income residential
development to accommodate the informal settlement situated on Erf 432,
Hunters Retreat, as well as other surrounding informal settlements, will be
initiated during the forthcoming reporting period and will be subject to
availability of funding for land acquisition and the required authorisations in
terms of NEMA and SPLUMA legislation.
• Kuyga Extension
Land assembly processes for the extension of the existing Kuyga residential
area will similarly be attended to and will be subject to similar development
prerequisites.
Built Environment Performance Plan (BEPP) - Nelson Mandela Bay, 2018/19 – 2020/21
96
2.2 INSTITUTIONAL ARRANGEMENTS FOR SPATIAL PLANNING AND
TARGETING
Section A above deals comprehensively with the embedding of the BEPP and
UNS in the Metro institution.
In relation to the transversal arrangement for planning and implementation it is
worth reiterating the role of the BEPP Multi Sectoral task team.
The BEPP Multi Sectoral Task Team is comprised of senior members from all
Directorates in the Municipality who play a crucial role in the built
environment.
The Task Team meetings focus, inter alia, on driving the suite of catalytic
programmes, Integration Zone development, major municipal projects and all
BEPP related matters. In particular, the transversal responsibility for the
programmes and development is emphasised and meetings are deliberately
constructed to foster this culture of transversal responsibility.
Some of the Task Team meetings are devoted to specific focus areas and in
the 2017/18 Financial year sessions have been dedicated to IPTS, PRASA,
Public Works and the Housing Policy change.
In addition, the Task Team monitors grant expenditure – in particular the
Urban Settlements Development Grant and the Integrated City Development
Grant.
The template below is an example of a typical BMSTT agenda showing the
reporting on catalytic projects, grants, Integration Zones and precinct
planning.
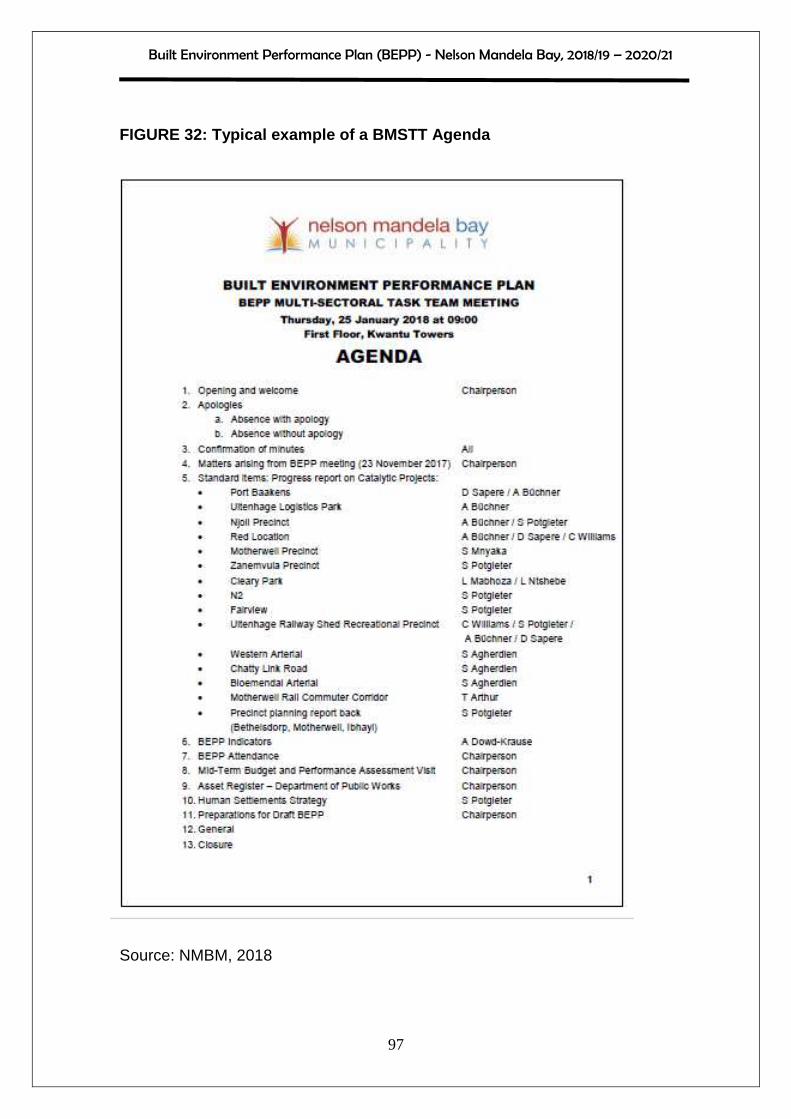
Built Environment Performance Plan (BEPP) - Nelson Mandela Bay, 2018/19 – 2020/21
97
FIGURE 32: Typical example of a BMSTT Agenda
Source: NMBM, 2018
Built Environment Performance Plan (BEPP) - Nelson Mandela Bay, 2018/19 – 2020/21
98
In addition to the above – the reporting on the Catalytic Programme has been
centred around the preparation of a series of templates responding to each
programme.
These templates highlight combined sectoral responsibilities for the
programme identified and are also introduced to ensure that all Directorates in
the NMBM are aware of the programmes and are able to identify their role in
the programme. This includes aspects such as Safety and Security which are
not necessarily hard infrastructure/capital investment issues.
Intergovernmental role players are additionally identified in the reporting
template. The templates are revised on a monthly basis. In some instances,
the information is well populated and in others there is still work in progress.
A typical example of a template for one of the programmes is attached as
Annexure “H”.
Built Environment Performance Plan (BEPP) - Nelson Mandela Bay, 2018/19 – 2020/21
99
SECTION C – CATALYTIC URBAN DEVELOPMENT
PROGRAMME AND PREPARATION
3. CATALYTIC URBAN DEVELOPMENT PROGRAMME
The Catalytic Programmes identified in this BEPP reflect interventions that
include developments that:
• Enable integration, that is mixed and intensified land uses where the
residential land use caters for people across various income bands and
at increased densities that support public transport viability within the
integration zones.
• Are game changers in nature and scope with significant impact on
spatial form and the economy.
• Involve major infrastructure development.
• Require a blend of finance where a mix of public funds can leverage
private sector investment as well as household investment.
• Have multiple stakeholders and require a range of skills across a
number of professions.
• inner city, mixed use, social, commercial and residential development
initiatives.
• informal settlements and marginalised area upgrading.
• linkage projects such as critical road infrastructure to ensure the proper
linkages of the Integration Zones to the rest of the city.
This accords with the BEPP Guidelines classification issued by National
Treasury.
The following map shows the location of the selected catalytic programmes in
relation to the Integration Zones and the Urban Network Strategy framework.

Built Environment Performance Plan (BEPP) - Nelson Mandela Bay, 2018/19 – 2020/21
100
FIGURE 33: NMBM Catalytic Programmes
Source: NMBM, 2018
These catalytic programmes will be vigorously pursued during the 2018/19
financial year and beyond. It is the intention to move the catalytic
programmes as quickly as possible from planning to the implementation
phase, in collaboration with all role players.
Annexure “I” is the Catalytic Programme Matrix and it maps the institutional
and funding requirements for implementation. It is in the later stages of
programme development that timing and budget aspects of each catalytic
project will become more refined. Annexure “I” will continue to be refined on
an on-going basis.
NMBM is characterised by slow economic growth. It can therefore be
concluded that positive change will be slow. In view of this, the City does not
have an opportunity for many economic and “game changing” programmes. It
is important therefore to focus efforts on a limited number of strategic
programmes that can have maximum impact. In addition, because of the
extreme poverty of the city, poor areas need to be targeted for investment and

Built Environment Performance Plan (BEPP) - Nelson Mandela Bay, 2018/19 – 2020/21
101
development. The City is spatially divided due to the geography and historic
patterns of development. Linkage projects to increase access have therefore
also been specifically prioritised.
The 14 Catalytic Programmes prioritised can be broadly categorised into three
groupings:
• Economic Game Changing Programmes
• Township Upgrading and Development Programmes
• Critical Linkages
These are as follows:
TABLE 5: Catalytic Programme Categorisation
Catalytic Category Project
Economic Game Changers 1. Port Baakens Development
2. Uitenhage Logistics Park
Township Upgrading and
Urban Development
3. Zanemvula Precinct Development
4. Motherwell Precinct Development
5. Red Location Precinct
6. Njoli Urban Hub Precinct
7. Cleary Park Modal Development
8. Fairview Precinct Development
9. Uitenhage Railway Shed Recreational
Precinct
10. N2 Nodal Development
Critical Linkages 11. Bloemendal Arterial
12. Chatty Link Road
13. Western Arterial
14. Motherwell Rail Corridor
Source: NMBM, 2018

Built Environment Performance Plan (BEPP) - Nelson Mandela Bay, 2018/19 – 2020/21
102
The prioritised programmes and the rationale for the programmes is described
below.
PORT BAAKENS DEVELOPMENT
This programme is the most significant BEPP Catalytic Programme from an
economic development perspective. The Baakens River Precinct has been
conceptualised as an integral part of the Port Marina Precinct, which is
concurrently being planned by Transnet. It is envisaged that the 23 km of
Baakens River Valley, together with the sea water frontage and port area, will
contribute to an alternative economy for the City. A number of priority projects
within the programme have been identified, as part of the Baakens River
Precinct Plan, in order to maximise the success of the precinct. These include:
• Vuyisile Mini Square upgrade; The upgrade of the square and adjoining
precinct focusses on ensuring that the heart of the city is a safe,
accessible and inclusive public space. It is anticipated that investment
into the public space will galvanise investment from the private sector
into the adjoining heritage buildings, that maximises the potential of the
unique built environment of the square to be repurposed in a socially
inclusive way
• The Baakens Valley: The Valley offers significant potential for property
development through the rehabilitation of the river to provide a
recreational and tourism attraction to local and international tourists. A
pedestrian bridge will be built over the Baakens River to provide
pedestrian access between the heart of the city and the Baakens/Port
Marina precinct. Increased parking along Produce Street will enable the
newly developed Tramway Building to function effectively as a
destination for events for the city.
• St Peter’s land: The aim is to refurbish the ruins of the St Peter’s
church site, landscape the area and provide a multi-purpose events
space. The maintenance and cleaning of the cemetery and surrounding
area will include the Paupers Grave and the Black Steps. Pedestrian
connections will be provided and lighting to the whole area, improved.
The development of a tourism route celebrating the mixed heritage
cultural stories within the precinct and offering the opportunity for the

Built Environment Performance Plan (BEPP) - Nelson Mandela Bay, 2018/19 – 2020/21
103
creative sector to access jobs in terms of public art, performance, film
making and participation in events, will form an integral part of the
programme. Land assembly and redevelopment: The majority of the
buildings in the precinct are underutilised or vacant, offering an
opportunity to regenerate the historic CBD.
• The Baakens River Park: The need for an attractive environment with
pedestrian/cycle paths that link into Settlers Park together with a safe
and secure park where people can walk and play will support and
enrich future adjacent uses.
• South End mixed use precinct comprises affordable, high density, low
rise housing together with micro enterprise/ incubator opportunities.
The Baakens Valley Precinct Plan identifies the possible development
of up to 1000 housing units.
• The upgrading and restoration of the Port Elizabeth Library which is a
historical monument is currently taking place.
• Govan Mbeki Avenue: The project aims to transform the main street of
the City into a new, precinct to live work and play, ensuring social
inclusion. The emphasis will be on the 40 000 students that currently
live in Central.
There are also a number of related linkage aspects associated with the
programme. These include the Apple Express and the beachfront and harbour
access. Integral to the longer term development of this area is the
development of alternative sites for the manganese ore dumps and oil tank
farm at Coega SEZ, where appropriate infrastructure and sites are being
developed.
The programme will contribute to addressing challenges of poverty,
unemployment and social inequality through the development of a diverse
economy based on tourism real estate. It responds directly to the key
performance area of Local Economic Development through the provision of
public sector investment into infrastructure to attract private sector investment.
The programme will increase the rates base of the city and is at the initial
phases of implementation. It will also assist with socio-economic integration
of the area.

Built Environment Performance Plan (BEPP) - Nelson Mandela Bay, 2018/19 – 2020/21
104
Transnet has recently begun a process to develop non-port related activities
at the Port Elizabeth Port which forms an integral part of this project. The
NMBM is interacting with Transnet in order to ensure a common development
vision for the entire area and related projects. A constructive partnership
needs to be formed for the planning and implementation of the programmes
for this area for the benefit of the citizens of NMBM. Processes are under way
to ensure that this happens.
UITENHAGE NELSON MANDELA BAY LOGISTICS PARK
The purpose-built Nelson Mandela Bay Logistics Park (NMBLP) in Uitenhage
managed by the Coega Development Corporation (CDC) is geared to locating
more first and second tier suppliers in automotive manufacturing. The vision
of the NMBLP is to obtain economies of scale for the automotive
manufacturing industry through centralisation of different functions and
suppliers to reduce costs by shortening and improving the supply chain to the
automotive industry.
Precinct A of the Park is 57 hectares and features purpose-built infrastructure
and shared services including security, ICT and logistics to minimise costs for
new investors and existing tenants. More than 1000 people are employed
within Precinct A of the Park. Developments in Precinct A have reached a
stage where expansion will have to be undertaken into Precinct B.
Investments need to be made in economic enabling infrastructure for essential
services and utilities such as electricity, water, a fire-ring main for
emergencies and internal roads.
The automotive production sector remains a critical segment for the city
economy because of its cross-cutting linkages across several industries and
services as well as its documented contribution to various economic
development imperatives. Inputs into automotive production include textiles,
metals, electronics, plastics and chemicals, general engineering, and
packaging.

Built Environment Performance Plan (BEPP) - Nelson Mandela Bay, 2018/19 – 2020/21
105
There is a demand to implement Precinct B, to occupy an estimated area of
126 hectares. Due to the potential job creation and economic impact the
logistics precinct is now identified as a BEPP Catalytic Programme.
To complete the required infrastructure for Precinct A and to develop Precinct
B an estimated investment of R350m is required.
The programme will have considerable socio-economic benefits for the
Nelson Mandela Bay Municipality and the Eastern Cape Province as it will
contribute to sustaining jobs in the automotive sector, create export led growth
and a positive balance of payments. These interventions are in line with IPAP
and are expected to lead to substantially increased investment in the
automotive and metal sectors, leading to increased production, job creation
and diversification of the two closely linked sectors.
Precinct 2 is in its concept phase (pre-planning). During the planning phase
attention will be given to access linkages with abutting land uses as the
Logistics Park development forms part of the Jaghtvlakte development. The
next step in the project is to submit a report to NMBM Council to secure clarity
on who will be the developer, the managing agent, funding options and
applying to the dti SEZ Board that the NMBLP be designated as a Special
Economic Zone. The Coega Development Corporation (CDC) has leased and
operated Precinct 1 of the project since 2008 and the existing lease makes
provision for extending the development to include Precinct 2.
Upon Council resolution on Precinct 2, detailed cost estimates and a business
case can be submitted to potential funders in collaboration with the CDC, e.g.
ECDC, National Treasury, Critical Infrastructure Programme administered by
the Department of Trade and Industry (dti). Some of the challenges that this
project could face are the slow growth in the economy (which will result in
slow demand for the land) and securing funding to implement the project.

Built Environment Performance Plan (BEPP) - Nelson Mandela Bay, 2018/19 – 2020/21
106
ZANEMVULA PRECINCT DEVELOPMENT
The Zanemvula precinct development intends to ensure that socio-economic
facilities and amenities and alternative residential types are provided within
these RDP housing areas.
Amenities in this area will also serve the Bloemendal and KwaNobuhle areas.
Mixed use areas have been planned alongside the transport spine.- (Chatty
Link Road) which traverses this area in the heart of Zanemvula project
(45 000 residential opportunities). The newly constructed Chatty Link Road
presents the opportunity to stimulate the economy in this very poor residential
area. The Chatty Link Road is clearly a catalyst for economic development.
Opportunities do not exist for connectivity of this area to the rest of the city
and the role of this area as a transport hub needs to be recognised.
The hub will fulfil a larger role of city building in this area and bring much
needed economic and social activity to what is presently a sea of houses in
isolation of any other city fabric. The area is located in the integration zone
identified in the Urban Network Strategy.
The development in the Chatty Jachtvlakte Node involves mixed-use and
residential development by the private sector and the Municipality, with an
estimated yield of 32 000 new residential opportunities in the middle,
affordable (rental and ownership) and subsidised housing segments. To the
North of the Zanemvula /Chatty Jachtvlakte Node is the Nelson Mandela Bay
Logistics Park. Phase 1 is fully developed and there is a demand to develop
Phase 2 which is now identified as a catalytic programme and is described
above. This can provide much needed work opportunities for the residents of
the Zanemvula area.
The programme will enable the following:
• Access to economic opportunity - employment and entrepreneurship
opportunities from businesses that operate at public transport nodes –
bus stations, train terminals, and taxi ranks.
Built Environment Performance Plan (BEPP) - Nelson Mandela Bay, 2018/19 – 2020/21
107
• Social spaces - where people can connect, network, and share
knowledge. By creating a safe environment for people to interact, a
myriad of opportunities can emerge.
• Easier movement of labour - integrated and efficient transport routes
reduce wasted time (such as waiting time, and walking between a train
and a taxi station) – people can therefore be more productive.
There is synergy between this programme and the project which is the subject
of the South African Germany Peer to Peer Network which examines projects
in three South African Cities and three German Cities. This project is being led
by COGTA and the Zanemvula mixed use corridor is the NMBM project for the
Network.
MOTHERWELL PRECINCT DEVELOPMENT
Development in the Motherwell area comprises municipal and private sector
developments. Critical to the development of this area is the implementation
of a commuter rail link with four stations between the Swartkops line and
Motherwell NU29 as a first phase. This is discussed in more detail under the
catalytic programme of Motherwell Rail Corridor below.
The Motherwell Growth Area / Economic Node is discussed in more detail
above.
RED LOCATION PRECINCT
Located in the historic Red Location area of Ibhayi, the precinct consists of the
Apartheid Museum, Art Gallery, Electronic Library and Back-packers Lodge.
The Apartheid Museum was completed in 2004. The Art Gallery and
Electronic Library buildings were completed in 2011. The performing arts
complex and school of music form the last two phases of the precinct. The
Business Plan for the performing arts complex is complete.
The access roads to the Red Location Precinct are in a state of disrepair.
Hence it was considered important to upgrade Singhapi Street as a major
tourism approach route to Red Location in order to maximise the tourism

Built Environment Performance Plan (BEPP) - Nelson Mandela Bay, 2018/19 – 2020/21
108
opportunities for the residents of the area themselves and enable them to
develop a street similar to Vilakazi Street in Soweto, Johannesburg,
celebrating the art, culture and heritage of New Brighton. The Singhapi Street
project is further implemented to promote local economic development in the
so-called township areas aligned to the urban renewal initiatives within the
inner city.
The Iconic Red Location Museum received approximately 150 000 visitors per
annum when it was open. The museum remains closed due to community
demands. Meetings between the community and political leadership (from
local, provincial and national level) have not managed to resolve the impasse.
The continued closure of Red Location Museum is hampering that the full
potential of the precinct is being maximized.
The precinct will play a significant role as a cultural/tourism node and can be
directly linked with the Port Elizabeth CBD by means of the New Brighton
Railway Station, which is within walking distance. It will furthermore
complement and strengthen not only the Njoli Hub, but also the Khulani
Corridor.
NJOLI URBAN HUB PRECINCT
Njoli Square is in the heart of one of the oldest dormitory suburbs in Port
Elizabeth. The multi-million rand redevelopment initiative around the historic
Njoli Square will contribute to creating a dignified space within a previously
marginalised community. It is aimed specifically at economic upliftment.
The programme includes the following:
• Reconfiguration of the junction of Njoli and Daku Roads to
accommodate traffic flow through a compact four-legged intersection;
• Accommodation of development components on the four quadrants
surrounding the intersection, such as commercial development,
medical suites, space for a future library and civil building, and stalls for
informal traders and a Modal Transport interchange;

Built Environment Performance Plan (BEPP) - Nelson Mandela Bay, 2018/19 – 2020/21
109
• Promoting pedestrian accommodation through safe and controlled
crossing points;
• Accommodating future IPTS stations on the approaches to the
intersection and
• Accommodating all minibus-taxi operations in one facility at or close to
the existing off-street facility.
A Precinct Plan for the Njoli Hub and surrounds (including major road
corridors leading to Njoli Square) is soon to be completed. The objective of
the precinct plan is to facilitate the creation of an urban development zone to
incentivize mixed use intensification and densification over time by the private
sector.
The NDPG section of National Treasury is awaiting a detailed breakdown of
the project elements with a layout plan from NMBM on the project before
NPDG funding is approved.
It is anticipated that the cost breakdown and plan will be submitted to the NDP
to secure funding of the project. Thereafter detailed designs will commence
followed by the procurement process for a contractor and the Request for
Proposals to attract private sector development.
The risks associated with this project include:
• Land invasion of the vacant land in and around Njoli.
• The time it is taking to resolve the appointment of the consultants.
• The community is losing interest in the project because it to taking so
long.
• Inflation is making the project un-affordable.
CLEARY PARK MODAL DEVELOPMENT
A modal interchange has been planned at Cleary Park in close proximity to
the existing shopping centre. The intention is to develop:
Built Environment Performance Plan (BEPP) - Nelson Mandela Bay, 2018/19 – 2020/21
110
• Catalytic activities around the modal interchange
• Opportunities for public transport activities and densification along
Cleary park route
The Cleary Park route is very constrained and needs planning intervention as
a section runs alongside the commuter railway.
FAIRVIEW PRECINCT DEVELOPMENT
This precinct is not only a catalytic programme but is also recognised as a
Growth Area/ Economic Node of the City. It is an Integrated Mixed Use and
Residential Development in the Fairview / Willowdene as discussed in detail in
the section covering Growth Areas and Economic Nodes above.
UITENHAGE RAILWAY SHED RECREATIONAL PRECINCT
This programme involves the development of an integrated mixed use and
recreational precinct that links the Uitenhage Railway Shed development with
a planned open space and regional recreational facility. This programme is
important for the Uitenhage area as it will bring regional recreational
opportunities to the area and will support the Railway Shed and Science Park
Centre which have been developed by the Municipality.
The precinct consists of four sub-projects:
• Project 1: Unblocking of the development (Sale of land and Lease
Agreement) with the private sector. Legal intervention is taking place to
unlick the sale and lease processes which have not been concluded in
eight years.
• Project 2: The upgrade of Railway Sheds on the lease portion that forms
part of the Science Centre Precinct. The MBDA is in the process of
appointing a service provider to assist with the assessment of the buildings
as they are of historic value.
Built Environment Performance Plan (BEPP) - Nelson Mandela Bay, 2018/19 – 2020/21
111
• Project 3: Unblocking potential of the under-utilised sports facilities
(Central Sport fields and Swifts Sports Ground). A structural assessment
of the existing buildings must be done. A way forward must be determined
on how to deal with the illegal occupants in the buildings.
• Project 4: Development of a precinct plan incorporating all 3 projects
referred to above and identifying potential new projects.
N2 NODAL DEVELOPMENT
The N2 Growth Area/ Economic Node is discussed in detail above. The
programme is reflected as both a BEPP Catalytic Programme and Economic
Node/Growth Area. This area is the fastest growing development area in the
NMBM.
The project area is anchored by the Baywest Shopping Mall of 90 000 m2
GLA. The greater area includes 450 000 m² of mixed retail and office space, a
hospital, hotel and ICC.
The area will contribute to socio-economic integration and will, once fully
developed, provide a range of housing opportunities. In order to further the
objectives of integration and access, this area will need to be physically linked
to the Zanemvula Chatty area via the Western Arterial.
BLOEMENDAL ARTERIAL
The Bloemendal Arterial is a critical link that connects the Njoli and Chatty
Jachtvlakte Hubs. The construction of this critical linkage forms part of the
longer-term proposal of the Comprehensive Integrated Transport Plan.
The road is 9 km in length and is comprised of two portions made up of 6.5
km and 2.5 km. Once constructed, it will strengthen access and integration by
spatially linking the two areas. By improving connectivity between areas,
economic activity will also increase.

Built Environment Performance Plan (BEPP) - Nelson Mandela Bay, 2018/19 – 2020/21
112
A spin off of the development of this road will be that as an essential transport
collector it could fast track development in the area. The impact will directly
assist the predominantly poor area.
The road will form a catalyst for commercial development, employment and
other social facilities which have presently been constrained due to no access.
CHATTY LINK ROAD
The Chatty Link Road is a Catalytic Programme as it is critical for the further
development of the mixed use planned area which abuts it. This area will
allow development of much needed alternative higher density housing
opportunities, community and economic amenities as well as open spaces
and meeting places.
The road is a 1.98 km link road between Standford Road and Bloemendal
Arterial Routes and has recently been completed partially using ICDG funding.
Tree planting and the provision of park amenities are currently taking place.
WESTERN ARTERIAL
The Western Arterial is a critical link road linking the N2 nodal area to the
Chatty Jachtvlakte area and greater Uitenhage. It is approximately 10 km in
length and preliminary designs are completed. Detailed designs have been
finalised for the interchange with the N2 as well as the link between the
interchange and Cape Road.
Route alignment between Cape Road and Standford Road is currently being
finalised through the EIA process.
This route will connect areas of poverty and unemployment to the growing N2
economic node. Presently people from Uitenhage and surrounds need to
travel into Korsten in order to get to the N2 node which offers many
employment opportunities.
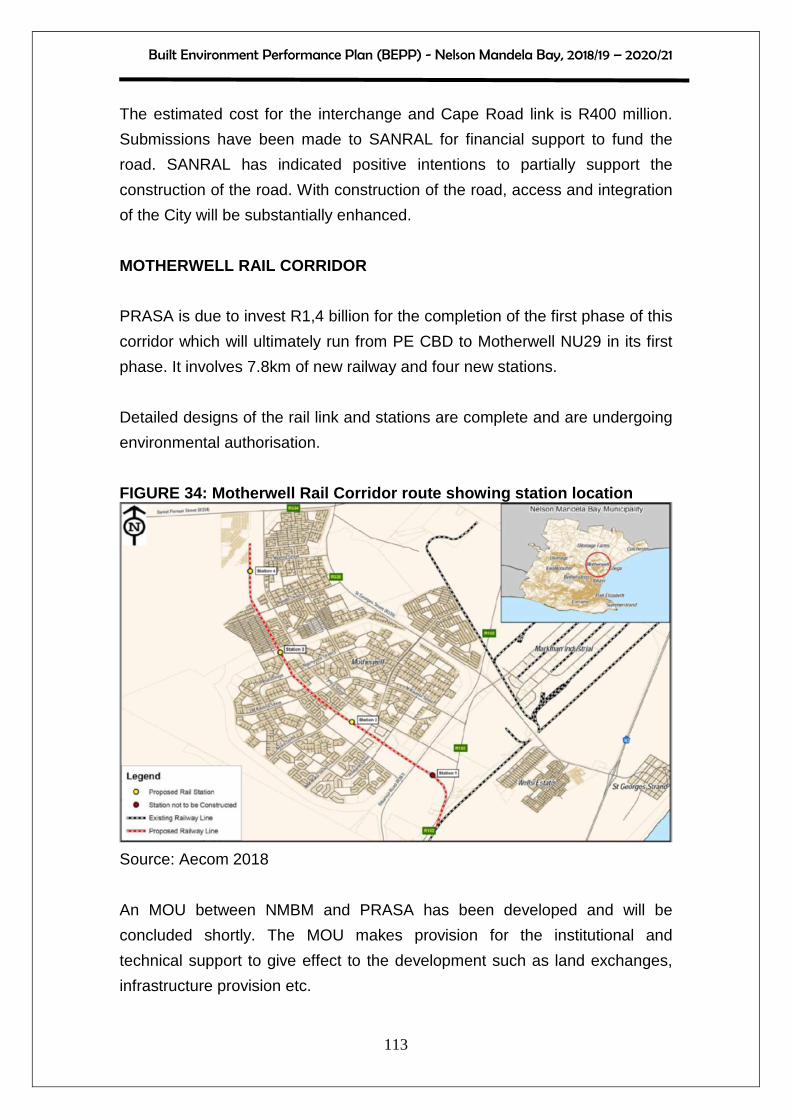
Built Environment Performance Plan (BEPP) - Nelson Mandela Bay, 2018/19 – 2020/21
113
The estimated cost for the interchange and Cape Road link is R400 million.
Submissions have been made to SANRAL for financial support to fund the
road. SANRAL has indicated positive intentions to partially support the
construction of the road. With construction of the road, access and integration
of the City will be substantially enhanced.
MOTHERWELL RAIL CORRIDOR
PRASA is due to invest R1,4 billion for the completion of the first phase of this
corridor which will ultimately run from PE CBD to Motherwell NU29 in its first
phase. It involves 7.8km of new railway and four new stations.
Detailed designs of the rail link and stations are complete and are undergoing
environmental authorisation.
FIGURE 34: Motherwell Rail Corridor route showing s tation location
Source: Aecom 2018
An MOU between NMBM and PRASA has been developed and will be
concluded shortly. The MOU makes provision for the institutional and
technical support to give effect to the development such as land exchanges,
infrastructure provision etc.

Built Environment Performance Plan (BEPP) - Nelson Mandela Bay, 2018/19 – 2020/21
114
The route is hampered by the existence of some informal settlements in the
way of the route alignment. These challenges will have to be overcome in due
course.
A future phase 2 is intended and will continue the loop through Coega SEZ
and Markman.
The rail is complementary to the IPTS route between Port Elizabeth CBD and
Motherwell.
A final longer term phase is a link to Uitenhage station from Motherwell.
3.1 PROGRAMME PREPARATION
The BEPP Situational Analysis section on built environment trends
(Annexure “C”) show a sluggish economy with little private sector investment.
Within this context, the following can be seen to be impediments for the full
realisation of the NMBM catalytic programmes:
• Moving the projects from planning stage to implementation stage in terms
of critical processes.
• The time critical processes such as EIA's, Infrastructure assessments and
other expert reports take to complete before costing and viability can be
finalised.
• The achievement of the total funding needed for holistic development
including civic amenities and facilities such as parks and recreational
areas, street lighting, tarred roads, schools and clinics.
• The timing of the provision of services and amenities to be provided by
other spheres of government to align with NMBM’s development
objectives.
• The general funding for associated bulk infrastructure including public
transportation.

Built Environment Performance Plan (BEPP) - Nelson Mandela Bay, 2018/19 – 2020/21
115
• The tendency for dependent communities to resist higher density
development in favour of RDP type housing on separate erven.
• The lack of interest shown by the private sector to invest in municipal
project areas.
• The difficulty to achieve socio-economic integration in such areas and
provision and take-up of a range of housing opportunities.
The Catalytic Programmes are being evaluated and assisted through the City
Support Programme using expert assistance offered in terms of the CSP
Programme.
3.2 INTERGOVERNMENTAL PROJECT PIPELINE
3.2.1 Critical Growth and Development Projects for all Sectors
The intergovernmental project pipeline is contained in Annexure “J” attached
hereto. This annexure contains not only the BEPP Catalytic Programmes but
also other growth and investment projects that the City needs to undertake.
The following projects have been preliminarily identified as critical for
sustained growth and development of the City. They require screening,
detailed evaluation and prioritisation. However, should they prove to be
unavoidable, major capital investment will be required.
TABLE 6: Potential Critical Investment Priorities i n the NMBM
No Description Cost
Est.
Budget Timeframes Project Status
1 Nooitgedaght
Phase 3
R350M DWS Dec-19 Construction stage
2 Borehole Water
Exploration
R200M '18/19 – R12M;
19/20 - R23M;
20/21 - R25M
Dec-19 Production boreholes under
construction. Tender for treatment
facilities to be advertise during 1st
quarter of 2018/19.
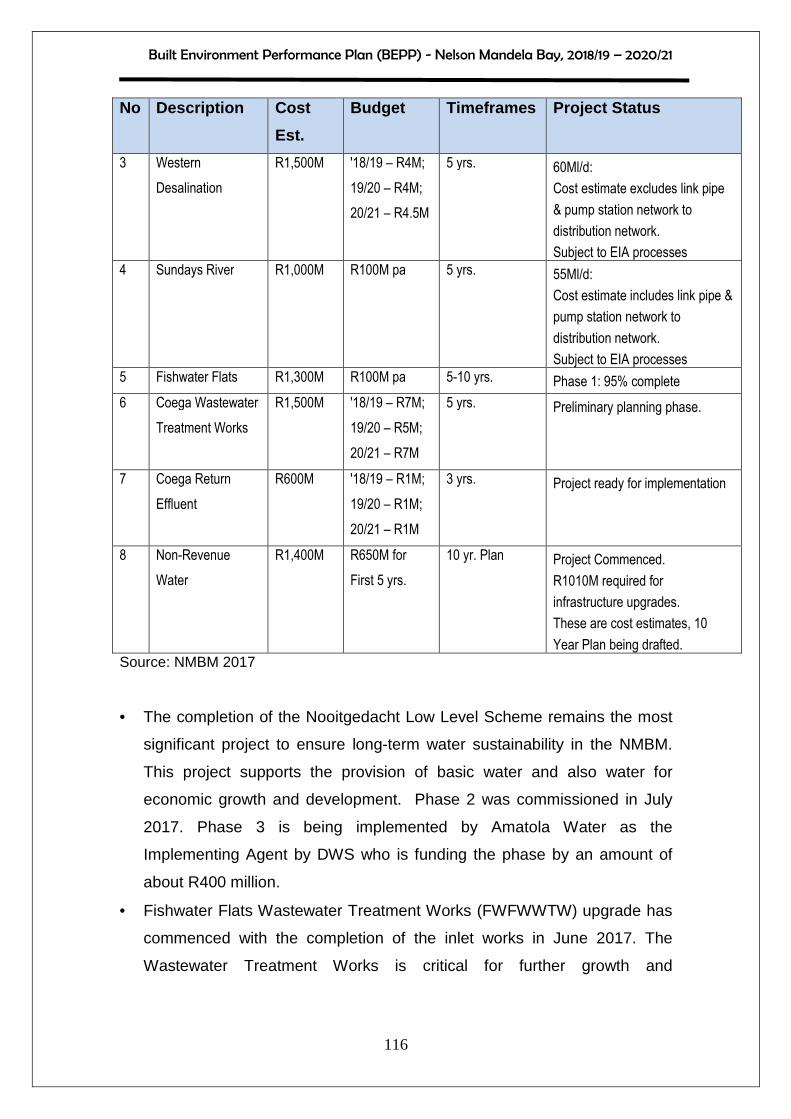
Built Environment Performance Plan (BEPP) - Nelson Mandela Bay, 2018/19 – 2020/21
116
No Description Cost
Est.
Budget Timeframes Project Status
3 Western
Desalination
R1,500M '18/19 – R4M;
19/20 – R4M;
20/21 – R4.5M
5 yrs. 60Ml/d:
Cost estimate excludes link pipe
& pump station network to
distribution network.
Subject to EIA processes
4 Sundays River R1,000M R100M pa 5 yrs. 55Ml/d:
Cost estimate includes link pipe &
pump station network to
distribution network.
Subject to EIA processes
5 Fishwater Flats R1,300M R100M pa 5-10 yrs. Phase 1: 95% complete
6 Coega Wastewater
Treatment Works
R1,500M '18/19 – R7M;
19/20 – R5M;
20/21 – R7M
5 yrs. Preliminary planning phase.
7 Coega Return
Effluent
R600M '18/19 – R1M;
19/20 – R1M;
20/21 – R1M
3 yrs. Project ready for implementation
8 Non-Revenue
Water
R1,400M R650M for
First 5 yrs.
10 yr. Plan Project Commenced.
R1010M required for
infrastructure upgrades.
These are cost estimates, 10
Year Plan being drafted.
Source: NMBM 2017
• The completion of the Nooitgedacht Low Level Scheme remains the most
significant project to ensure long-term water sustainability in the NMBM.
This project supports the provision of basic water and also water for
economic growth and development. Phase 2 was commissioned in July
2017. Phase 3 is being implemented by Amatola Water as the
Implementing Agent by DWS who is funding the phase by an amount of
about R400 million.
• Fishwater Flats Wastewater Treatment Works (FWFWWTW) upgrade has
commenced with the completion of the inlet works in June 2017. The
Wastewater Treatment Works is critical for further growth and
Built Environment Performance Plan (BEPP) - Nelson Mandela Bay, 2018/19 – 2020/21
117
development in the Metro. The total funding needed is estimated at R1,3
billion.
• Economic infrastructure for developments such as the Coega Wastewater
Treatment Works and the Coega Return Effluent Scheme, is needed to
support the Coega SEZ. Further development of the SEZ will be
hampered without funding for these projects. An investment of
approximately R600 million is required to complete the Return Effluent
project.
• Planning has commenced on a new wastewater treatment facility to
support the housing developments north of Motherwell and the Coega
SEZ. This plant is planned for an ultimate capacity of 120 Ml/d costing in
the region of R1,5 billion A start up capacity of approximately 20Ml/d will
be required.
As part of the Capacity Support Implementation Plan, funding strategies for
Fishwater Flats and the Coega Waste Water Treatment Works will be looked
at to optimise the project essentials, timing and funding.
Backlogs and funding requirements
Annexure “C” (BEPP Situational Analysis) attached indicates the detailed
infrastructure and maintenance requirements per sector for NMBM. Many of
these have an intergovernmental responsibility.
The table below reflects the estimated total infrastructure capital backlog for
NMBM. The figures are currently being reviewed for greater accuracy.

Built Environment Performance Plan (BEPP) - Nelson Mandela Bay, 2018/19 – 2020/21
118
TABLE 7: Total Infrastructure Capital Backlog
BACKLOGS AMOUNT
Infrastructure capital backlog R 10 541 000 000
Capital refurbishment and repairs and
maintenance
R 11 697 000 000
Electricity network refurbishment and
infrastructure recapitalisation
R 1 324 000 000
Total R 23 562 000 000
The abovementioned amount of R23,562 billion does not include the provision of public
amenities such as schools, libraries and clinics, public transport provision and housing
for backyard dwellers. The Electricity and Energy Directorate has applied for and
received a grant from the French government to conduct a full audit, feasibility study and
development of a business case for the recapitalisation of the Electrical network in the
NMBM. The study commenced in March 2017 and was concluded in August 2017. A
business case was developed in November 2017 and will be implemented.
3.2.2 Coordination and alignment with SIPS
There are three Presidential Infrastructure Coordinating Commission (PICC)
programmes that affect the NMBM. The PICC is made up of 18 programmes, generally
called SIP (Strategic Integrated Projects).
The following SIPs apply in NMBM:
• SIP 3: South Eastern Node and Corridor Development
Focused on the creation of infrastructure for economic purposes.
• SIP 7: Integrated Urban Space and Public Transport Programme
Focused on the creation of infrastructure for the development of urban spaces.

Built Environment Performance Plan (BEPP) - Nelson Mandela Bay, 2018/19 – 2020/21
119
• SIP 18: Water and Sanitation
Focused on the creation of water and sanitation infrastructure, as much of the listed
projects are common in all the SIPs.
The PICC provides a coordinating function for all the projects identified at local level and
does not provide any finances for the implementation of the projects.
TABLE 8: Current SIP Projects in NMBM
Project Name and
Scope
Project status Project budget
Coega SEZ & Port of Ngqura:
Water & Sanitation Services
Construction of a water
treatment works, waste Water
treatment works, pump
stations, reservoirs and
pipelines.
1. Nooitgedacht: Phase 1:
100% complete. Phase 2 –
Operational. Phase 3 –
construction commenced and
scheduled for completion in
December 2019.
2. Wastewater Treatment
Works: Preliminary design and
EIA commenced.
3. Recycled effluent schemes
in preliminary design stage.
ROD received for RE scheme.
Reclaimed reservoir is being
constructed. Business plan
being prepared with the Coega
SEZ for funding.
Bulk Water:
Wastewater
Treatment:
Recycled
water for
Industrial Use
Phase 3: DWS
appointed
Amatola Water as
the implementing
agent (±R400m )
R1300M
R600M
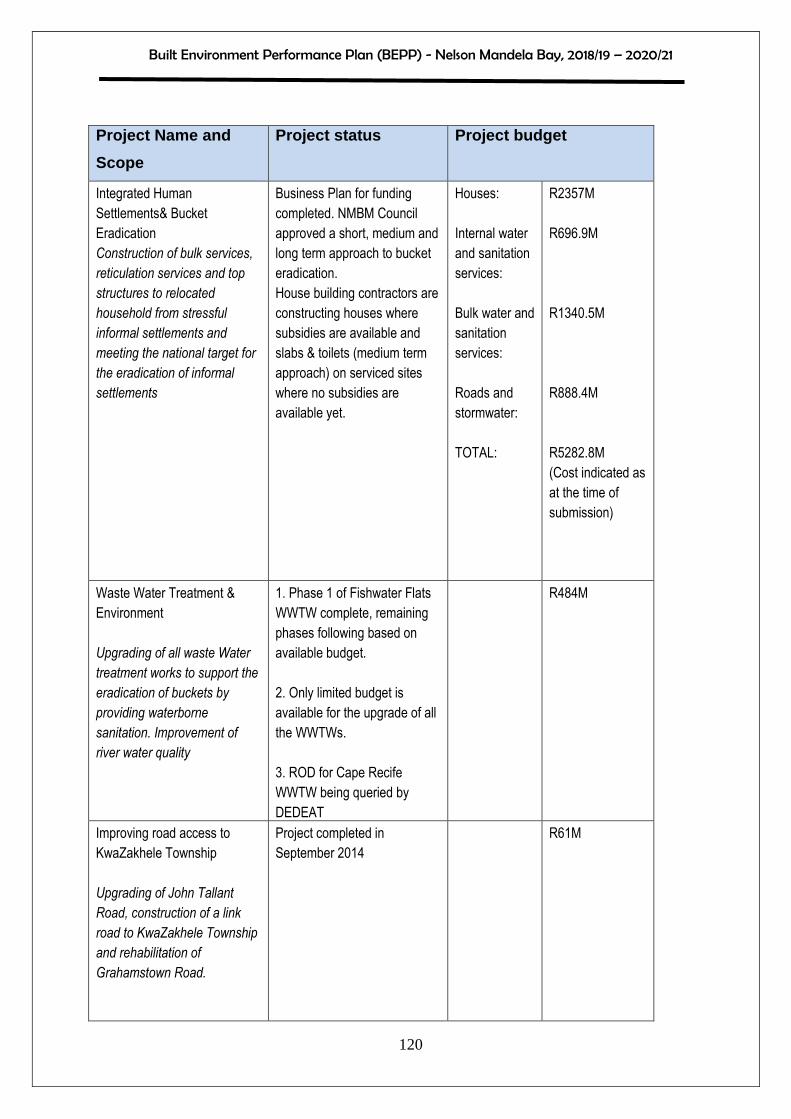
Built Environment Performance Plan (BEPP) - Nelson Mandela Bay, 2018/19 – 2020/21
120
Project Name and
Scope
Project status Project budget
Integrated Human
Settlements& Bucket
Eradication
Construction of bulk services,
reticulation services and top
structures to relocated
household from stressful
informal settlements and
meeting the national target for
the eradication of informal
settlements
Business Plan for funding
completed. NMBM Council
approved a short, medium and
long term approach to bucket
eradication.
House building contractors are
constructing houses where
subsidies are available and
slabs & toilets (medium term
approach) on serviced sites
where no subsidies are
available yet.
Houses:
Internal water
and sanitation
services:
Bulk water and
sanitation
services:
Roads and
stormwater:
TOTAL:
R2357M
R696.9M
R1340.5M
R888.4M
R5282.8M
(Cost indicated as
at the time of
submission)
Waste Water Treatment &
Environment
Upgrading of all waste Water
treatment works to support the
eradication of buckets by
providing waterborne
sanitation. Improvement of
river water quality
1. Phase 1 of Fishwater Flats
WWTW complete, remaining
phases following based on
available budget.
2. Only limited budget is
available for the upgrade of all
the WWTWs.
3. ROD for Cape Recife
WWTW being queried by
DEDEAT
R484M
Improving road access to
KwaZakhele Township
Upgrading of John Tallant
Road, construction of a link
road to KwaZakhele Township
and rehabilitation of
Grahamstown Road.
Project completed in
September 2014
R61M
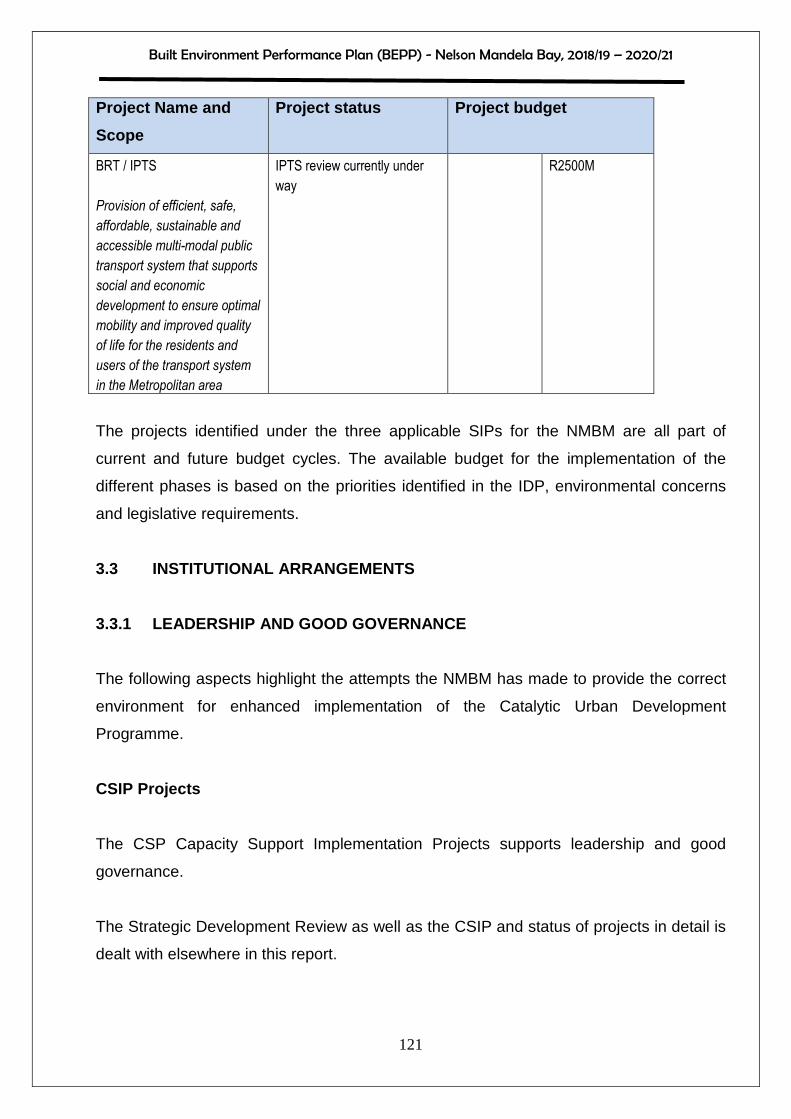
Built Environment Performance Plan (BEPP) - Nelson Mandela Bay, 2018/19 – 2020/21
121
Project Name and
Scope
Project status Project budget
BRT / IPTS
Provision of efficient, safe,
affordable, sustainable and
accessible multi-modal public
transport system that supports
social and economic
development to ensure optimal
mobility and improved quality
of life for the residents and
users of the transport system
in the Metropolitan area
IPTS review currently under
way
R2500M
The projects identified under the three applicable SIPs for the NMBM are all part of
current and future budget cycles. The available budget for the implementation of the
different phases is based on the priorities identified in the IDP, environmental concerns
and legislative requirements.
3.3 INSTITUTIONAL ARRANGEMENTS
3.3.1 LEADERSHIP AND GOOD GOVERNANCE
The following aspects highlight the attempts the NMBM has made to provide the correct
environment for enhanced implementation of the Catalytic Urban Development
Programme.
CSIP Projects
The CSP Capacity Support Implementation Projects supports leadership and good
governance.
The Strategic Development Review as well as the CSIP and status of projects in detail is
dealt with elsewhere in this report.
Built Environment Performance Plan (BEPP) - Nelson Mandela Bay, 2018/19 – 2020/21
122
The following specific leadership and good governance projects form part of the CSIP
and assist in providing the right environment for moving the programmes from planning
to implementation.
Organisational change management support
NMBM faced severe organisational challenges. These included instability, political/
administrative blurring, problems with legal compliance and an extremely poor labour
relations environment. The organisational structure also requires review to align the
institution with its strategic objectives. The support included a review of the
organisational structure; advice on the labour relations environment, and teambuilding
and coaching. This support has been finalised.
Long-term Strategic Planning Support
There is widespread distrust and there are constant challenges to city initiatives due to
inadequate and inappropriate consultation and citizen engagement. In addition, there are
constant protests challenging the institution. The IDP/budget participation processes
have been greatly enhanced since 2017/18 by developing processes through which
citizen trust can be enhanced and with proper participation, lead to a credible and well
understood IDP and budget process. This process is still under way and has led to the
development of the Long-term Growth and Development Plan.
In this regard the NMBM had no substantive development vision and strategy. A mission
and vision forming a core ideology for the City have now been developed and are
contained in the Long-term Growth and Development Plan and all other strategic plans.
Financial planning support
This support seeks to assist in the development of a Long Term Financial Sustainability
Strategy (LTFSS). This is discussed later in this report in more detail. A further aspect to
be addressed is an improvement of the IDP Budget processes and alignment. The
intention is to establish a credible budget planning process within the NMBM that
addresses the key issues proactively and timeously to support a smooth budget process.

Built Environment Performance Plan (BEPP) - Nelson Mandela Bay, 2018/19 – 2020/21
123
Revenue strategy and management support
The current budget preparation processes indicate inappropriate tariff structures,
increasing gross debtors and inadequate revenue system functionality. The initiative
involves the review of current tariff structures, compare them to service delivery costs
and affordability of debtors; and suggest changes which could be more appropriate;
review revenue system functionality and performance and advise on possible
improvements; review and advise on suggested approaches to collecting the debtors
book.
Competitive Cities Programme
A key Catalytic Programme is the Port/ Baakens Valley. Key to progress of this and other
projects however is: a) capacitation of the city departments tasked with leading the
implementation of the project; b) an action plan around engagements with key
stakeholders –Transnet, Portnet and other private sector stakeholders; and c) the start of
implementation of such engagements. The competitive cities partnering can assist with
this process for the main Port/ Baakens programme and others through its support for a
“partnering approach” and based on a partnering initiative with key stakeholders, and
action planned around specific issues.
Land Development Transaction Support for Nelson Man dela Bay (catalytic
projects)
A ULI panel visited the city and produced a report on steps to take to unlock the Baakens
Valley initiative. One of the key recommendations emerging from the panel review was
that the city "prioritise working with the private sector to create new development deals".
This project will provide technical support around structuring the financial deals, with an
additional project providing Partnership Support to complement this.
Built Environment Performance Plan (BEPP) - Nelson Mandela Bay, 2018/19 – 2020/21
124
Catalytic Programme Technical Support
This project supports the NMBM on technical assistance for the catalytic programme.
Meetings have been held to determine what kind technical assistance could be offered to
NMBM on a selected catalytic programme. Three programmes have been discussed
namely:
• Logistics Park Phase 2 (managed by Coega Development Corporation)
• Port Baakens Development Programme-Baakens River Valley sub-programme
• N2 Nodal Development
The technical assistance is to assess the current status quo of the programmes and
determine what is required to move the programmes of the next level towards
implementation.
Mainstreaming Climate Response into City Plans, Bud gets and Grant Conditions
This project is intended to: ensure investments in built environment infrastructure deliver
services within their planned lifespans with the required return on investment; enable
economic growth and service delivery in cities while reducing the consumption of non-
renewable resources; support the growth and expansion of new and existing sectors that
are responding to climate change; and create jobs in these sectors, and through other
adaptation and mitigation efforts. The programme in NMBM has just begun.
Strengthening city integrity, transparency and acco untability
This project is intended to provide the city with the opportunity to conduct self-
assessments of current integrity and accountability mechanisms; improve their
performance through access tools and good practice; support better governance through
smart city solutions; and address key areas of integrity and accountability and
vulnerability in the urban development lifecycle. The project is currently being
implemented and a report of initial findings has been presented to senior management.

Built Environment Performance Plan (BEPP) - Nelson Mandela Bay, 2018/19 – 2020/21
125
Transversal Management Support
The project provides technical assistance to assist NMBM to improve transversal
management systems and practices, with the specific intent to help it to better design
and implement strategic projects for improved spatial targeting and integration.
Knowledge, training, recommendations, and technical assistance will be provided.
3.3.2 Inter-sectoral Municipal Provincial, SOC, Nat ional Consultation
The following initiatives support the NMBM service delivery programme. Continual efforts
are being made for Government Departments and SOC’s to align with the NMBM
development strategy and to ensure investments are optimised around this strategy.
IGR FORUM
The NMBM has held regular IGR forum meetings to which other spheres of government
sector departments are invited to deal with inter-sectoral issues.
The terms of reference for this forum have been re-evaluated in order to ensure that this
forum becomes more strategic in its work. The revised terms of reference are to be
approved by Council in the first quarter of 2018.
NELSON MANDELA BAY STRATEGIC INTERFACE FORUM
A Memorandum of Understanding was signed in 2014 between Transnet SOC Limited,
Transnet National Ports Authority, Coega Development Corporation, Nelson Mandela
Bay Metropolitan Municipality and the Mandela Bay Development Agency to establish
the Nelson Mandela Bay Strategic Interface Forum (NMBM SIF).
The purpose of the MOU is to promote and facilitate collaborative effort between the
parties through engagement on strategic issues of mutual significance. It furthermore
outlines the structures and sub-committees which inter alia included a sub-committee on
Spatial Planning and Development (SPD) issues and a Projects Committee.
This MOU was reviewed in September 2016 by a special sub-committee that
recommended, inter alia, the following amendments to the MOU:

Built Environment Performance Plan (BEPP) - Nelson Mandela Bay, 2018/19 – 2020/21
126
• The inclusion of PRASA; ACSA and NMMU as parties to the MOU.
• Alternating the responsibility of the Chair between the Port Manager and a City
representative.
• A plenary that involves all stakeholders at least twice a year.
The SIF meets every second month. It has challenges of commitment from all parties;
transparency and getting the same representative to the meetings for continuity, but
these are being addressed.
The SPD meets monthly and is well represented by technical officials from all SOC’s and
NMBM Directorates. The SPD has developed a dashboard of 48 projects which is a
combination of the key strategic projects that the different SOC’s are working on. The
dashboard is updated on a quarterly basis. Challenges on projects that cannot be
resolved at SPD level are elevated to the SIF to unblock.
Specific engagement with Government Departments and SOC’s
Since the last 2017/18 BEPP submission where interaction with other spheres of
government and SOC’s had proven difficult, specific attention has been paid to increase
the understanding of stakeholders regarding the NMBM planning and to align investment
within the strategic planning framework of the City.
To a large extent the National Treasury organisation of the attendance of these
stakeholders at the Mid Term reviews and Budget Benchmarking sessions has assisted
in initiating a more collaborative approach.
The following information in relation to some of the interactions is provided.
Engagements with Department of public Works (DPW)
A series of engagements has taken place with the National Department of Public Works.
An introduction to Public Works precinct planning was done to the BEPP Multi Sectoral

Built Environment Performance Plan (BEPP) - Nelson Mandela Bay, 2018/19 – 2020/21
127
Task Team with a simultaneous presentation by NMBM of the Urban Network Strategy
and Catalytic Programmes.
Since then work was done on aligning the asset registers of NMBM and Department of
Public Works and all assets have been verified and are located on the NMBM Corporate
GIS.
DPW wish to agglomerate the provision of their facilities and rationalise their
investments. Key in this is the consideration of population densities, access and amenity.
DPW and NMBM have agreed that in rationalising DPW’s investments in the City priority
areas aligned to the UNS will be selected. Initially the PE CBD and the Uitenhage CBD
have been identified as priorities for investment and rationalised location of facilities
whilst priority precincts within the Integration Zones (such as Njoli and Zanemvula
precincts) have been identified and where there is an absence of facilities these areas
will be prioritised in the future.
Engagement with SANRAL
Engagements with SANRAL – the implementing arm of the Department of Transport
have taken place through a forum established for interaction with SOC’s and others,
including Transnet. The Strategic Interface Forum dealt with in more detail above.
SANRAL, through this forum indicated that from 2009 to 2019 a total investment in
NMBM is as follows:
2009- 2016 2017-2018 2018-2019
R1,34 Billion R1,8 Billion R300 million
Current and future projects include the following:
• Rehabilitation of the R75 Phase 1 between Port Eliz abeth and Despatch
Built Environment Performance Plan (BEPP) - Nelson Mandela Bay, 2018/19 – 2020/21
128
This project commenced in May 2017 and will continue to May 2019.The total cost is
R360 million.
• N2 Interchange improvements
The project will start in May 2019 and endure for 18 months at a cost of R120 million.
• R335 upgrade between Motherwell and Addo
The project will commence in 2018 for 3 to 4 years at a cost of R580 million.
• Colchester Interchange Construction
This project started in October 207 and will continue for 18 months at a cost of R100
million.
Engagements with ACSA
In April 2018 in relation to the IDP, ACSA committed to supporting the alignment of their
investments with NMBM planning. Their focus is not only on economic beneficiation but
also social beneficiation.
There has been a steady increase in passenger volumes to and from Port Elizabeth
Airport over time and volumes are currently at 1,641,393 passenger trips per annum. The
existing airport infrastructure can handle approximately 2 million passengers per annum
which means some investment in enhancing the airport capacity in the near future is
required.
Enhancements currently include extensions to the terminal building, a new passenger
processing facility, an improved concourse and contact stands.

Built Environment Performance Plan (BEPP) - Nelson Mandela Bay, 2018/19 – 2020/21
129
It is envisaged that the planning phase which will be done in conjunction with the NMBM
will take place from 2019 – 20123 and construction is intended from 20124- 20126. Total
investment for the upgrade is estimated to be R1,2 billion.
Various aspects of the proposed upgrades are being worked on in collaboration with the
NMBM and these include land aspects regarding the extension to the runways, the new
fire and rescue facility and the collaboration regarding the area north of Allister Miller
Drive for airport, transport and other purposes that recognise the strategic importance of
the airport.
Engagements with Provincial Treasury
Extremely productive engagements have taken place with the Eastern Cape Provincial
Treasury in relation to the investment of government departments in NMBM and
planning. The Province is implementing the Infrastructure Demand Management System
(IDMS) which is providing good information in a holistic manner to support the system.
It has been agreed that a process be established for ongoing interaction between NMBM
and the Provincial Treasury with a view to NMBM being involved in project preparation in
order that the NMBM priorities can become the provincial investment priorities.
The following plans, produced by the Provincial Treasury, show the extent to which
matching provincial departments investments with the NMBM Urban Network Framework
has taken place.
This process will be refined on an ongoing basis.

Built Environment Performance Plan (BEPP) - Nelson Mandela Bay, 2018/19 – 2020/21
130
Provincial Department Infrastructure Investment in NMBM
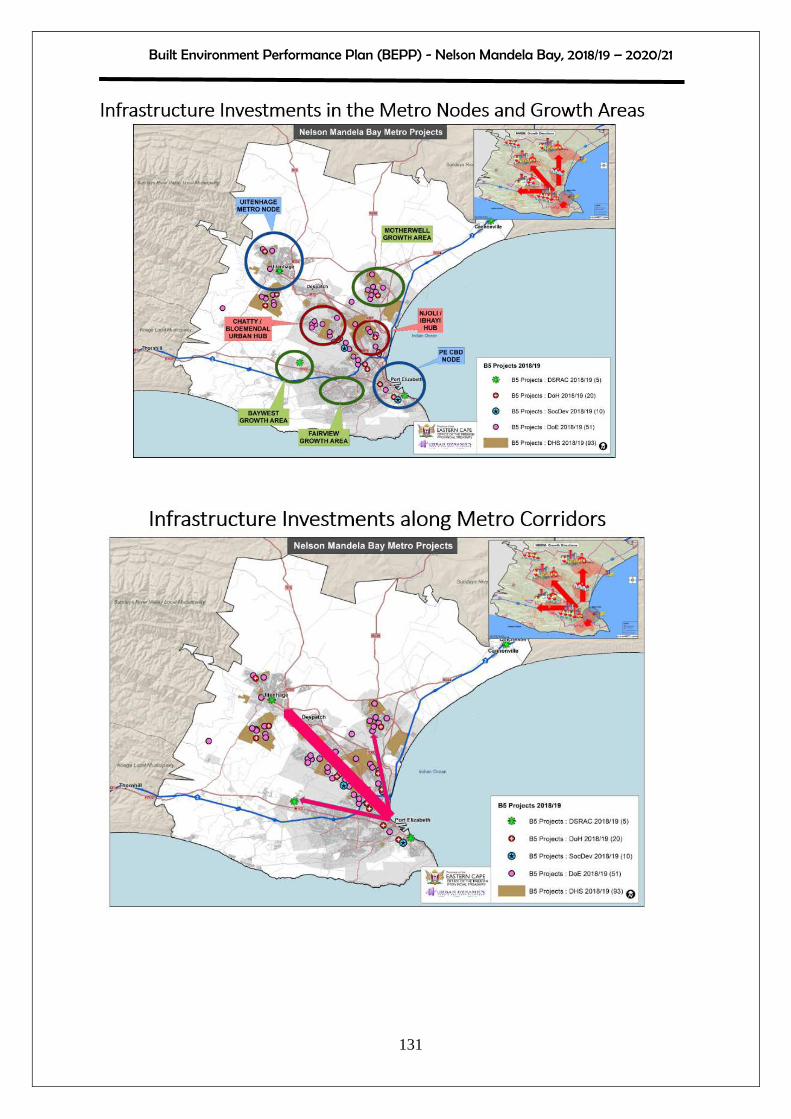
Built Environment Performance Plan (BEPP) - Nelson Mandela Bay, 2018/19 – 2020/21
131

Built Environment Performance Plan (BEPP) - Nelson Mandela Bay, 2018/19 – 2020/21
132
Abbreviations used above are as follows:
• DSRAC- Department of Sport Recreation Arts and Culture
• DOH – Department of Health
• DSD – Department of Social Development
• DOHS- Department of Human Settlements
• DOE- Department of Education
• B5- Provincial Treasury Capital Project number
Engagement with PRASA Passenger Rail Network
In relation to the Catalytic Programme of Motherwell Rail Corridor, collaboration between
the Passenger Rail Agency of South Africa (PRASA) and the Municipality has been
taking place formally since 2011/12 and has culminated in a Draft Memorandum of
Understanding between the parties in relation to the construction of the first phase of a
7,866 km rail service line in Motherwell as part of the Integrated Public Transport
Network.
The collaboration was structured around the establishment of a broader working group
and thematic work streams that held regular meetings to attend to the various elements
and components of the proposed R1,4bn project. These included:
• Land Use and Legal Work Stream – attending to legal (MOU) and land use related
aspects.
• Environmental Work Stream – tending to environmental issues, including the
environmental impact assessment process.
The collaboration also included interaction at senior administrative and political level with
various submissions at Executive Mayoral Committee as well as Council.
It is envisaged that the construction which includes the construction of the 7,8667km rail
line and four stations will commence during 2019/2020, subject to environmental
authorisation and other approvals.

Built Environment Performance Plan (BEPP) - Nelson Mandela Bay, 2018/19 – 2020/21
133
The impact of the proposed rail network on existing public and private property was
intensely investigated and captured in detail in the appendices to the Draft MOU which is
anticipated to be signed before the end of the 2017/18 financial year.
The Motherwell Precinct Plan will incorporate the station and ancillary functional design
elements along the rail corridor.
3.3.3 Risk Mitigation
Each Catalytic Programme is broadly monitored through the use of a reporting template
(example attached as Annexure “H”) and the programme managers are required to
identify possible risks and mitigations related to those risks in the programme
implementation. On a monthly basis the templates are discussed in the BEPP Multi
Sectoral Task Team meetings and transversal ways to take responsibility for risk
mitigation and other mechanisms to address the risks or elevate the risks are discussed.
Including the Catalytic Programmes in performance score cards of responsible managers
also enhances risk mitigation as the performance score cards are required to specifically
identify the risks and the category of risk identified. This is then monitored continually
throughout the financial year.

Built Environment Performance Plan (BEPP) - Nelson Mandela Bay, 2018/19 – 2020/21
134
SECTION D – CATALYTIC URBAN DEVELOPMENT RESOURCING
4. INVESTMENT STRATEGIES, RESOURCING PLAN AND INSTI TUTIONAL
ARRANGEMENTS
4.1 LONG-TERM FINANCIAL SUSTAINABILITY STRATEGY
It is the role of the municipality to provide for growth and development into the future for
all present and future populations in a way that reduces poverty and inequality.
NMBM has been working with the National Treasury City Support Programme to
produces a Long Term Financial Planning Model as a decision making tool in order to
identify projects that satisfy city needs and ensure their financing over the longer term.
The model aims to:
• be a tool to evaluate the Metros borrowing and investment practices and capacity
• understand the financial implications of various projects and financing decisions
• identify and develop infrastructure projects that meet city needs taking into
account spatial demands and infrastructure cost and financing implications
• help to identify issues that need to be addressed when developing a credible long
term financing strategy
Through the development of the LTF Model and LTFSS the city will have more integrated
transversal planning processes across departments and will be able to make more
informed policy choices around the critical budgeting aspects such as rates and tariffs,
cash flow data (receivables and payments) and asset management (repairs and
maintenance and losses).
The ultimate aim is to have a sustainable and integrated infrastructure development
program including the catalytic development programme.
Built Environment Performance Plan (BEPP) - Nelson Mandela Bay, 2018/19 – 2020/21
135
Progress
The NMBM has been engaged in preparing a Long Term Financial Planning Model as a
precursor to the Long Term Financial Planning Strategy since 2016. Work is taking place
with the Municipalities Budget and Treasury Directorate in conjunction with INCA who
provide technical expertise.
Base data is being populated into the modelling framework. Initially it was intended to
use the 2015/16 financial statements to provide the base data however there were
numerous changes to the NMBM Chart of Accounts in order to align it with the new
mSCOA (Municipal Standard Chart of Accounts) requirements as prescribed by National
Treasury.
After consultation with INCA it was agreed that it would be preferable to use the audited
financial statements for 2016/17 to populate the model base data requirements. This
decision has obviously caused a delay in finalising the development of the model but it
will ultimately render more accurate projections going forward.
The current status is that Budget and Treasury Directorate in conjunction with INCA is in
the process of verifying and populating the data that is required to be encapsulated in the
model in order to ensure that the projections and forecasts, when using the model, will be
as accurate as possible.
A number of re-alignments to comply with mSCOA for both revenue and expenditure
categories need to be made.
Once completed, Budget and Treasury Directorate will be in a position to project the
impact of different variables, i.e. percentage changes to rates and tariffs as well as
changes in values, on revenue and expenditure streams and see the impact on the
bottom line (Surplus/Deficit), Cash Flows, etc. for a period of up to 20 years into the
future.

Built Environment Performance Plan (BEPP) - Nelson Mandela Bay, 2018/19 – 2020/21
136
It is intended to have the model data population fully completed prior to the end of the
2017/18 financial year.
4.2 RESOURCING THE PROJECT PIPELINE/SPATIAL BUDGET MIX
4.2.1 CAPITAL FUNDING
The funding of the draft 2018/19 Capital Budget is indicated in the table below. The
NMBM will go to the market to acquire loan funding to complement the 2018/19 Capital
Budget. Council approval has been obtained in terms of the requirements. The loan
funding will specifically be utilised to fund revenue generating infrastructure. In this way
the municipality will be in a position to release some own revenue for the catalytic
programme and other critical projects.
The intended loan of R750 million will be taken up over a four-year period starting with
R148 289 700 in the 2018/19 financial year.
The following table indicates the extent of grant dependency of the NMBM.
TABLE 9: Capital Budget (2018/19) Source of Funds
2018/19 2019/20 2020/21 Total CRR - 901 89 492 500 93 169 553 67 050 000 Total Electricity CRR - 904 61 000 000 86 000 000 86 000 000 Total Levies Replacement Grant Funding - 959 349 304 348 379 889 896 390 249 887 Total Public Contributions Funding - 923 52 000 000 62 000 000 62 000 000 Urban Settlements Development Grant - 951 763 907 896 802 734 887 846 901 939 Total DME Grant Funding - 953 22 302 609 27 826 087 27 826 087 IPTS Grant - 918 180 621 122 169 569 904 178 340 452 Neighbourhood Development Grant - 919 - 17 391 304 4 347 826 Integrated City Development Grant - 916 10 743 478 16 050 435 16 096 522 External Finance Fund - 962 148 289 700 286 369 700 235 942 700 Total Capital Budget Funding 1 677 661 653 1 941 001 766 1 914 755 413
Amounts listed above are VAT exclusive
Source: NMBM Budget and Treasury 2018
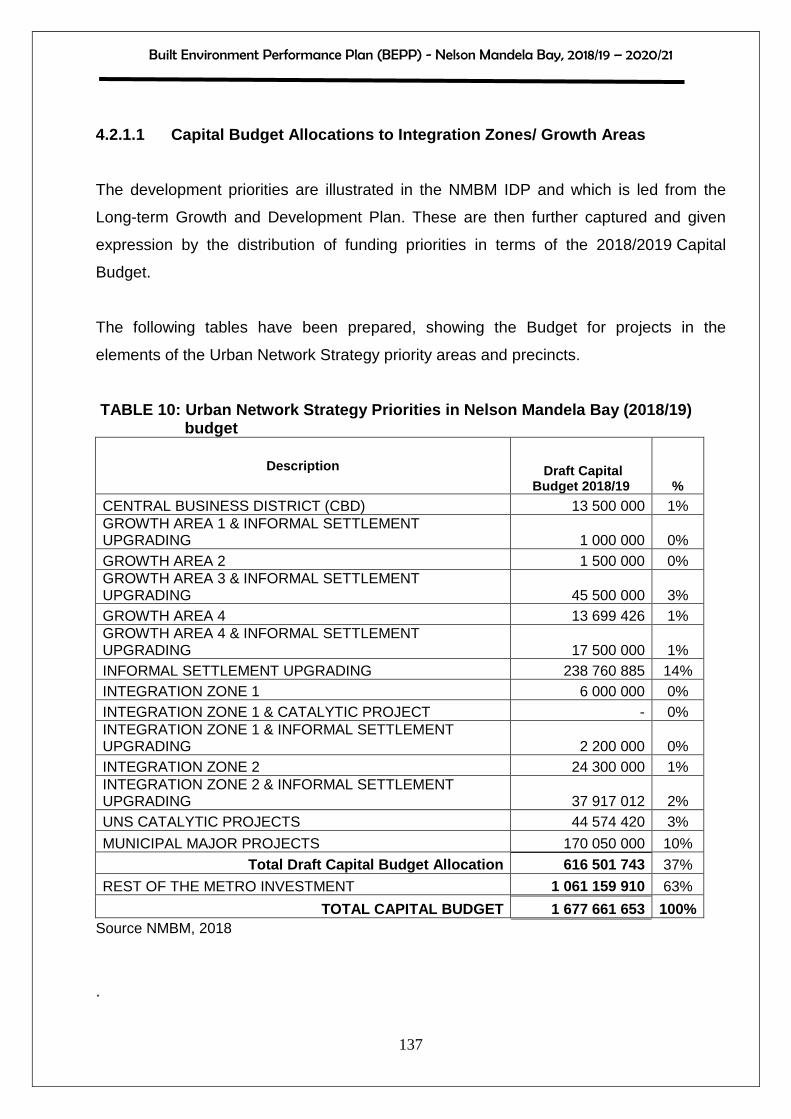
Built Environment Performance Plan (BEPP) - Nelson Mandela Bay, 2018/19 – 2020/21
137
4.2.1.1 Capital Budget Allocations to Integration Z ones/ Growth Areas
The development priorities are illustrated in the NMBM IDP and which is led from the
Long-term Growth and Development Plan. These are then further captured and given
expression by the distribution of funding priorities in terms of the 2018/2019 Capital
Budget.
The following tables have been prepared, showing the Budget for projects in the
elements of the Urban Network Strategy priority areas and precincts.
TABLE 10: Urban Network Strategy Priorities in Nel son Mandela Bay (2018/19) budget
Description Draft Capital Budget 2018/19 %
CENTRAL BUSINESS DISTRICT (CBD) 13 500 000 1% GROWTH AREA 1 & INFORMAL SETTLEMENT UPGRADING 1 000 000 0% GROWTH AREA 2 1 500 000 0% GROWTH AREA 3 & INFORMAL SETTLEMENT UPGRADING 45 500 000 3% GROWTH AREA 4 13 699 426 1% GROWTH AREA 4 & INFORMAL SETTLEMENT UPGRADING 17 500 000 1% INFORMAL SETTLEMENT UPGRADING 238 760 885 14% INTEGRATION ZONE 1 6 000 000 0% INTEGRATION ZONE 1 & CATALYTIC PROJECT - 0% INTEGRATION ZONE 1 & INFORMAL SETTLEMENT UPGRADING 2 200 000 0% INTEGRATION ZONE 2 24 300 000 1% INTEGRATION ZONE 2 & INFORMAL SETTLEMENT UPGRADING 37 917 012 2% UNS CATALYTIC PROJECTS 44 574 420 3%
MUNICIPAL MAJOR PROJECTS 170 050 000 10% Total Draft Capital Budget Allocation 616 501 743 37%
REST OF THE METRO INVESTMENT 1 061 159 910 63%
TOTAL CAPITAL BUDGET 1 677 661 653 100% Source NMBM, 2018
.
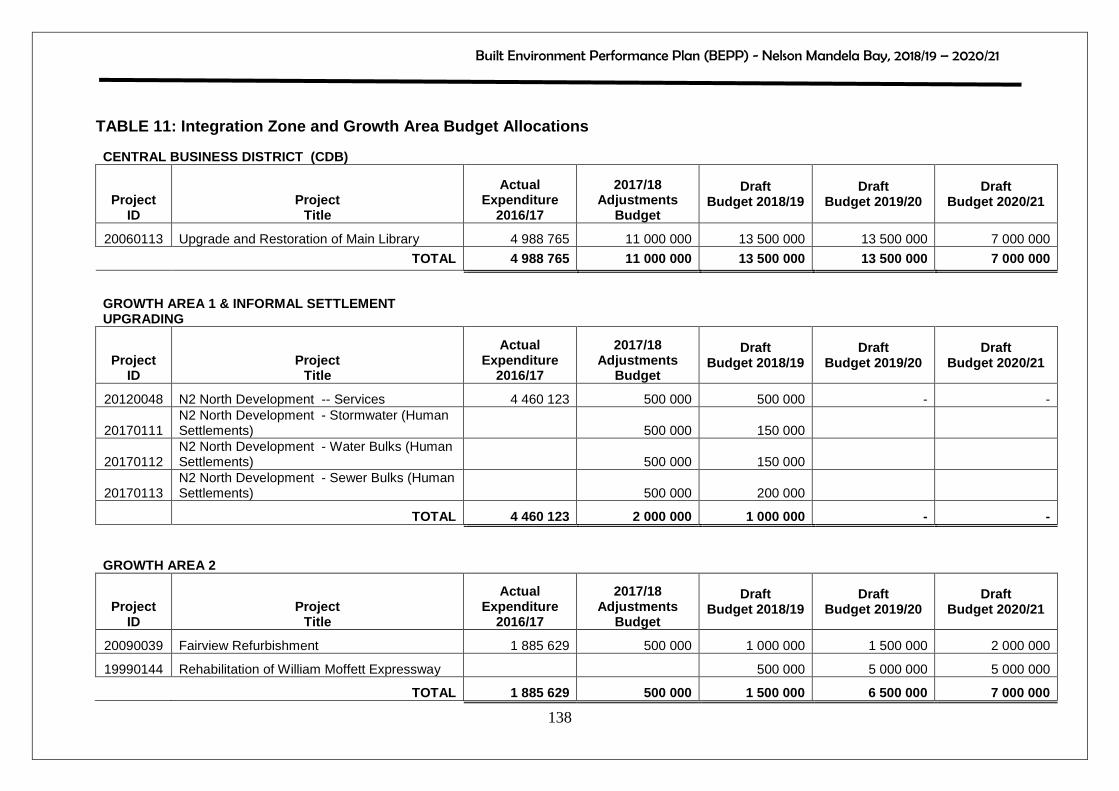
Built Environment Performance Plan (BEPP) - Nelson Mandela Bay, 2018/19 – 2020/21
138
TABLE 11: Integration Zone and Growth Area Budget A llocations
CENTRAL BUSINESS DISTRICT (CDB)
Project ID
Project Title
Actual Expenditure
2016/17
2017/18 Adjustments
Budget
Draft Budget 2018/19
Draft Budget 2019/20
Draft Budget 2020/21
20060113 Upgrade and Restoration of Main Library 4 988 765 11 000 000 13 500 000 13 500 000 7 000 000
TOTAL 4 988 765 11 000 000 13 500 000 13 500 000 7 000 000
GROWTH AREA 1 & INFORMAL SETTLEMENT UPGRADING
Project ID
Project Title
Actual Expenditure
2016/17
2017/18 Adjustments
Budget
Draft Budget 2018/19
Draft Budget 2019/20
Draft Budget 2020/21
20120048 N2 North Development -- Services 4 460 123 500 000 500 000 - -
20170111 N2 North Development - Stormwater (Human Settlements) 500 000 150 000
20170112 N2 North Development - Water Bulks (Human Settlements) 500 000 150 000
20170113 N2 North Development - Sewer Bulks (Human Settlements) 500 000 200 000
TOTAL 4 460 123 2 000 000 1 000 000 - -
GROWTH AREA 2
Project ID
Project Title
Actual Expenditure
2016/17
2017/18 Adjustments
Budget
Draft Budget 2018/19
Draft Budget 2019/20
Draft Budget 2020/21
20090039 Fairview Refurbishment 1 885 629 500 000 1 000 000 1 500 000 2 000 000
19990144 Rehabilitation of William Moffett Expressway 500 000 5 000 000 5 000 000
TOTAL 1 885 629 500 000 1 500 000 6 500 000 7 000 000
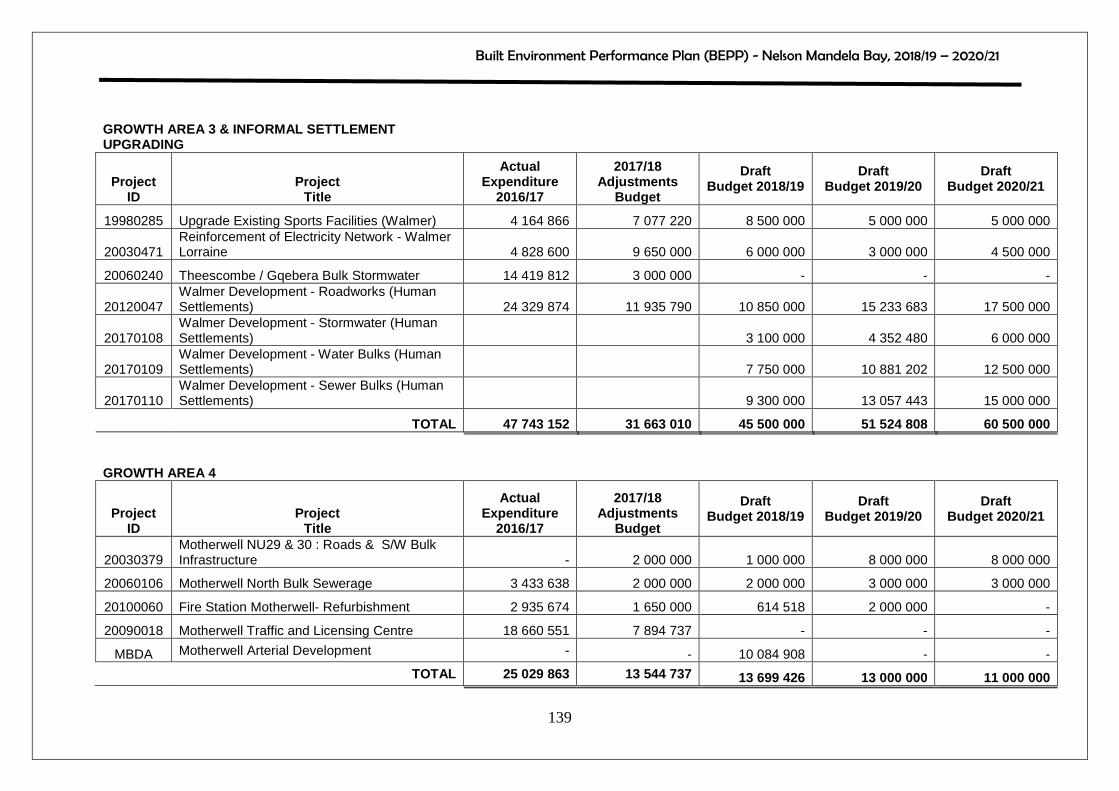
Built Environment Performance Plan (BEPP) - Nelson Mandela Bay, 2018/19 – 2020/21
139
GROWTH AREA 3 & INFORMAL SETTLEMENT UPGRADING
Project ID
Project Title
Actual Expenditure
2016/17
2017/18 Adjustments
Budget
Draft Budget 2018/19
Draft Budget 2019/20
Draft Budget 2020/21
19980285 Upgrade Existing Sports Facilities (Walmer) 4 164 866 7 077 220 8 500 000 5 000 000 5 000 000
20030471 Reinforcement of Electricity Network - Walmer Lorraine 4 828 600 9 650 000 6 000 000 3 000 000 4 500 000
20060240 Theescombe / Gqebera Bulk Stormwater 14 419 812 3 000 000 - - -
20120047 Walmer Development - Roadworks (Human Settlements) 24 329 874 11 935 790 10 850 000 15 233 683 17 500 000
20170108 Walmer Development - Stormwater (Human Settlements) 3 100 000 4 352 480 6 000 000
20170109 Walmer Development - Water Bulks (Human Settlements) 7 750 000 10 881 202 12 500 000
20170110 Walmer Development - Sewer Bulks (Human Settlements) 9 300 000 13 057 443 15 000 000
TOTAL 47 743 152 31 663 010 45 500 000 51 524 808 60 500 000
GROWTH AREA 4
Project ID
Project Title
Actual Expenditure
2016/17
2017/18 Adjustments
Budget
Draft Budget 2018/19
Draft Budget 2019/20
Draft Budget 2020/21
20030379 Motherwell NU29 & 30 : Roads & S/W Bulk Infrastructure - 2 000 000 1 000 000 8 000 000 8 000 000
20060106 Motherwell North Bulk Sewerage 3 433 638 2 000 000 2 000 000 3 000 000 3 000 000
20100060 Fire Station Motherwell- Refurbishment 2 935 674 1 650 000 614 518 2 000 000 -
20090018 Motherwell Traffic and Licensing Centre 18 660 551 7 894 737 - - -
MBDA Motherwell Arterial Development - - 10 084 908 - -
TOTAL 25 029 863 13 544 737 13 699 426 13 000 000 11 000 000
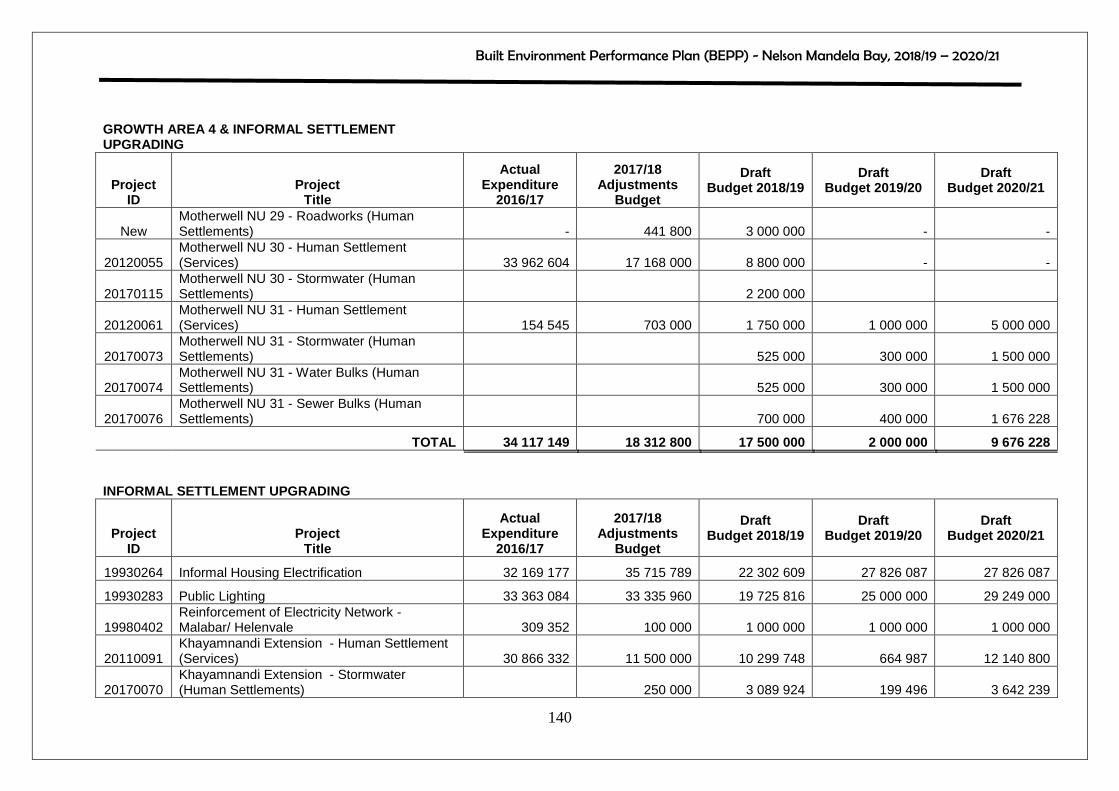
Built Environment Performance Plan (BEPP) - Nelson Mandela Bay, 2018/19 – 2020/21
140
GROWTH AREA 4 & INFORMAL SETTLEMENT UPGRADING
Project ID
Project Title
Actual Expenditure
2016/17
2017/18 Adjustments
Budget
Draft Budget 2018/19
Draft Budget 2019/20
Draft Budget 2020/21
New Motherwell NU 29 - Roadworks (Human Settlements) - 441 800 3 000 000 - -
20120055 Motherwell NU 30 - Human Settlement (Services) 33 962 604 17 168 000 8 800 000 - -
20170115 Motherwell NU 30 - Stormwater (Human Settlements) 2 200 000
20120061 Motherwell NU 31 - Human Settlement (Services) 154 545 703 000 1 750 000 1 000 000 5 000 000
20170073 Motherwell NU 31 - Stormwater (Human Settlements) 525 000 300 000 1 500 000
20170074 Motherwell NU 31 - Water Bulks (Human Settlements) 525 000 300 000 1 500 000
20170076 Motherwell NU 31 - Sewer Bulks (Human Settlements) 700 000 400 000 1 676 228
TOTAL 34 117 149 18 312 800 17 500 000 2 000 000 9 676 228
INFORMAL SETTLEMENT UPGRADING
Project ID
Project Title
Actual Expenditure
2016/17
2017/18 Adjustments
Budget
Draft Budget 2018/19
Draft Budget 2019/20
Draft Budget 2020/21
19930264 Informal Housing Electrification 32 169 177 35 715 789 22 302 609 27 826 087 27 826 087
19930283 Public Lighting 33 363 084 33 335 960 19 725 816 25 000 000 29 249 000
19980402 Reinforcement of Electricity Network - Malabar/ Helenvale 309 352 100 000 1 000 000 1 000 000 1 000 000
20110091 Khayamnandi Extension - Human Settlement (Services) 30 866 332 11 500 000 10 299 748 664 987 12 140 800
20170070 Khayamnandi Extension - Stormwater (Human Settlements) 250 000 3 089 924 199 496 3 642 239

Built Environment Performance Plan (BEPP) - Nelson Mandela Bay, 2018/19 – 2020/21
141
Project ID
Project Title
Actual Expenditure
2016/17
2017/18 Adjustments
Budget
Draft Budget 2018/19
Draft Budget 2019/20
Draft Budget 2020/21
20170069 Khayamnandi Extension - Water Bulks (Human Settlements) 250 000 3 089 924 199 496 3 642 239
20170072 Khayamnandi Extension - Sewer Bulks (Human Settlements) 450 000 4 119 900 265 995 4 856 320
20120030 Kwanobuhle Area 11 - Human Settlement (Services) 18 008 208 17 376 316 17 000 000 16 500 000 1 250 000
20170079 Kwanobuhle Area 11 - Stormwater (Human Settlements) 5 946 000 5 100 000 4 950 000 375 000
20170081 Kwanobuhle Area 11 - Water Bulks (Human Settlements) 4 500 400 5 100 000 4 950 000 375 000
20170083 Kwanobuhle Area 11 - Sewer Bulks (Human Settlements) 4 318 930 6 800 000 6 600 000 550 000
20120043 Seaview Housing Job - Human Settlement (Services) 497 229 50 000 250 000 7 875 000 12 500 000
20170097 Seaview Housing Job - Stormwater (Human Settlements) 50 000 75 000 2 250 000 3 750 000
20170099 Seaview Housing Job - Water Bulks (Human Settlements) 50 000 75 000 5 625 000 3 750 000
20170101 Seaview Housing Job - Sewer Bulks (Human Settlements) 50 000 100 000 6 750 000 5 000 000
20120059 Malabar Ext 6 Phase 2 - Human Settlement (Services) 2 420 766 8 050 000 10 000 000 350 000 -
20170067 Malabar Ext 6 Phase 2 - Stormwater (Human Settlements) 2 000 000 3 000 000 105 000
20170068 Malabar Ext 6 Phase 2 - Water Bulks (Human Settlements) 5 350 000 3 000 000 105 000
20170071 Malabar Ext 6 Phase 2 - Sewer Bulks (Human Settlements) 6 900 000 4 000 000 210 000
20120062 Kuyga Phase 3 - Human Settlement (Services) 175 000 - - 250 000 5 000 000
20170073 Motherwell NU 31 - Stormwater (Human Settlements) 525 000 300 000 1 500 000
20170074 Motherwell NU 31 - Water Bulks (Human Settlements) 142 000 525 000 300 000 1 500 000
20170076 Motherwell NU 31 - Sewer Bulks (Human Settlements) 483 000 700 000 400 000 1 676 228

Built Environment Performance Plan (BEPP) - Nelson Mandela Bay, 2018/19 – 2020/21
142
Project ID
Project Title
Actual Expenditure
2016/17
2017/18 Adjustments
Budget
Draft Budget 2018/19
Draft Budget 2019/20
Draft Budget 2020/21
20130054 Bethelsdorp Ext 32, 34 & 36 - Human Settlement (Services) 127 695 150 000 375 000 16 000 000 5 000 000
20170090 Bethelsdorp Ext 32, 34 & 36 - Stormwater (Human Settlements) 70 000 112 500 5 000 000 1 500 000
20170092 Bethelsdorp Ext 32, 34 & 36 - Water Bulks (Human Settlements) 100 000 112 500 5 000 000 1 500 000
20170094 Bethelsdorp Ext 32, 34 & 36 - Sewer Bulks (Human Settlements) 150 000 150 000 9 000 000 2 000 000
20130057 Kleinskool Kliprand - Human Settlement (Services) 55 050 60 000 250 000 10 000 000 15 000 000
20170095 Kleinskool Kliprand - Stormwater (Human Settlements) 60 000 75 000 3 000 000 4 500 000
20170098 Kleinskool Kliprand - Water Bulks (Human Settlements) 50 000 75 000 3 000 000 4 500 000
20170100 Kleinskool Kliprand - Sewer Bulks (Human Settlements) 50 000 100 000 4 000 000 6 000 000
20080079 Wells Estate - Stormwater Improvements - - - 1 000 000 1 000 000
20050286 Tarring of Gravel Roads 71 196 821 97 000 000 93 532 964 105 000 000 110 000 000
20030167 Rockland PHB Housing Project: Wastewater Treatment Works 1 772 008 - 500 000 500 000 1 000 000
20030405 Witteklip Bulk Sewerage 212 986 100 000 500 000 1 000 000
20030407 Seaview Bulk Sewer - 500 000 500 000 1 000 000
20050247 Rudimentary Services: Sanitation - - 500 000 -
20050248 Bucket Eradication Programme 13 136 031 10 000 000 10 000 000 10 000 000
20110066 Bulk Sewers Joe Slovo, Mandelaville, Allenridge West UIT 4 966 523 13 000 000 15 000 000 20 000 000
20110067 Industrial Site (Airport Valley) - Bulk Sewer - 500 000 500 000
20110068 KwaNobuhle Area 11 - Link Sewer 175 365 - - -
TOTAL 209 451 627 234 558 395 238 760 885 301 176 061 304 082 913

Built Environment Performance Plan (BEPP) - Nelson Mandela Bay, 2018/19 – 2020/21
143
INTEGRATION ZONE 1
Project ID
Project Title
Actual Expenditure
2016/17
2017/18 Adjustments
Budget
Draft Budget 2018/19
Draft Budget 2019/20
Draft Budget 2020/21
20100104 Mendi Bottle Store Renovation 13 907 929 2 500 000 6 000 000 6 000 000 6 000 000
13 907 929 2 500 000 6 000 000 6 000 000 6 000 000
INTEGRATION ZONE 1 & CATALYTIC PROJECT
Project ID
Project Title
Actual Expenditure
2016/17
2017/18 Adjustments
Budget
Draft Budget 2018/19
Draft Budget 2019/20
Draft Budget 2020/21
19990168 Njoli Square Redevelopment 1 134 097 - - 17 391 304 4 347 826
1 134 097 - - 17 391 304 4 347 826
INTEGRATION ZONE 1 & INFORMAL SETTLEMENT UPGRADING
Project ID
Project Title
Actual Expenditure
2016/17
2017/18 Adjustments
Budget
Draft Budget 2018/19
Draft Budget 2019/20
Draft Budget 2020/21
20010118 Reinforcement of Electricity Network - Ibhayi - 200 000 1 700 000 1 600 000 1 600 000
20130040 Nkatha/Seyisi - Human Settlement (Services) - 150 000 250 000 2 660 000 250 000
20170084 Nkatha/Seyisi - Stormwater (Human Settlements) 50 000 75 000 760 000 75 000
20170086 Nkatha/Seyisi - Water Bulks (Human Settlements) 50 000 75 000 1 900 000 75 000
20170088 Nkatha/Seyisi - Sewer Bulks (Human Settlements) 50 000 100 000 2 280 000 100 000
- 500 000 2 200 000 9 200 000 2 100 000

Built Environment Performance Plan (BEPP) - Nelson Mandela Bay, 2018/19 – 2020/21
144
INTEGRATION ZONE 2
Project ID
Project Title
Actual Expenditure
2016/17
2017/18 Adjustments
Budget
Draft Budget 2018/19
Draft Budget 2019/20
Draft Budget 2020/21
20060251 Access Road to Chatty Developments 11 410 526 - - -
20060103 Jagtvlakte Bulk Sewerage 250 000 500 000 1 000 000 3 000 000
20070144 Kwanobuhle WWTW : Upgrading 6 000 000 21 300 000 1 000 000 1 000 000
20080138 Kwanobuhle: Upgrading of sewer reticulation - 500 000 - 500 000
20110068 KwaNobuhle Area 11 - Link Sewer 500 000 - - -
20080048 Jagtvlakte: Bulk Water Supply Pipeline - 2 000 000 1 000 000 1 000 000
20080144 Kwanobuhle: Upgrading of water reticulation - - 500 000 500 000
20120085 Kwanobuhle Reservoir Link Watermain - - 500 000 500 000
- 18 160 526 24 300 000 4 000 000 6 500 000
INTEGRATION ZONE 2 & INFORMAL SETTLEMENT UPGRADING
Project ID
Project Title
Actual Expenditure
2016/17
2017/18 Adjustments
Budget
Draft Budget 2018/19
Draft Budget 2019/20
Draft Budget 2020/21
20120033 Jagvlagte (Chatty 11-14) - Human Settlement (Services) 50 000 000 18 958 506 17 500 000 25 000 000
20170091 Jagvlagte (Chatty 11-14) - Stormwater (Human Settlements) 7 200 000 5 687 552 5 250 000 7 500 000
20170093 Jagvlagte (Chatty 11-14) - Water Bulks (Human Settlements) 7 000 000 5 687 552 5 250 000 7 500 000
20170096 Jagvlagte (Chatty 11-14) - Sewer Bulks (Human Settlements) 8 000 000 7 583 402 7 000 000 10 000 000
72 200 000 37 917 012 35 000 000 50 000 000
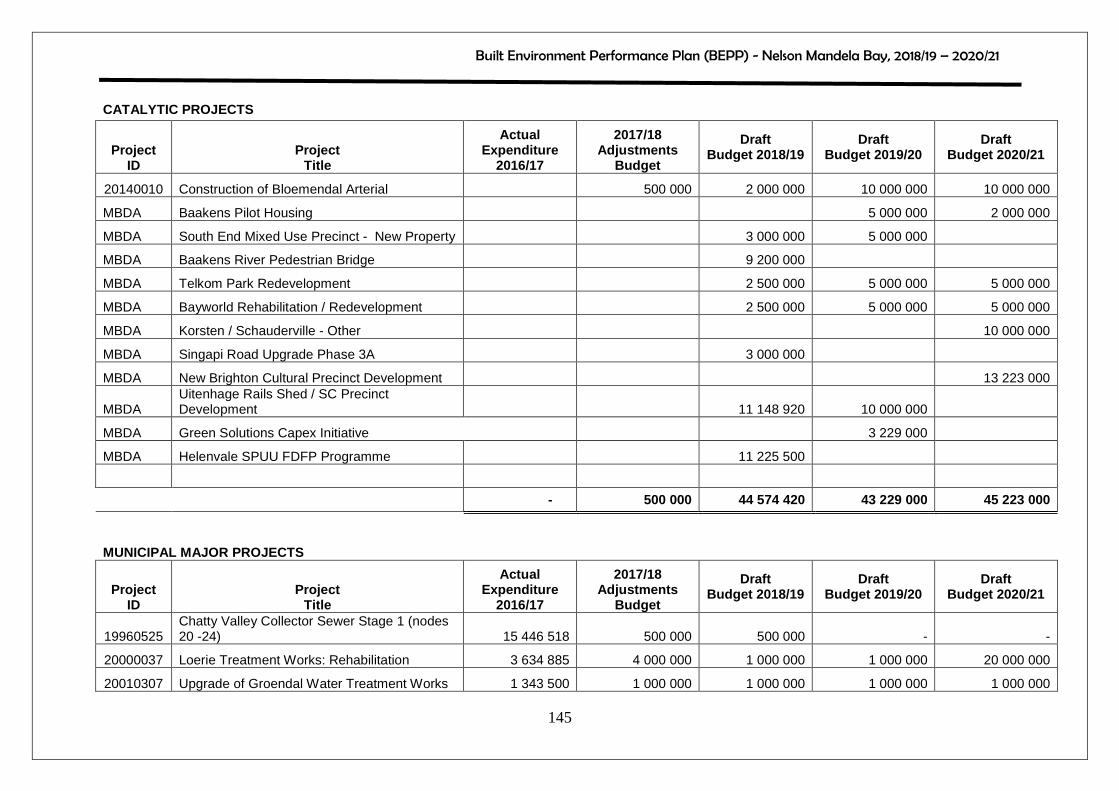
Built Environment Performance Plan (BEPP) - Nelson Mandela Bay, 2018/19 – 2020/21
145
CATALYTIC PROJECTS
Project ID
Project Title
Actual Expenditure
2016/17
2017/18 Adjustments
Budget
Draft Budget 2018/19
Draft Budget 2019/20
Draft Budget 2020/21
20140010 Construction of Bloemendal Arterial 500 000 2 000 000 10 000 000 10 000 000
MBDA Baakens Pilot Housing 5 000 000 2 000 000
MBDA South End Mixed Use Precinct - New Property 3 000 000 5 000 000
MBDA Baakens River Pedestrian Bridge 9 200 000
MBDA Telkom Park Redevelopment 2 500 000 5 000 000 5 000 000
MBDA Bayworld Rehabilitation / Redevelopment 2 500 000 5 000 000 5 000 000
MBDA Korsten / Schauderville - Other 10 000 000
MBDA Singapi Road Upgrade Phase 3A 3 000 000
MBDA New Brighton Cultural Precinct Development 13 223 000
MBDA Uitenhage Rails Shed / SC Precinct Development 11 148 920 10 000 000
MBDA Green Solutions Capex Initiative 3 229 000
MBDA Helenvale SPUU FDFP Programme 11 225 500
- 500 000 44 574 420 43 229 000 45 223 000
MUNICIPAL MAJOR PROJECTS
Project ID
Project Title
Actual Expenditure
2016/17
2017/18 Adjustments
Budget
Draft Budget 2018/19
Draft Budget 2019/20
Draft Budget 2020/21
19960525 Chatty Valley Collector Sewer Stage 1 (nodes 20 -24) 15 446 518 500 000 500 000 - -
20000037 Loerie Treatment Works: Rehabilitation 3 634 885 4 000 000 1 000 000 1 000 000 20 000 000
20010307 Upgrade of Groendal Water Treatment Works 1 343 500 1 000 000 1 000 000 1 000 000 1 000 000

Built Environment Performance Plan (BEPP) - Nelson Mandela Bay, 2018/19 – 2020/21
146
Project ID
Project Title
Actual Expenditure
2016/17
2017/18 Adjustments
Budget
Draft Budget 2018/19
Draft Budget 2019/20
Draft Budget 2020/21
20030030 Lorraine - Bulk Sewerage Augmentation - 150 000 500 000 - 20 000 000
20030034 Markman - Replace 600mm Sewer 417 783 1 000 000 30 000 000 3 000 000 1 000 000
20030295 Construction of Amanzi Reservoir and Pipeline 862 953 1 000 000 2 750 000 5 000 000 5 000 000
20030511 Seaview Bulk Water 1 219 054 600 000 7 000 000 9 000 000 7 000 000
20050064 Augment Collector Sewer for Walmer Heights and Mt Pleasant 1 794 846 3 000 000 1 000 000 1 000 000 500 000
20050097 Nooitgedagt / Coega Low Level Scheme 70 990 844 23 450 000 2 100 000 5 000 000 5 000 000
20050106 Seaview Pump Station: Upgrade 1 392 646 2 800 000 35 000 000 29 000 000 20 000 000
20050250 Driftsands WWTW Phase 3 extension 283 669 2 500 000 500 000 500 000 500 000
20060075 Cape Receife WWTW : Upgrade 2 982 650 1 200 000 2 000 000 25 000 000 25 000 000
20060080 Upgrading of Churchill Water Treatment Works 3 666 177 1 500 000 5 900 000 11 900 000 42 000 000
20060081 Coega Reclaimed Effluent Scheme - 500 000 1 000 000 1 000 000 1 500 000
20060107 Motherwell/Coega WWTW and Outfall Sewer 2 996 846 3 000 000 2 000 000 3 000 000 5 000 000
20060177 Driftsands Collector Sewer - Augmentation 9 490 658 19 000 000 500 000 500 000 1 100 000
20070143 Rehabilitation of Kwazakhele Collector Sewer 684 342 1 500 000 2 000 000 22 700 000 25 000 000
20070144 Kwanobuhle WWTW : Upgrading - 6 000 000 21 300 000 1 000 000 1 000 000
20070147 Kelvin Jones WWTW: Upgrade 46 473 205 2 100 000 5 000 000 60 000 000 45 000 000
20070156 Fishwater Flats WWTW Upgrade 72 942 162 21 050 000 27 500 000 74 500 000 81 800 000
20080048 Jagtvlakte: Bulk Water Supply Pipeline - - 2 000 000 1 000 000 1 000 000
20080080 Cannonville/Colchester: Stormwater improvements 2 460 421 8 500 000 8 500 000 8 500 000 8 500 000
20080138 Kwanobuhle: Upgrading of sewer reticulation - - 500 000 - 500 000
20100034 Balmoral Reservoir and Bulk Pipeline - - - 1 000 000 1 000 000
20110054 Motherwell Main Sewer Upgrade - - 500 000 1 000 000 5 000 000
20110056 Swartkops Low Level Collector Sewer Upgrade 711 409 10 000 000 10 000 000 33 000 000 -

Built Environment Performance Plan (BEPP) - Nelson Mandela Bay, 2018/19 – 2020/21
147
Project ID
Project Title
Actual Expenditure 2016/17
2017/18 Adjustments Budget
Draft Budget 2018/19
Draft Budget 2019/20
Draft Budget 2020/21
20120085 Kwanobuhle Reservoir Link Watermain - - - 500 000 500 000 New Waste Beneficiation and Diversion PPP PPP PPP PPP
New Landfill Gas Extraction and Beneficial Utilisation
PPP PPP PPP PPP
239 794 568 114 350 000 170 050 000 299 100 000 323 900 000
Source: NMBM Budget & Treasury, 2018

Built Environment Performance Plan (BEPP) - Nelson Mandela Bay, 2018/19 – 2020/21
148
4.3 INVESTMENT STRATEGY
4.3.1 Application of Grant Allocations
The application of grant resources is reflected below.
The Nelson Mandela Bay Municipality fully complies with the grant conditions as
stipulated in the Division of Revenue Act. The NMBM is a largely grant dependent
municipality with little discretionary funding from its own sources for capital spending.
The municipality spends the grant in the following service delivery areas:
Formalising informal areas by providing:
• Potable running water to support housing delivery and upgrading of informal
human settlements.
• Water borne sewerage to support housing delivery and upgrading of informal
human settlements.
• Increase water treatment capacity to cater for the additional water demand for
both current and future housing delivery and upgrading of informal human
settlements.
• Increase water network capacity to cater for the additional water demand for both
current and future housing delivery and upgrading of informal human settlements.
• Upgrading and expanding the waste water and wastewater treatment facilities to
handle the additional sewage that needs to be treated as informal settlements are
upgraded and developed.
• Upgrading the pipe network capacity to handle the additional sewerage and waste
water flow as a result of housing delivery and the upgrading of informal
settlements.
• Bucket Eradication programme.
• Tarring of gravel roads and provision of stormwater networks as part of the
upgrading program of informal settlements.
• Upgrading and rehabilitation of existing stormwater network due to densification
and ageing of infrastructure.
• Provision of sidewalks when areas are upgraded and new areas developed to
ensure a safe environment for pedestrians.
• Provision of parks and recreational facilities

Built Environment Performance Plan (BEPP) - Nelson Mandela Bay, 2018/19 – 2020/21
149
The NMBM applies its grant funding (USDG) for the development of infrastructure that
supports the Housing Programme. This has resulted in the installation of water and
sewer pipelines that serve each of the identified human settlements for house
construction. In addition, the funds have also been used for the upgrade and
development of sewer pump stations and water and waste water treatment works.
With this as background, it has also formed the basis of the NMBM adopted approach to
bucket eradication through, inter alia, the establishment of integrated human settlements,
in terms of which communities are relocated from stressful situations to subsidised
houses (HSDG) with waterborne sanitation. The challenge is the misalignment of the
USDG and the HSDG in that the HSDG subsidies are not keeping pace with available
serviced sites. Approximately 8500 sites are ready for development should HSDG money
be received (Table 3). In addition, beneficiary management is a challenge. TABLE 12: Application of Grant Resources – 2018/19 Capital Budget
Urban Settlements Development Grant (USDG) 905,664,000
Tarring of Gravel Roads 83,614,365
Bulk Water and Sanitation Services
549,096,095
Internal Services for Housing Delivery
210,975,468
Public Lighting 10,558,146 Development of Public Open Spaces and Cemeteries
24,249,999
3% operational expenses 27,169,927 Public Transport Infrastructure Grant (PTIG) 205,90 8,079
Public Transport Road Infrastructure
205,908,079
Integrated National Electrification Grant (INEP) 0 Informal Housing Electrification 0 Neighbourhood Development Partnership Grant (NDPG) 0
Precinct Upgrading for Economic Development
0
Integrated City Development Grant (ICDG) 25,648,000
Spatial Planning & creating connectivity
25,648,000
Source: NMBM, 2018

Built Environment Performance Plan (BEPP) - Nelson Mandela Bay, 2018/19 – 2020/21
150
4.3.2 Proposed Urban Settlements Development Plan
In accordance with the requirements of the Division of Revenue Act and the National
Department of Human Settlements, the Urban Settlements Development Grant Plan for
2017/18 is attached as Annexure “M”.
4.4 VALUE OF PROGRAMMES AND PROJECTS BY SECTOR
The consolidated Operating Budget per Directorate is contained in Section 6.3 which
follows. The Capital Budget per Directorate is reflected below.
The following is the value of programmes by Sector:
TABLE 13: Capital Budget by Directorate
Org Code Directorate
Draft 2018/19 Capital Budget
Request
Draft 2019/20 Capital Budget
Request
Draft 2020/21 Capital Budget
Request 1198 Budget & Treasury 9 942 500 20 869 553 3 900 000 1656 Chief Operating Officer 10 743 478 16 050 435 16 096 522 1197 Corporate Services 29 150 000 17 085 000 24 085 000
1196 Economic Development, Tourism and Agriculture 500 000 - -
1194 Sport and Recreation 35 500 000 35 500 000 28 000 000 1191 Human Settlements 203 266 508 203 474 783 228 007 826 1477 Electricity and Energy 254 457 255 340 434 787 290 007 787
384 Roads, Stormwater, Transportation & Fleet 478 854 086 518 721 208 519 448 278
1412 Water Services 265 100 000 331 500 000 343 500 000 1411 Sanitation Services 295 500 000 357 500 000 361 500 000 1193 Public Health 56 347 826 65 766 000 65 766 000 1195 Safety & Security 25 300 000 29 100 000 29 444 000
1474 Motherwell Urban Renewal Programme - - -
1694 NMBM Stadium 13 000 000 5 000 000 5 000 000 1 677 661 653 1 941 001 766 1 914 755 413
Source: NMBM, 2018
Built Environment Performance Plan (BEPP) - Nelson Mandela Bay, 2018/19 – 2020/21
151
4.5 INSTITUTIONAL ARRANGEMENTS
4.5.1 Leadership, Good Governance, Planning and Str ategy-led Budgeting
Relevant information in respect of the progress the NMBM has made with regard to
strategy led budgeting is contained in Section A of this report and is repeated hereunder.
Establishment of a Strategic Planning Steering Comm ittee
The Municipality previously had an IDP and Budget Steering Committee to manage the
annual processes related to IDP and Budget preparation and adoption. In recognition of
the need for greater strategic alignment and the role of the BEPP a Strategic Planning
Steering Committee was established in October 2016 to replace the former IDP and
Budget Steering Committee. This Committee is politically led by the political portfolio
head of Economic Development, Tourism and Agriculture and includes the Mayor’s
Office, City Manager, Chief Financial Officer, Chief Operating Officer as well as portfolio
Councillors and Executive Directors and relevant officials responsible for Budget and
Treasury, Economic Development, Human Settlements, Infrastructure and Engineering,
Electricity and Energy, the City Manager’s Office and Strategic Planning.
The Terms of Reference of this Committee include oversight over:
• Development and promotion of the Municipality’s mission and vision.
• Development and promotion of a Long-term Growth and Development Plan
• Development and review of a five-year IDP.
• Development of a medium-term budget which supports the Built Environment
Performance Plan (BEPP) and IDP, is demonstrably funded, and demonstrably
sustainable, as shown by the long term financial model. Furthermore, its
capital projects should be supported by thorough business cases and
feasibility studies.
• Ensuring alignment of the Long-term Growth and Development Plan, Long-
term Financial Plan, BEPP, IDP and Budget.
• Ensuring stakeholder support for strategic planning processes.

Built Environment Performance Plan (BEPP) - Nelson Mandela Bay, 2018/19 – 2020/21
152
The Committee meets monthly and meetings are preceded by a technical team meeting
where aspects relevant to the preparation, and specifically, the alignment of the strategic
plans and the budget are discussed.
Strategic Planning Time Schedule and Alignment Work shops.
With the replacement of the IDP and Budget Steering Committee by the Strategic
Planning Steering Committee the former IDP and Budget time schedule of activities was
replaced by a Strategic Planning Time Schedule.
This time schedule includes key dates in the programming and alignment of the Long
Term Growth and Development Plan, BEPP, IDP and Budget and is submitted to Council
Structures for approval (in accordance with the legislation applicable to the IDP and
Budget processes). This time schedule includes the dates of the Strategic Planning
Steering Committee meetings and makes further provision for three Strategic Planning
Workshops at critical times in the annual planning and budgeting cycle where major
strategic decisions are taken
In preparation for the 2018/19 MTREF the workshops were facilitated by the National
treasury CSP Economic representative.
From 1 July 2018, in preparation for the 2019/20 MTREF, the Time Schedule will be
expanded upon to include a schedule of activities in relation to the strategic planning for
the entire MTREF period and not just one year. Furthermore, the Time Schedule will be
submitted to Council for approval prior to August 2018 for early preparation for the
financial year programme.
A copy of the 2017/18 Strategic Planning Time Schedule is attached as Annexure “D”.

Built Environment Performance Plan (BEPP) - Nelson Mandela Bay, 2018/19 – 2020/21
153
Capital Prioritisation Model
The City, for the first time, has introduced a Capital Prioritisation Model. The model is
deliberately simple and attempts were made to pilot it in the budgeting process for the
2018/19 Financial year. Full implementation is expected in the 2019/20 budget
preparation. Criteria in relation to the model relate directly to the BEPP, Urban Network
Strategy and the responsibility for catalytic programmes are included in the model and
these projects/programmes will have a higher priority rating for funding.

Built Environment Performance Plan (BEPP) - Nelson Mandela Bay, 2018/19 – 2020/21
154
SECTION E – CATALYTIC URBAN DEVELOPMENT PROGRAMME
RESOURCING/IMPLEMENTATION
5. LAND RELEASE, PROCUREMENT AND REGULATORY REFORM
5.1 LAND ASSEMBLY AND RELEASE STRATEGY
A Draft Nelson Mandela Bay Municipal Land Strategy exists for the assembly and
release of land. It has been developed as an instrument to guide and direct the
processes and procedures required for the strategic and ad hoc (incidental) identification
of land for acquisition and release.
The Draft has yet to be approved by Council and is going through internal processes
however it is also intended that it be updated from time to time to accommodate
legislative and policy directives at National, Provincial and local level, and procedures
and implementation programmes formulated for the overall objective of creating a “One
City, One Future” for Nelson Mandela Bay.
Previously the assembly and release of municipal, State, and privately owned land was
dealt with on an ad hoc, uncoordinated and re-active manner without being guided by
coherent strategies in line with strategic planning principles. This has in the past resulted
in acquisition of undevelopable land parcels due to planning, environmental or
infrastructure challenges.
The Nelson Mandela Bay Municipal Land Strategy for the assembly and release of land
is aimed at establishing a guide to identify Metro’s land requirements to meet its
development obligations and also the release of land to not only provide the needs of the
broader community, but to also act as catalyst for economic and socio-economic
development of the City. This includes land in the priority precincts and catalytic
programmes.

Built Environment Performance Plan (BEPP) - Nelson Mandela Bay, 2018/19 – 2020/21
155
Land assembly covers:
• Methods of acquisition
• Identification of land
• Land assembly processes
• Strategic land identification
Land release involves the process of identifying land parcels for specific or targeted
release; as well as “on demand” (ad hoc / incidental) release and furthermore the
processes and procedures associate with the disposal thereof.
The following aspects of land release are covered:
• Land Identification
• Authorisation for land release
• Method of release
• Conditions of disposal
Strategic Land Release
This category refers to the release of strategically identified and targeted land parcels to
be released for economic and other socio-economic development imperatives such as
catalytic interventions to secure/ facilitate the development of socio-economic facilities
and amenities in various areas, in particular less privileged areas of the metro. This
would necessarily also include making land available to the private sector for key
strategic developments.
Land parcels identified for such purposes are, as in the case of land identified for
strategic land assembly, predetermined in terms of the Metropolitan Spatial Development
Framework (MSDF); a Local Spatial Development Framework (LSDF); a Precinct Plan
and the Built Environment Performance Plan (BEPP).
Built Environment Performance Plan (BEPP) - Nelson Mandela Bay, 2018/19 – 2020/21
156
The release or disposal of land is governed by the Municipal Finance Management Act,
Act 56 of 2003 and the regulations thereto, as amended and furthermore as managed in
terms of the NMBM Policy and Procedures for the disposal of Immovable Assets,
approved by Council on 15 September 2016.
5.2 PROCUREMENT APPROACH FOR CATALYTIC URBAN DEVELO PMENT
PROGRAMMES
Supply Chain Management and Procurement Plan
The Municipality has a Supply Chain Management Policy and System in place. These
comply with legislation and govern all supply chain management processes, including
tender specifications, evaluation and adjudication.
The Municipality also has a Supply Chain and Contract Management Unit to assist
project managers and directorates in procurement processes.
Approximately 45% of any Capital Budget is contractually committed to projects as
procurement of multi-year projects starts in prior financial years. Due to the infrastructure
planning and condition assessment cycles, the procurement plans of some projects only
start the procurement processes late in the financial year.
The electronic SCM system has helped to ensure that all attendance registers, minutes
and items presented to all the Bid Committees are in place. This has significantly
reduced the risk of incomplete files, however, the submitted tenders have been isolated
as the main problem. For these reasons Budget and Treasury are considering removing
the function of filing and record keeping from the SCM unit.
5.3 REGULATORY REFORM PROGRAMME
Incentives are one of the many policy tools used by governments to encourage
investments in a particular area or sector. There are various investment incentives and
other financial and non-financial support for investment offered by government. NMBM

Built Environment Performance Plan (BEPP) - Nelson Mandela Bay, 2018/19 – 2020/21
157
has an approved Investment Incentives Policy which is aligned to these national
incentives and support initiatives.
The NMBM Incentive Policy provides the necessary guiding principles, details on
incentives offered by NMBM, application processes, relevant requirements and approval
procedures, and defines roles and responsibilities to enable a professional, consistent
and transparent incentive management dispensation. The Incentive Policy is specifically
focused to attract additional investments from new and existing investors to Nelson
Mandela Bay in key sectors as identified in the NMBM Economic Growth and
Development Strategy.
The most significant reforms that are taking place are through the Sub National Doing
Business Reform Programme where reforms are being made in the following three
identified areas:
• Dealing with Construction Permits
• Getting Electricity
• Registering property
The 2018 reform Action Plan for the NMBM is attached as Annexure “N”.
Although these regulatory reforms are not site specific, in the context of the economy of
the NMBM and the slow growth scenario these reforms will assist growth and
development in all areas including the priority precincts.
Other aspects of relevance are included in the section on Urban management which
appears later in this report.
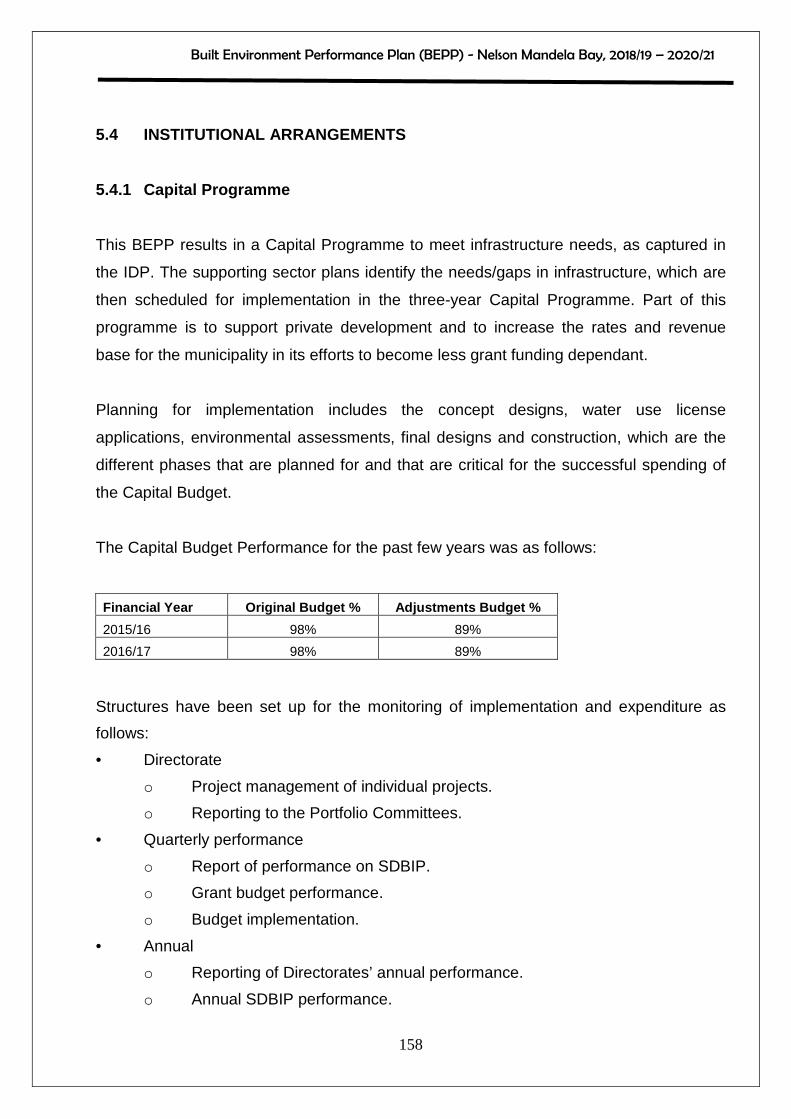
Built Environment Performance Plan (BEPP) - Nelson Mandela Bay, 2018/19 – 2020/21
158
5.4 INSTITUTIONAL ARRANGEMENTS
5.4.1 Capital Programme
This BEPP results in a Capital Programme to meet infrastructure needs, as captured in
the IDP. The supporting sector plans identify the needs/gaps in infrastructure, which are
then scheduled for implementation in the three-year Capital Programme. Part of this
programme is to support private development and to increase the rates and revenue
base for the municipality in its efforts to become less grant funding dependant.
Planning for implementation includes the concept designs, water use license
applications, environmental assessments, final designs and construction, which are the
different phases that are planned for and that are critical for the successful spending of
the Capital Budget.
The Capital Budget Performance for the past few years was as follows:
Financial Year Original Budget % Adjustments Budget % 2015/16 98% 89% 2016/17 98% 89%
Structures have been set up for the monitoring of implementation and expenditure as
follows:
• Directorate
o Project management of individual projects.
o Reporting to the Portfolio Committees.
• Quarterly performance
o Report of performance on SDBIP.
o Grant budget performance.
o Budget implementation.
• Annual
o Reporting of Directorates’ annual performance.
o Annual SDBIP performance.

Built Environment Performance Plan (BEPP) - Nelson Mandela Bay, 2018/19 – 2020/21
159
The above measures assist the successful implementation of the Budget Programmes
and the Annual Report. Although good budget expenditure has consistently been
achieved, concerns have been raised about the “hockey stick” expenditure curve versus
the traditional S-curve. The performance of the municipality is linked to the project cycle
and cash flows of more than 200 individual projects each year on the capital budget. The
Budget and Treasury Directorate has, however, strengthened controls by adding the
requirement of a detailed procurement plan for each project before it will be considered
for entering the Capital Budget. However, within the municipal implementation space,
various other factors impact seriously on the project cycle, such as:
• Ward priorities and ward-based budgets for housing development and tarring of
gravel roads.
• Community objections and protests delaying completion of projects.
• Small, medium and micro enterprise contractors: Demand for work and the
associated work stoppages.
5.4.2 Capacity Support Implementation Plan (CSIP)
During the course of preparation of this BEPP, the Capacity Support Implementation
Plan has been further implemented and added to. The CSIP identifies a number of
programmes of support for the NMBM through the City Support Programme of National
Treasury. As these programmes are further developed, they will influence the critical
sections of the BEPP relating to strategies and programmes, outcomes and outputs and
institutional and financial arrangements.
The following table identifies the Capacity Support Implementation Plan (CSIP) currently
being undertaken through the City Support Programme of National Treasury and the
status of those programmes.
Where relevant, the specific programmes are described in more detail elsewhere in this
report.

Built Environment Performance Plan (BEPP) - Nelson Mandela Bay, 2018/19 – 2020/21
160
Table 14: Capacity Support Implementation Plan 2018 /19
Project Purpose Activities Status
Strengthening City Integrity, transparency and accountability
• To enhance integrity and accountability within the municipality
• Analysis • Action plan developed • monitoring
• Phase 1 report on survey and interview results produced with action areas
Financial planning Infrastructure financing support
• Entrench use of a long-term financial model as basis for city financial strategy
• Assist to finance its infrastructure and catalytic projects
• Long-term financial model built and calibrated
• Assessed status and readiness of proposed capital projects to get financing
• Long-term financial model has yet to be used to develop a financial strategy
• Need to institute a proper project pipeline, where project choices are made and appropriate financing sought
• LTF Strategy to be developed
Revenue strategy & management support
• To assist NMBM to review its tax and tariff structure
• Scoping completed • Ongoing advice
Review of integrated public transport system
Technical expertise to facilitate reaching broad agreement on an appropriate approach to public transport
• Technical analysis and engagements to prove unviability of original plans
• Facilitation to assist in resetting relationship with industry
• Ongoing support
Human settlements support
To develop and support more appropriate approach to housing delivery in the city
• Draft of proposed appropriate approach developed for discussion
• Managing transition to appropriate approach
• Appropriate location of housing projects
• Ongoing
Finance solutions for resilient delivery of water and sanitation service delivery
Examine investment needs for critical service delivery
• Status quo reports • Application feasibility
support
• Ongoing

Built Environment Performance Plan (BEPP) - Nelson Mandela Bay, 2018/19 – 2020/21
161
Project Purpose Activities Status
Support for BEPP annual process
To support NMBM to continue to improve and refine its BEPP
• Repeated iterations to high quality BEPP
• Entrenching spatial planning and the BEPP among senior managers
• Outcome indicators
• Ongoing
Support for catalytic projects – Land development Transaction support
To support catalytic project preparation & implementation
• Repeated iterations to sound choice of catalytic projects
• To ensure that catalytic projects are given adequate attention, priority, capacity and budget
• Move catalytic programmes along the path to implementation
• Ongoing
Sub-national doing business
To improve city regulatory and administrative performance in respect of economic activities
• Process improvement action plans developed for Construction Permits & Getting Electricity and registering property
• Ongoing
City economic partnerships/ Competitive Cities
To establish partnering as a standard approach to city government economic development initiatives.
• determine opportunity or challenge around which partnership programme will take place
• Ongoing
Mainstreaming Climate Response into City Plans , Budgets and Grant Conditions
Ensure investments in infrastructure deliver return on investment as well as enable growth whilst reducing the consumption of non-renewables and ensuring appropriate climate responses
• Desk top evaluation • Evaluation of key
municipal processes • Reporting on changes
• Inception February 2018 – ongoing
Transversal Management support
Technical assistance for better transversal management for better design and implementation of programmes.
• Knowledge • Training • Technical assistance
• Not yet started
Source: NMBM, 2018

Built Environment Performance Plan (BEPP) - Nelson Mandela Bay, 2018/19 – 2020/21
162
The capacity support Implementation Plan is designed to match the needs of the
municipality. Regular engagement between the NMBM and the City Support Programme
at National Treasury has ensured that specific projects suitable to the needs and
circumstances of the city are performed in addition to those applicable to the all metros
through the CSP Programme.

Built Environment Performance Plan (BEPP) - Nelson Mandela Bay, 2018/19 – 2020/21
163
SECTION F – URBAN MANAGEMENT
6. URBAN MANAGEMENT AND INSTITUTIONAL ARRANGEMENTS
6.1 URBAN MANAGEMENT INTERVENTIONS
This BEPP has identified the Integration Zones and Growth Areas and priority precincts
that have been completed with reference to National Treasury where the UNS is
prescribed.
Because the Municipality has not finalised all precinct planning in the Integration Zones,
some area specific urban management initiatives have not yet been identified. This
aspect will receive attention after the precinct planning is complete and once the
organisational structure is finalised. Precinct planning in selected Integration Zones is
expected to be completed in 2018.
The New Brighton and Kwazakhele LSDF (2014-2020) has been approved by NMBM
Council. This LSDF provides broad spatial planning proposals. In terms of this LSDF,
the Municipality is in the process of preparing a precinct plan that stretches from Njoli
Square, through Embizweni Square, Mendi Arts Centre to Red Location. The precinct
plan is in the phase of procuring a service provider. The tender was approved by the
Adjudication Committee during February 2018. The preparation process will take
approximately 6 months. The Consultants will be responsible for Community
Consultation and Stakeholder participation during the preparation of the plan. The final
Precinct Plan will include a precinct management plan and a list of projects with a cost
estimate for each project. This will be presented to National Treasury for discussion of
funding possibilities.
Precinct planning in selected other Integration Zones is expected to be completed in the
course of 2018.
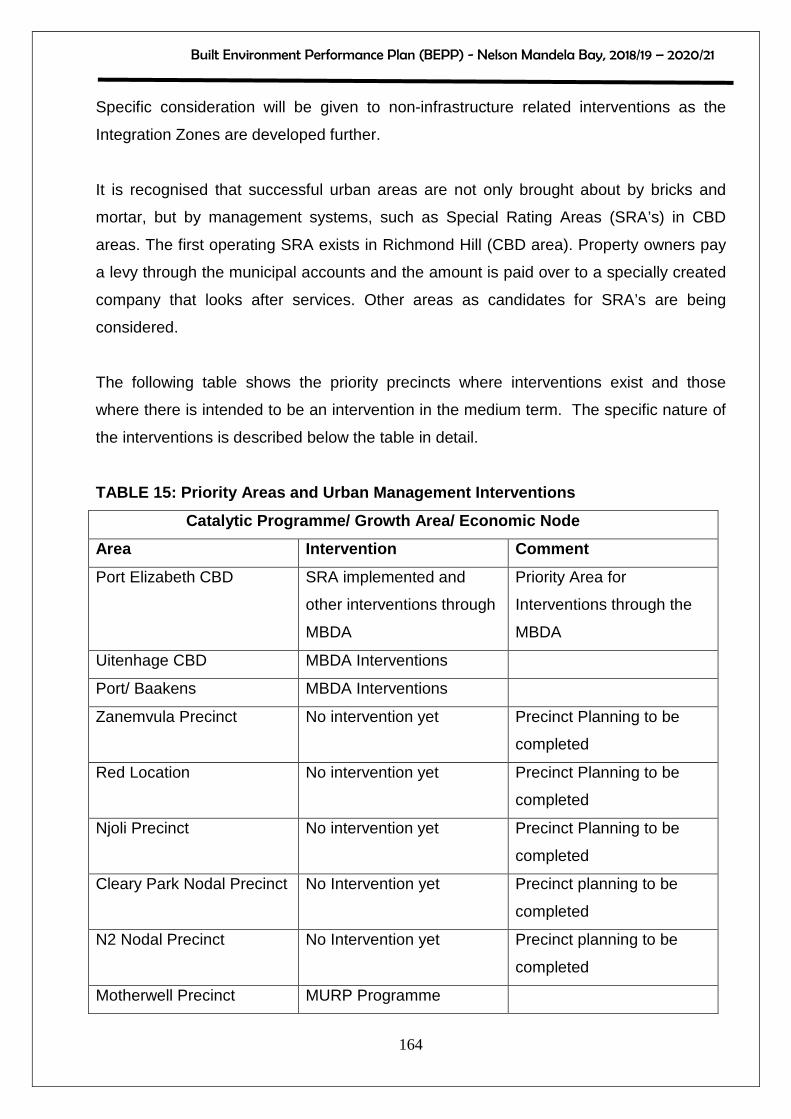
Built Environment Performance Plan (BEPP) - Nelson Mandela Bay, 2018/19 – 2020/21
164
Specific consideration will be given to non-infrastructure related interventions as the
Integration Zones are developed further.
It is recognised that successful urban areas are not only brought about by bricks and
mortar, but by management systems, such as Special Rating Areas (SRA’s) in CBD
areas. The first operating SRA exists in Richmond Hill (CBD area). Property owners pay
a levy through the municipal accounts and the amount is paid over to a specially created
company that looks after services. Other areas as candidates for SRA’s are being
considered.
The following table shows the priority precincts where interventions exist and those
where there is intended to be an intervention in the medium term. The specific nature of
the interventions is described below the table in detail.
TABLE 15: Priority Areas and Urban Management Inter ventions
Catalytic Programme/ Growth Area/ Economic Node
Area Intervention Comment
Port Elizabeth CBD SRA implemented and
other interventions through
MBDA
Priority Area for
Interventions through the
MBDA
Uitenhage CBD MBDA Interventions
Port/ Baakens MBDA Interventions
Zanemvula Precinct No intervention yet Precinct Planning to be
completed
Red Location No intervention yet Precinct Planning to be
completed
Njoli Precinct No intervention yet Precinct Planning to be
completed
Cleary Park Nodal Precinct No Intervention yet Precinct planning to be
completed
N2 Nodal Precinct No Intervention yet Precinct planning to be
completed
Motherwell Precinct MURP Programme
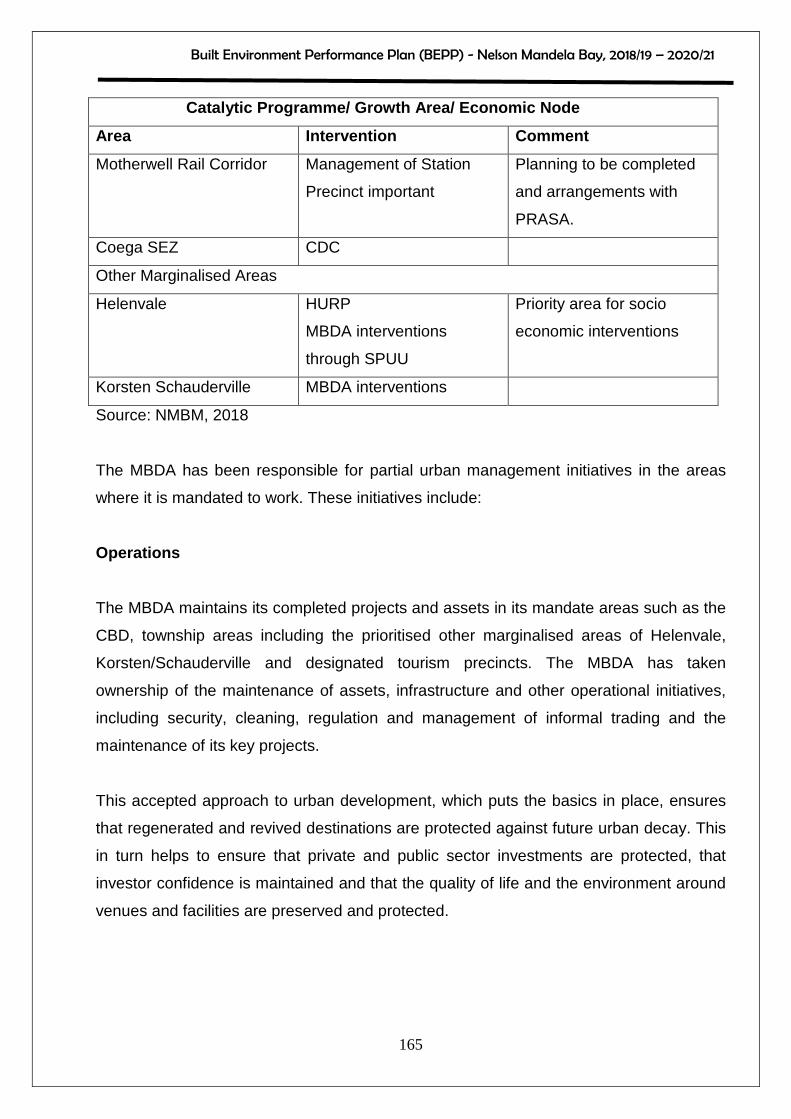
Built Environment Performance Plan (BEPP) - Nelson Mandela Bay, 2018/19 – 2020/21
165
Catalytic Programme/ Growth Area/ Economic Node
Area Intervention Comment
Motherwell Rail Corridor Management of Station
Precinct important
Planning to be completed
and arrangements with
PRASA.
Coega SEZ CDC
Other Marginalised Areas
Helenvale HURP
MBDA interventions
through SPUU
Priority area for socio
economic interventions
Korsten Schauderville MBDA interventions
Source: NMBM, 2018
The MBDA has been responsible for partial urban management initiatives in the areas
where it is mandated to work. These initiatives include:
Operations
The MBDA maintains its completed projects and assets in its mandate areas such as the
CBD, township areas including the prioritised other marginalised areas of Helenvale,
Korsten/Schauderville and designated tourism precincts. The MBDA has taken
ownership of the maintenance of assets, infrastructure and other operational initiatives,
including security, cleaning, regulation and management of informal trading and the
maintenance of its key projects.
This accepted approach to urban development, which puts the basics in place, ensures
that regenerated and revived destinations are protected against future urban decay. This
in turn helps to ensure that private and public sector investments are protected, that
investor confidence is maintained and that the quality of life and the environment around
venues and facilities are preserved and protected.
Built Environment Performance Plan (BEPP) - Nelson Mandela Bay, 2018/19 – 2020/21
166
In the 2016/17 financial year, the MBDA continued to implement programmes which
included:
• security top-up services to those of the municipality in the Port Elizabeth CBD in
the form of a private security company;
• provision of cleansing top-up services to those of the municipality in the CBDs of
Port Elizabeth and Uitenhage;
• regulation and management of informal trading in the CBDs of Port Elizabeth and
Uitenhage;
• general maintenance of all MBDA completed projects both in Port Elizabeth and
Uitenhage CBDs, including plumbing, electricity, masonry, painting and steel work;
• helping communities within MBDA mandated areas, as well as outside, with the
establishment of Special Rating Areas (SRAs);
• introduction of a Mobile Parking Meter Plan encompassing 1329 metres in certain
areas of the Port Elizabeth CBD;
• provision of maintenance, upkeep and security in the Uitenhage Science &
Technology Centre and
• the operationalisation, upkeep, maintenance and security of the revamped
Campanile in the CBD of Port Elizabeth on behalf of the Metro for the financial
year 2017/18.
Security
A major step was taken in creating a safer inner city through the launch of a multimillion-
rand anti-crime programme. Through the MBDA Security Programme, an additional
private sector security support layer was introduced to augment law enforcement
capacity in the CBD and to prevent and reduce crime.
This initiative, which complements work that is already being done by the South African
Police Service (SAPS), NMBM Safety and Security and the Metro Police has the
following overarching goals and is mandated to:
Built Environment Performance Plan (BEPP) - Nelson Mandela Bay, 2018/19 – 2020/21
167
• promote community involvement in response to safety and security matters;
• provide protection to the general public, businesses and properties;
• create a safer environment for the community, residents and business owners;
• monitor and to analyse crime tendencies;
• design and implement strategic measures to reduce crime in the CBD;
• protect tourist attractions in the identified precincts;
• promote safety initiatives in the identified precincts amongst the various
communities;
• monitor and identify illegal traders;
• fulfil tourism ambassadorial roles; and
• participate in blitz raids in conjunction with law enforcement authorities.
The programme introduced 63 trained and accredited security officers for random and
routine foot patrols as well as criminal apprehension and on-site detention (to facilitate
arrests through law-enforcement agents). Five vehicle units were introduced, including
two K9 reaction vehicles for random and routine patrols and rapid response. Eight
trained dogs for criminal apprehension, patrolling, narcotics detection, officer protection,
tracking and on-site detention (to facilitate arrests through law-enforcement agents) were
acquired. Six reaction officers for rapid response, criminal apprehension and on-site
detention and three roving information kiosks were also introduced.
The introduction of the business forum chat group saw Metro Security guards working
even harder than before. This yielded a minimum of two apprehensions per day.
Informal trade regulation
Informal trade is the livelihood of many individuals, households and communities in the
shadow of the formal economy. With this understanding in mind, the NMBM is committed
to creating appropriate spaces where vendors can trade to earn a living.

Built Environment Performance Plan (BEPP) - Nelson Mandela Bay, 2018/19 – 2020/21
168
Through its MBDA work in this area there has been strong and positive endorsement
from establishments such as Nelson Mandela University’s Institute of Law which
highlighted the manner in which the MBDA regulates and manages the informal trading
in the CBD of Port Elizabeth to ensure fairness and transparency.
In a bid to ensure that informal traders tap into economic opportunities, the Uitenhage
CBD Uncedo Taxi Rank was developed and twenty-five trolleys, which will be used to
provide afterhours storage, were procured and branded. These trolleys will be handed
over to informal traders.
Special rating areas
A special rating area (SRA) is an area in which property owners agree to pay a small
additional amount in rates. These funds are then used to provide extra security and
cleansing services. SRAs provide a formal structure, through which owners pay
additional monthly rates for improvements. This allows property values to be maintained
and/or improved and occupants to be safeguarded.
The NMBM through its MBDA has embarked on introducing SRAs in a bid to continue
promoting economic development in areas prone to urban decay such as the other
marginalised areas identified in this BEPP. Based on international best practices, the
Metro’s first SRA was established in Richmond Hill in the 2014/15 financial year.
Richmond Hill is one of the Nelson Mandela Bay Metro’s oldest suburbs close to the Port
Elizabeth CBD, and has seen significant redevelopment over the last five years. Driven
exclusively by private investment, small scale urban renewal has occurred which has
seen the introduction of a number of new businesses into the area – particularly
restaurants – focused in, and around Stanley Street. The introduction of these
restaurants to the area has helped to stimulate the redevelopment of the surrounding
residential area. Local residents have made a number of improvements to their
properties, which has led to a corresponding increase in property values.
Built Environment Performance Plan (BEPP) - Nelson Mandela Bay, 2018/19 – 2020/21
169
Based on empirical observations the SRA is doing well with a visible improvement in
maintenance and improvements to properties, a reduction in crime, and a more aesthetic
setting through litter removal.
This has encouraged the Central community with the help of MBDA to embark on the
process of establishing their own SRA. To date several public participation meetings
have been held and the proposed area boundary has been agreed upon.
Through the commitment of some property/business owners, an interim committee was
elected to drive this process and engage all the relevant municipal/government
authorities to ensure the establishment of their own SRA.
Currently they are busy with the consenting process and have also created their own
website where all their information is posted and where consenting can be done.
Furthermore, the success of the SRA model has resulted in home owners and property
investors in Mount Croix, Walmer Heights and Walmer Links starting applications for
SRAs, with the help of the MBDA.
Tourism ambassadors
Nelson Mandela Bay is endowed with well-known heritage sites, tourist destinations and
various upgraded urban spaces. The NMBM is committed to promoting economic and
tourism development against the backdrop of urban renewal. To this end, the MBDA
sponsored tourism ambassadors who approach and welcome visitors in order to promote
visits to the city’s main and most memorable attractions. The initiative was launched in
the previous financial year and continues.
The initiative is also aligned with the municipality’s objectives of promoting Nelson
Mandela Bay’s heritage, and recognising tourist attractions as important drivers of
economic growth and job creation.

Built Environment Performance Plan (BEPP) - Nelson Mandela Bay, 2018/19 – 2020/21
170
In this regard, MBDA’s tourism ambassadors deal with tourists from a customer service
point of view. They also conduct scheduled cleaning up of sites, while generally providing
security and guidance in terms of information and directions.
The programme also empowers unemployed youth and provides on-the-job skills
development and employment opportunities.
Mobile parking meters
A public consultation and information sharing programme on the planned implementation
of the first Inner City Mobile Parking Meter Programme in designated areas of the inner
city of Port Elizabeth was launched.
In a bid to maximise revenue collection, NMBM noted this project as a way to accrue new
revenue streams and tasked the MBDA with the application process and the vetting of
parties interested in the project.
Platforms to discuss the plan with all stakeholders, whether directly or indirectly affected
were created. Through this process the public and businesses were provided with the
opportunity to register ideas that will strengthen the programme and make it beneficial to
all.
The intention of the Inner City Mobile Parking Meter Programme is to ensure efficient,
effective, fair and equitable use of parking bays. In addition, the public will be provided
with a safe and secure parking environment through the programme which will integrate
illegal car guards in the identified areas.
The benefits of the Inner City Mobile Parking Meter Programme include: visible foot
patrolling and monitoring of the designated parking bays which will help to curb crime;
patrollers/parking attendants will act as guides to visitors; an additional layer of security,
monitoring and reporting of suspected criminal activities; and a safer environment for the
public to shop, work, park, play and visit.
Built Environment Performance Plan (BEPP) - Nelson Mandela Bay, 2018/19 – 2020/21
171
Schauderville/Korsten
This area has been identified as one of the priority “Other Marginalised Precincts”. In line
with its mandate of upgrading areas that have seen some form of environmental decay,
the MBDA, through assistance with funding from the IDC, enabled the preparation of a
master plan for Schauderville and Korsten in September 2015. This is now approved and
will be implemented by the NMBM.
Helenvale - Safety and Peace through Urban Upgradin g (SPUU)
Helenvale, with an estimated population of 21,236 has intertwined problems of crime and
socio-economic deprivation. According to the SPUU feasibility study, the main
manifestations of violence are violent gangs often involved in drug trafficking, domestic
violence, violence in schools and violence among young people.
Many factors contribute to the high levels of violence and crime in Helenvale, including
overcrowding and poor housing conditions, unemployment and low income, inadequate
urban services, widespread alcohol and substance abuse, division of community
structures, increased individualisation and the disintegration of families.
Taking into consideration the contextual realities of Helenvale the SPUU programme is
designed to combine three approaches:
• situational prevention by improvements which reduce the opportunities of crime;
• social prevention by strengthening appropriate community initiatives; and
• institutional prevention by facilitating the cooperation of competent institutions.
The overall goal of the SPUU programme is "to improve the quality of life of the residents
of Helenvale, especially through the reduction of crime and violence."
The programme objective is "to increase the safety of the residents with special regard to
the main component areas, namely the public space and physical infrastructure, safer
schools, youth employment, domestic violence prevention and a pilot housing scheme”.
The programme has five components and related objectives which are summarised in
the table below.

Built Environment Performance Plan (BEPP) - Nelson Mandela Bay, 2018/19 – 2020/21
172
TABLE 16: SPUU Interventions
Component area Objective
Safe public space Violence preventive infrastructure is provided with
participation of the residents. Self-help potentials of the target
group are strengthened.
Safer schools All schools in Helenvale are adequately equipped. Teacher,
parents and students collectively contribute to the reduction of
violence at schools.
Perspectives for
the youth
Employment schemes, training and education programmes,
counselling services as well as recreational activities are
available for the youth in Helenvale.
Domestic violence
prevention
Services and support mechanisms for the fight against
domestic violence are available for the inhabitants of
Helenvale.
Improvement of
living spaces
(housing)
Implement user-driven housing and neighbourhood
improvement programme.
Built Environment Performance Plan (BEPP) - Nelson Mandela Bay, 2018/19 – 2020/21
173
6.2 INSTITUTIONAL ARRANGEMENTS AND OPERATING BUDGET
As stated above, all precincts within the integration zones have not yet been detailed. It
is intended during 2018 to complete precinct planning for Ibhayi, Bethelsdorp and
Motherwell areas which support the Integration Zones. Once this is completed precinct
management entities can be established.
Notwithstanding the above, the Municipality has a number of existing precinct
management entities presently dealing with locality bound urban management.
6.2.1 PRECINCT-BASED MANAGEMENT ENTITIES
There are four precinct-based management initiatives. These are:
- Mandela Bay Development Agency (MBDA)
- Motherwell Urban Renewal Programme (MURP)
- Helenvale Urban Renewal Programme (HURP)
- Coega Development Corporation (CDC)
6.2.1.1 Mandela Bay Development Agency (MBDA)
The Mandela Bay Development Agency (MBDA) is a municipal entity and was
established in 2003 by the Nelson Mandela Bay Municipality (NMBM) with the support of
the Industrial Development Corporation (IDC). It has implemented urban regeneration in
Nelson Mandela Bay's inner city.
In 2017 the NMBM with the MBDA went through a process to re-establish its strategic
direction. This has allowed the Agency and city to map a new course that is intended to
unlock transformation, social inclusivity, economic growth, investment, environmental
justice and shared prosperity for residents, business owners and communities in Nelson
Mandela Bay. This process of reinvention has been important to realign the City’s
development agency taking the City’s Long-term Growth and Development Plan and
several national development mandates and a variety of factors into account.
Built Environment Performance Plan (BEPP) - Nelson Mandela Bay, 2018/19 – 2020/21
174
The Agency’s new vision will focus on creating “an iconic world-class ocean city
showcasing its diversity of people, culture, heritage and environment.” To achieve this
the MBDA sets out a mission “to become a knowledge-based developmental agency that
seeks to achieve social, spatial and economic transformation in Nelson Mandela Bay.”
The Agency has also created a map of strategic objectives or focus areas.
Four strategic marketing areas will define the activity spheres of the MBDA:
• Facility management, which will include running assets developed by the MBDA
such as the Tramways, Campanile and Helenvale Resource Centre or assets such
as the Nelson Mandela Bay Stadium assigned to be operated by the MBDA.
• Area management, which entails security, cleansing and traffic management in
special spatial nodes that have been upgraded or revitalised by the MBDA.
• Socio-economic programmes which focus on uplifting or improving the lives of
communities living on margins of society and in high levels of poverty,
unemployment and crime.
• Research and knowledge creation.
The following projects are being pursued:
• Happy Valley Precinct development/ Telkom Park / Eastern Province Rugby Union
(EPRU) Stadium redevelopment
• Bayworld/Baakens River Precinct Node 1 – Vuyisile Mini Square Upgrade, Upgrade
of Flemming and North Union Street
• Baakens River Precinct Node 1 – Pedestrian Bridge
• Baakens River Node 2 – South End Mixed Use Precinct
• Singhapi Street Environmental Upgrade
• New Brighton Swimming Pool
• Restoration of the Campanile building
• Uitenhage Railway Shed Upgrade Shed 1

Built Environment Performance Plan (BEPP) - Nelson Mandela Bay, 2018/19 – 2020/21
175
Of the above, the Baakens River Precinct, Uitenhage Railway Shed upgrade, Singhapi
Street are closely aligned to catalytic programmes and priority precincts of the BEPP.
The Uitenhage Despatch Development Initiative (UDDI) was collapsed into the MBDA
during 2017 – Activities of the UDDI are now undertaken by the MBDA where relevant.
6.2.1.2 Motherwell Urban Renewal Programme (MURP)
Motherwell is one of eight national pilot areas targeted by the Presidential Programme for
Urban Renewal. The main objectives of this programme are to eradicate crime, poverty
and joblessness in the targeted areas.
Motherwell was primarily developed as a residential area and the necessary
infrastructure for recreational facilities, basic amenities and job creation did not keep
pace with the growth of the area.
The key strategic objectives of the Urban Renewal Strategy are:
• Infrastructure development
• Economic development
• Crime reduction
• Job creation
125 public sector projects have been implemented in Motherwell since the start of the
programme. These equate to R551 666 211 in the fields of local economic development,
human settlements and social development.
The impact of the urban renewal programme is that household income has improved by
16,6% due to an increase in the number of employed household heads. In addition, 92%
of households occupy formal structures compared to only 65% in 2001 and sewerage
connections have increased from 22 714 in 2001 to 37 116 (95%) in 2011.

Built Environment Performance Plan (BEPP) - Nelson Mandela Bay, 2018/19 – 2020/21
176
In addition, piped tap water has increased from 10 077 in 2001 to 30 659 in 2011
(46,7%).
To enhance Motherwell as a Growth Node, the following projects are being planned:
Project Investor/s Time lines
Motherwell Rail Link PRASA – R1.3 billion 2018/19
Film Centre National Film & Video
Foundation
2018/19
The project has been
awarded to NMBM –
Motherwell area.
6.2.1.3 Helenvale Urban Renewal Programme (HURP)
This programme is discussed elsewhere in this report however the following is relevant.
Helenvale was declared an urban renewal area in 2006. National and provincial
investment has resulted in R78 million worth of investment between 2007 and 2012
specifically focused on infrastructure, skills programmes and job creation.
The German Development Bank has invested R50 million, for the Safety and Peace
through Urban Upgrading Programme (SPUU) upgrading project in Helenvale.
The project is now in its third year. A SPUU Master Plan was completed and includes
infrastructure and community projects, such as violence prevention. The SPUU Master
Plan is the result of extensive public participation. Helenvale is one of the most down
trodden townships in the Nelson Mandela Bay with a very high crime rate, unemployment
and social decay. The MBDA has project managed the construction of the Helenvale
Resource Centre at a cost of R38 m and general road upgrades (pavements, lights, etc.)
at a cost of R78 m (all National Treasury funding). The MBDA also operates the
Helenvale Resource Centre.

Built Environment Performance Plan (BEPP) - Nelson Mandela Bay, 2018/19 – 2020/21
177
A Finance Agreement was signed with the German Kfw Bank for 5 million Euros. The
possibility exists for a further funding (5 million Euros) after the completion of the first
phase which ends in early 2018. The first three projects: schools, safe walkways and a
soccer field have commenced. The total amount of these projects financed by Kfw Bank
is R20 million.
6.2.1.4 Coega SEZ and the Coega Development Corpora tion
The Coega Development Corporation (Pty) Ltd (“CDC”) was established in 1999 to
develop and operate the Coega Special Economic Zone (“CSEZ”). The CDC is a
government owned entity which has the operator’s licence for the 11500 hectare (ha)
SEZ area. The SEZ is adjacent to the deep water Port of Ngqura which is managed by
Transnet.
A revised legislative framework was established for the SEZ with the promulgation of the
Special Economic Zones Act 16 of 2014 (Act 16 of 2014) enacted through the SEZ
regulations of 09 February 2016. An SEZ is an economic development tool to promote
national economic growth and export by using support measures in order to attract
targeted foreign and domestic investments and technology. The SEZ is intended to:
• Facilitate the creation of an industrial complex having strategic national economic
advantage for targeted investments and industries in the manufacturing sector
and tradable services;
• Development infrastructure required to support the development of targeted
industrial activities;
• Attracting foreign and domestic direct investment;
• Providing the location for the establishment of targeted investments;
• Enabling the beneficiation of mineral and natural resources;
• Taking advantage of existing industrial and technological capacity, promoting
integration with local industry and increasing value-added production;
• Promoting regional development;

Built Environment Performance Plan (BEPP) - Nelson Mandela Bay, 2018/19 – 2020/21
178
• Creating decent work and other socio economic and social benefits in the region
in which it is located; and
• Generating new and innovative economic activities
The NMBM and the CDC have an agreement in place that outlines the relationship
between the organizations in order to meet the developmental objectives of government.
To date, the CDC has accessed funding from national and provincial government to
construct the necessary infrastructure for support the Coega SEZ (CSEZ). The
infrastructure includes roads and bulk services.
Water and sanitation for the Coega SEZ have been identified as areas of concern by the
NMBM and CDC. The availability of water and sanitation imposes limits to the growth of
the Coega SEZ, having the implication that high water users cannot invest in the SEZ
until utility requirements have been addressed. A Water, Sewer and Return Effluent
Master Plan has been developed for the Coega SEZ.
To date, the NMBM has commenced with planning the following projects, which are
critically required for the further development of the Coega SEZ:
(i) Nooitgedacht Low Level Scheme (NLLS):
Contracts for the commencement of Phase 2 of the Scheme have been awarded
and work is scheduled for completion by February 2017. Funding remains a
constraint to commence with Phase 3 to complete the project.
(ii) Coega Waste Water Treatment Works and Sea Outf all:
Preliminary planning has commenced, but designs cannot proceed, because of
funding constraints, given the size of the project.
(iii) Coega Return Effluent Scheme:
Due to the scale (finance) of the projects, the NMBM is unable to commence with
detailed design. The NMBM has commenced with preliminary planning and as
such an ROD has been issued for the system. With the cooperation of the Coega
Development Corporation (CDC), detailed design has commenced and the Return
Effluent Reservoir with the outlet pipe work at the Coega Kop site is being
constructed with funding from the CDC. Until such time that return effluent from
the Fish Water Flats WWTW becomes available, the reservoir will be utilized for
potable water.
Built Environment Performance Plan (BEPP) - Nelson Mandela Bay, 2018/19 – 2020/21
179
The change introduced by the SEZ legislation of 2014 has impacted on the funding
model for the Coega SEZ bringing both threats and opportunities. Opportunities have
been enhanced by the improved incentive packages which will enable the Coega SEZ to
attract more local and foreign direct investment, but, with the establishment of more
SEZ’s in South Africa, the Coega SEZ will also face increased competition for limited
funding. To become more competitive in increasing the rates base of Coega SEZ
properties, the NMBM would have to consider the introduction of ratings policies and
structures which leverage the available infrastructure at the Coega SEZ and the options
for more competitive SEZ rates structures and incentives.
The CDC Strategic Plan for 2015/16 to 2019/20 has identified strategic goals and
objectives aimed at achieving financial self-sustainability by the end of the five year
planning framework. The strategic objectives are:
• Securing 54 investors valued at R10.28 billion by 2019/20
• Sustaining tenant industries to realise 50 operational investors by 2019/20
• Diversify and grow the CDC income streams to a sum of R2.47 billion by 2019/20
• Realise 61,772 jobs from all spheres of CDC operations by 2019/20
• Train 29,227 people by 2019/20
• Achieve 40% of procurement spend on SMMEs by 2019/20
The capital expenditure of the CDC is determined by investor requirements. Provision is
made for capital expenditure over the Medium Term Expenditure Framework (MTEF),
but, capital expenditure will only materialize once the relevant investor is secured in the
SEZ.
A total capital budget of R6.7 billion is required for projects over the five year planning
framework of the CDC for the development of infrastructure to support economic
development and is detailed within table 15.
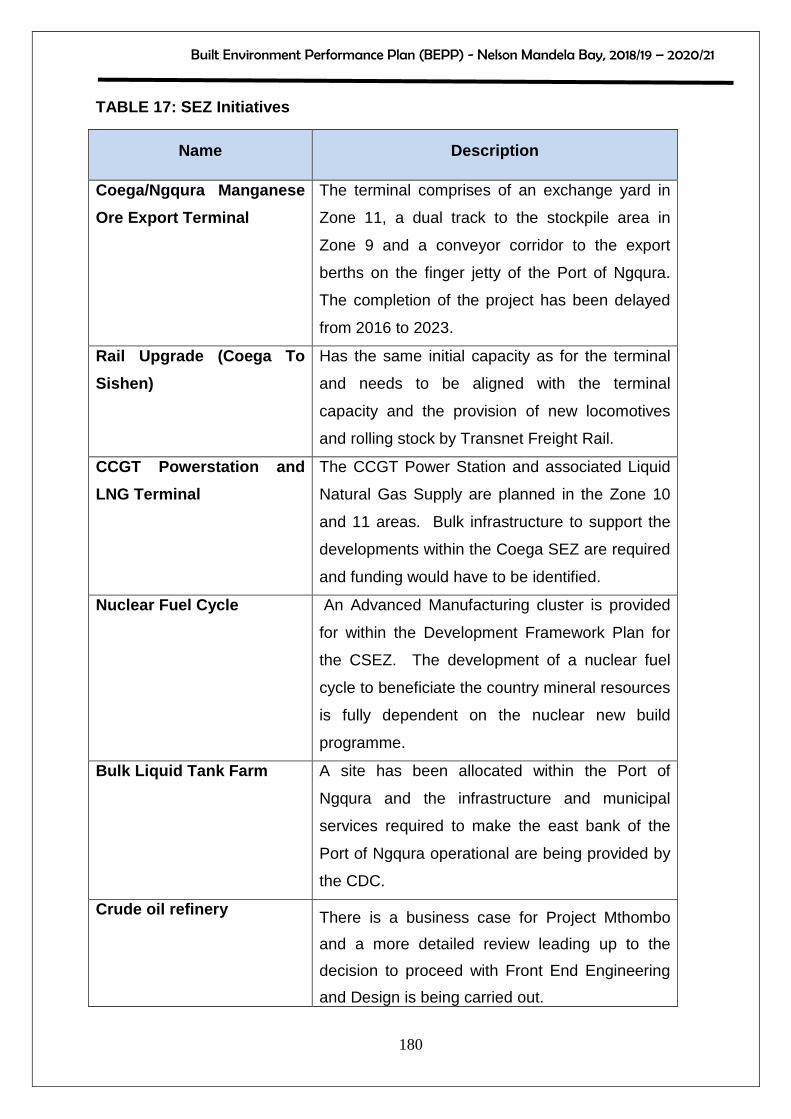
Built Environment Performance Plan (BEPP) - Nelson Mandela Bay, 2018/19 – 2020/21
180
TABLE 17: SEZ Initiatives
Name Description
Coega/Ngqura Manganese
Ore Export Terminal
The terminal comprises of an exchange yard in
Zone 11, a dual track to the stockpile area in
Zone 9 and a conveyor corridor to the export
berths on the finger jetty of the Port of Ngqura.
The completion of the project has been delayed
from 2016 to 2023.
Rail Upgrade (Coega To
Sishen)
Has the same initial capacity as for the terminal
and needs to be aligned with the terminal
capacity and the provision of new locomotives
and rolling stock by Transnet Freight Rail.
CCGT Powerstation and
LNG Terminal
The CCGT Power Station and associated Liquid
Natural Gas Supply are planned in the Zone 10
and 11 areas. Bulk infrastructure to support the
developments within the Coega SEZ are required
and funding would have to be identified.
Nuclear Fuel Cycle An Advanced Manufacturing cluster is provided
for within the Development Framework Plan for
the CSEZ. The development of a nuclear fuel
cycle to beneficiate the country mineral resources
is fully dependent on the nuclear new build
programme.
Bulk Liquid Tank Farm A site has been allocated within the Port of
Ngqura and the infrastructure and municipal
services required to make the east bank of the
Port of Ngqura operational are being provided by
the CDC.
Crude oil refinery There is a business case for Project Mthombo
and a more detailed review leading up to the
decision to proceed with Front End Engineering
and Design is being carried out.

Built Environment Performance Plan (BEPP) - Nelson Mandela Bay, 2018/19 – 2020/21
181
Name Description
Nooitgedacht Low level
Scheme This potable water augmentation scheme for the
NMBM is critical to the CDC for continuing to
attract prospective investors. Fishwater Flats Waste
Water Treatment Works
(FWF WWTW)
FWF WWTW is the main treatment plant for the
NMBM and the Coega SEZ. Currently, the plant
is overloaded and requires upgrading. Return
effluent from the WWTW would be utilised by the
SEZ. Return Effluent is a key enabler for the
future of the Coega SEZ and NMBM. In a water
scarce area, recycling of effluent to provide
industrial process water is an essential
requirement Coega WWTW Project Mthombo and other industrial water use
projects together with the domestic waste water
from Motherwell North developments will
necessitate the development of the planned
Coega WWTW in Zone 9 of the SEZ. Studies to
support the establishment of the Coega WWTW
will continue during 2018/19. Return Effluent Scheme Return Effluent is a key enabler for the future of
the Coega SEZ and NMBM. In a water scarce
area, recycling of effluent to provide industrial
process water is an essential requirement. Maritime Opportunity The CDC has identified the Maritime Industry as
a business opportunity that is untapped and thus
has a potential as a reliable revenue generation
opportunity.
Aquaculture and
Desalination
In 2018, an environmental authorisation was
issued for a Aquaculture Development Zone
within Zone 10 of the CSEZ. The authorisation
includes provision for a 60 Ml per day
desalination facility.

Built Environment Performance Plan (BEPP) - Nelson Mandela Bay, 2018/19 – 2020/21
182
The investment pipeline of the SEZ is focused on distinct sectors as identified within the
NMBM approved Development Framework Plan for the Coega SEZ (2006).
Maritime and Port related logistics is a key focus area for the Coega SEZ. The
development of Zone 1 will continue with the provision of services to the Port laydown
area and sites to investors locating in the area. The Logistics competitiveness of the
area has been enhanced with the establishment of the BAIC automotive investment in
Zone 1 South.
Within the automotive cluster of Zone 2, the CDC is committed to the establishment and
growth of a Multi Original Equipment Manufacturers Complex (Multi OEM) which will
include a supplier park, e-coating plant, paint shop and vehicle distribution centre. The
associated operation of the automotive focused Nelson Mandela Bay Logistics Park in
Uitenhage will continue.
Zone 3 will continue to be developed for general industry, significantly strengthened by
the availability of industrial gases from investments made by Afrox and Air Products. The
zone is home to a fast growing agro processing cluster including dairy products and
beneficiation of such products.
The training cluster in Zone 4 will be the subject of further development, including the
provision of opportunities relating to business process outsourcing, driver training and
learnerships in the built environment.
Zone 5 is serviced and available for the establishment of metallurgical related
investments. The Osho Cement Plant is currently under construction within the Zone
and will be commissioned in 2019.
Master Planning for the area east of the Coega River has been completed and has
focused on ensuring a planning framework with sufficient flexibility to accommodate a
range of development scenarios geared to stimulate agglomerative economies.
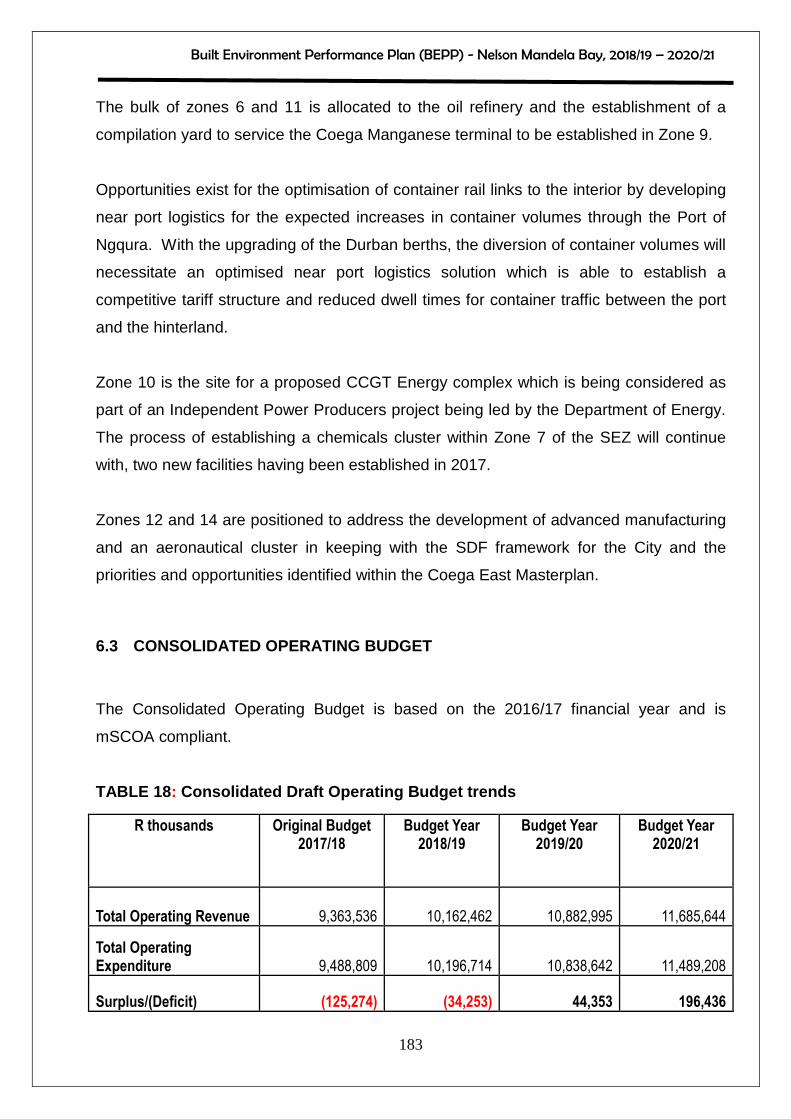
Built Environment Performance Plan (BEPP) - Nelson Mandela Bay, 2018/19 – 2020/21
183
The bulk of zones 6 and 11 is allocated to the oil refinery and the establishment of a
compilation yard to service the Coega Manganese terminal to be established in Zone 9.
Opportunities exist for the optimisation of container rail links to the interior by developing
near port logistics for the expected increases in container volumes through the Port of
Ngqura. With the upgrading of the Durban berths, the diversion of container volumes will
necessitate an optimised near port logistics solution which is able to establish a
competitive tariff structure and reduced dwell times for container traffic between the port
and the hinterland.
Zone 10 is the site for a proposed CCGT Energy complex which is being considered as
part of an Independent Power Producers project being led by the Department of Energy.
The process of establishing a chemicals cluster within Zone 7 of the SEZ will continue
with, two new facilities having been established in 2017.
Zones 12 and 14 are positioned to address the development of advanced manufacturing
and an aeronautical cluster in keeping with the SDF framework for the City and the
priorities and opportunities identified within the Coega East Masterplan.
6.3 CONSOLIDATED OPERATING BUDGET
The Consolidated Operating Budget is based on the 2016/17 financial year and is
mSCOA compliant.
TABLE 18 : Consolidated Draft Operating Budget trends
R thousands Original Budget 2017/18
Budget Year 2018/19
Budget Year 2019/20
Budget Year 2020/21
Total Operating Revenue 9,363,536 10,162,462 10,882,995 11,685,644
Total Operating Expenditure 9,488,809 10,196,714 10,838,642 11,489,208
Surplus/(Deficit) (125,274) (34,253) 44,353 196,436
Built Environment Performance Plan (BEPP) - Nelson Mandela Bay, 2018/19 – 2020/21
184
SECTION G – REPORTING AND EVALUATION
7. BUILT ENVIRONMENT OUTCOME INDICATORS AND TARGETS AND
THEORY OF CHANGE
7.1 BUILT ENVIRONMENT OUTCOME INDICATORS AND TARGET S
The BEPP has been identified as the most appropriate planning instrument through
which the 16 City Transformation Outcome Indicators find expression.
Notwithstanding the challenges experienced with data sources and reporting systems,
Nelson Mandela Bay Municipality established baseline information and projected targets
for all City Transformation Outcome indicators for the remaining term of the IDP.
To facilitate alignment between strategic planning, the BEPP is crafted in such a way as
to align each City Transformation Outcome Indicators to one of the 6 Pillars (Opportunity
City, Safe City, Forward thinking city, Inclusive City, Well run City and Caring City)
contained in the IDP of Nelson Mandela Bay Municipality.
The Municipality furthermore commits to report performance against each of the City
Transformation Outcome Indicators on an annual basis, followed by a review and
realignment of BEPP targets.
Attached as Annexure “L” is the table containing the populated list of City Transformation
Indicators.
7.2 THEORY OF CHANGE
The Theory of Change requires a comprehensive illustration of why desired change
should happen. In order to do this, we have to work back from the long-term goals to
identify the conditions that need to be in place to achieve the outcomes desired. The
following figure is a basic mapping of the theory of change of this BEPP.
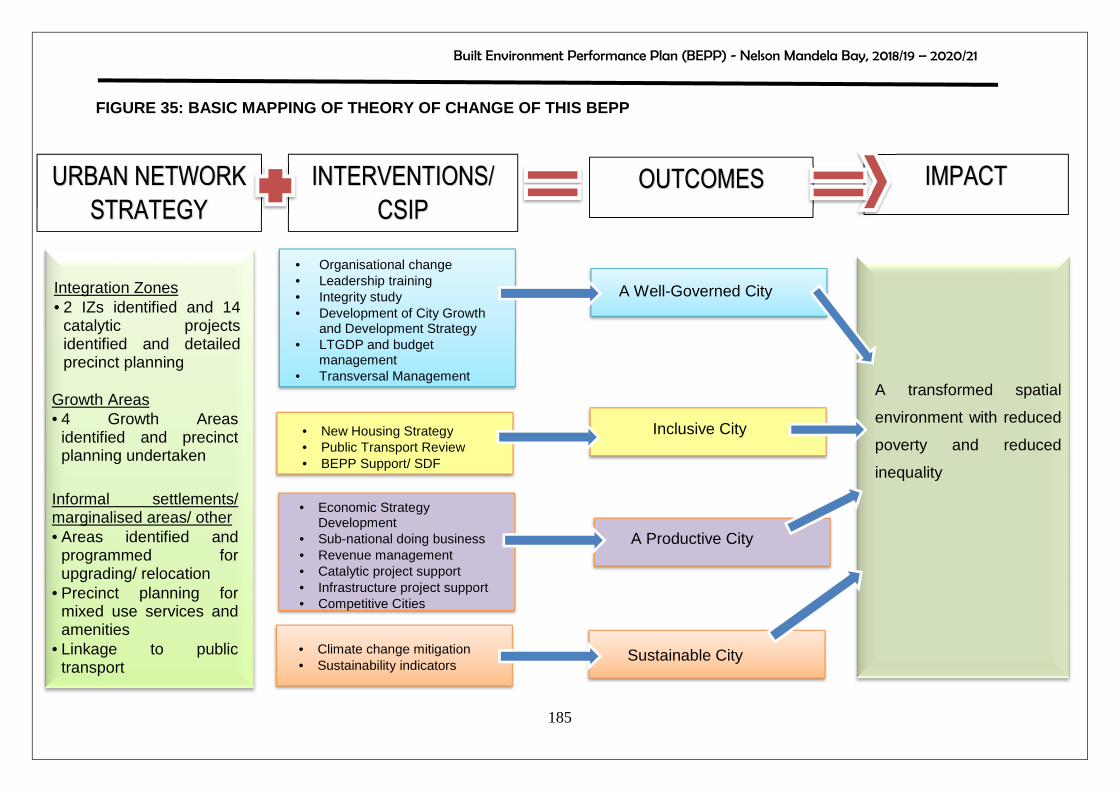
Built Environment Performance Plan (BEPP) - Nelson Mandela Bay, 2018/19 – 2020/21
185
FIGURE 35: BASIC MAPPING OF THEORY OF CHANGE OF THI S BEPP
IMPACT OUTCOMES
Inclusive City
A Productive City
Sustainable City
INTERVENTIONS/
CSIP
• Organisational change • Leadership training • Integrity study • Development of City Growth
and Development Strategy • LTGDP and budget
management • Transversal Management
• New Housing Strategy • Public Transport Review • BEPP Support/ SDF
• Economic Strategy Development
• Sub-national doing business • Revenue management • Catalytic project support • Infrastructure project support • Competitive Cities
• Climate change mitigation • Sustainability indicators
URBAN NETWORK
STRATEGY
A Well-Governed City
A transformed spatial
environment with reduced
poverty and reduced
inequality
Integration Zones • 2 IZs identified and 14
catalytic projects identified and detailed precinct planning
Growth Areas • 4 Growth Areas
identified and precinct planning undertaken
Informal settlements/ marginalised areas/ other • Areas identified and
programmed for upgrading/ relocation
• Precinct planning for mixed use services and amenities
• Linkage to public transport
Built Environment Performance Plan (BEPP) - Nelson Mandela Bay, 2018/19 – 2020/21
186
8. BIBLIOGRAPHY
Department of Water Affairs. (2012). Algoa Water Reconciliation Study. Department of
Water Affairs.
Development Partners. (2007). Demographic Update for the Nelson Mandela Bay Metro.
Port Elizabeth: Nelson Mandela Bay Municipality.
Eastern Cape Development Corporation. (2016) Regional Economic Profile: Nelson
Mandela Bay Metro
Hatch Goba. (2012, Updated 2014). Estimated Cost for the Provision of Social and
Community Infrastructure in Integrated Human Settlements.
National Treasury. (2016). Cities Support Programme: BEPP Guidance Note for 2017/18
– 2019/20.
National Treasury. Guidance Note: Framework for the formulation of Built Environment
Plans (BEPP) and Supplementary Guidance Note for the Built Environment
Performance Plans (BEPP) 2018/19-2020/21.
Nelson Mandela Bay Industrial Development Strategy 2012. A report by: Development
Partners, Dojon, Rand International Capital, Jupilog, Siyathetha Communications.
NMBM – Long Term Growth and Development Plan (2018).
NMBM. (2009). Metropolitan Spatial Development Framework. Port Elizabeth: Nelson
Mandela Bay Municipality.
NMBM CorpGIS. (2010). Unpublished Report: Access to Facilities in terms of SCU
Planning Methodology. Nelson Mandela Bay Municipality.
NMBM Infrastructure & Engineering: Water & Sanitation. (2009). Business Plan for Water
and Sanitation Services for the Coega SEZ. Port Elizabeth: NMBM.
NMBM Infrastructure & Engineering (Water & Sanitation). (2011). Draft Water Master
Plan for Nelson Mandela Bay. NMBM.
NMBM Land Planning & Management Sub-Directorate. (2007). Sustainable Community
Planning Guide. Port Elizabeth: Nelson Mandela Bay Municipality.
NMBM Budget & Treasury. (2017). NMBM Draft Capital Budget 2017/18. Port Elizabeth:
Nelson Mandela Bay Municipality.

Built Environment Performance Plan (BEPP) - Nelson Mandela Bay, 2018/19 – 2020/21
187
NMBM EDRS. (2009). Draft Economic Development Strategy for Nelson Mandela Bay.
Port Elizabeth: Nelson Mandela Bay Municipality.
NMBM Human Settlements Directorate. (2012). Human Settlement Strategic Framework
2030. NMBM.
NMBM IDP Office. (2016, June 7). NMBM Integrated Development Plan. NMBM
Integrated Development Plan, 15th Edition (2016/17 Financial Year). Port
Elizabeth: Nelson Mandela Bay Municipality.
NMBM Infrastructure & Engineering Directorate. (2006). Water Master Plan for Nelson
Mandela Bay. Water Master Plan for Nelson Mandela Bay. Port Elizabeth, Eastern
Cape, South Africa: Nelson Mandela Bay Municipality.
NMBM Infrastructure & Engineering Directorate. (2016). Infrastructure Maintenance
Backlog Assessment. Port Elizabeth: Nelson Mandela Bay Municipality.
NMBM Infrastructure & Engineering Directorate. (2012). Nelson Mandela Bay Sanitation
Master Plan. Port Elizabeth: Nelson Mandela Bay Municpality.
NMBM Office of the COO. (2016). Built Environment Performance Plan: 2016/17 USDG
Submission. Port Elizabeth: Nelson Mandela Bay Municipality.
Shisaka Development Management Services. (2012). Proposed High-level Housing
Strategy for the Nelson Mandela Bay Municipality. Port Elizabeth: Nelson Mandela
Bay Municipality.
Shisaka Development Management Services. (2017). Proposed High-level Housing
Strategy for the Sustainable Provision of Housing in Nelson Mandela Bay
Municipality. Port Elizabeth: Nelson Mandela Bay Municipality.
SSI Consultants. (March 2011). NMBM Comprehensive Integrated Transport Plan
2011/12. Port Elizabeth: Nelson Mandela Bay Municipality.
SSI Engineers & Environmental Consultants. (March 2011). NMBM Comprehensive
Integated Transport Plan 2011/12. Port Elizabeth: Nelson Mandela Bay
Municipality.
Stats SA. (2001). Census 2001. Pretoria: Statistics South Africa.
Stats SA. (2011). Census 2011. Pretoria: Statistics South Africa.


