107
Audited Annual Report as of December 31, 2015 CGS FMS Société d’Investissement à Capital Variable R.C.S. Luxembourg B 157.442 Administrative Agent:
Audited Annual Reportas of December 31, 2015
CGS FMS
Société d’Investissement à Capital Variable
R.C.S. LuxembourgB 157.442
Administrative Agent:
CGS FMS
l CGS FMS Global Evolution Emerging Frontier
Paying and information agent for Germany:
Marcard, Stein & Co AG
Ballindamm 36
20095 Hamburg
has been appointed as paying and information agent in the Federal Republic of Germany (the ’’German Paying and Information Agent’’).
The conversion prices correspond to the redemption and subscription prices or the Net Asset Value per share. Requests for redemption and conversion may be submitted to the German Paying and Information Agent. All payments (redemption
proceeds, any distributions and other payments) may be paid by the German Paying- and Information Agent to the Shareholders. Any notices to shareholders shall be published in the Bundesanzeiger.
The statement of changes in the composition of the investment portfolio is also available free of charge upon request at the office of the German Paying and Information Agent.
For the following sub-fund no notification for distribution in the Federal Republic of Germany was submitted and Shares in this sub-fund may NOT be offered to investors within the scope of the German Investment Code. As a
consequence, the following Sub-Funds are NOT available to investors in Germany:
Additional Information for Investors in the Federal Republic of Germany
The Articles of Incorporation, the Prospectus and Key Investor Information Document, semi-annual and annual reports, the subscription and redemption prices are available free of charge from the Management Company and the German Paying
and Information Agent during usual business hours. In addition, this information is available electronically at the Management Company’s website on http://www.universal-investment.lu.
The current Net Asset Value per share, subscription and redemption prices of all share classes are available free of charge at the German Paying and Information Agent. Additionally these prices (Net Asset Value per Share, Subscription, and
Redemption) of all share classes are published and visible at www.universal-investement.lu.
An investor is allowed to convert shares from one Share Class into another Share Class (please refer to the prospectus for more information); the conversion price(s) correspond to the redemption and subscription prices or the Net Asset Value
per share. Requests for redemption and conversion may be submitted to the German Paying and Information Agent.
1
CGS FMS
�
�
�
�
�
Paying and Information Agent for the shares of the SICAV authorized for public distribution in Austria:
ERSTE BANK der oesterreichischen Sparkassen AG
Am Belvedere 1
1010 Wien, Austria.
-
-
-
-
-
Additional Information for Investors in Austria
The following documents and information may be obtained in hard copy and free of charge at the registered office of the Management Company (Universal-Investment-Luxembourg S.A.) and at the Austrian Paying and Information Agent andcan be inspected at the offices of the Austrian Paying agent during normal business hours:
The following Sub-Funds are available to investors in Austria:
Applications for the redemption, subscriptions and conversion of shares may be sent to the Austrian Paying Agent. All payments to investors, including redemption proceeds, potential distributions and other payments, may, upon request, bepaid through the Austrian Paying and Information Agent.
The prospectus and the articles of incorporation;
Key Investor Information Documents (KIIDs);
The annual report and semi-annual report;
Redemption or Subscription prices;
Any investor notices.
CGS FMS - Global Evolution EM Blended Debt
CGS FMS - Global Evolution EM Debt
CGS FMS - Global Evolution EM Debt and FX
CGS FMS - Global Evolution EM Local Debt
CGS FMS - Global Evolution Frontier Markets
3
CGS FMS
Table of Contents
Independent auditor’s report 6
Organisation 7
Report of the Board of Directors 8 - 9
Report of the Asset Manager 10 - 27
CGS FMS - SICAV
Combined Statement of Net Assets 28
Combined Statement of Operations (including income equalisation) 29 - 30
Combined Statement of Changes in Net Assets 31
Changes in the number of shares outstanding 32 - 37
Statistical Information 32 - 37
CGS FMS - Global Evolution Frontier Markets
Fund Structure 38
Statement of Securities 39 - 42
Statement of Forward Transactions 43 - 46
Statement of Bank balances, Other Assets and Liabilities 47
Statement of Operations (including income equalisation) 48 - 49
Statement of Changes in Net Assets 50
CGS FMS - Global Evolution EM Debt
Fund Structure 51
Statement of Securities 52 - 54
Statement of Forward Transactions 55
Statement of Bank balances, Other Assets and Liabilities 56
Statement of Operations (including income equalisation) 57 - 58
Statement of Changes in Net Assets 59
CGS FMS - Global Evolution EM Local Debt
Fund Structure 60
Statement of Securities 61 - 62
Statement of Forward Transactions 63
Statement of Bank balances, Other Assets and Liabilities 64 - 65
Statement of Operations (including income equalisation) 66- 67
Statement of Changes in Net Assets 68
4
CGS FMS
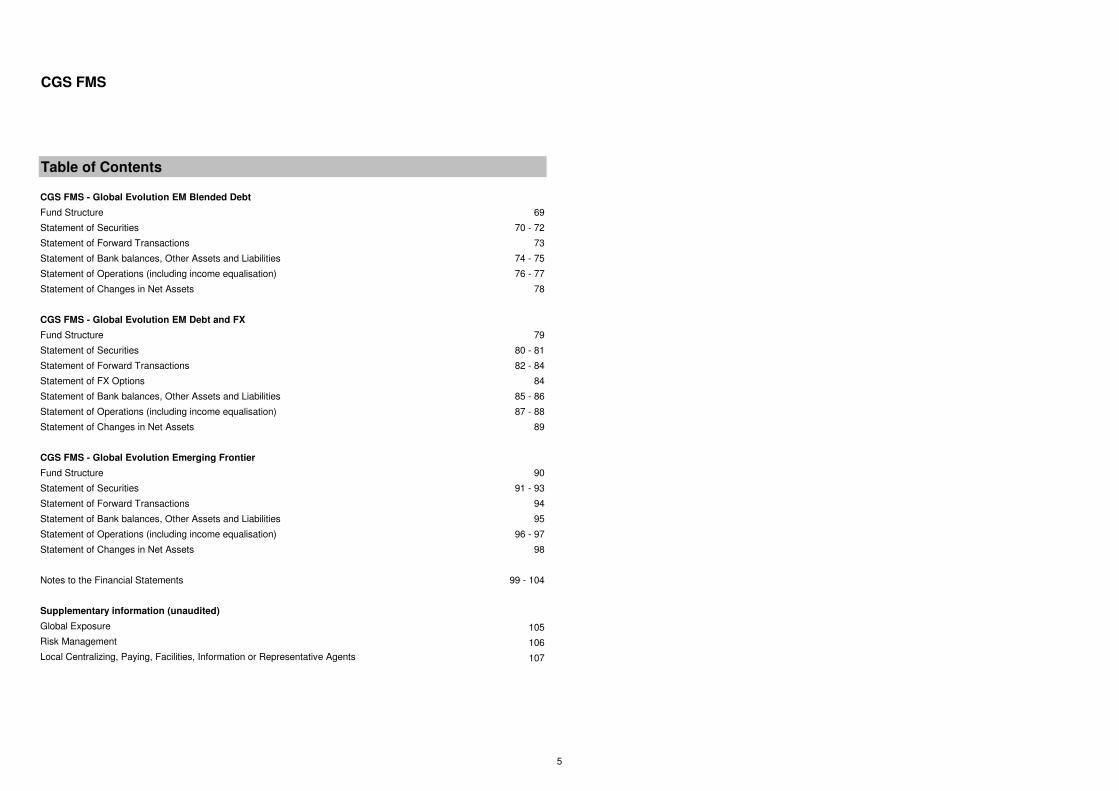
Table of Contents
CGS FMS - Global Evolution EM Blended Debt
Fund Structure 69
Statement of Securities 70 - 72
Statement of Forward Transactions 73
Statement of Bank balances, Other Assets and Liabilities 74 - 75
Statement of Operations (including income equalisation) 76 - 77
Statement of Changes in Net Assets 78
CGS FMS - Global Evolution EM Debt and FX
Fund Structure 79
Statement of Securities 80 - 81
Statement of Forward Transactions 82 - 84
Statement of FX Options 84
Statement of Bank balances, Other Assets and Liabilities 85 - 86
Statement of Operations (including income equalisation) 87 - 88
Statement of Changes in Net Assets 89
CGS FMS - Global Evolution Emerging Frontier
Fund Structure 90
Statement of Securities 91 - 93
Statement of Forward Transactions 94
Statement of Bank balances, Other Assets and Liabilities 95
Statement of Operations (including income equalisation) 96 - 97
Statement of Changes in Net Assets 98
Notes to the Financial Statements 99 - 104
Supplementary information (unaudited)
Global Exposure 105
Risk Management 106
Local Centralizing, Paying, Facilities, Information or Representative Agents 107
5
CGS FMS
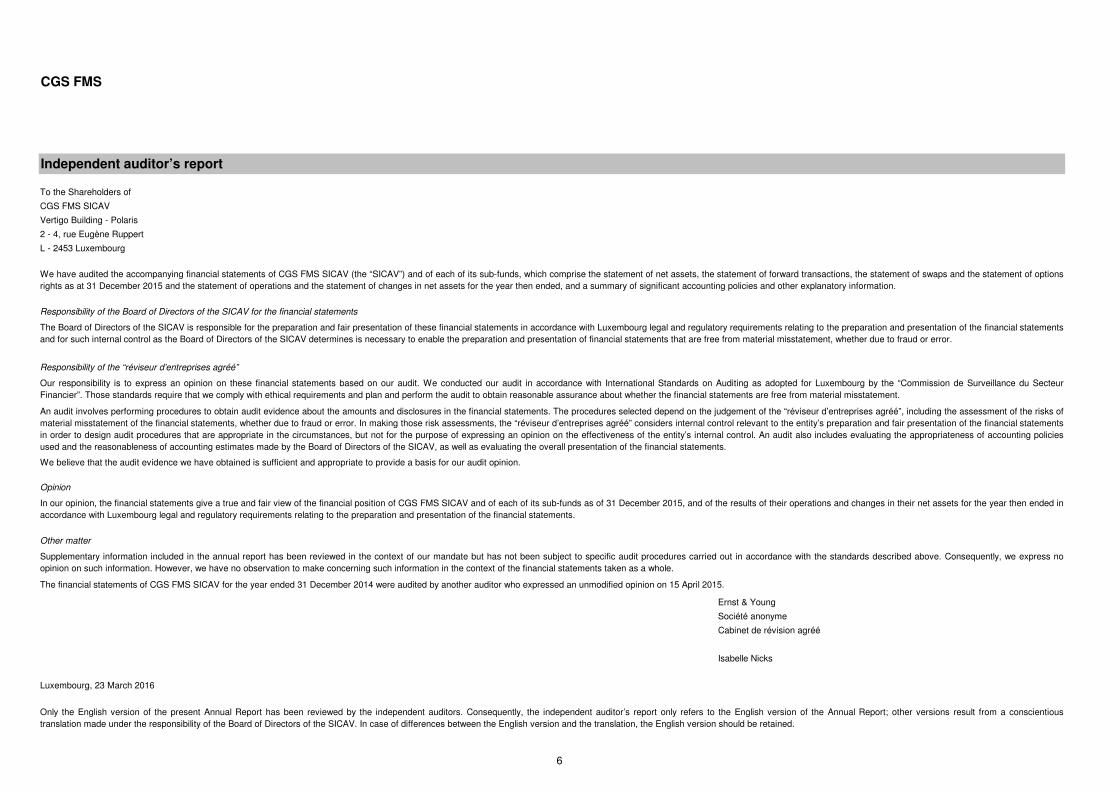
To the Shareholders of
CGS FMS SICAV
Vertigo Building - Polaris
2 - 4, rue Eugène Ruppert
L - 2453 Luxembourg
Ernst & Young
Société anonyme
Cabinet de révision agréé
Isabelle Nicks
Luxembourg, 23 March 2016
Our responsibility is to express an opinion on these financial statements based on our audit. We conducted our audit in accordance with International Standards on Auditing as adopted for Luxembourg by the “Commission de Surveillance du SecteurFinancier”. Those standards require that we comply with ethical requirements and plan and perform the audit to obtain reasonable assurance about whether the financial statements are free from material misstatement.
Independent auditor’s report
We have audited the accompanying financial statements of CGS FMS SICAV (the “SICAV”) and of each of its sub-funds, which comprise the statement of net assets, the statement of forward transactions, the statement of swaps and the statement of optionsrights as at 31 December 2015 and the statement of operations and the statement of changes in net assets for the year then ended, and a summary of significant accounting policies and other explanatory information.
Responsibility of the Board of Directors of the SICAV for the financial statements
The Board of Directors of the SICAV is responsible for the preparation and fair presentation of these financial statements in accordance with Luxembourg legal and regulatory requirements relating to the preparation and presentation of the financial statementsand for such internal control as the Board of Directors of the SICAV determines is necessary to enable the preparation and presentation of financial statements that are free from material misstatement, whether due to fraud or error.
Responsibility of the “réviseur d’entreprises agréé”
Only the English version of the present Annual Report has been reviewed by the independent auditors. Consequently, the independent auditor’s report only refers to the English version of the Annual Report; other versions result from a conscientioustranslation made under the responsibility of the Board of Directors of the SICAV. In case of differences between the English version and the translation, the English version should be retained.
An audit involves performing procedures to obtain audit evidence about the amounts and disclosures in the financial statements. The procedures selected depend on the judgement of the “réviseur d’entreprises agréé”, including the assessment of the risks ofmaterial misstatement of the financial statements, whether due to fraud or error. In making those risk assessments, the “réviseur d’entreprises agréé” considers internal control relevant to the entity’s preparation and fair presentation of the financial statementsin order to design audit procedures that are appropriate in the circumstances, but not for the purpose of expressing an opinion on the effectiveness of the entity’s internal control. An audit also includes evaluating the appropriateness of accounting policiesused and the reasonableness of accounting estimates made by the Board of Directors of the SICAV, as well as evaluating the overall presentation of the financial statements.
We believe that the audit evidence we have obtained is sufficient and appropriate to provide a basis for our audit opinion.
Opinion
In our opinion, the financial statements give a true and fair view of the financial position of CGS FMS SICAV and of each of its sub-funds as of 31 December 2015, and of the results of their operations and changes in their net assets for the year then ended inaccordance with Luxembourg legal and regulatory requirements relating to the preparation and presentation of the financial statements.
Other matter
Supplementary information included in the annual report has been reviewed in the context of our mandate but has not been subject to specific audit procedures carried out in accordance with the standards described above. Consequently, we express noopinion on such information. However, we have no observation to make concerning such information in the context of the financial statements taken as a whole.
The financial statements of CGS FMS SICAV for the year ended 31 December 2014 were audited by another auditor who expressed an unmodified opinion on 15 April 2015.
6
CGS FMS
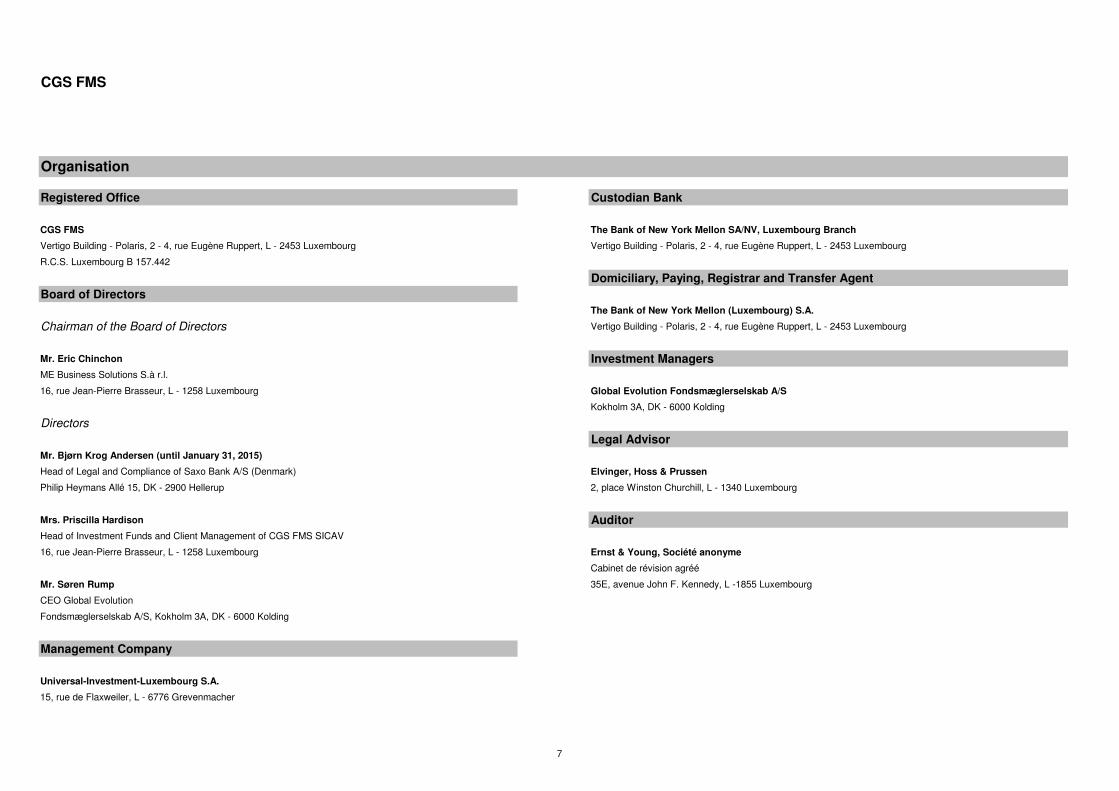
Registered Office Custodian Bank
CGS FMS The Bank of New York Mellon SA/NV, Luxembourg Branch
Vertigo Building - Polaris, 2 - 4, rue Eugène Ruppert, L - 2453 Luxembourg Vertigo Building - Polaris, 2 - 4, rue Eugène Ruppert, L - 2453 Luxembourg
R.C.S. Luxembourg B 157.442
Domiciliary, Paying, Registrar and Transfer Agent
Board of Directors
The Bank of New York Mellon (Luxembourg) S.A.
Chairman of the Board of Directors Vertigo Building - Polaris, 2 - 4, rue Eugène Ruppert, L - 2453 Luxembourg
Mr. Eric Chinchon Investment Managers
ME Business Solutions S.à r.l.
16, rue Jean-Pierre Brasseur, L - 1258 Luxembourg Global Evolution Fondsmæglerselskab A/S
Kokholm 3A, DK - 6000 Kolding
Directors
Legal Advisor
Mr. Bjørn Krog Andersen (until January 31, 2015)
Head of Legal and Compliance of Saxo Bank A/S (Denmark) Elvinger, Hoss & Prussen
Philip Heymans Allé 15, DK - 2900 Hellerup 2, place Winston Churchill, L - 1340 Luxembourg
Mrs. Priscilla Hardison Auditor
Head of Investment Funds and Client Management of CGS FMS SICAV
16, rue Jean-Pierre Brasseur, L - 1258 Luxembourg Ernst & Young, Société anonyme
Cabinet de révision agréé
Mr. Søren Rump 35E, avenue John F. Kennedy, L -1855 Luxembourg
CEO Global Evolution
Fondsmæglerselskab A/S, Kokholm 3A, DK - 6000 Kolding
Management Company
Universal-Investment-Luxembourg S.A.
15, rue de Flaxweiler, L - 6776 Grevenmacher
Organisation
7
CGS FMS
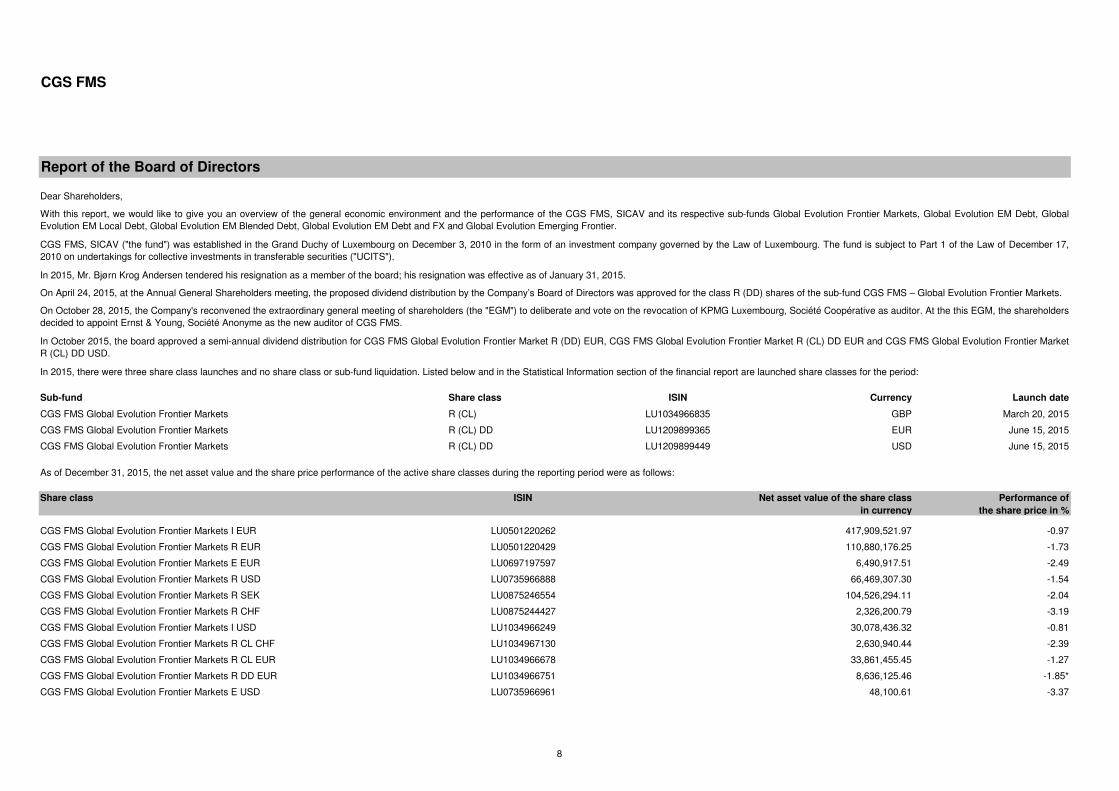
Sub-fund Share class ISIN Currency Launch date
CGS FMS Global Evolution Frontier Markets R (CL) LU1034966835 GBP March 20, 2015
CGS FMS Global Evolution Frontier Markets R (CL) DD LU1209899365 EUR June 15, 2015
CGS FMS Global Evolution Frontier Markets R (CL) DD LU1209899449 USD June 15, 2015
Share class ISIN Performance of
the share price in %
CGS FMS Global Evolution Frontier Markets I EUR LU0501220262 417,909,521.97 -0.97
CGS FMS Global Evolution Frontier Markets R EUR LU0501220429 110,880,176.25 -1.73
CGS FMS Global Evolution Frontier Markets E EUR LU0697197597 6,490,917.51 -2.49
CGS FMS Global Evolution Frontier Markets R USD LU0735966888 66,469,307.30 -1.54
CGS FMS Global Evolution Frontier Markets R SEK LU0875246554 104,526,294.11 -2.04
CGS FMS Global Evolution Frontier Markets R CHF LU0875244427 2,326,200.79 -3.19
CGS FMS Global Evolution Frontier Markets I USD LU1034966249 30,078,436.32 -0.81
CGS FMS Global Evolution Frontier Markets R CL CHF LU1034967130 2,630,940.44 -2.39
CGS FMS Global Evolution Frontier Markets R CL EUR LU1034966678 33,861,455.45 -1.27
CGS FMS Global Evolution Frontier Markets R DD EUR LU1034966751 8,636,125.46 -1.85*
CGS FMS Global Evolution Frontier Markets E USD LU0735966961 48,100.61 -3.37
Net asset value of the share class
in currency
As of December 31, 2015, the net asset value and the share price performance of the active share classes during the reporting period were as follows:
Report of the Board of Directors
Dear Shareholders,
In 2015, there were three share class launches and no share class or sub-fund liquidation. Listed below and in the Statistical Information section of the financial report are launched share classes for the period:
With this report, we would like to give you an overview of the general economic environment and the performance of the CGS FMS, SICAV and its respective sub-funds Global Evolution Frontier Markets, Global Evolution EM Debt, GlobalEvolution EM Local Debt, Global Evolution EM Blended Debt, Global Evolution EM Debt and FX and Global Evolution Emerging Frontier.
CGS FMS, SICAV ("the fund") was established in the Grand Duchy of Luxembourg on December 3, 2010 in the form of an investment company governed by the Law of Luxembourg. The fund is subject to Part 1 of the Law of December 17,2010 on undertakings for collective investments in transferable securities ("UCITS").
In 2015, Mr. Bjørn Krog Andersen tendered his resignation as a member of the board; his resignation was effective as of January 31, 2015.
On April 24, 2015, at the Annual General Shareholders meeting, the proposed dividend distribution by the Company’s Board of Directors was approved for the class R (DD) shares of the sub-fund CGS FMS – Global Evolution Frontier Markets.
On October 28, 2015, the Company's reconvened the extraordinary general meeting of shareholders (the "EGM") to deliberate and vote on the revocation of KPMG Luxembourg, Société Coopérative as auditor. At the this EGM, the shareholdersdecided to appoint Ernst & Young, Société Anonyme as the new auditor of CGS FMS.
In October 2015, the board approved a semi-annual dividend distribution for CGS FMS Global Evolution Frontier Market R (DD) EUR, CGS FMS Global Evolution Frontier Market R (CL) DD EUR and CGS FMS Global Evolution Frontier MarketR (CL) DD USD.
8
CGS FMS
Report of the Board of Directors
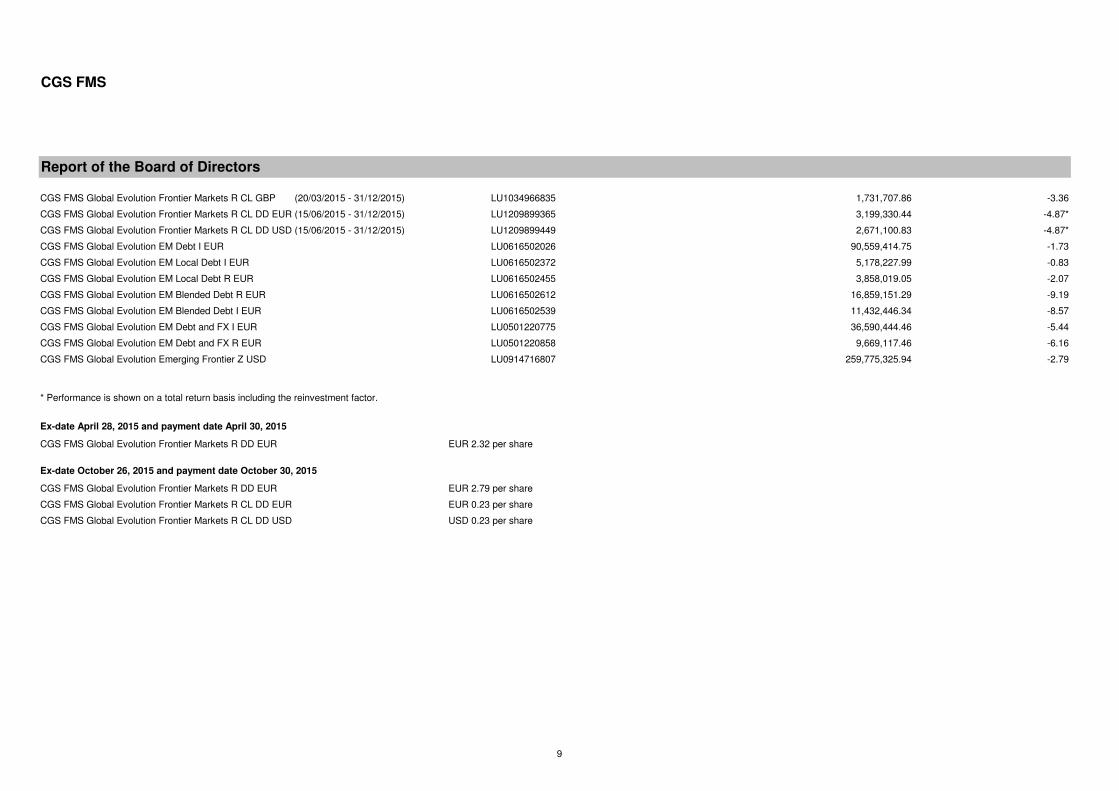
CGS FMS Global Evolution Frontier Markets R CL GBP (20/03/2015 - 31/12/2015) LU1034966835 1,731,707.86 -3.36
CGS FMS Global Evolution Frontier Markets R CL DD EUR (15/06/2015 - 31/12/2015) LU1209899365 3,199,330.44 -4.87*
CGS FMS Global Evolution Frontier Markets R CL DD USD (15/06/2015 - 31/12/2015) LU1209899449 2,671,100.83 -4.87*
CGS FMS Global Evolution EM Debt I EUR LU0616502026 90,559,414.75 -1.73
CGS FMS Global Evolution EM Local Debt I EUR LU0616502372 5,178,227.99 -0.83
CGS FMS Global Evolution EM Local Debt R EUR LU0616502455 3,858,019.05 -2.07
CGS FMS Global Evolution EM Blended Debt R EUR LU0616502612 16,859,151.29 -9.19
CGS FMS Global Evolution EM Blended Debt I EUR LU0616502539 11,432,446.34 -8.57
CGS FMS Global Evolution EM Debt and FX I EUR LU0501220775 36,590,444.46 -5.44
CGS FMS Global Evolution EM Debt and FX R EUR LU0501220858 9,669,117.46 -6.16
CGS FMS Global Evolution Emerging Frontier Z USD LU0914716807 259,775,325.94 -2.79
* Performance is shown on a total return basis including the reinvestment factor.
Ex-date April 28, 2015 and payment date April 30, 2015
CGS FMS Global Evolution Frontier Markets R DD EUR EUR 2.32 per share
Ex-date October 26, 2015 and payment date October 30, 2015
CGS FMS Global Evolution Frontier Markets R DD EUR EUR 2.79 per share
CGS FMS Global Evolution Frontier Markets R CL DD EUR EUR 0.23 per share
CGS FMS Global Evolution Frontier Markets R CL DD USD USD 0.23 per share
9
CGS FMS
Global Evolution Frontier Markets
Report of the Asset Manager
Investment Objective
The objective of the frontier markets strategy is to create attractive returns by utilizing a non-benchmark focused and diversified strategy within sovereign frontier emerging markets globally. The fund invests in hard currency and local currencyinstruments as well as foreign exchange. To achieve the investment objective Global Evolution will use a range of financial instruments (local currency debt instruments, hard currency debt instruments and foreign exchange) and derivativefinancial instruments (interest rate futures, interest rate swaps, total return swaps, credit default swaps, FX forwards, FX options and non-deliverable forwards).
Last year’s market environment
Broadly speaking, 2015 was certainly not a bed of roses. Starting in H1, in Europe the Greek saga made headlines as the ruling Syriza first resisted austerity and later, in a U-turn, surrendered to the Troika’s austerity demand. Meanwhile, amidongoing China growth worries, Chinese benchmark stock indices went from Good to Stellar and by mid-June the Shanghai Shenzhen 300 had made a 12 months return of around 150%. Having ignored many warning signs of a bubble in themaking, the ensuing crash caught the media’s full attention spelling doom and gloom over the Chinese economy and global commodity markets. An unexpected 1.8% devaluation of the Chinese renminbi in August and a shift to a market basedFX fixing regime added fuel to the fire.
A new oil order governed by Saudi Arabia
In H1 oil recovered some of the losses from late 2014 and early 2015. However, in H2 2015 oil and other hard commodities tanked leaving commodity exporters in pain and the December 4 OPEC meeting dealt another blow to oil prices as itbecame clear that the organization’s mission statement to “coordinate and unify the petroleum policies of its Member Countries and ensure the stabilization of oil markets” in effect had been replaced by a new oil order governed by Saudi Arabiawith the aim to defend and expand market shares at any price.
Pegged currency regimes faced strong headwinds
As hard commodities continued lower, commodity backed currencies came increasingly under pressure. A number of exporters gave up their currency peg (Kazakhstan, Azerbaijan), but a few die hard pegged regimes (Saudi Arabia, Nigeria)stayed put.
(Geo)political risk came to the fore
To be fair, some sovereign credits also suffered from homegrown problems. In Brazil and South Africa corruption charges, stalled reform momentums and fiscal paralysis were the prime focus areas, whereas oil exporting Venezuela was in aleague of its own in terms of economic disrepair. Brazil, once poster child for dynamic development, was eventually downgraded to junk.
Closer to home Syria turned into a geopolitical crisis involving not only neighboring countries but also the EU and NATO as Syrian refugees crossed the borders to EU in volumes and Turkey downed a Russian fighter jet on the Turkish-Syrianborder. The stand-off between Kiev and separatists in Eastern Ukraine remained largely unsolved, but as tensions gradually eased the media lost interest in the conflict. Ukraine finalized an investor friendly restructuring of its sovereign hardcurrency debt but defaulted on USD 3bn of debt owed to Russia.
Monetary policy divergence became a theme
Still in Europe, the European Central Bank (ECB) joined the QE club in March with an expansion and extension announcement in early December. This helped drive down core European yields in negative territory in tenors up till 5-6 years,European based institutional investors were left with little choice but to move up in duration or move down in credit quality. With no doubt this helped explain the contradiction between ongoing redemptions in EM debt dedicated retail funds anda solid institutional pipeline for hard currency EM mandates. Turning to the US, following a shaky hand and a failed attempt in September, the US Federal Reserve finally pulled the trigger on rate hikes on December 16, 2015.
The trade weighted dollar index gained almost 9%
10yr US treasury yields finished the year little changed; up from 2.17% to 2.27%. However, in FX markets the dollar strengthened from EUR/USD 1.2098 to an intra-year low of EUR/USD 1.0496 but the currency pair recovered to finish the yearin 1.0862. The Federal Reserve’s broad trade weighted dollar index gained 9.7% in 2015.
10
CGS FMS
Report of the Asset Manager
Source: Global Evolution
Performance drivers for 2015 for the relevant sub fund
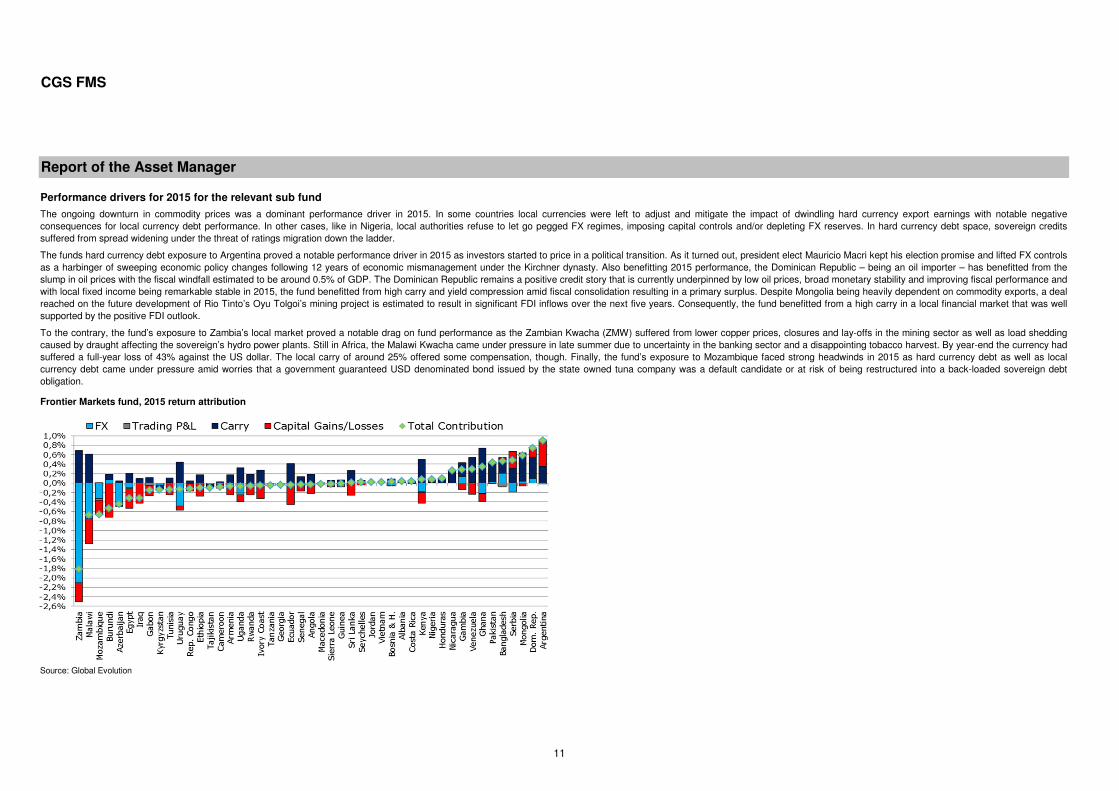
The ongoing downturn in commodity prices was a dominant performance driver in 2015. In some countries local currencies were left to adjust and mitigate the impact of dwindling hard currency export earnings with notable negativeconsequences for local currency debt performance. In other cases, like in Nigeria, local authorities refuse to let go pegged FX regimes, imposing capital controls and/or depleting FX reserves. In hard currency debt space, sovereign creditssuffered from spread widening under the threat of ratings migration down the ladder.
The funds hard currency debt exposure to Argentina proved a notable performance driver in 2015 as investors started to price in a political transition. As it turned out, president elect Mauricio Macri kept his election promise and lifted FX controlsas a harbinger of sweeping economic policy changes following 12 years of economic mismanagement under the Kirchner dynasty. Also benefitting 2015 performance, the Dominican Republic – being an oil importer – has benefitted from theslump in oil prices with the fiscal windfall estimated to be around 0.5% of GDP. The Dominican Republic remains a positive credit story that is currently underpinned by low oil prices, broad monetary stability and improving fiscal performance andwith local fixed income being remarkable stable in 2015, the fund benefitted from high carry and yield compression amid fiscal consolidation resulting in a primary surplus. Despite Mongolia being heavily dependent on commodity exports, a dealreached on the future development of Rio Tinto’s Oyu Tolgoi’s mining project is estimated to result in significant FDI inflows over the next five years. Consequently, the fund benefitted from a high carry in a local financial market that was wellsupported by the positive FDI outlook.
To the contrary, the fund’s exposure to Zambia’s local market proved a notable drag on fund performance as the Zambian Kwacha (ZMW) suffered from lower copper prices, closures and lay-offs in the mining sector as well as load sheddingcaused by draught affecting the sovereign’s hydro power plants. Still in Africa, the Malawi Kwacha came under pressure in late summer due to uncertainty in the banking sector and a disappointing tobacco harvest. By year-end the currency hadsuffered a full-year loss of 43% against the US dollar. The local carry of around 25% offered some compensation, though. Finally, the fund’s exposure to Mozambique faced strong headwinds in 2015 as hard currency debt as well as localcurrency debt came under pressure amid worries that a government guaranteed USD denominated bond issued by the state owned tuna company was a default candidate or at risk of being restructured into a back-loaded sovereign debtobligation.
Frontier Markets fund, 2015 return attribution
11
CGS FMS
Report of the Asset Manager
Source: Global Evolution
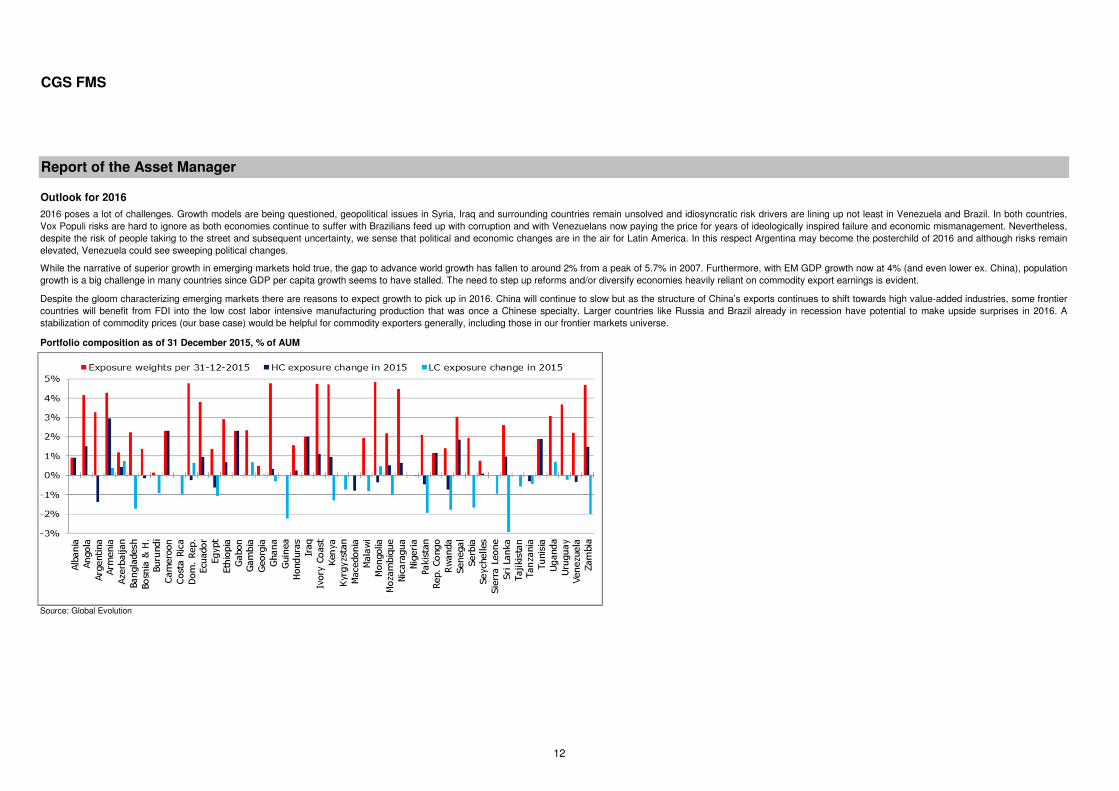
Outlook for 2016
2016 poses a lot of challenges. Growth models are being questioned, geopolitical issues in Syria, Iraq and surrounding countries remain unsolved and idiosyncratic risk drivers are lining up not least in Venezuela and Brazil. In both countries,Vox Populi risks are hard to ignore as both economies continue to suffer with Brazilians feed up with corruption and with Venezuelans now paying the price for years of ideologically inspired failure and economic mismanagement. Nevertheless,despite the risk of people taking to the street and subsequent uncertainty, we sense that political and economic changes are in the air for Latin America. In this respect Argentina may become the posterchild of 2016 and although risks remainelevated, Venezuela could see sweeping political changes.
While the narrative of superior growth in emerging markets hold true, the gap to advance world growth has fallen to around 2% from a peak of 5.7% in 2007. Furthermore, with EM GDP growth now at 4% (and even lower ex. China), populationgrowth is a big challenge in many countries since GDP per capita growth seems to have stalled. The need to step up reforms and/or diversify economies heavily reliant on commodity export earnings is evident.
Despite the gloom characterizing emerging markets there are reasons to expect growth to pick up in 2016. China will continue to slow but as the structure of China’s exports continues to shift towards high value-added industries, some frontiercountries will benefit from FDI into the low cost labor intensive manufacturing production that was once a Chinese specialty. Larger countries like Russia and Brazil already in recession have potential to make upside surprises in 2016. Astabilization of commodity prices (our base case) would be helpful for commodity exporters generally, including those in our frontier markets universe.
Portfolio composition as of 31 December 2015, % of AUM
12
CGS FMS
Report of the Asset Manager
Global Evolution EM Debt
The objective of the sub-fund is to create attractive returns by utilizing a non-benchmark focused and diversified strategy within emerging markets by focusing primarily on sovereign hard currency debt, but also on strategies that includesovereign local currency denominated debt and currency instruments.
Performance drivers for 2015 for the relevant sub fund
Last year’s market environment
Broadly speaking, 2015 was certainly not a bed of roses. Starting in H1, in Europe the Greek saga made headlines as the ruling Syriza first resisted austerity and later, in a U-turn, surrendered to the Troika’s austerity demand. Meanwhile, amidongoing China growth worries, Chinese benchmark stock indices went from Good to Stellar and by mid-June the Shanghai Shenzhen 300 had made a 12 months return of around 150%. Having ignored many warning signs of a bubble in themaking, the ensuing crash caught the media’s full attention spelling doom and gloom over the Chinese economy and global commodity markets. An unexpected 1.8% devaluation of the Chinese renminbi in August and a shift to a market basedFX fixing regime added fuel to the fire.
Investment Objective
The funds exposure to Argentina proved a notable performance driver in 2015 as investors started to price in a political transition. As it turned out, president elect Mauricio Macri kept his election promise and lifted FX controls as a harbinger ofsweeping economic policy changes following 12 years of economic mismanagement under the Kirchner dynasty.
To the contrary, a long standing zero weight in Russia was a major drag on relative performance in 2015 as Russian assets saw a huge turnaround. For quite some time we have argued that we needed more evidence that the conflict withUkraine would not escalate and that oil prices were stabilizing as a minimum. By mid-November we decided to invest in Russia again (in EUR-denominated debt) since we believed that both conditions were more or less met. At the time weexpected oil prices to bottom out around USD 40 per barrel and the ceasefire in Ukraine to hold as Russia was more focused on Syria. Also affecting our investment decision, the West seemed happy to forget (if not forgive) Russia’sinterference in Eastern Ukraine and the annexation of Crimea in order to get Russia on board in a united front against ISIS. By year-end 2015 we were still underweighted Russia because we believed the positive expectations were now wellreflected in the pricing of Russian bonds which are back at pre-crisis levels.
A new oil order governed by Saudi Arabia
In H1 oil recovered some of the losses from late 2014 and early 2015. However, in H2 2015 oil and other hard commodities tanked leaving commodity exporters in pain and the December 4 OPEC meeting dealt another blow to oil prices as itbecame clear that the organization’s mission statement to “coordinate and unify the petroleum policies of its Member Countries and ensure the stabilization of oil markets” in effect had been replaced by a new oil order governed by Saudi Arabiawith the aim to defend and expand market shares at any price.
(Geo)political risks came to the fore
To be fair, some sovereign credits also suffered from homegrown problems. In Brazil and South Africa corruption charges, stalled reform momentums and fiscal paralysis were the prime focus areas, whereas oil exporting Venezuela was in aleague of its own in terms of economic disrepair. Brazil, once poster child for dynamic development, was eventually downgraded to junk.
Closer to home Syria turned into a geopolitical crisis involving not only neighboring countries but also the EU and NATO as Syrian refugees crossed the borders to EU in volumes and Turkey downed a Russian fighter jet on the Turkish-Syrianborder. The stand-off between Kiev and separatists in Eastern Ukraine remained largely unsolved, but as tensions gradually eased the media lost interest in the conflict. Ukraine finalized an investor friendly restructuring of its sovereign hardcurrency debt but defaulted on USD 3bn of debt owed to Russia.
Monetary policy divergence became a theme
Still in Europe, the European Central Bank (ECB) joined the QE club in March with an expansion and extension announcement in early December. This helped drive down core European yields in negative territory in tenors up till 5-6 years,European based institutional investors were left with little choice but to move up in duration or move down in credit quality. With no doubt this helped explain the contradiction between ongoing redemptions in EM debt dedicated retail funds anda solid institutional pipeline for hard currency EM mandates. Turning to the US, following a shaky hand and a failed attempt in September, the US Federal Reserve finally pulled the trigger on rate hikes on December 16, 2015. 10yr US treasuryyields finished the year little changed; up from 2.17% to 2.27%.
13
CGS FMS
Report of the Asset Manager
Technicals are supportive - ECB’s QE to support institutional demand
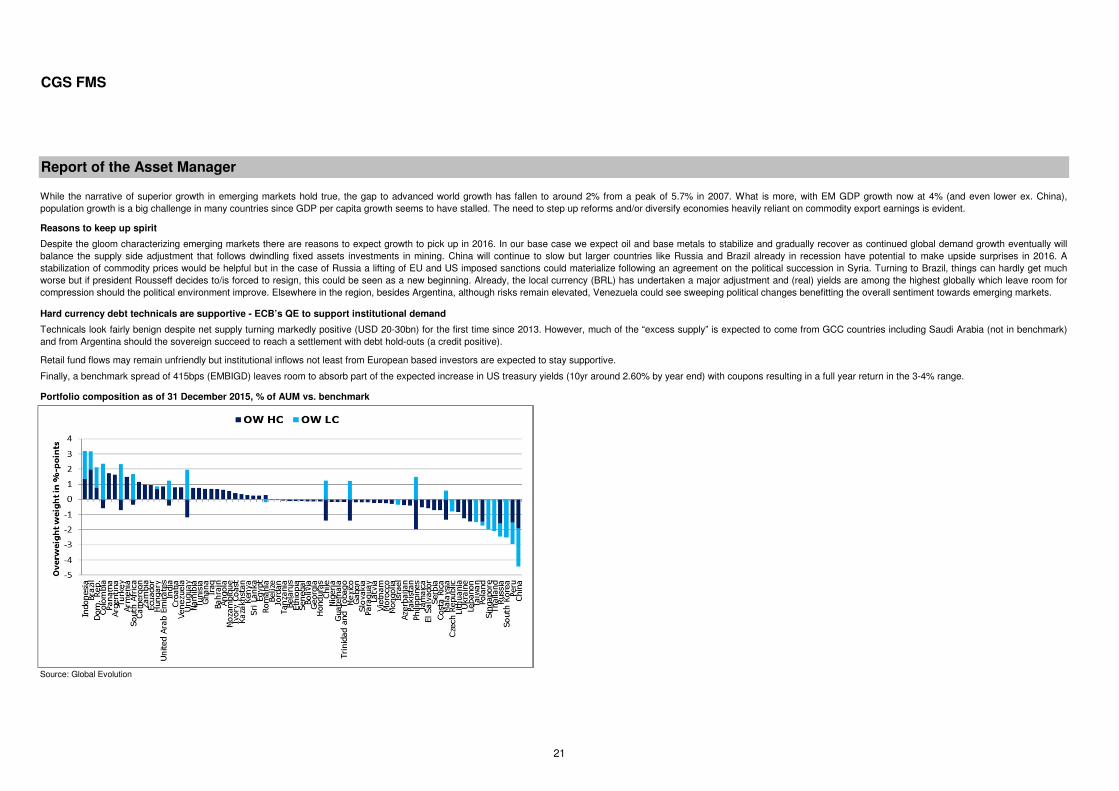
Technicals look fairly benign despite net supply turning markedly positive (USD 20-30bn) for the first time since 2013. However, much of the “excess supply” is expected to come from GCC countries including Saudi Arabia (not in benchmark)and from Argentina should the sovereign succeed to reach a settlement with debt hold-outs (a credit positive).
Retail fund flows may remain unfriendly but institutional inflows not least from European based investors are expected to stay supportive.
Finally, a benchmark spread of 415bps (EMBIGD) leaves room to absorb part of the expected increase in US treasury yields (we expect 10yr yields around 2.60% by year end) with coupons resulting in a full year return in the 3-4% range.
In our base case we expect oil and base metals to stabilize and gradually recover in 2016 as continued global demand growth eventually will balance the supply side adjustment that follows dwindling fixed assets investments in mining.
In neighboring Ukraine, our zero-weight here also proved to be a large drag on relative performance. The country suffered - economically and politically - due to territorial hardship in East Ukraine and tensions with neighboring Russia but aprogram was agreed with the IMF and has for the most part been adhered to. We and the market generally expected a fairly tough debt restructuring and Ukraine’s sovereign debt as a consequence rallied hard as the restructuring included arather benign 20% principal write-down, a 7.75% coupon and a 4 year maturity extension with a GDP-linked component. In other words, the terms proved far more investor-friendly than expected, especially due to the lack of coupon cuts. Webelieve the terms could and should have been better for Ukraine and that economic and political risks remain in place. Hence, we maintained our zero-weight for 2015.
Outlook for 2016
2016 poses a lot of challenges. Growth models are being questioned, geopolitical issues in Syria, Iraq and surrounding countries remain unsolved and idiosyncratic risk drivers are lining up not least in Venezuela and Brazil. In both countries,Vox Populi risks are hard to ignore as both economies continue to suffer with Brazilians feed up with corruption and Venezuelans now paying the price for years of ideologically inspired failure and economic mismanagement. Nevertheless,despite the risk of people taking to the street and subsequent uncertainty, we sense that political and economic changes are in the air for Latin America. In this respect Argentina may become the posterchild of 2016 and although risks remainelevated, Venezuela could see sweeping political changes.
While the narrative of superior growth in emerging markets hold true, the gap to advanced world growth has fallen to around 2% from a peak of 5.7% in 2007. What is more, with EM GDP growth now at 4% (and even lower ex. China),population growth is a big challenge in many countries since GDP per capita growth seems to have stalled. The need to step up reforms and/or diversify economies heavily reliant on commodity export earnings is evident.
Oil and base metals to gradually recover
Reasons to keep up spirit
Despite the gloom characterizing emerging markets there are reasons to expect growth to pick up in 2016. China will continue to slow but larger countries like Russia and Brazil already in recession have potential to make upside surprises in2016. A stabilization of commodity prices (our base case) would be helpful for both countries but in the case of Russia a lifting of EU and US imposed sanctions could materialize following an agreement on the political succession in Syria.Turning to Brazil, things can hardly get much worse but if president Rousseff decides to or is forced to resign, this could be seen as a new beginning.
14
CGS FMS
Report of the Asset Manager
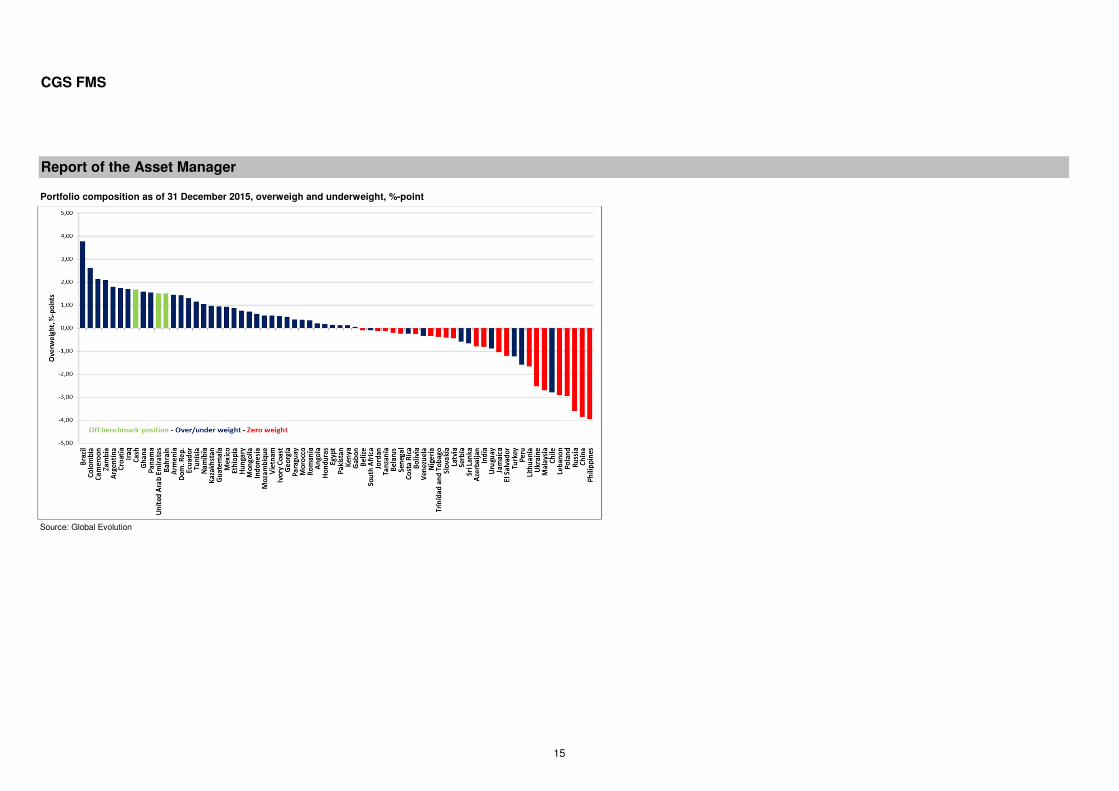
Portfolio composition as of 31 December 2015, overweigh and underweight, %-point
Source: Global Evolution
15
CGS FMS
Report of the Asset Manager
Global Evolution EM Local Debt
Performance drivers for 2015 for the relevant sub fund
Colombia was a strong contributor to outperformance; the currency risk was managed well on the back of our calls on oil prices. Colombia is an oil exporter and the fund's performance benefitted from an underweight from June to August whenoil prices collapsed 35%. Later we covered the underweight to hold a small overweight by year-end.
Also adding to positive performance, the Dominican Republic - being an oil importer - has benefitted from the slump in oil prices with the fiscal windfall estimated to be around 0.5% of GDP. The Dominican Republic remains a positive credit storythat is currently underpinned by low oil prices, broad monetary stability and improving fiscal performance and with local fixed income being remarkable stable in 2015, the fund benefitted from high carry and yield compression amid fiscalconsolidation resulting in a primary surplus.
(Geo)political risks came to the fore
To be fair, some sovereign credits also suffered from homegrown problems. In Brazil and South Africa corruption charges, stalled reform momentums and fiscal paralysis were the prime focus areas, whereas oil exporting Venezuela was in aleague of its own in terms of economic disrepair. Brazil, once poster child for dynamic development, was eventually downgraded to junk.
Closer to home Syria turned into a geopolitical crisis involving not only neighboring countries but also the EU and NATO as Syrian refugees crossed the borders to EU in volumes and Turkey downed a Russian fighter jet on the Turkish-Syrianborder. The stand-off between Kiev and separatists in Eastern Ukraine remained largely unsolved, but as tensions gradually eased the media lost interest in the conflict. Ukraine finalized an investor friendly restructuring of its sovereign hardcurrency debt but defaulted on USD 3bn of debt owed to Russia.
Monetary policy divergence became a theme
Still in Europe, the European Central Bank (ECB) joined the QE club in March with an expansion and extension announcement in early December. This helped drive down core European yields in negative territory in tenors up till 5-6 years, andEuropean based institutional investors were left with little choice but to move up in duration or move down in credit quality. In the US, following a shaky hand and a failed attempt in September, the US Federal Reserve finally pulled the trigger onrate hikes on December 16. 10yr US treasury yields finished the year little changed; up from 2.17% to 2.27%. However, in FX markets the dollar strengthened from EUR/USD 1.2098 to an intra-year low of EUR/USD 1.0496 but the currency pairrecovered to finish the year in 1.0862. The Federal Reserve’s broad trade weighted dollar index gained 9.7% in 2015.
Investment Objective
The objective of the sub-fund is to create attractive returns by utilizing a non-benchmark focused and diversified strategy within emerging markets focusing on sovereign local currency denominated debt and currency instruments.
Last year’s market environment
Broadly speaking, 2015 was certainly not a bed of roses. Starting in H1, in Europe the Greek saga made headlines as the ruling Syriza first resisted austerity and later, in a U-turn, surrendered to the Troika’s austerity demand. Meanwhile, amidongoing China growth worries, Chinese benchmark stock indices went from Good to Stellar and by mid-June the Shanghai Shenzhen 300 had made a 12 months return of around 150%. Having ignored many warning signs of a bubble in themaking, the ensuing crash caught the media’s full attention spelling doom and gloom over the Chinese economy and global commodity markets. An unexpected 1.8% devaluation of the Chinese renminbi in August and a shift to a market basedFX fixing regime added fuel to the fire.
A new oil order governed by Saudi Arabia
In H1 oil recovered some of the losses from late 2014 and early 2015. However, in H2 2015 oil and other hard commodities tanked leaving commodity exporters in pain and the December 4 OPEC meeting dealt another blow to oil prices as itbecame clear that the organization’s mission statement to “coordinate and unify the petroleum policies of its Member Countries and ensure the stabilization of oil markets” in effect had been replaced by a new oil order governed by Saudi Arabiawith the aim to defend and expand market shares at any price.
Pegged currency regimes faced strong headwinds
As hard commodities continued lower commodity backed currencies came increasingly under pressure. A number of exporters gave up their currency peg (Kazakhstan, Azerbaijan), but a few die hard pegged regimes (Saudi Arabia, Nigeria)stayed put.
16
CGS FMS
Report of the Asset Manager
Source: Global Evolution
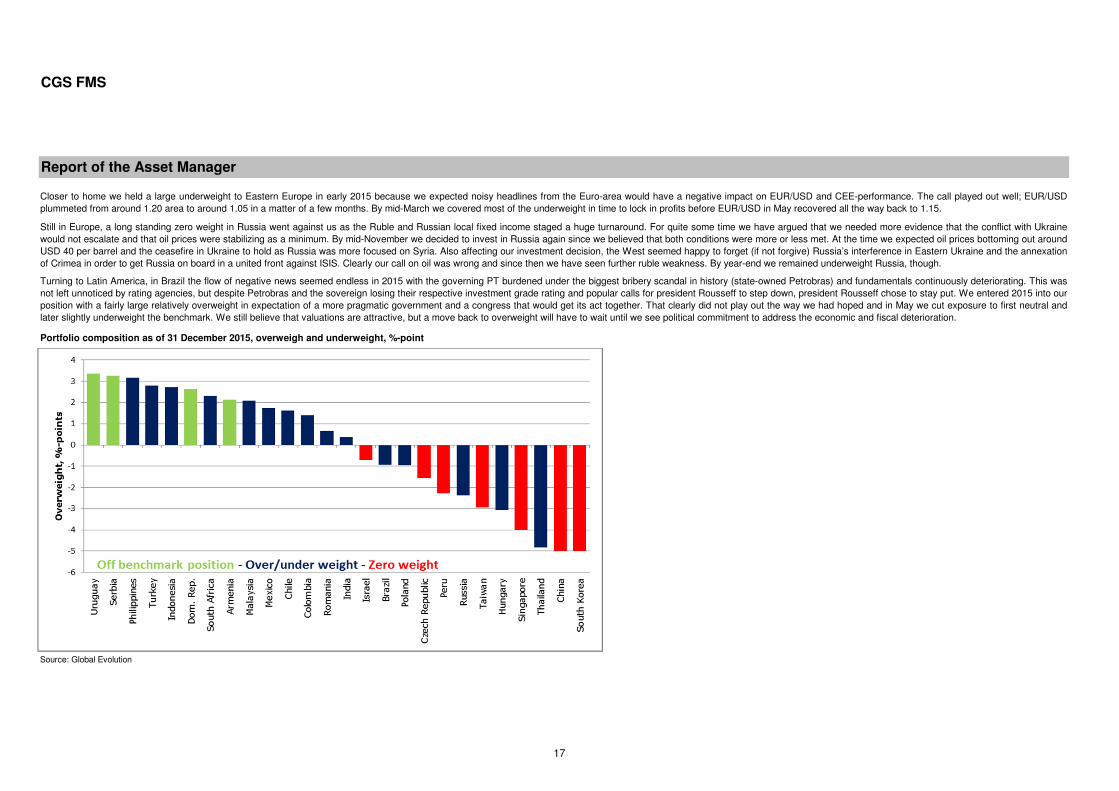
Closer to home we held a large underweight to Eastern Europe in early 2015 because we expected noisy headlines from the Euro-area would have a negative impact on EUR/USD and CEE-performance. The call played out well; EUR/USDplummeted from around 1.20 area to around 1.05 in a matter of a few months. By mid-March we covered most of the underweight in time to lock in profits before EUR/USD in May recovered all the way back to 1.15.
Still in Europe, a long standing zero weight in Russia went against us as the Ruble and Russian local fixed income staged a huge turnaround. For quite some time we have argued that we needed more evidence that the conflict with Ukrainewould not escalate and that oil prices were stabilizing as a minimum. By mid-November we decided to invest in Russia again since we believed that both conditions were more or less met. At the time we expected oil prices bottoming out aroundUSD 40 per barrel and the ceasefire in Ukraine to hold as Russia was more focused on Syria. Also affecting our investment decision, the West seemed happy to forget (if not forgive) Russia’s interference in Eastern Ukraine and the annexationof Crimea in order to get Russia on board in a united front against ISIS. Clearly our call on oil was wrong and since then we have seen further ruble weakness. By year-end we remained underweight Russia, though.
Turning to Latin America, in Brazil the flow of negative news seemed endless in 2015 with the governing PT burdened under the biggest bribery scandal in history (state-owned Petrobras) and fundamentals continuously deteriorating. This wasnot left unnoticed by rating agencies, but despite Petrobras and the sovereign losing their respective investment grade rating and popular calls for president Rousseff to step down, president Rousseff chose to stay put. We entered 2015 into ourposition with a fairly large relatively overweight in expectation of a more pragmatic government and a congress that would get its act together. That clearly did not play out the way we had hoped and in May we cut exposure to first neutral andlater slightly underweight the benchmark. We still believe that valuations are attractive, but a move back to overweight will have to wait until we see political commitment to address the economic and fiscal deterioration.
Portfolio composition as of 31 December 2015, overweigh and underweight, %-point
17
CGS FMS
Report of the Asset Manager
While the narrative of superior growth in emerging markets hold true, the gap to advanced world growth has fallen to around 2% from a peak of 5.7% in 2007. What is more, with EM GDP growth now at 4% (and even lower ex. China),population growth is a big challenge in many countries since GDP per capita growth seems to have stalled. The need to step up reforms and/or diversify economies heavily reliant on commodity export earnings is evident.
Despite the gloom characterizing emerging markets there are reasons to expect growth to pick up in 2016. In our base case we expect oil and base metals to stabilize and gradually recover as continued global demand growth eventually willbalance the supply side adjustment that follows dwindling fixed assets investments in mining. China will continue to slow but larger countries like Russia and Brazil already in recession have potential to make upside surprises in 2016. Astabilization of commodity prices would be helpful but in the case of Russia a lifting of EU and US imposed sanctions could materialize following an agreement on the political succession in Syria. Turning to Brazil, things can hardly get muchworse but if president Rousseff decides to/is forced to resign, this could be seen as a new beginning. Already, the local currency (BRL) has undertaken a major adjustment and (real) yields are among the highest globally which leave room forcompression should the political environment improve. Elsewhere in the region, although risks remain elevated, Venezuela could see sweeping political changes benefitting the overall sentiment towards emerging markets.
We expect EUR/USD to stay in the 1.05 - 1.15 range for now with a likely test of the lower bound in Q1 and Q2 before a recovery towards 1.15 in H2. Once EUR/USD begins to recover in earnest towards the upper bound in our range thiswould most likely be the trigger for a recovery in commodity prices.
Outlook for 2016
2016 poses a lot of challenges. Growth models are being questioned, geopolitical issues in Syria, Iraq and surrounding countries remain unsolved and idiosyncratic risk drivers are lining up not least in Venezuela and Brazil. In both countries,Vox Populi risks are hard to ignore as both economies continue to suffer with Brazilians feed up with corruption and with Venezuelans now paying the price for years of ideologically inspired failure and economic mismanagement. Nevertheless,despite the risk of people taking to the street and subsequent uncertainty, we sense that political and economic changes are in the air for Latin America. In this respect Argentina may become the posterchild of 2016 and although risks remainelevated, Venezuela could see sweeping political changes.
18
CGS FMS
Report of the Asset Manager
Global Evolution EM Blended Debt
Broadly speaking, 2015 was certainly not a bed of roses. Starting in H1, in Europe the Greek saga made headlines as the ruling Syriza first resisted austerity and later, in a U-turn, surrendered to the Troika’s austerity demand. Meanwhile, amidongoing China growth worries, Chinese benchmark stock indices went from Good to Stellar and by mid-June the Shanghai Shenzhen 300 had made a 12 months return of around 150%. Having ignored many warning signs of a bubble in themaking, the ensuing crash caught the media’s full attention spelling doom and gloom over the Chinese economy and global commodity markets. An unexpected 1.8% devaluation of the Chinese renminbi in August and a shift to a market basedFX fixing regime added fuel to the fire.
The fund objective is to create attractive returns by utilizing a non-benchmark focused and diversified strategy within emerging markets focusing on sovereign hard currency debt, local currency denominated debt and currency instruments in adynamic and very actively managed format. To achieve the investment objective Global Evolution will dynamically manage the exposure to sovereign hard currency debt, local currency instruments and frontier markets.
Last year’s market environment
A new oil order governed by Saudi Arabia
In H1 oil recovered some of the losses from late 2014 and early 2015. However, in H2 2015 oil and other hard commodities tanked leaving commodity exporters in pain and the December 4 OPEC meeting dealt another blow to oil prices as itbecame clear that the organization’s mission statement to “coordinate and unify the petroleum policies of its Member Countries and ensure the stabilization of oil markets” in effect had been replaced by a new oil order governed by Saudi Arabiawith the aim to defend and expand market shares at any price.
Pegged currency regimes faced strong headwinds
As hard commodities continued lower, commodity backed currencies came increasingly under pressure. A number of exporters gave up their currency peg (Kazakhstan, Azerbaijan), but a few die hard pegged regimes (Saudi Arabia, Nigeria)stayed put.
(Geo)political risks came to the fore
To be fair, some sovereign credits also suffered from homegrown problems. In Brazil and South Africa corruption charges, stalled reform momentums and fiscal paralysis were the prime focus areas, whereas oil exporting Venezuela was in aleague of its own in terms of economic disrepair. Brazil, once poster child for dynamic development, was eventually downgraded to junk.
Closer to home Syria turned into a geopolitical crisis involving not only neighboring countries but also the EU and NATO as Syrian refugees crossed the borders to EU in volumes and Turkey downed a Russian fighter jet on the Turkish-Syrianborder. The stand-off between Kiev and separatists in Eastern Ukraine remained largely unsolved, but as tensions gradually eased the media lost interest in the conflict. Ukraine finalized an investor friendly restructuring of its sovereign hardcurrency debt but defaulted on USD 3bn of debt owed to Russia.
Monetary policy divergence became a theme
Still in Europe, the European Central Bank (ECB) joined the QE club in March with an expansion and extension announcement in early December. This helped drive down core European yields in negative territory in tenors up till 5-6 years,European based institutional investors were left with little choice but to move up in duration or move down in credit quality. With no doubt this helped explain the contradiction between ongoing redemptions in EM debt dedicated retail funds anda solid institutional pipeline for hard currency EM mandates. Turning to the US, following a shaky hand and a failed attempt in September, the US Federal Reserve finally pulled the trigger on rate hikes on December 16. 10yr US treasury yieldsfinished the year little changed; up from 2.17% to 2.27%. However, in FX markets the dollar strengthened from EUR/USD 1.2098 to an intra-year low of EUR/USD 1.0496 but the currency pair recovered to finish the year in 1.0862. The FederalReserve’s broad trade weighted dollar index gained 9.7% in 2015.
Performance drivers for 2015 for the relevant sub fund
Despite a benchmark agnostic dynamic investment approach and a dedicated objective to exploit the ever changing investment themes, the fund performance proved unsatisfactory. In our blended allocation strategy we held local currency debt(including CCE currencies) underweight in Q1 in a bet that negative headlines involving Greece and the wider Euro-area would translate into risk aversion and a weaker EUR. As such our call was successful since EUR/USD plummeted fromaround 1.20 to around 1.05 in a matter of months. By end Q1 we gradually raised the share of local currency debt (including CCE currencies) to an overweight – a timely move considering the following spike in EUR/USD to 1.14 and someoptimism in commodity markets.
Investment Objective
19
CGS FMS
Report of the Asset Manager
In neighboring Ukraine, our zero-weight here also proved to be a large drag on relative performance. The country suffered - economically and politically - due to territorial hardship in East Ukraine and tensions with neighboring Russia but aprogram was agreed with the IMF and has for the most part been adhered to. We and the market generally expected a fairly tough debt restructuring and Ukraine’s sovereign debt as a consequence rallied hard as the restructuring included arather benign 20% principal write-down, a 7.75% coupon and a 4 year maturity extension with a GDP-linked component. In other words, the terms proved far more investor-friendly than expected, especially due to the lack of coupon cuts. Webelieve the terms could and should have been better for Ukraine and that economic and political risks remain in place. Hence, we maintained our zero-weight for 2015.
Outlook for 2016
2016 poses a lot of challenges. Growth models are being questioned, geopolitical issues in Syria, Iraq and surrounding countries remain unsolved and idiosyncratic risk drivers are lining up not least in Venezuela and Brazil. In both countries,Vox Populi risks are hard to ignore as both economies continue to suffer with Brazilians feed up with corruption and Venezuelans now paying the price for years of ideologically inspired failure and economic mismanagement. Nevertheless,despite the risk of people taking to the street and subsequent uncertainty, we sense that political and economic changes are in the air for Latin America. In this respect Argentina may become the posterchild of 2016 and although risks remainelevated, Venezuela could see sweeping political changes.
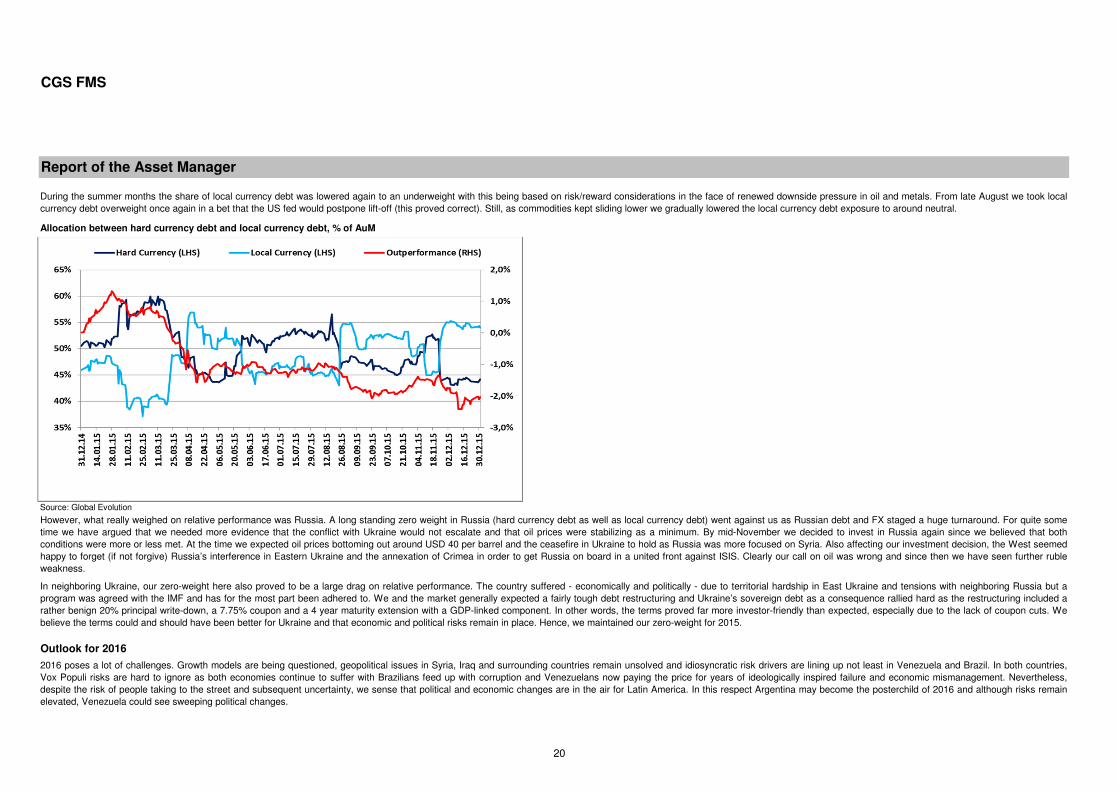
Allocation between hard currency debt and local currency debt, % of AuM
Source: Global Evolution
However, what really weighed on relative performance was Russia. A long standing zero weight in Russia (hard currency debt as well as local currency debt) went against us as Russian debt and FX staged a huge turnaround. For quite sometime we have argued that we needed more evidence that the conflict with Ukraine would not escalate and that oil prices were stabilizing as a minimum. By mid-November we decided to invest in Russia again since we believed that bothconditions were more or less met. At the time we expected oil prices bottoming out around USD 40 per barrel and the ceasefire in Ukraine to hold as Russia was more focused on Syria. Also affecting our investment decision, the West seemedhappy to forget (if not forgive) Russia’s interference in Eastern Ukraine and the annexation of Crimea in order to get Russia on board in a united front against ISIS. Clearly our call on oil was wrong and since then we have seen further rubleweakness.
During the summer months the share of local currency debt was lowered again to an underweight with this being based on risk/reward considerations in the face of renewed downside pressure in oil and metals. From late August we took localcurrency debt overweight once again in a bet that the US fed would postpone lift-off (this proved correct). Still, as commodities kept sliding lower we gradually lowered the local currency debt exposure to around neutral.
20
CGS FMS
Report of the Asset Manager
While the narrative of superior growth in emerging markets hold true, the gap to advanced world growth has fallen to around 2% from a peak of 5.7% in 2007. What is more, with EM GDP growth now at 4% (and even lower ex. China),population growth is a big challenge in many countries since GDP per capita growth seems to have stalled. The need to step up reforms and/or diversify economies heavily reliant on commodity export earnings is evident.
Reasons to keep up spirit
Retail fund flows may remain unfriendly but institutional inflows not least from European based investors are expected to stay supportive.
Finally, a benchmark spread of 415bps (EMBIGD) leaves room to absorb part of the expected increase in US treasury yields (10yr around 2.60% by year end) with coupons resulting in a full year return in the 3-4% range.
Despite the gloom characterizing emerging markets there are reasons to expect growth to pick up in 2016. In our base case we expect oil and base metals to stabilize and gradually recover as continued global demand growth eventually willbalance the supply side adjustment that follows dwindling fixed assets investments in mining. China will continue to slow but larger countries like Russia and Brazil already in recession have potential to make upside surprises in 2016. Astabilization of commodity prices would be helpful but in the case of Russia a lifting of EU and US imposed sanctions could materialize following an agreement on the political succession in Syria. Turning to Brazil, things can hardly get muchworse but if president Rousseff decides to/is forced to resign, this could be seen as a new beginning. Already, the local currency (BRL) has undertaken a major adjustment and (real) yields are among the highest globally which leave room forcompression should the political environment improve. Elsewhere in the region, besides Argentina, although risks remain elevated, Venezuela could see sweeping political changes benefitting the overall sentiment towards emerging markets.
Source: Global Evolution
Hard currency debt technicals are supportive - ECB’s QE to support institutional demand
Portfolio composition as of 31 December 2015, % of AUM vs. benchmark
Technicals look fairly benign despite net supply turning markedly positive (USD 20-30bn) for the first time since 2013. However, much of the “excess supply” is expected to come from GCC countries including Saudi Arabia (not in benchmark)and from Argentina should the sovereign succeed to reach a settlement with debt hold-outs (a credit positive).
21
CGS FMS
Report of the Asset Manager
Global Evolution EM Debt and FX
The objective is to achieve capital appreciation through well diversified investments in emerging and frontier market debt and FX with an absolute return focus.
Broadly speaking, 2015 was certainly not a bed of roses. Starting in H1, in Europe the Greek saga made headlines as the ruling Syriza first resisted austerity and later, in a U-turn, surrendered to the Troika’s austerity demand. Meanwhile, amidongoing China growth worries, Chinese benchmark stock indices went from Good to Stellar and by mid-June the Shanghai Shenzhen 300 had made a 12 months return of around 150%. Having ignored many warning signs of a bubble in themaking, the ensuing crash caught the media’s full attention spelling doom and gloom over the Chinese economy and global commodity markets. An unexpected 1.8% devaluation of the Chinese renminbi in August and a shift to a market basedFX fixing regime added fuel to the fire.
A new oil order governed by Saudi Arabia
In H1 oil recovered some of the losses from late 2014 and early 2015. However, in H2 2015 oil and other hard commodities tanked leaving commodity exporters in pain and the December 4 OPEC meeting dealt another blow to oil prices as itbecame clear that the organization’s mission statement to “coordinate and unify the petroleum policies of its Member Countries and ensure the stabilization of oil markets” in effect had been replaced by a new oil order governed by Saudi Arabiawith the aim to defend and expand market shares at any price.
Pegged currency regimes faced strong headwinds
As hard commodities continued lower commodity backed currencies came increasingly under pressure. A number of exporters gave up their currency peg (Kazakhstan, Azerbaijan), but a few die hard pegged regimes (Saudi Arabia, Nigeria)stayed put.
(Geo)political risks came to the fore
Dominican local fixed income was remarkably stable in 2015 as the sovereign benefitted from an improving credit story amidst low oil prices adding a fiscal dividend boost of around 0.5% of GDP. High carry and gradual yield compression drivenby fiscal consolidation, reforms and the achievement of a primary surplus combined with a stable currency versus the USD resulted in a positive performance contribution.
To be fair, some sovereign credits also suffered from homegrown problems. In Brazil and South Africa corruption charges, stalled reform momentums and fiscal paralysis were the prime focus areas, whereas oil exporting Venezuela was in aleague of its own in terms of economic disrepair. Brazil, once poster child for dynamic development, was eventually downgraded to junk.
Closer to home Syria turned into a geopolitical crisis involving not only neighboring countries but also the EU and NATO as Syrian refugees crossed the borders to EU in volumes and Turkey downed a Russian fighter jet on the Turkish-Syrianborder. The stand-off between Kiev and separatists in Eastern Ukraine remained largely unsolved, but as tensions gradually eased the media lost interest in the conflict. Ukraine finalized an investor friendly restructuring of its sovereign hardcurrency debt but defaulted on USD 3bn of debt owed to Russia.
Monetary policy divergence became a theme
Still in Europe, the European Central Bank (ECB) joined the QE club in March with an expansion and extension announcement in early December. This helped drive down core European yields in negative territory in tenors up till 5-6 years,European based institutional investors were left with little choice but to move up in duration or move down in credit quality. With no doubt this helped explain the contradiction between ongoing redemptions in EM debt dedicated retail funds anda solid institutional pipeline for hard currency EM mandates. Turning to the US, following a shaky hand and a failed attempt in September, the US Federal Reserve finally pulled the trigger on rate hikes on December 16, 2015. 10yr US treasuryyields finished the year little changed; up from 2.17% to 2.27%. However, in FX markets the dollar strengthened from EUR/USD 1.2098 to an intra-year low of EUR/USD 1.0496 but the currency pair recovered to finish the year in 1.0862. TheFederal Reserve’s broad trade weighted dollar index gained 9.7% in 2015.
Performance drivers for 2015 for the relevant sub fund
Eastern Europe performed relatively well in the stormy seas of Emerging markets in 2015. The Greek crisis only had a temporary impact on the region while the ECB QE gave it a firm anchor. Local bonds of Hungary, Poland and Romania didrelatively well as central banks eased monetary policy further amidst very low inflation. Our exposure in Eastern Europe was on average the highest of all the regions and we still like the exposure into 2016 given the monetary policy outlook forboth the ECB and the central banks of the region.
Last year’s market environment
Investment Objective
22
CGS FMS
Report of the Asset Manager
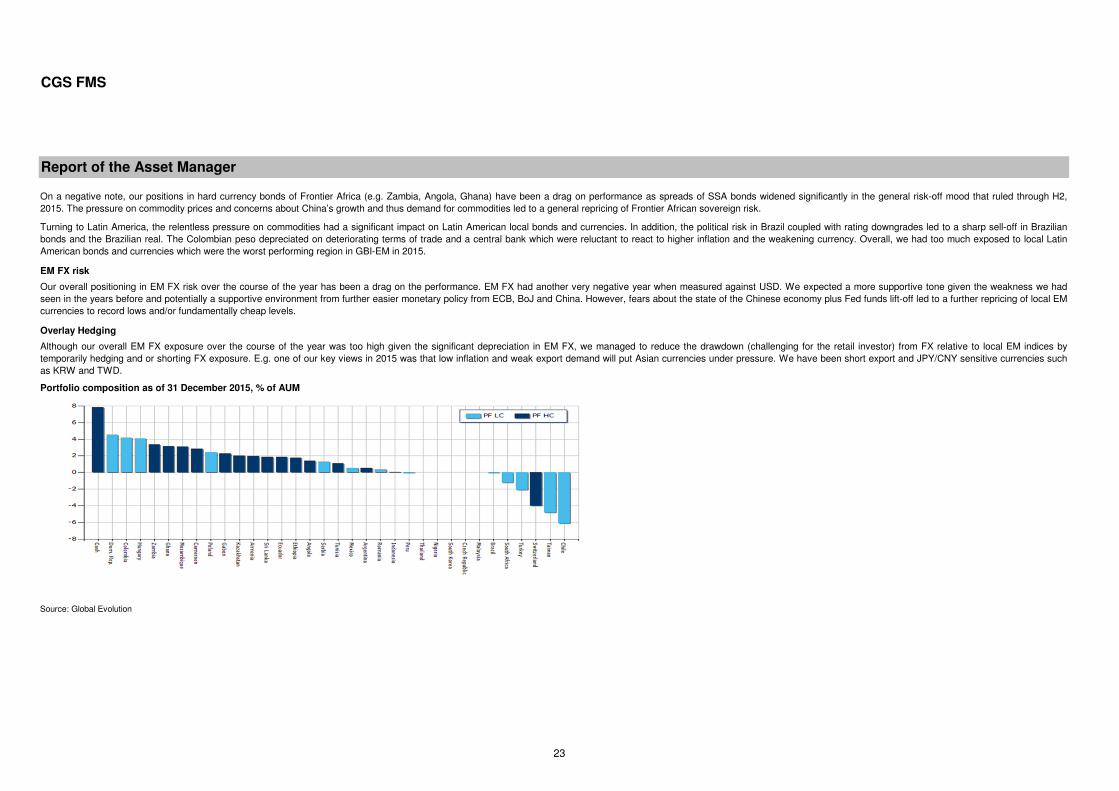
Our overall positioning in EM FX risk over the course of the year has been a drag on the performance. EM FX had another very negative year when measured against USD. We expected a more supportive tone given the weakness we hadseen in the years before and potentially a supportive environment from further easier monetary policy from ECB, BoJ and China. However, fears about the state of the Chinese economy plus Fed funds lift-off led to a further repricing of local EMcurrencies to record lows and/or fundamentally cheap levels.
Overlay Hedging
Source: Global Evolution
Although our overall EM FX exposure over the course of the year was too high given the significant depreciation in EM FX, we managed to reduce the drawdown (challenging for the retail investor) from FX relative to local EM indices bytemporarily hedging and or shorting FX exposure. E.g. one of our key views in 2015 was that low inflation and weak export demand will put Asian currencies under pressure. We have been short export and JPY/CNY sensitive currencies suchas KRW and TWD.
Portfolio composition as of 31 December 2015, % of AUM
On a negative note, our positions in hard currency bonds of Frontier Africa (e.g. Zambia, Angola, Ghana) have been a drag on performance as spreads of SSA bonds widened significantly in the general risk-off mood that ruled through H2,2015. The pressure on commodity prices and concerns about China’s growth and thus demand for commodities led to a general repricing of Frontier African sovereign risk.
Turning to Latin America, the relentless pressure on commodities had a significant impact on Latin American local bonds and currencies. In addition, the political risk in Brazil coupled with rating downgrades led to a sharp sell-off in Brazilianbonds and the Brazilian real. The Colombian peso depreciated on deteriorating terms of trade and a central bank which were reluctant to react to higher inflation and the weakening currency. Overall, we had too much exposed to local LatinAmerican bonds and currencies which were the worst performing region in GBI-EM in 2015.
EM FX risk
23
CGS FMS
Report of the Asset Manager
Reasons to keep up spirit
Despite the gloom characterizing emerging markets there are reasons to expect growth to pick up in 2016. In our base case we expect oil and base metals to stabilize and gradually recover as continued global demand growth eventually willbalance the supply side adjustment that follows dwindling fixed assets investments in mining. China will continue to slow but larger countries like Russia and Brazil already in recession have potential to make upside surprises in 2016. Astabilization of commodity prices would be helpful but in the case of Russia a lifting of EU and US imposed sanctions could materialize following an agreement on the political succession in Syria. Turning to Brazil, things can hardly get muchworse but if president Rousseff decides to/is forced to resign, this could be seen as a new beginning. Already, the local currency (BRL) has undertaken a major adjustment and (real) yields are among the highest globally which leave room forcompression should the political environment improve. Elsewhere in the region, besides Argentina, although risks remain elevated, Venezuela could see sweeping political changes benefitting the overall sentiment towards emerging markets.
Hard currency debt technicals are supportive - ECB’s QE to support institutional demand
Technicals look fairly benign despite net supply turning markedly positive (USD 20-30bn) for the first time since 2013. However, much of the “excess supply” is expected to come from GCC countries including Saudi Arabia (not in benchmark)and from Argentina should the sovereign succeed to reach a settlement with debt hold-outs (a credit positive).
Retail fund flows may remain unfriendly but institutional inflows not least from European based investors are expected to stay supportive.
Outlook for 2016
2016 poses a lot of challenges… but also opportunities. Growth models are being questioned, geopolitical issues in Syria, Iraq and surrounding countries remain unsolved and idiosyncratic risk drivers are lining up not least in Venezuela andBrazil. In both countries, Vox Populi risks are hard to ignore as both economies continue to suffer with Brazilians feed up with corruption and Venezuelans now paying the price for years of ideologically inspired failure and economicmismanagement. Nevertheless, despite the risk of people taking to the street and subsequent uncertainty, we sense that political and economic changes are in the air for Latin America. In this respect Argentina may become the posterchild of2016 and although risks remain elevated, Venezuela could see sweeping political changes.
While the narrative of superior growth in emerging markets hold true, the gap to advanced world growth has fallen to around 2% from a peak of 5.7% in 2007. What is more, with EM GDP growth now at 4% (and even lower ex. China),population growth is a big challenge in many countries since GDP per capita growth seems to have stalled. The need to step up reforms and/or diversify economies heavily reliant on commodity export earnings is evident.
Finally, a benchmark spread of 415bps (EMBIGD) leaves room to absorb part of the expected increase in US treasury yields (10yr around 2.60% by year end).
24
CGS FMS
Report of the Asset Manager
Global Evolution Emerging Frontier
A new oil order governed by Saudi Arabia
Pegged currency regimes faced strong headwinds
As hard commodities continued lower commodity backed currencies came increasingly under pressure. A number of exporters gave up their currency peg (Kazakhstan, Azerbaijan), but a few die hard pegged regimes (Saudi Arabia, Nigeria)stayed put.
In H1 oil recovered some of the losses from late 2014 and early 2015. However, in H2 2015 oil and other hard commodities tanked leaving commodity exporters in pain and the December 4 OPEC meeting dealt another blow to oil prices as itbecame clear that the organization’s mission statement to “coordinate and unify the petroleum policies of its Member Countries and ensure the stabilization of oil markets” in effect had been replaced by a new oil order governed by Saudi Arabiawith the aim to defend and expand market shares at any price.
Investment Objective
The objective of the Global Evolution Emerging Frontier strategy is to create attractive returns by utilizing a non-benchmark focused and diversified strategy within sovereign frontier emerging markets globally. The fund invests in hard currencyand local currency instruments as well as foreign exchange. To achieve the investment objective Global Evolution will use a range of financial instruments (local currency debt instruments, hard currency debt instruments and foreign exchange)and derivative financial instruments (interest rate futures, interest rate swaps, total return swaps, credit default swaps, FX forwards, FX options and non-deliverable forwards).
Last year’s market environment
Broadly speaking, 2015 was certainly not a bed of roses. Starting in H1, in Europe the Greek saga made headlines as the ruling Syriza first resisted austerity and later, in a U-turn, surrendered to the Troika’s austerity demand. Meanwhile, amidongoing China growth worries, Chinese benchmark stock indices went from Good to Stellar and by mid-June the Shanghai Shenzhen 300 had made a 12 months return of around 150%. Having ignored many warning signs of a bubble in themaking, the ensuing crash caught the media’s full attention spelling doom and gloom over the Chinese economy and global commodity markets. An unexpected 1.8% devaluation of the Chinese renminbi in August and a shift to a market basedFX fixing regime added fuel to the fire.
10yr US treasury yields finished the year little changed; up from 2.17% to 2.27%. However, in FX markets the dollar strengthened from EUR/USD 1.2098 to an intra-year low of EUR/USD 1.0496 but the currency pair recovered to finish the yearin 1.0862. The Federal Reserve’s broad trade weighted dollar index gained 9.7% in 2015.
To be fair, some sovereign credits also suffered from homegrown problems. In Brazil and South Africa corruption charges, stalled reform momentums and fiscal paralysis were the prime focus areas, whereas oil exporting Venezuela was in aleague of its own in terms of economic disrepair. Brazil, once poster child for dynamic development, was eventually downgraded to junk.
Closer to home Syria turned into a geopolitical crisis involving not only neighboring countries but also the EU and NATO as Syrian refugees crossed the borders to EU in volumes and Turkey downed a Russian fighter jet on the Turkish-Syrianborder. The stand-off between Kiev and separatists in Eastern Ukraine remained largely unsolved, but as tensions gradually eased the media lost interest in the conflict. Ukraine finalized an investor friendly restructuring of its sovereign hardcurrency debt but defaulted on USD 3bn of debt owed to Russia.
Monetary policy divergence became a theme
Still in Europe, the European Central Bank (ECB) joined the QE club in March with an expansion and extension announcement in early December. This helped drive down core European yields in negative territory in tenors up till 5-6 years,European based institutional investors were left with little choice but to move up in duration or move down in credit quality. With no doubt this helped explain the contradiction between ongoing redemptions in EM debt dedicated retail funds anda solid institutional pipeline for hard currency EM mandates. Turning to the US, following a shaky hand and a failed attempt in September, the US Federal Reserve finally pulled the trigger on rate hikes on December 16, 2015.
The trade weighted dollar index gained almost 9%
(Geo)political risks came to the fore
25
CGS FMS
Report of the Asset Manager
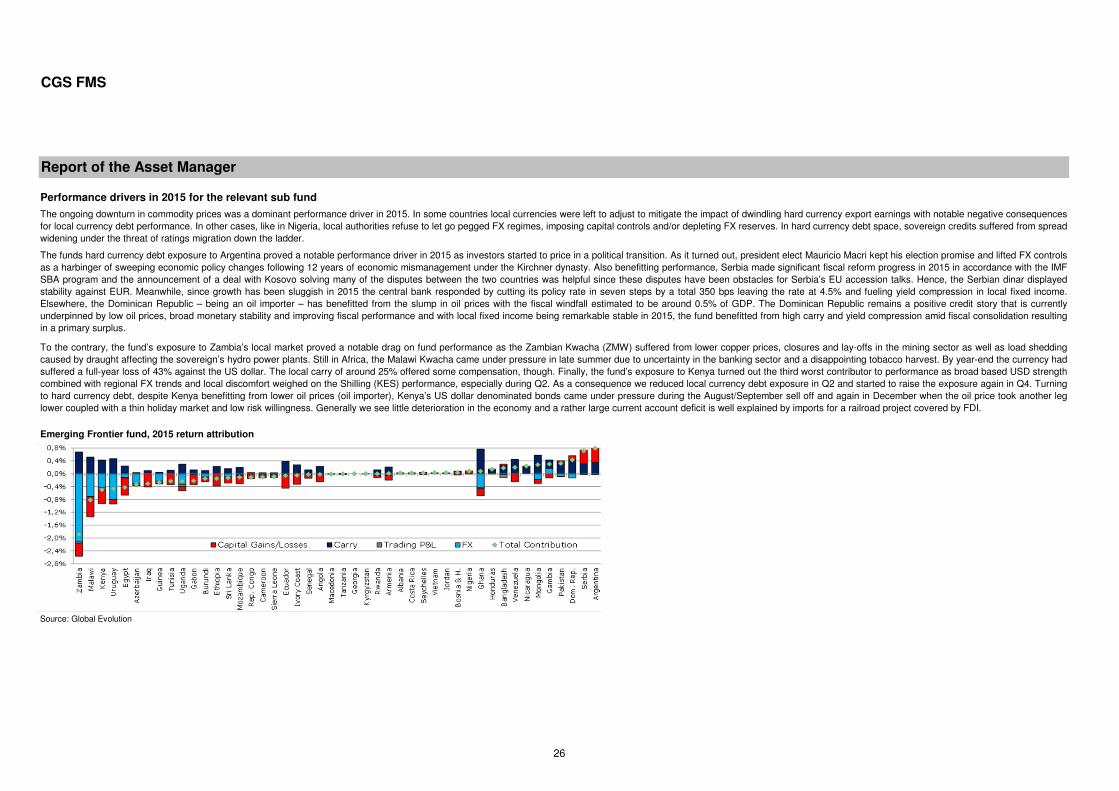
Emerging Frontier fund, 2015 return attribution
Source: Global Evolution
To the contrary, the fund’s exposure to Zambia’s local market proved a notable drag on fund performance as the Zambian Kwacha (ZMW) suffered from lower copper prices, closures and lay-offs in the mining sector as well as load sheddingcaused by draught affecting the sovereign’s hydro power plants. Still in Africa, the Malawi Kwacha came under pressure in late summer due to uncertainty in the banking sector and a disappointing tobacco harvest. By year-end the currency hadsuffered a full-year loss of 43% against the US dollar. The local carry of around 25% offered some compensation, though. Finally, the fund’s exposure to Kenya turned out the third worst contributor to performance as broad based USD strengthcombined with regional FX trends and local discomfort weighed on the Shilling (KES) performance, especially during Q2. As a consequence we reduced local currency debt exposure in Q2 and started to raise the exposure again in Q4. Turningto hard currency debt, despite Kenya benefitting from lower oil prices (oil importer), Kenya’s US dollar denominated bonds came under pressure during the August/September sell off and again in December when the oil price took another leglower coupled with a thin holiday market and low risk willingness. Generally we see little deterioration in the economy and a rather large current account deficit is well explained by imports for a railroad project covered by FDI.
Performance drivers in 2015 for the relevant sub fund
The ongoing downturn in commodity prices was a dominant performance driver in 2015. In some countries local currencies were left to adjust to mitigate the impact of dwindling hard currency export earnings with notable negative consequencesfor local currency debt performance. In other cases, like in Nigeria, local authorities refuse to let go pegged FX regimes, imposing capital controls and/or depleting FX reserves. In hard currency debt space, sovereign credits suffered from spreadwidening under the threat of ratings migration down the ladder.
The funds hard currency debt exposure to Argentina proved a notable performance driver in 2015 as investors started to price in a political transition. As it turned out, president elect Mauricio Macri kept his election promise and lifted FX controlsas a harbinger of sweeping economic policy changes following 12 years of economic mismanagement under the Kirchner dynasty. Also benefitting performance, Serbia made significant fiscal reform progress in 2015 in accordance with the IMFSBA program and the announcement of a deal with Kosovo solving many of the disputes between the two countries was helpful since these disputes have been obstacles for Serbia’s EU accession talks. Hence, the Serbian dinar displayedstability against EUR. Meanwhile, since growth has been sluggish in 2015 the central bank responded by cutting its policy rate in seven steps by a total 350 bps leaving the rate at 4.5% and fueling yield compression in local fixed income.Elsewhere, the Dominican Republic – being an oil importer – has benefitted from the slump in oil prices with the fiscal windfall estimated to be around 0.5% of GDP. The Dominican Republic remains a positive credit story that is currentlyunderpinned by low oil prices, broad monetary stability and improving fiscal performance and with local fixed income being remarkable stable in 2015, the fund benefitted from high carry and yield compression amid fiscal consolidation resultingin a primary surplus.
26
CGS FMS
Report of the Asset Manager
Source: Global Evolution
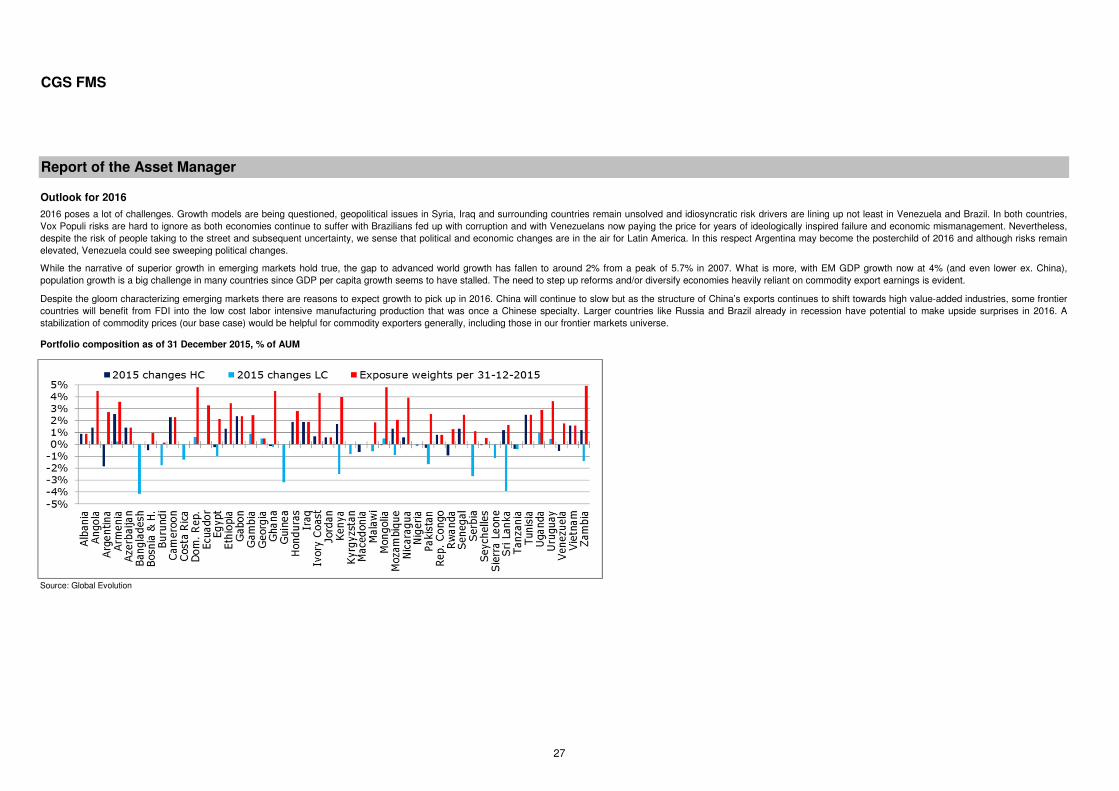
Outlook for 2016
2016 poses a lot of challenges. Growth models are being questioned, geopolitical issues in Syria, Iraq and surrounding countries remain unsolved and idiosyncratic risk drivers are lining up not least in Venezuela and Brazil. In both countries,Vox Populi risks are hard to ignore as both economies continue to suffer with Brazilians fed up with corruption and with Venezuelans now paying the price for years of ideologically inspired failure and economic mismanagement. Nevertheless,despite the risk of people taking to the street and subsequent uncertainty, we sense that political and economic changes are in the air for Latin America. In this respect Argentina may become the posterchild of 2016 and although risks remainelevated, Venezuela could see sweeping political changes.
While the narrative of superior growth in emerging markets hold true, the gap to advanced world growth has fallen to around 2% from a peak of 5.7% in 2007. What is more, with EM GDP growth now at 4% (and even lower ex. China),population growth is a big challenge in many countries since GDP per capita growth seems to have stalled. The need to step up reforms and/or diversify economies heavily reliant on commodity export earnings is evident.
Despite the gloom characterizing emerging markets there are reasons to expect growth to pick up in 2016. China will continue to slow but as the structure of China’s exports continues to shift towards high value-added industries, some frontiercountries will benefit from FDI into the low cost labor intensive manufacturing production that was once a Chinese specialty. Larger countries like Russia and Brazil already in recession have potential to make upside surprises in 2016. Astabilization of commodity prices (our base case) would be helpful for commodity exporters generally, including those in our frontier markets universe.
Portfolio composition as of 31 December 2015, % of AUM
27
CGS FMS
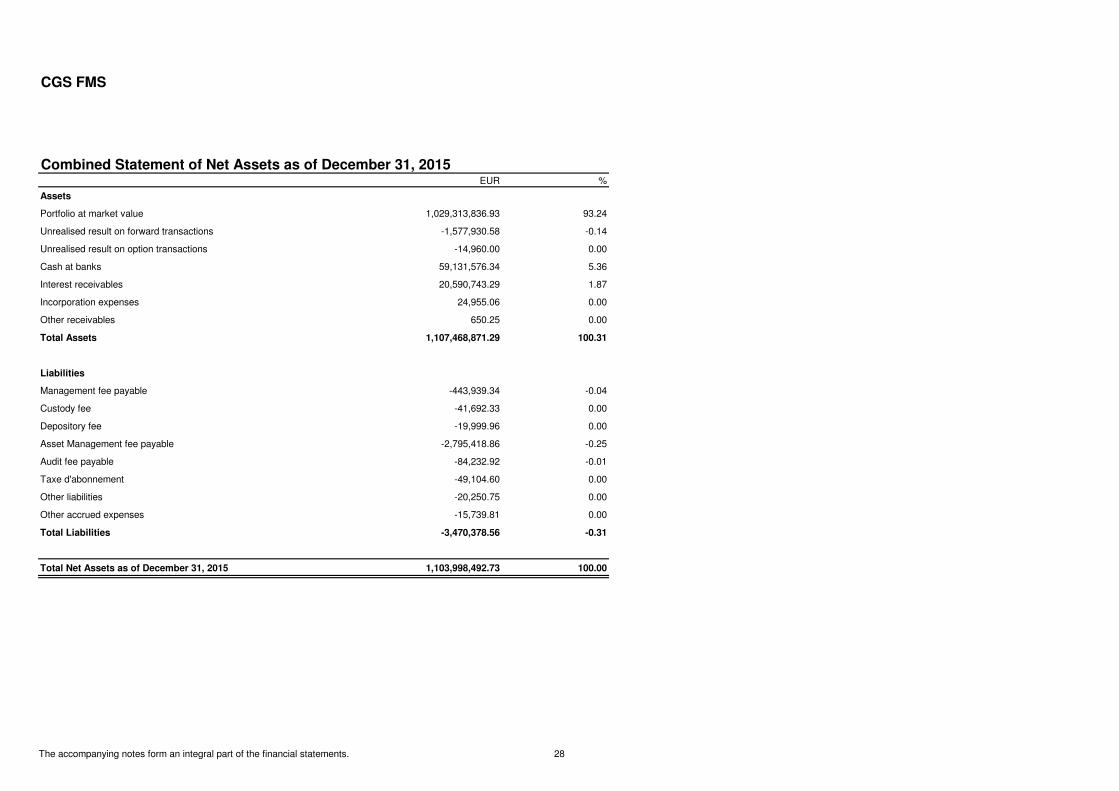
Combined Statement of Net Assets as of December 31, 2015EUR %
Assets
Portfolio at market value 1,029,313,836.93 93.24
Unrealised result on forward transactions -1,577,930.58 -0.14
Unrealised result on option transactions -14,960.00 0.00
Cash at banks 59,131,576.34 5.36
Interest receivables 20,590,743.29 1.87
Incorporation expenses 24,955.06 0.00
Other receivables 650.25 0.00
Total Assets 1,107,468,871.29 100.31
Liabilities
Management fee payable -443,939.34 -0.04
Custody fee -41,692.33 0.00
Depository fee -19,999.96 0.00
Asset Management fee payable -2,795,418.86 -0.25
Audit fee payable -84,232.92 -0.01
Taxe d'abonnement -49,104.60 0.00
Other liabilities -20,250.75 0.00
Other accrued expenses -15,739.81 0.00
Total Liabilities -3,470,378.56 -0.31
Total Net Assets as of December 31, 2015 1,103,998,492.73 100.00
The accompanying notes form an integral part of the financial statements. 28
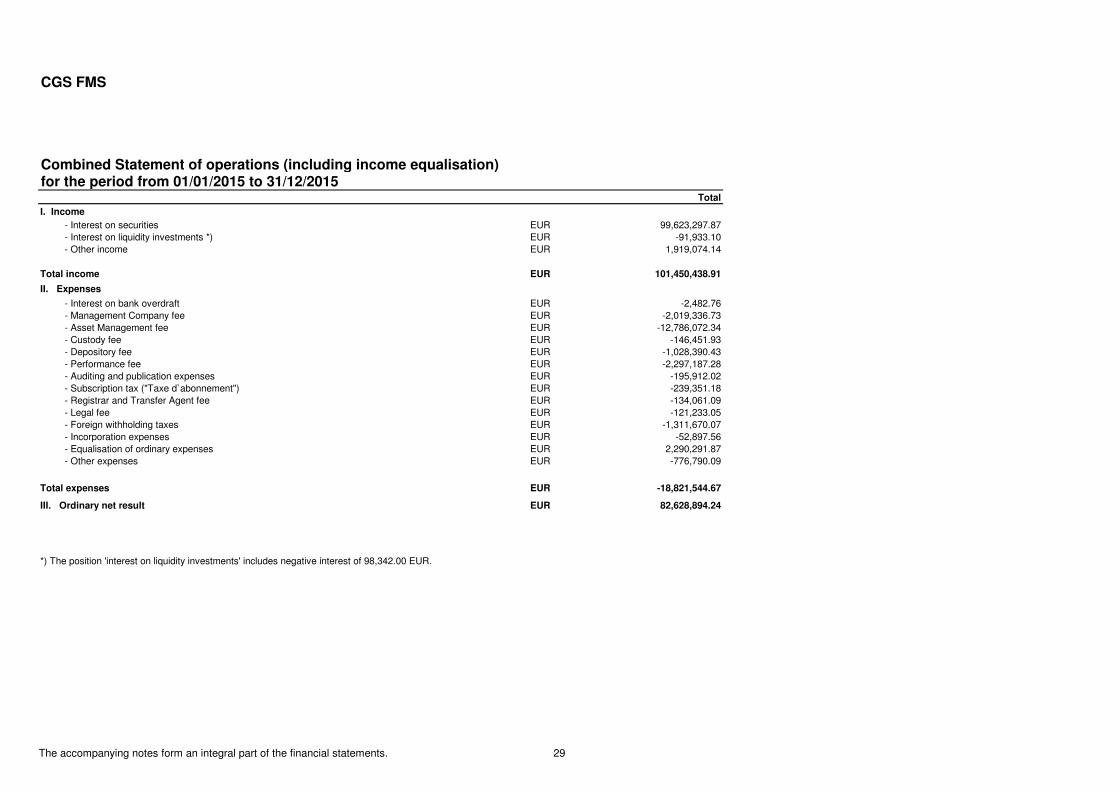
CGS FMS
Combined Statement of operations (including income equalisation)for the period from 01/01/2015 to 31/12/2015
Total
I. Income
- Interest on securities EUR 99,623,297.87 - Interest on liquidity investments *) EUR -91,933.10 - Other income EUR 1,919,074.14
Total income EUR 101,450,438.91
II. Expenses
- Interest on bank overdraft EUR -2,482.76 - Management Company fee EUR -2,019,336.73 - Asset Management fee EUR -12,786,072.34 - Custody fee EUR -146,451.93 - Depository fee EUR -1,028,390.43 - Performance fee EUR -2,297,187.28 - Auditing and publication expenses EUR -195,912.02 - Subscription tax ("Taxe d`abonnement") EUR -239,351.18 - Registrar and Transfer Agent fee EUR -134,061.09 - Legal fee EUR -121,233.05 - Foreign withholding taxes EUR -1,311,670.07 - Incorporation expenses EUR -52,897.56 - Equalisation of ordinary expenses EUR 2,290,291.87 - Other expenses EUR -776,790.09
Total expenses EUR -18,821,544.67
III. Ordinary net result EUR 82,628,894.24
*) The position 'interest on liquidity investments' includes negative interest of 98,342.00 EUR.
The accompanying notes form an integral part of the financial statements. 29
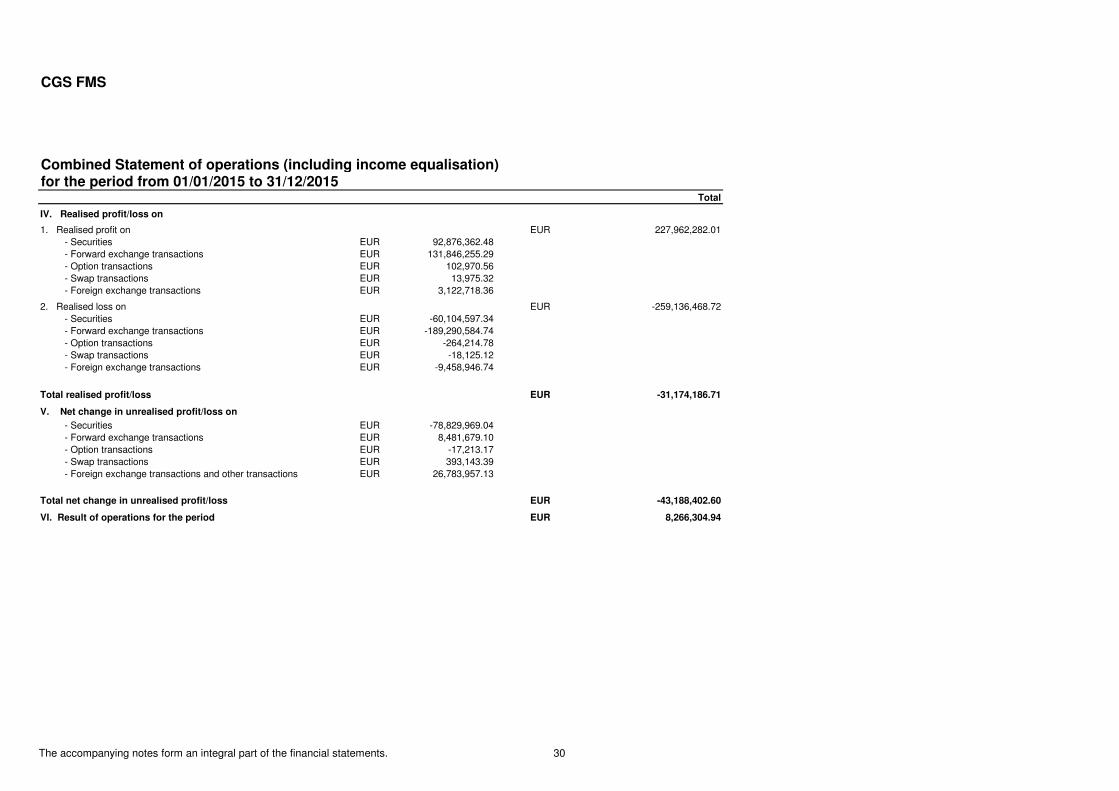
CGS FMS
Combined Statement of operations (including income equalisation)for the period from 01/01/2015 to 31/12/2015
Total
IV. Realised profit/loss on
1. Realised profit on EUR 227,962,282.01 - Securities EUR 92,876,362.48 - Forward exchange transactions EUR 131,846,255.29 - Option transactions EUR 102,970.56 - Swap transactions EUR 13,975.32 - Foreign exchange transactions EUR 3,122,718.36
2. Realised loss on EUR -259,136,468.72 - Securities EUR -60,104,597.34 - Forward exchange transactions EUR -189,290,584.74 - Option transactions EUR -264,214.78 - Swap transactions EUR -18,125.12 - Foreign exchange transactions EUR -9,458,946.74
Total realised profit/loss EUR -31,174,186.71
V. Net change in unrealised profit/loss on
- Securities EUR -78,829,969.04 - Forward exchange transactions EUR 8,481,679.10 - Option transactions EUR -17,213.17 - Swap transactions EUR 393,143.39 - Foreign exchange transactions and other transactions EUR 26,783,957.13
Total net change in unrealised profit/loss EUR -43,188,402.60
VI. Result of operations for the period EUR 8,266,304.94
The accompanying notes form an integral part of the financial statements. 30
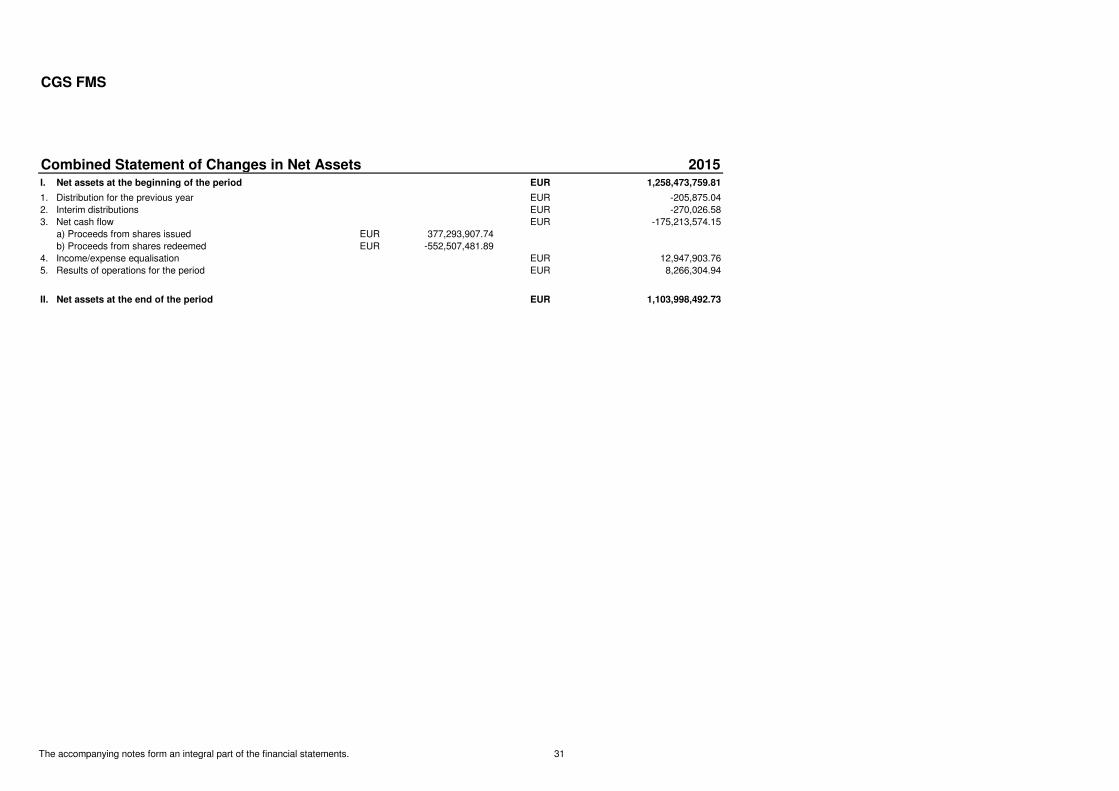
CGS FMS
Combined Statement of Changes in Net Assets 2015I. Net assets at the beginning of the period EUR 1,258,473,759.81
1. Distribution for the previous year EUR -205,875.042. Interim distributions EUR -270,026.583. Net cash flow EUR -175,213,574.15 a) Proceeds from shares issued EUR 377,293,907.74 b) Proceeds from shares redeemed EUR -552,507,481.894. Income/expense equalisation EUR 12,947,903.765. Results of operations for the period EUR 8,266,304.94
II. Net assets at the end of the period EUR 1,103,998,492.73
The accompanying notes form an integral part of the financial statements. 31
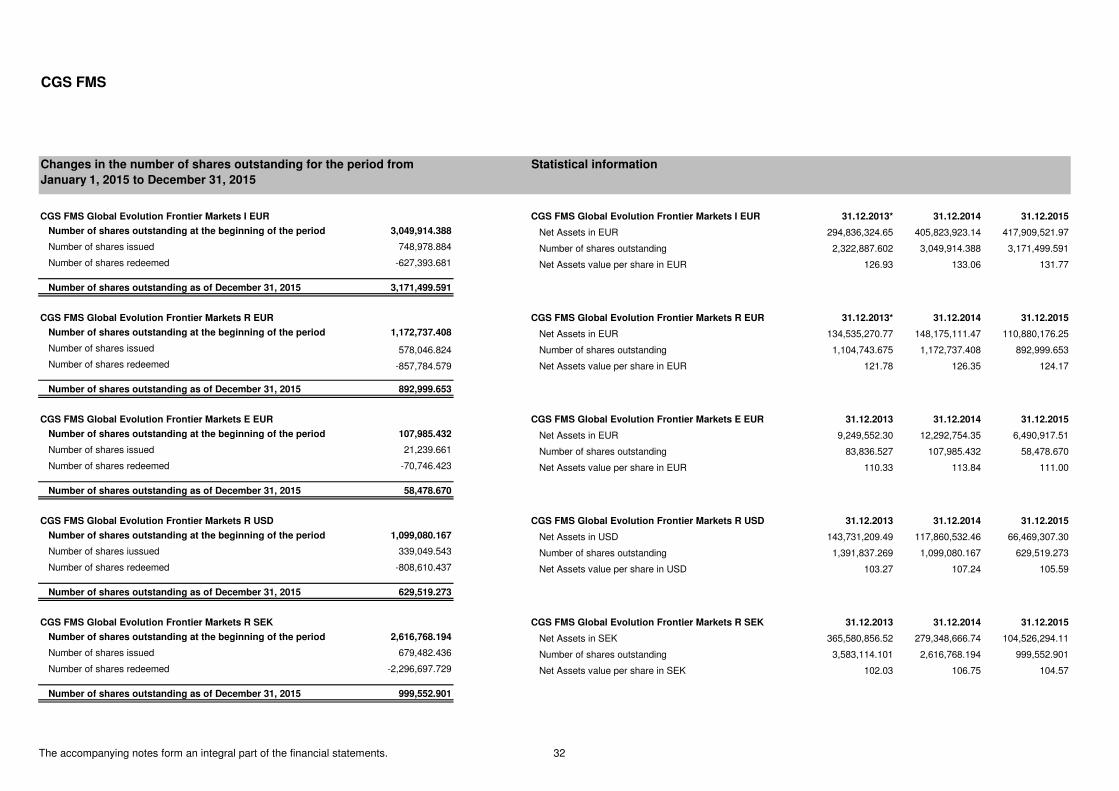
CGS FMS
CGS FMS Global Evolution Frontier Markets I EUR CGS FMS Global Evolution Frontier Markets I EUR 31.12.2013* 31.12.2014 31.12.2015
Number of shares outstanding at the beginning of the period 3,049,914.388 Net Assets in EUR 294,836,324.65 405,823,923.14 417,909,521.97
Number of shares issued 748,978.884 Number of shares outstanding 2,322,887.602 3,049,914.388 3,171,499.591
Number of shares redeemed -627,393.681 Net Assets value per share in EUR 126.93 133.06 131.77
Number of shares outstanding as of December 31, 2015 3,171,499.591
CGS FMS Global Evolution Frontier Markets R EUR CGS FMS Global Evolution Frontier Markets R EUR 31.12.2013* 31.12.2014 31.12.2015
Number of shares outstanding at the beginning of the period 1,172,737.408 Net Assets in EUR 134,535,270.77 148,175,111.47 110,880,176.25
Number of shares issued 578,046.824 Number of shares outstanding 1,104,743.675 1,172,737.408 892,999.653
Number of shares redeemed -857,784.579 Net Assets value per share in EUR 121.78 126.35 124.17
Number of shares outstanding as of December 31, 2015 892,999.653
CGS FMS Global Evolution Frontier Markets E EUR CGS FMS Global Evolution Frontier Markets E EUR 31.12.2013 31.12.2014 31.12.2015
Number of shares outstanding at the beginning of the period 107,985.432 Net Assets in EUR 9,249,552.30 12,292,754.35 6,490,917.51
Number of shares issued 21,239.661 Number of shares outstanding 83,836.527 107,985.432 58,478.670
Number of shares redeemed -70,746.423 Net Assets value per share in EUR 110.33 113.84 111.00
Number of shares outstanding as of December 31, 2015 58,478.670
CGS FMS Global Evolution Frontier Markets R USD CGS FMS Global Evolution Frontier Markets R USD 31.12.2013 31.12.2014 31.12.2015
Number of shares outstanding at the beginning of the period 1,099,080.167 Net Assets in USD 143,731,209.49 117,860,532.46 66,469,307.30
Number of shares iussued 339,049.543 Number of shares outstanding 1,391,837.269 1,099,080.167 629,519.273
Number of shares redeemed -808,610.437 Net Assets value per share in USD 103.27 107.24 105.59
Number of shares outstanding as of December 31, 2015 629,519.273
CGS FMS Global Evolution Frontier Markets R SEK CGS FMS Global Evolution Frontier Markets R SEK 31.12.2013 31.12.2014 31.12.2015
Number of shares outstanding at the beginning of the period 2,616,768.194 Net Assets in SEK 365,580,856.52 279,348,666.74 104,526,294.11
Number of shares issued 679,482.436 Number of shares outstanding 3,583,114.101 2,616,768.194 999,552.901
Number of shares redeemed -2,296,697.729 Net Assets value per share in SEK 102.03 106.75 104.57
Number of shares outstanding as of December 31, 2015 999,552.901
Changes in the number of shares outstanding for the period from
January 1, 2015 to December 31, 2015
Statistical information
The accompanying notes form an integral part of the financial statements. 32
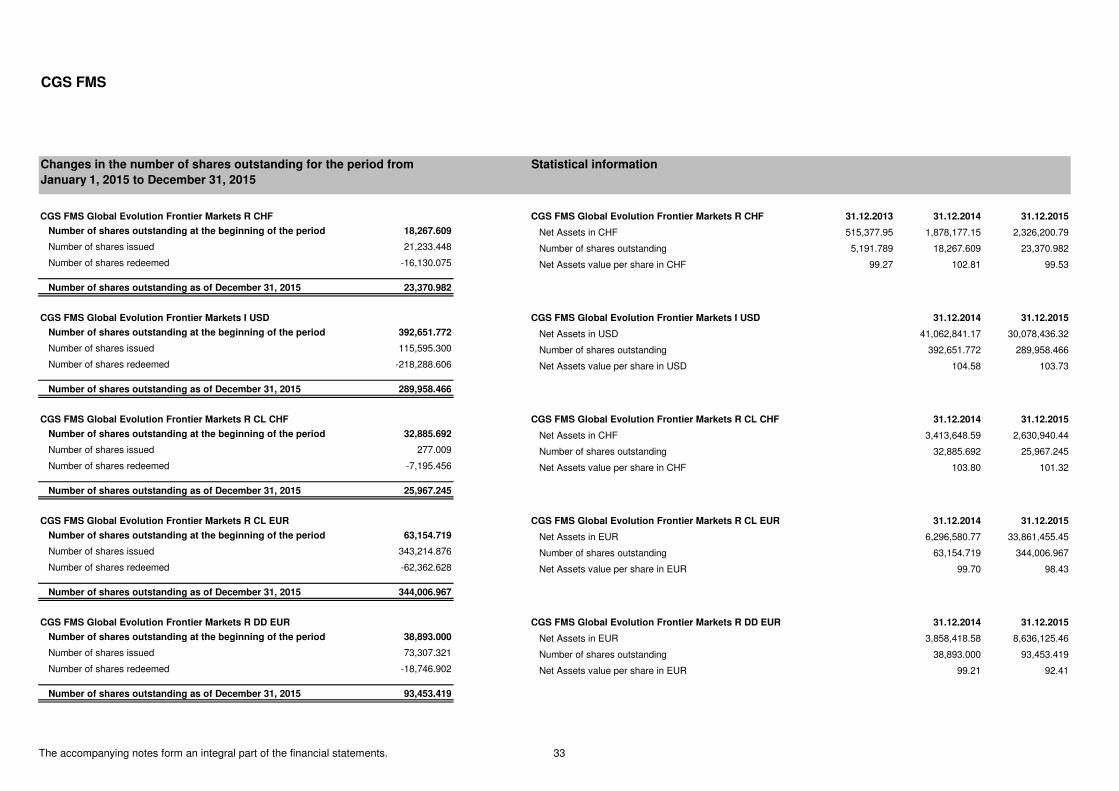
CGS FMS
Changes in the number of shares outstanding for the period from
January 1, 2015 to December 31, 2015
Statistical information
CGS FMS Global Evolution Frontier Markets R CHF CGS FMS Global Evolution Frontier Markets R CHF 31.12.2013 31.12.2014 31.12.2015
Number of shares outstanding at the beginning of the period 18,267.609 Net Assets in CHF 515,377.95 1,878,177.15 2,326,200.79
Number of shares issued 21,233.448 Number of shares outstanding 5,191.789 18,267.609 23,370.982
Number of shares redeemed -16,130.075 Net Assets value per share in CHF 99.27 102.81 99.53
Number of shares outstanding as of December 31, 2015 23,370.982
CGS FMS Global Evolution Frontier Markets I USD CGS FMS Global Evolution Frontier Markets I USD 31.12.2014 31.12.2015
Number of shares outstanding at the beginning of the period 392,651.772 Net Assets in USD 41,062,841.17 30,078,436.32
Number of shares issued 115,595.300 Number of shares outstanding 392,651.772 289,958.466
Number of shares redeemed -218,288.606 Net Assets value per share in USD 104.58 103.73
Number of shares outstanding as of December 31, 2015 289,958.466
CGS FMS Global Evolution Frontier Markets R CL CHF CGS FMS Global Evolution Frontier Markets R CL CHF 31.12.2014 31.12.2015
Number of shares outstanding at the beginning of the period 32,885.692 Net Assets in CHF 3,413,648.59 2,630,940.44
Number of shares issued 277.009 Number of shares outstanding 32,885.692 25,967.245
Number of shares redeemed -7,195.456 Net Assets value per share in CHF 103.80 101.32
Number of shares outstanding as of December 31, 2015 25,967.245
CGS FMS Global Evolution Frontier Markets R CL EUR CGS FMS Global Evolution Frontier Markets R CL EUR 31.12.2014 31.12.2015
Number of shares outstanding at the beginning of the period 63,154.719 Net Assets in EUR 6,296,580.77 33,861,455.45
Number of shares issued 343,214.876 Number of shares outstanding 63,154.719 344,006.967
Number of shares redeemed -62,362.628 Net Assets value per share in EUR 99.70 98.43
Number of shares outstanding as of December 31, 2015 344,006.967
CGS FMS Global Evolution Frontier Markets R DD EUR CGS FMS Global Evolution Frontier Markets R DD EUR 31.12.2014 31.12.2015
Number of shares outstanding at the beginning of the period 38,893.000 Net Assets in EUR 3,858,418.58 8,636,125.46
Number of shares issued 73,307.321 Number of shares outstanding 38,893.000 93,453.419
Number of shares redeemed -18,746.902 Net Assets value per share in EUR 99.21 92.41
Number of shares outstanding as of December 31, 2015 93,453.419
The accompanying notes form an integral part of the financial statements. 33
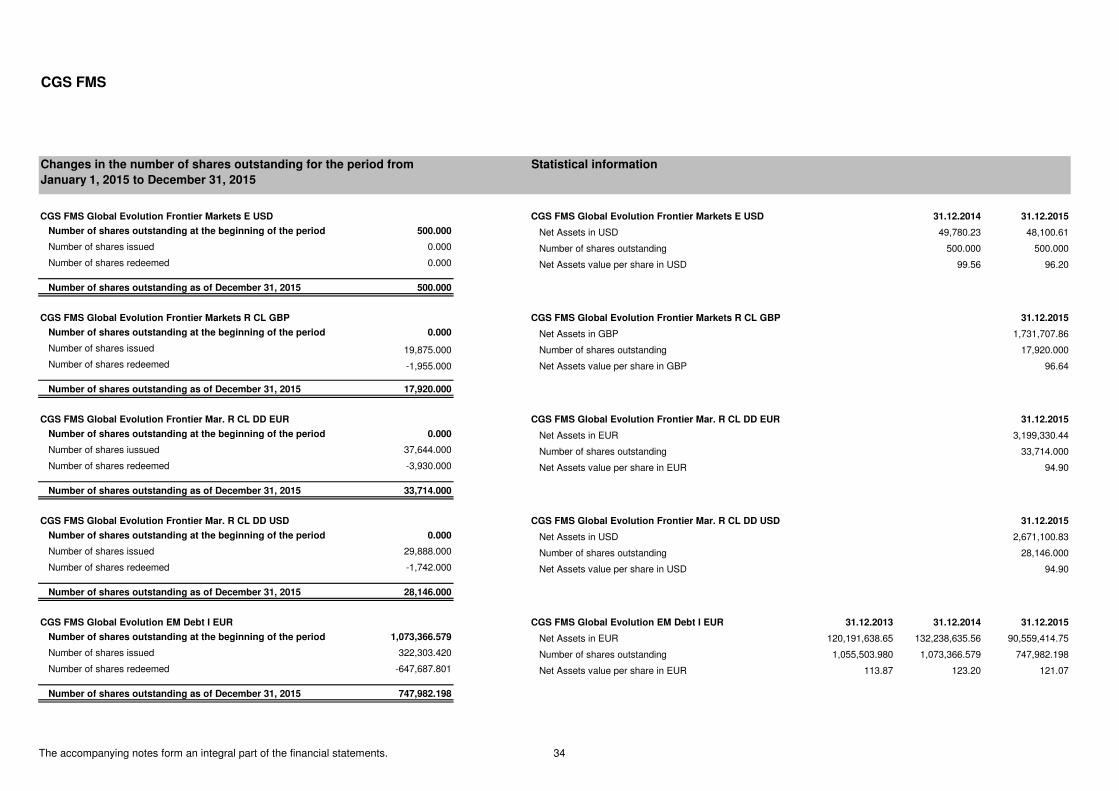
CGS FMS
Changes in the number of shares outstanding for the period from
January 1, 2015 to December 31, 2015
Statistical information
CGS FMS Global Evolution Frontier Markets E USD CGS FMS Global Evolution Frontier Markets E USD 31.12.2014 31.12.2015
Number of shares outstanding at the beginning of the period 500.000 Net Assets in USD 49,780.23 48,100.61
Number of shares issued 0.000 Number of shares outstanding 500.000 500.000
Number of shares redeemed 0.000 Net Assets value per share in USD 99.56 96.20
Number of shares outstanding as of December 31, 2015 500.000
CGS FMS Global Evolution Frontier Markets R CL GBP CGS FMS Global Evolution Frontier Markets R CL GBP 31.12.2015
Number of shares outstanding at the beginning of the period 0.000 Net Assets in GBP 1,731,707.86
Number of shares issued 19,875.000 Number of shares outstanding 17,920.000
Number of shares redeemed -1,955.000 Net Assets value per share in GBP 96.64
Number of shares outstanding as of December 31, 2015 17,920.000
CGS FMS Global Evolution Frontier Mar. R CL DD EUR CGS FMS Global Evolution Frontier Mar. R CL DD EUR 31.12.2015
Number of shares outstanding at the beginning of the period 0.000 Net Assets in EUR 3,199,330.44
Number of shares iussued 37,644.000 Number of shares outstanding 33,714.000
Number of shares redeemed -3,930.000 Net Assets value per share in EUR 94.90
Number of shares outstanding as of December 31, 2015 33,714.000
CGS FMS Global Evolution Frontier Mar. R CL DD USD CGS FMS Global Evolution Frontier Mar. R CL DD USD 31.12.2015
Number of shares outstanding at the beginning of the period 0.000 Net Assets in USD 2,671,100.83
Number of shares issued 29,888.000 Number of shares outstanding 28,146.000
Number of shares redeemed -1,742.000 Net Assets value per share in USD 94.90
Number of shares outstanding as of December 31, 2015 28,146.000
CGS FMS Global Evolution EM Debt I EUR CGS FMS Global Evolution EM Debt I EUR 31.12.2013 31.12.2014 31.12.2015
Number of shares outstanding at the beginning of the period 1,073,366.579 Net Assets in EUR 120,191,638.65 132,238,635.56 90,559,414.75
Number of shares issued 322,303.420 Number of shares outstanding 1,055,503.980 1,073,366.579 747,982.198
Number of shares redeemed -647,687.801 Net Assets value per share in EUR 113.87 123.20 121.07
Number of shares outstanding as of December 31, 2015 747,982.198
The accompanying notes form an integral part of the financial statements. 34
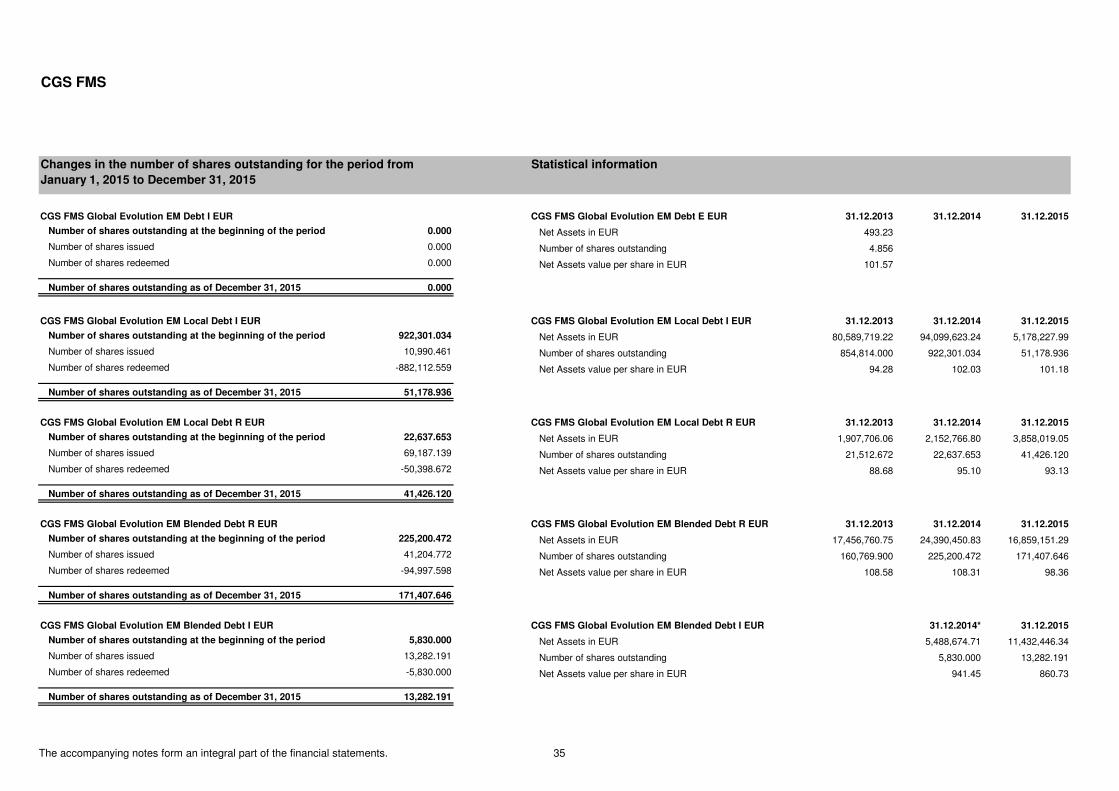
CGS FMS
Changes in the number of shares outstanding for the period from
January 1, 2015 to December 31, 2015
Statistical information
CGS FMS Global Evolution EM Debt I EUR CGS FMS Global Evolution EM Debt E EUR 31.12.2013 31.12.2014 31.12.2015
Number of shares outstanding at the beginning of the period 0.000 Net Assets in EUR 493.23
Number of shares issued 0.000 Number of shares outstanding 4.856
Number of shares redeemed 0.000 Net Assets value per share in EUR 101.57
Number of shares outstanding as of December 31, 2015 0.000
CGS FMS Global Evolution EM Local Debt I EUR CGS FMS Global Evolution EM Local Debt I EUR 31.12.2013 31.12.2014 31.12.2015
Number of shares outstanding at the beginning of the period 922,301.034 Net Assets in EUR 80,589,719.22 94,099,623.24 5,178,227.99
Number of shares issued 10,990.461 Number of shares outstanding 854,814.000 922,301.034 51,178.936
Number of shares redeemed -882,112.559 Net Assets value per share in EUR 94.28 102.03 101.18
Number of shares outstanding as of December 31, 2015 51,178.936
CGS FMS Global Evolution EM Local Debt R EUR CGS FMS Global Evolution EM Local Debt R EUR 31.12.2013 31.12.2014 31.12.2015
Number of shares outstanding at the beginning of the period 22,637.653 Net Assets in EUR 1,907,706.06 2,152,766.80 3,858,019.05
Number of shares issued 69,187.139 Number of shares outstanding 21,512.672 22,637.653 41,426.120
Number of shares redeemed -50,398.672 Net Assets value per share in EUR 88.68 95.10 93.13
Number of shares outstanding as of December 31, 2015 41,426.120
CGS FMS Global Evolution EM Blended Debt R EUR CGS FMS Global Evolution EM Blended Debt R EUR 31.12.2013 31.12.2014 31.12.2015
Number of shares outstanding at the beginning of the period 225,200.472 Net Assets in EUR 17,456,760.75 24,390,450.83 16,859,151.29
Number of shares issued 41,204.772 Number of shares outstanding 160,769.900 225,200.472 171,407.646
Number of shares redeemed -94,997.598 Net Assets value per share in EUR 108.58 108.31 98.36
Number of shares outstanding as of December 31, 2015 171,407.646
CGS FMS Global Evolution EM Blended Debt I EUR CGS FMS Global Evolution EM Blended Debt I EUR 31.12.2014* 31.12.2015
Number of shares outstanding at the beginning of the period 5,830.000 Net Assets in EUR 5,488,674.71 11,432,446.34
Number of shares issued 13,282.191 Number of shares outstanding 5,830.000 13,282.191
Number of shares redeemed -5,830.000 Net Assets value per share in EUR 941.45 860.73
Number of shares outstanding as of December 31, 2015 13,282.191
The accompanying notes form an integral part of the financial statements. 35
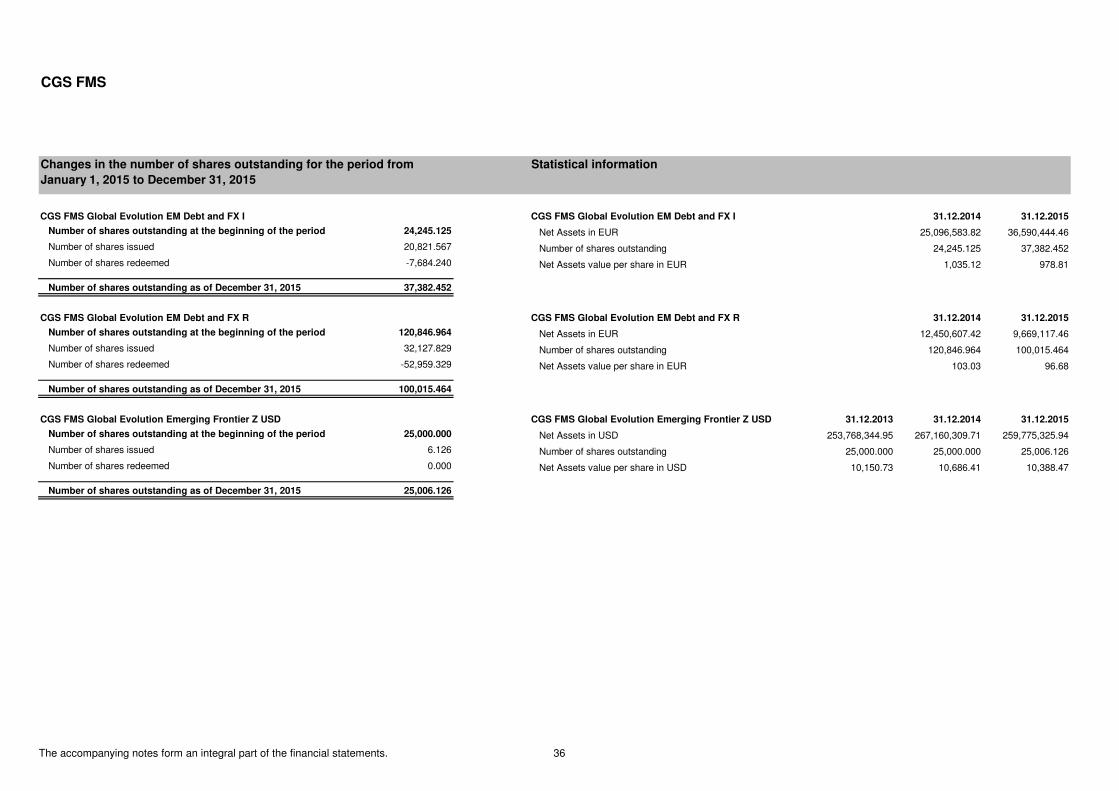
CGS FMS
Changes in the number of shares outstanding for the period from
January 1, 2015 to December 31, 2015
Statistical information
CGS FMS Global Evolution EM Debt and FX I CGS FMS Global Evolution EM Debt and FX I 31.12.2014 31.12.2015
Number of shares outstanding at the beginning of the period 24,245.125 Net Assets in EUR 25,096,583.82 36,590,444.46
Number of shares issued 20,821.567 Number of shares outstanding 24,245.125 37,382.452
Number of shares redeemed -7,684.240 Net Assets value per share in EUR 1,035.12 978.81
Number of shares outstanding as of December 31, 2015 37,382.452
CGS FMS Global Evolution EM Debt and FX R CGS FMS Global Evolution EM Debt and FX R 31.12.2014 31.12.2015
Number of shares outstanding at the beginning of the period 120,846.964 Net Assets in EUR 12,450,607.42 9,669,117.46
Number of shares issued 32,127.829 Number of shares outstanding 120,846.964 100,015.464
Number of shares redeemed -52,959.329 Net Assets value per share in EUR 103.03 96.68
Number of shares outstanding as of December 31, 2015 100,015.464
CGS FMS Global Evolution Emerging Frontier Z USD CGS FMS Global Evolution Emerging Frontier Z USD 31.12.2013 31.12.2014 31.12.2015
Number of shares outstanding at the beginning of the period 25,000.000 Net Assets in USD 253,768,344.95 267,160,309.71 259,775,325.94
Number of shares issued 6.126 Number of shares outstanding 25,000.000 25,000.000 25,006.126
Number of shares redeemed 0.000 Net Assets value per share in USD 10,150.73 10,686.41 10,388.47
Number of shares outstanding as of December 31, 2015 25,006.126
The accompanying notes form an integral part of the financial statements. 36
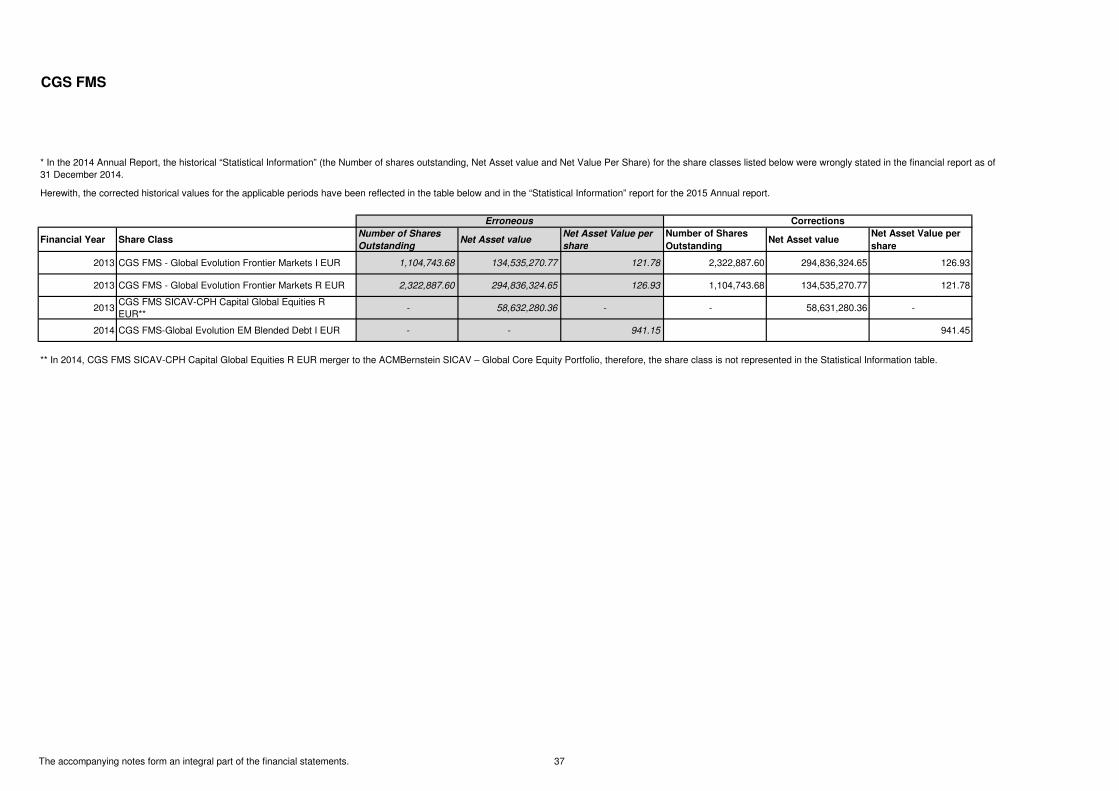
CGS FMS
Financial Year Share ClassNumber of Shares
OutstandingNet Asset value
Net Asset Value per
share
Number of Shares
OutstandingNet Asset value
Net Asset Value per
share
2013 CGS FMS - Global Evolution Frontier Markets I EUR 1,104,743.68 134,535,270.77 121.78 2,322,887.60 294,836,324.65 126.93
2013 CGS FMS - Global Evolution Frontier Markets R EUR 2,322,887.60 294,836,324.65 126.93 1,104,743.68 134,535,270.77 121.78
2013CGS FMS SICAV-CPH Capital Global Equities R EUR**
- 58,632,280.36 - - 58,631,280.36 -
2014 CGS FMS-Global Evolution EM Blended Debt I EUR - - 941.15 941.45
** In 2014, CGS FMS SICAV-CPH Capital Global Equities R EUR merger to the ACMBernstein SICAV – Global Core Equity Portfolio, therefore, the share class is not represented in the Statistical Information table.
Erroneous Corrections
* In the 2014 Annual Report, the historical “Statistical Information” (the Number of shares outstanding, Net Asset value and Net Value Per Share) for the share classes listed below were wrongly stated in the financial report as of 31 December 2014.
Herewith, the corrected historical values for the applicable periods have been reflected in the table below and in the “Statistical Information” report for the 2015 Annual report.
The accompanying notes form an integral part of the financial statements. 37
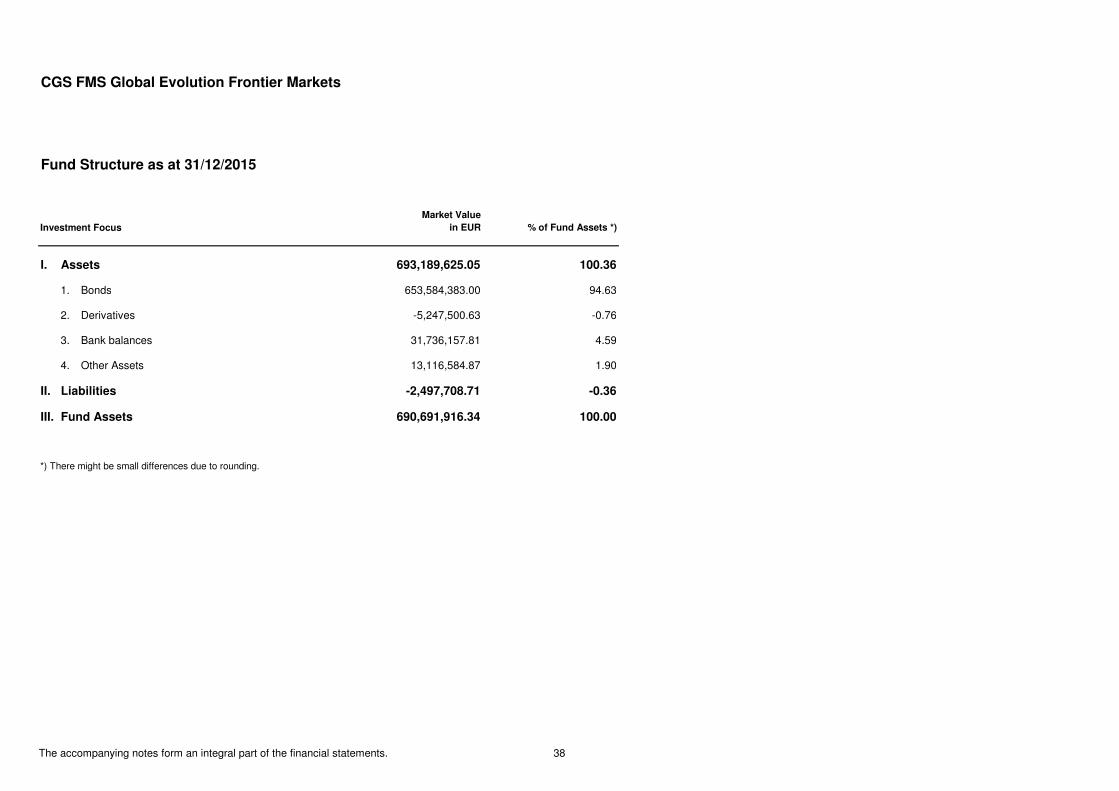
CGS FMS Global Evolution Frontier Markets
Fund Structure as at 31/12/2015
Investment Focus
Market Value
in EUR % of Fund Assets *)
I. Assets 693,189,625.05 100.36
1. Bonds 653,584,383.00 94.63
2. Derivatives -5,247,500.63 -0.76
3. Bank balances 31,736,157.81 4.59
4. Other Assets 13,116,584.87 1.90
II. Liabilities -2,497,708.71 -0.36
III. Fund Assets 690,691,916.34 100.00
*) There might be small differences due to rounding.
The accompanying notes form an integral part of the financial statements. 38
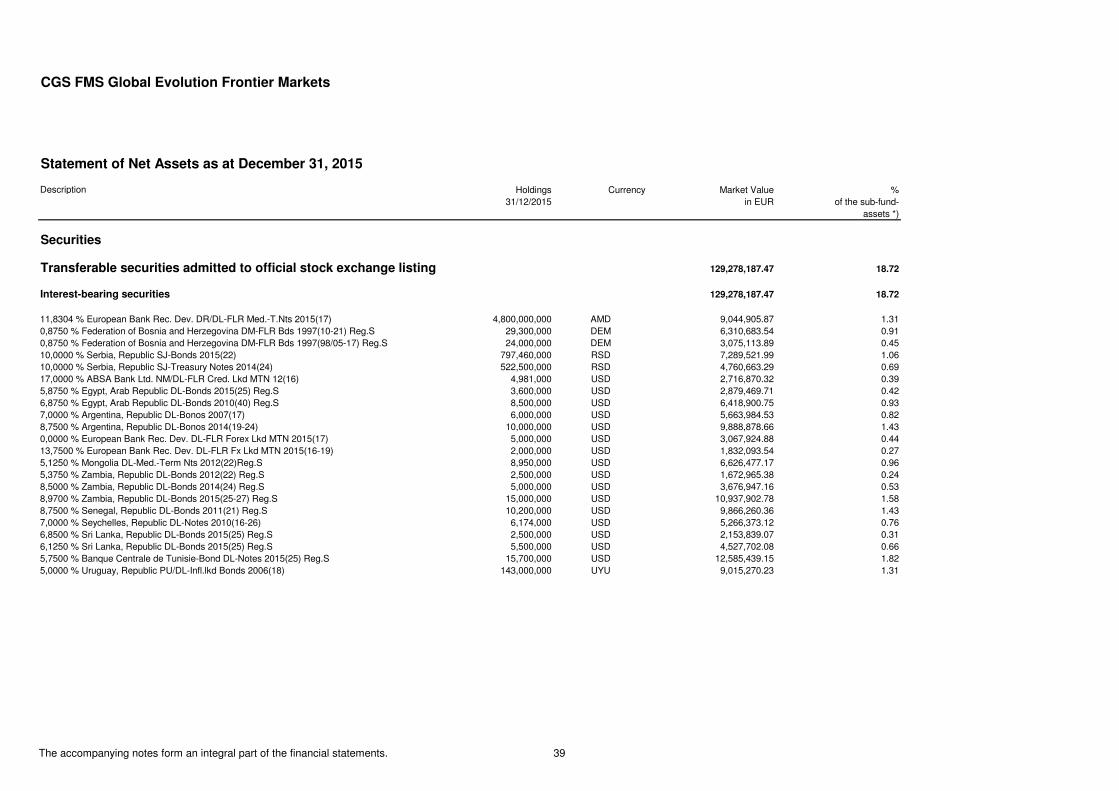
CGS FMS Global Evolution Frontier Markets
Statement of Net Assets as at December 31, 2015
Description Holdings Currency Market Value %31/12/2015 in EUR of the sub-fund-
assets *)
Securities
Transferable securities admitted to official stock exchange listing 129,278,187.47 18.72
Interest-bearing securities 129,278,187.47 18.72
11,8304 % European Bank Rec. Dev. DR/DL-FLR Med.-T.Nts 2015(17) 4,800,000,000 AMD 9,044,905.87 1.310,8750 % Federation of Bosnia and Herzegovina DM-FLR Bds 1997(10-21) Reg.S 29,300,000 DEM 6,310,683.54 0.910,8750 % Federation of Bosnia and Herzegovina DM-FLR Bds 1997(98/05-17) Reg.S 24,000,000 DEM 3,075,113.89 0.4510,0000 % Serbia, Republic SJ-Bonds 2015(22) 797,460,000 RSD 7,289,521.99 1.0610,0000 % Serbia, Republic SJ-Treasury Notes 2014(24) 522,500,000 RSD 4,760,663.29 0.6917,0000 % ABSA Bank Ltd. NM/DL-FLR Cred. Lkd MTN 12(16) 4,981,000 USD 2,716,870.32 0.395,8750 % Egypt, Arab Republic DL-Bonds 2015(25) Reg.S 3,600,000 USD 2,879,469.71 0.426,8750 % Egypt, Arab Republic DL-Bonds 2010(40) Reg.S 8,500,000 USD 6,418,900.75 0.937,0000 % Argentina, Republic DL-Bonos 2007(17) 6,000,000 USD 5,663,984.53 0.828,7500 % Argentina, Republic DL-Bonos 2014(19-24) 10,000,000 USD 9,888,878.66 1.430,0000 % European Bank Rec. Dev. DL-FLR Forex Lkd MTN 2015(17) 5,000,000 USD 3,067,924.88 0.4413,7500 % European Bank Rec. Dev. DL-FLR Fx Lkd MTN 2015(16-19) 2,000,000 USD 1,832,093.54 0.275,1250 % Mongolia DL-Med.-Term Nts 2012(22)Reg.S 8,950,000 USD 6,626,477.17 0.965,3750 % Zambia, Republic DL-Bonds 2012(22) Reg.S 2,500,000 USD 1,672,965.38 0.248,5000 % Zambia, Republic DL-Bonds 2014(24) Reg.S 5,000,000 USD 3,676,947.16 0.538,9700 % Zambia, Republic DL-Bonds 2015(25-27) Reg.S 15,000,000 USD 10,937,902.78 1.588,7500 % Senegal, Republic DL-Bonds 2011(21) Reg.S 10,200,000 USD 9,866,260.36 1.437,0000 % Seychelles, Republic DL-Notes 2010(16-26) 6,174,000 USD 5,266,373.12 0.766,8500 % Sri Lanka, Republic DL-Bonds 2015(25) Reg.S 2,500,000 USD 2,153,839.07 0.316,1250 % Sri Lanka, Republic DL-Bonds 2015(25) Reg.S 5,500,000 USD 4,527,702.08 0.665,7500 % Banque Centrale de Tunisie-Bond DL-Notes 2015(25) Reg.S 15,700,000 USD 12,585,439.15 1.825,0000 % Uruguay, Republic PU/DL-Infl.lkd Bonds 2006(18) 143,000,000 UYU 9,015,270.23 1.31
The accompanying notes form an integral part of the financial statements. 39
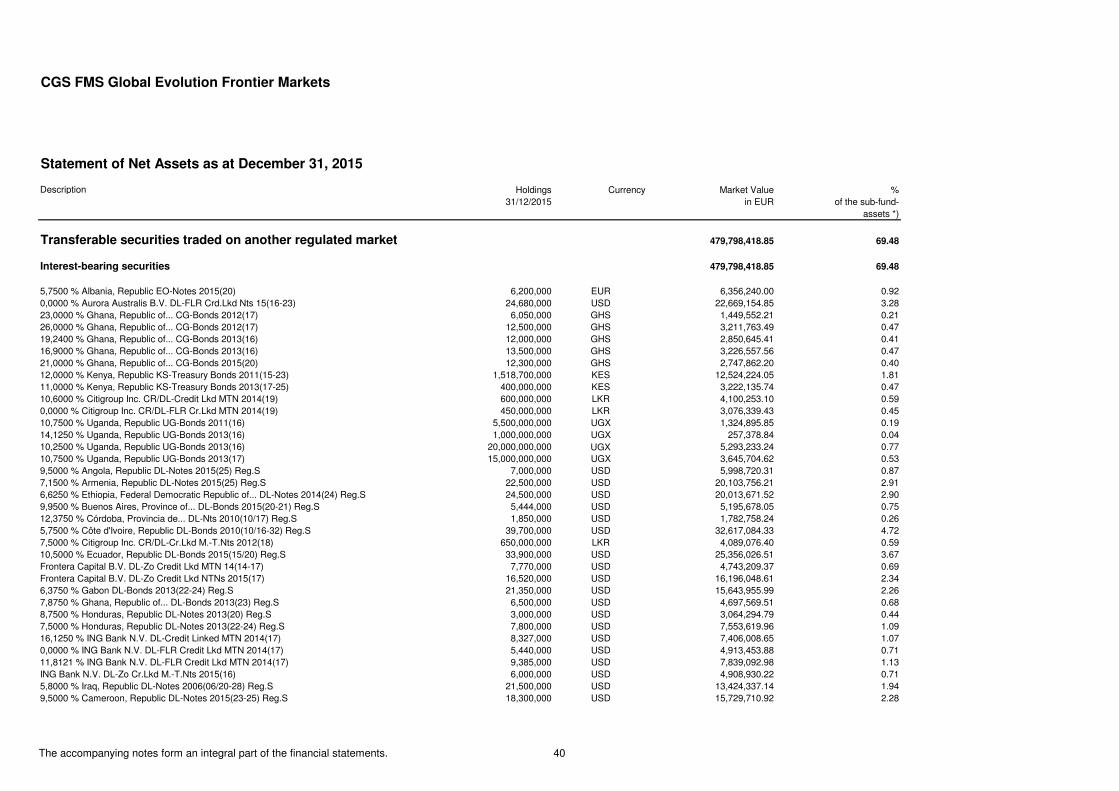
CGS FMS Global Evolution Frontier Markets
Statement of Net Assets as at December 31, 2015
Description Holdings Currency Market Value %31/12/2015 in EUR of the sub-fund-
assets *)
Transferable securities traded on another regulated market 479,798,418.85 69.48
Interest-bearing securities 479,798,418.85 69.48
5,7500 % Albania, Republic EO-Notes 2015(20) 6,200,000 EUR 6,356,240.00 0.920,0000 % Aurora Australis B.V. DL-FLR Crd.Lkd Nts 15(16-23) 24,680,000 USD 22,669,154.85 3.2823,0000 % Ghana, Republic of... CG-Bonds 2012(17) 6,050,000 GHS 1,449,552.21 0.2126,0000 % Ghana, Republic of... CG-Bonds 2012(17) 12,500,000 GHS 3,211,763.49 0.4719,2400 % Ghana, Republic of... CG-Bonds 2013(16) 12,000,000 GHS 2,850,645.41 0.4116,9000 % Ghana, Republic of... CG-Bonds 2013(16) 13,500,000 GHS 3,226,557.56 0.4721,0000 % Ghana, Republic of... CG-Bonds 2015(20) 12,300,000 GHS 2,747,862.20 0.4012,0000 % Kenya, Republic KS-Treasury Bonds 2011(15-23) 1,518,700,000 KES 12,524,224.05 1.8111,0000 % Kenya, Republic KS-Treasury Bonds 2013(17-25) 400,000,000 KES 3,222,135.74 0.4710,6000 % Citigroup Inc. CR/DL-Credit Lkd MTN 2014(19) 600,000,000 LKR 4,100,253.10 0.590,0000 % Citigroup Inc. CR/DL-FLR Cr.Lkd MTN 2014(19) 450,000,000 LKR 3,076,339.43 0.4510,7500 % Uganda, Republic UG-Bonds 2011(16) 5,500,000,000 UGX 1,324,895.85 0.1914,1250 % Uganda, Republic UG-Bonds 2013(16) 1,000,000,000 UGX 257,378.84 0.0410,2500 % Uganda, Republic UG-Bonds 2013(16) 20,000,000,000 UGX 5,293,233.24 0.7710,7500 % Uganda, Republic UG-Bonds 2013(17) 15,000,000,000 UGX 3,645,704.62 0.539,5000 % Angola, Republic DL-Notes 2015(25) Reg.S 7,000,000 USD 5,998,720.31 0.877,1500 % Armenia, Republic DL-Notes 2015(25) Reg.S 22,500,000 USD 20,103,756.21 2.916,6250 % Ethiopia, Federal Democratic Republic of... DL-Notes 2014(24) Reg.S 24,500,000 USD 20,013,671.52 2.909,9500 % Buenos Aires, Province of... DL-Bonds 2015(20-21) Reg.S 5,444,000 USD 5,195,678.05 0.7512,3750 % Córdoba, Provincia de... DL-Nts 2010(10/17) Reg.S 1,850,000 USD 1,782,758.24 0.265,7500 % Côte d'Ivoire, Republic DL-Bonds 2010(10/16-32) Reg.S 39,700,000 USD 32,617,084.33 4.727,5000 % Citigroup Inc. CR/DL-Cr.Lkd M.-T.Nts 2012(18) 650,000,000 LKR 4,089,076.40 0.5910,5000 % Ecuador, Republic DL-Bonds 2015(15/20) Reg.S 33,900,000 USD 25,356,026.51 3.67Frontera Capital B.V. DL-Zo Credit Lkd MTN 14(14-17) 7,770,000 USD 4,743,209.37 0.69Frontera Capital B.V. DL-Zo Credit Lkd NTNs 2015(17) 16,520,000 USD 16,196,048.61 2.346,3750 % Gabon DL-Bonds 2013(22-24) Reg.S 21,350,000 USD 15,643,955.99 2.267,8750 % Ghana, Republic of... DL-Bonds 2013(23) Reg.S 6,500,000 USD 4,697,569.51 0.688,7500 % Honduras, Republic DL-Notes 2013(20) Reg.S 3,000,000 USD 3,064,294.79 0.447,5000 % Honduras, Republic DL-Notes 2013(22-24) Reg.S 7,800,000 USD 7,553,619.96 1.0916,1250 % ING Bank N.V. DL-Credit Linked MTN 2014(17) 8,327,000 USD 7,406,008.65 1.070,0000 % ING Bank N.V. DL-FLR Credit Lkd MTN 2014(17) 5,440,000 USD 4,913,453.88 0.7111,8121 % ING Bank N.V. DL-FLR Credit Lkd MTN 2014(17) 9,385,000 USD 7,839,092.98 1.13ING Bank N.V. DL-Zo Cr.Lkd M.-T.Nts 2015(16) 6,000,000 USD 4,908,930.22 0.715,8000 % Iraq, Republic DL-Notes 2006(06/20-28) Reg.S 21,500,000 USD 13,424,337.14 1.949,5000 % Cameroon, Republic DL-Notes 2015(23-25) Reg.S 18,300,000 USD 15,729,710.92 2.28
The accompanying notes form an integral part of the financial statements. 40
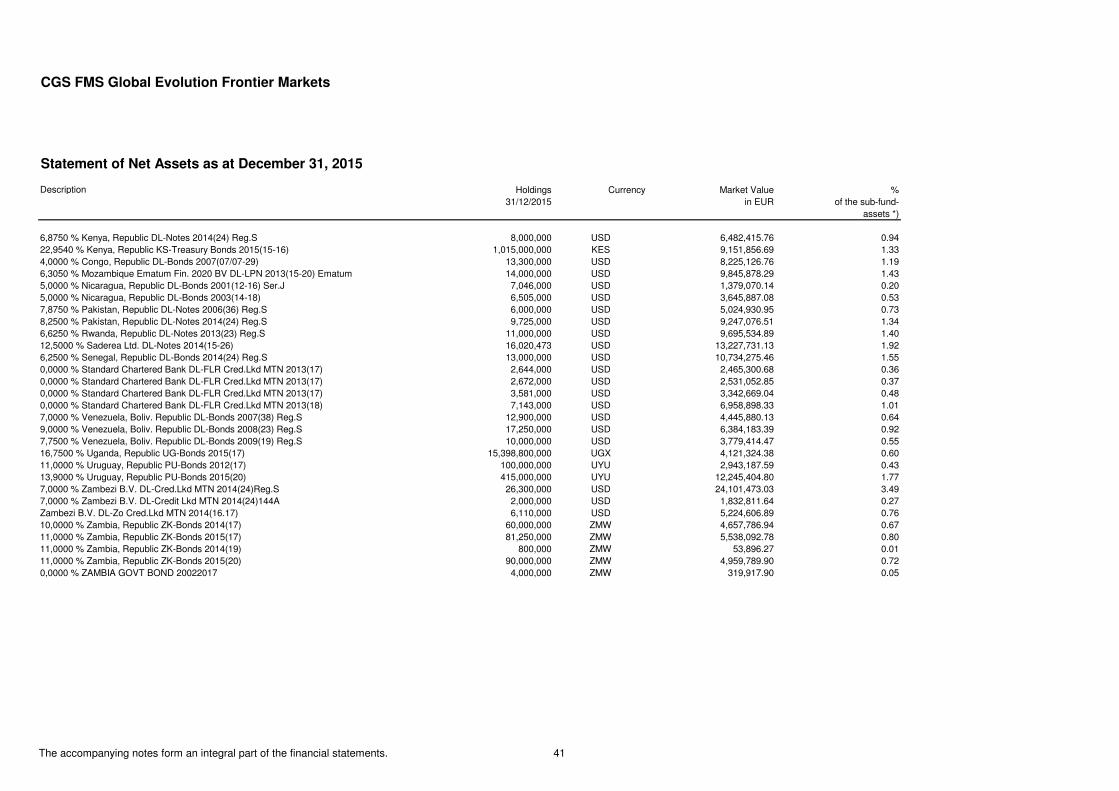
CGS FMS Global Evolution Frontier Markets
Statement of Net Assets as at December 31, 2015
Description Holdings Currency Market Value %31/12/2015 in EUR of the sub-fund-
assets *)
6,8750 % Kenya, Republic DL-Notes 2014(24) Reg.S 8,000,000 USD 6,482,415.76 0.9422,9540 % Kenya, Republic KS-Treasury Bonds 2015(15-16) 1,015,000,000 KES 9,151,856.69 1.334,0000 % Congo, Republic DL-Bonds 2007(07/07-29) 13,300,000 USD 8,225,126.76 1.196,3050 % Mozambique Ematum Fin. 2020 BV DL-LPN 2013(15-20) Ematum 14,000,000 USD 9,845,878.29 1.435,0000 % Nicaragua, Republic DL-Bonds 2001(12-16) Ser.J 7,046,000 USD 1,379,070.14 0.205,0000 % Nicaragua, Republic DL-Bonds 2003(14-18) 6,505,000 USD 3,645,887.08 0.537,8750 % Pakistan, Republic DL-Notes 2006(36) Reg.S 6,000,000 USD 5,024,930.95 0.738,2500 % Pakistan, Republic DL-Notes 2014(24) Reg.S 9,725,000 USD 9,247,076.51 1.346,6250 % Rwanda, Republic DL-Notes 2013(23) Reg.S 11,000,000 USD 9,695,534.89 1.4012,5000 % Saderea Ltd. DL-Notes 2014(15-26) 16,020,473 USD 13,227,731.13 1.926,2500 % Senegal, Republic DL-Bonds 2014(24) Reg.S 13,000,000 USD 10,734,275.46 1.550,0000 % Standard Chartered Bank DL-FLR Cred.Lkd MTN 2013(17) 2,644,000 USD 2,465,300.68 0.360,0000 % Standard Chartered Bank DL-FLR Cred.Lkd MTN 2013(17) 2,672,000 USD 2,531,052.85 0.370,0000 % Standard Chartered Bank DL-FLR Cred.Lkd MTN 2013(17) 3,581,000 USD 3,342,669.04 0.480,0000 % Standard Chartered Bank DL-FLR Cred.Lkd MTN 2013(18) 7,143,000 USD 6,958,898.33 1.017,0000 % Venezuela, Boliv. Republic DL-Bonds 2007(38) Reg.S 12,900,000 USD 4,445,880.13 0.649,0000 % Venezuela, Boliv. Republic DL-Bonds 2008(23) Reg.S 17,250,000 USD 6,384,183.39 0.927,7500 % Venezuela, Boliv. Republic DL-Bonds 2009(19) Reg.S 10,000,000 USD 3,779,414.47 0.5516,7500 % Uganda, Republic UG-Bonds 2015(17) 15,398,800,000 UGX 4,121,324.38 0.6011,0000 % Uruguay, Republic PU-Bonds 2012(17) 100,000,000 UYU 2,943,187.59 0.4313,9000 % Uruguay, Republic PU-Bonds 2015(20) 415,000,000 UYU 12,245,404.80 1.777,0000 % Zambezi B.V. DL-Cred.Lkd MTN 2014(24)Reg.S 26,300,000 USD 24,101,473.03 3.497,0000 % Zambezi B.V. DL-Credit Lkd MTN 2014(24)144A 2,000,000 USD 1,832,811.64 0.27Zambezi B.V. DL-Zo Cred.Lkd MTN 2014(16.17) 6,110,000 USD 5,224,606.89 0.7610,0000 % Zambia, Republic ZK-Bonds 2014(17) 60,000,000 ZMW 4,657,786.94 0.6711,0000 % Zambia, Republic ZK-Bonds 2015(17) 81,250,000 ZMW 5,538,092.78 0.8011,0000 % Zambia, Republic ZK-Bonds 2014(19) 800,000 ZMW 53,896.27 0.0111,0000 % Zambia, Republic ZK-Bonds 2015(20) 90,000,000 ZMW 4,959,789.90 0.720,0000 % ZAMBIA GOVT BOND 20022017 4,000,000 ZMW 319,917.90 0.05
The accompanying notes form an integral part of the financial statements. 41
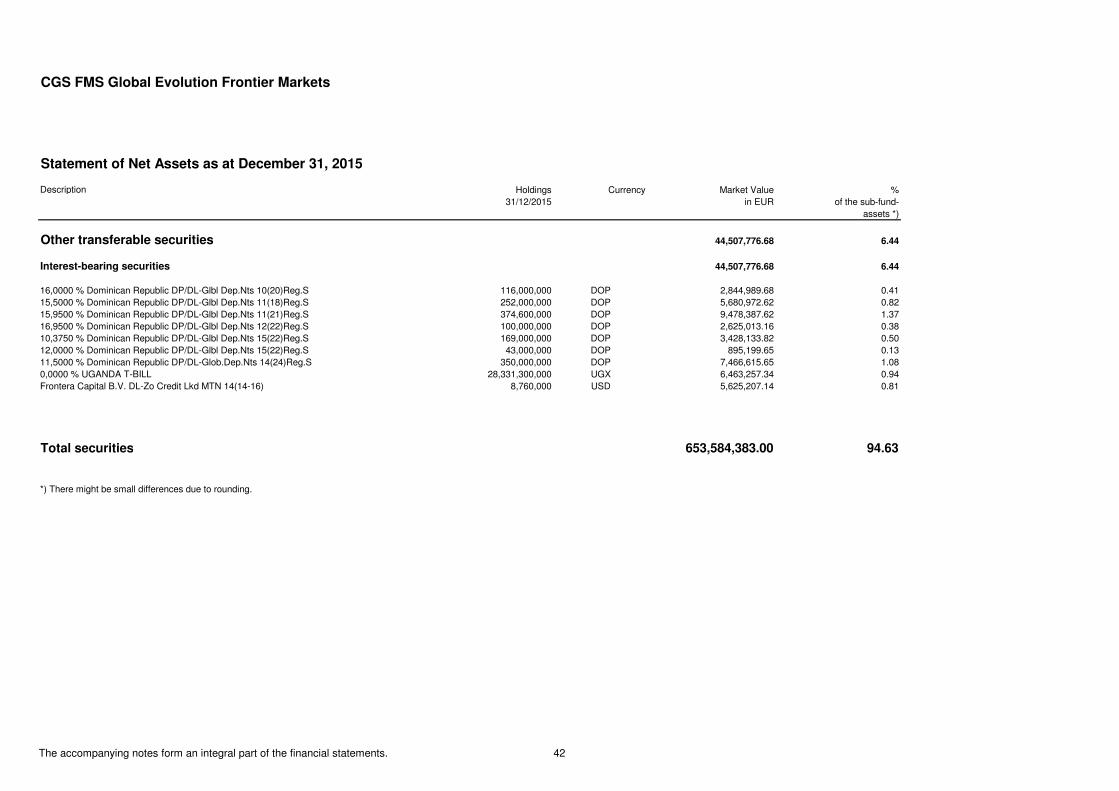
CGS FMS Global Evolution Frontier Markets
Statement of Net Assets as at December 31, 2015
Description Holdings Currency Market Value %31/12/2015 in EUR of the sub-fund-
assets *)
Other transferable securities 44,507,776.68 6.44
Interest-bearing securities 44,507,776.68 6.44
16,0000 % Dominican Republic DP/DL-Glbl Dep.Nts 10(20)Reg.S 116,000,000 DOP 2,844,989.68 0.4115,5000 % Dominican Republic DP/DL-Glbl Dep.Nts 11(18)Reg.S 252,000,000 DOP 5,680,972.62 0.8215,9500 % Dominican Republic DP/DL-Glbl Dep.Nts 11(21)Reg.S 374,600,000 DOP 9,478,387.62 1.3716,9500 % Dominican Republic DP/DL-Glbl Dep.Nts 12(22)Reg.S 100,000,000 DOP 2,625,013.16 0.3810,3750 % Dominican Republic DP/DL-Glbl Dep.Nts 15(22)Reg.S 169,000,000 DOP 3,428,133.82 0.5012,0000 % Dominican Republic DP/DL-Glbl Dep.Nts 15(22)Reg.S 43,000,000 DOP 895,199.65 0.1311,5000 % Dominican Republic DP/DL-Glob.Dep.Nts 14(24)Reg.S 350,000,000 DOP 7,466,615.65 1.080,0000 % UGANDA T-BILL 28,331,300,000 UGX 6,463,257.34 0.94Frontera Capital B.V. DL-Zo Credit Lkd MTN 14(14-16) 8,760,000 USD 5,625,207.14 0.81
Total securities 653,584,383.00 94.63
*) There might be small differences due to rounding.
The accompanying notes form an integral part of the financial statements. 42
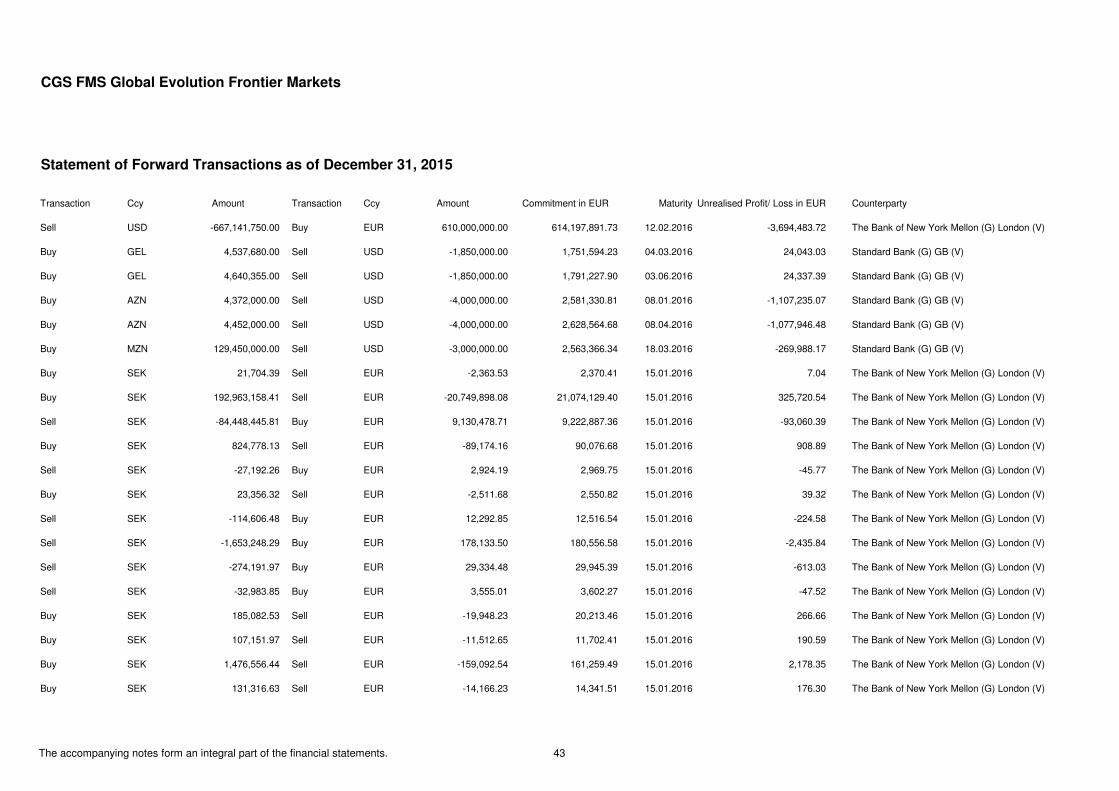
CGS FMS Global Evolution Frontier Markets
Statement of Forward Transactions as of December 31, 2015
Transaction Ccy Amount Transaction Ccy Amount Commitment in EUR Maturity Unrealised Profit/ Loss in EUR Counterparty
Sell USD -667,141,750.00 Buy EUR 610,000,000.00 614,197,891.73 12.02.2016 -3,694,483.72 The Bank of New York Mellon (G) London (V)
Buy GEL 4,537,680.00 Sell USD -1,850,000.00 1,751,594.23 04.03.2016 24,043.03 Standard Bank (G) GB (V)
Buy GEL 4,640,355.00 Sell USD -1,850,000.00 1,791,227.90 03.06.2016 24,337.39 Standard Bank (G) GB (V)
Buy AZN 4,372,000.00 Sell USD -4,000,000.00 2,581,330.81 08.01.2016 -1,107,235.07 Standard Bank (G) GB (V)
Buy AZN 4,452,000.00 Sell USD -4,000,000.00 2,628,564.68 08.04.2016 -1,077,946.48 Standard Bank (G) GB (V)
Buy MZN 129,450,000.00 Sell USD -3,000,000.00 2,563,366.34 18.03.2016 -269,988.17 Standard Bank (G) GB (V)
Buy SEK 21,704.39 Sell EUR -2,363.53 2,370.41 15.01.2016 7.04 The Bank of New York Mellon (G) London (V)
Buy SEK 192,963,158.41 Sell EUR -20,749,898.08 21,074,129.40 15.01.2016 325,720.54 The Bank of New York Mellon (G) London (V)
Sell SEK -84,448,445.81 Buy EUR 9,130,478.71 9,222,887.36 15.01.2016 -93,060.39 The Bank of New York Mellon (G) London (V)
Buy SEK 824,778.13 Sell EUR -89,174.16 90,076.68 15.01.2016 908.89 The Bank of New York Mellon (G) London (V)
Sell SEK -27,192.26 Buy EUR 2,924.19 2,969.75 15.01.2016 -45.77 The Bank of New York Mellon (G) London (V)
Buy SEK 23,356.32 Sell EUR -2,511.68 2,550.82 15.01.2016 39.32 The Bank of New York Mellon (G) London (V)
Sell SEK -114,606.48 Buy EUR 12,292.85 12,516.54 15.01.2016 -224.58 The Bank of New York Mellon (G) London (V)
Sell SEK -1,653,248.29 Buy EUR 178,133.50 180,556.58 15.01.2016 -2,435.84 The Bank of New York Mellon (G) London (V)
Sell SEK -274,191.97 Buy EUR 29,334.48 29,945.39 15.01.2016 -613.03 The Bank of New York Mellon (G) London (V)
Sell SEK -32,983.85 Buy EUR 3,555.01 3,602.27 15.01.2016 -47.52 The Bank of New York Mellon (G) London (V)
Buy SEK 185,082.53 Sell EUR -19,948.23 20,213.46 15.01.2016 266.66 The Bank of New York Mellon (G) London (V)
Buy SEK 107,151.97 Sell EUR -11,512.65 11,702.41 15.01.2016 190.59 The Bank of New York Mellon (G) London (V)
Buy SEK 1,476,556.44 Sell EUR -159,092.54 161,259.49 15.01.2016 2,178.35 The Bank of New York Mellon (G) London (V)
Buy SEK 131,316.63 Sell EUR -14,166.23 14,341.51 15.01.2016 176.30 The Bank of New York Mellon (G) London (V)
The accompanying notes form an integral part of the financial statements. 43
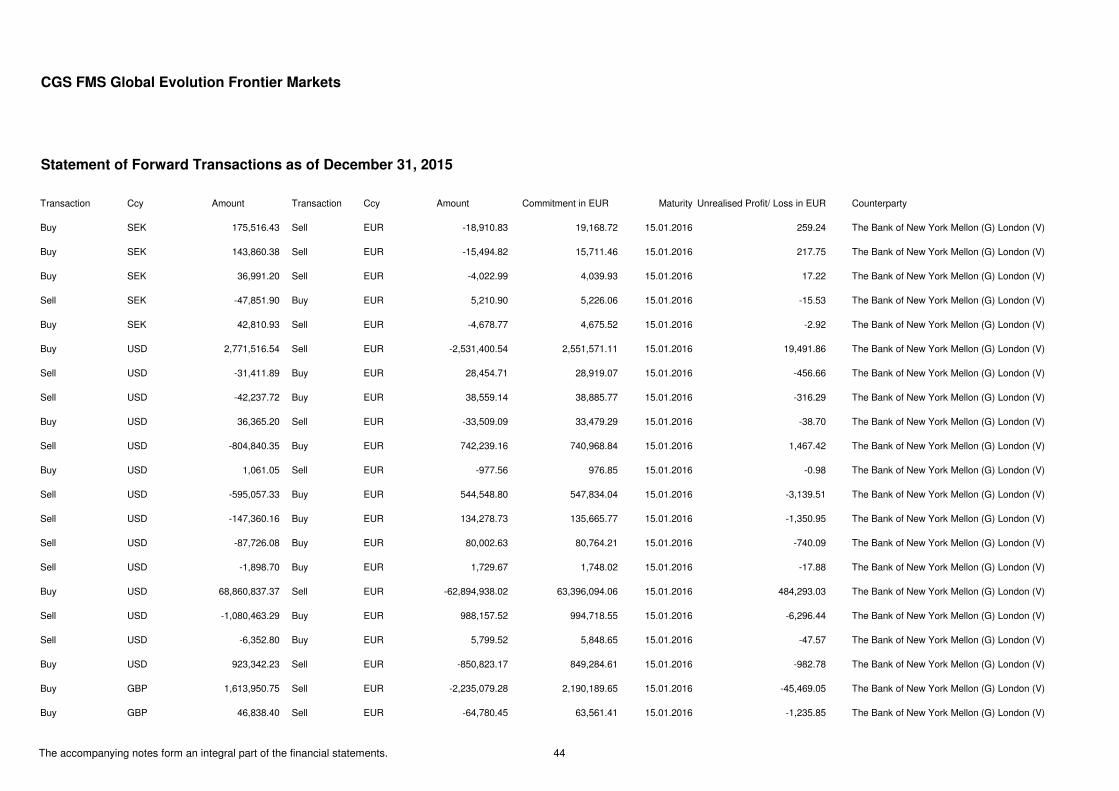
CGS FMS Global Evolution Frontier Markets
Statement of Forward Transactions as of December 31, 2015
Transaction Ccy Amount Transaction Ccy Amount Commitment in EUR Maturity Unrealised Profit/ Loss in EUR Counterparty
Buy SEK 175,516.43 Sell EUR -18,910.83 19,168.72 15.01.2016 259.24 The Bank of New York Mellon (G) London (V)
Buy SEK 143,860.38 Sell EUR -15,494.82 15,711.46 15.01.2016 217.75 The Bank of New York Mellon (G) London (V)
Buy SEK 36,991.20 Sell EUR -4,022.99 4,039.93 15.01.2016 17.22 The Bank of New York Mellon (G) London (V)
Sell SEK -47,851.90 Buy EUR 5,210.90 5,226.06 15.01.2016 -15.53 The Bank of New York Mellon (G) London (V)
Buy SEK 42,810.93 Sell EUR -4,678.77 4,675.52 15.01.2016 -2.92 The Bank of New York Mellon (G) London (V)
Buy USD 2,771,516.54 Sell EUR -2,531,400.54 2,551,571.11 15.01.2016 19,491.86 The Bank of New York Mellon (G) London (V)
Sell USD -31,411.89 Buy EUR 28,454.71 28,919.07 15.01.2016 -456.66 The Bank of New York Mellon (G) London (V)
Sell USD -42,237.72 Buy EUR 38,559.14 38,885.77 15.01.2016 -316.29 The Bank of New York Mellon (G) London (V)
Buy USD 36,365.20 Sell EUR -33,509.09 33,479.29 15.01.2016 -38.70 The Bank of New York Mellon (G) London (V)
Sell USD -804,840.35 Buy EUR 742,239.16 740,968.84 15.01.2016 1,467.42 The Bank of New York Mellon (G) London (V)
Buy USD 1,061.05 Sell EUR -977.56 976.85 15.01.2016 -0.98 The Bank of New York Mellon (G) London (V)
Sell USD -595,057.33 Buy EUR 544,548.80 547,834.04 15.01.2016 -3,139.51 The Bank of New York Mellon (G) London (V)
Sell USD -147,360.16 Buy EUR 134,278.73 135,665.77 15.01.2016 -1,350.95 The Bank of New York Mellon (G) London (V)
Sell USD -87,726.08 Buy EUR 80,002.63 80,764.21 15.01.2016 -740.09 The Bank of New York Mellon (G) London (V)
Sell USD -1,898.70 Buy EUR 1,729.67 1,748.02 15.01.2016 -17.88 The Bank of New York Mellon (G) London (V)
Buy USD 68,860,837.37 Sell EUR -62,894,938.02 63,396,094.06 15.01.2016 484,293.03 The Bank of New York Mellon (G) London (V)
Sell USD -1,080,463.29 Buy EUR 988,157.52 994,718.55 15.01.2016 -6,296.44 The Bank of New York Mellon (G) London (V)
Sell USD -6,352.80 Buy EUR 5,799.52 5,848.65 15.01.2016 -47.57 The Bank of New York Mellon (G) London (V)
Buy USD 923,342.23 Sell EUR -850,823.17 849,284.61 15.01.2016 -982.78 The Bank of New York Mellon (G) London (V)
Buy GBP 1,613,950.75 Sell EUR -2,235,079.28 2,190,189.65 15.01.2016 -45,469.05 The Bank of New York Mellon (G) London (V)
Buy GBP 46,838.40 Sell EUR -64,780.45 63,561.41 15.01.2016 -1,235.85 The Bank of New York Mellon (G) London (V)
The accompanying notes form an integral part of the financial statements. 44
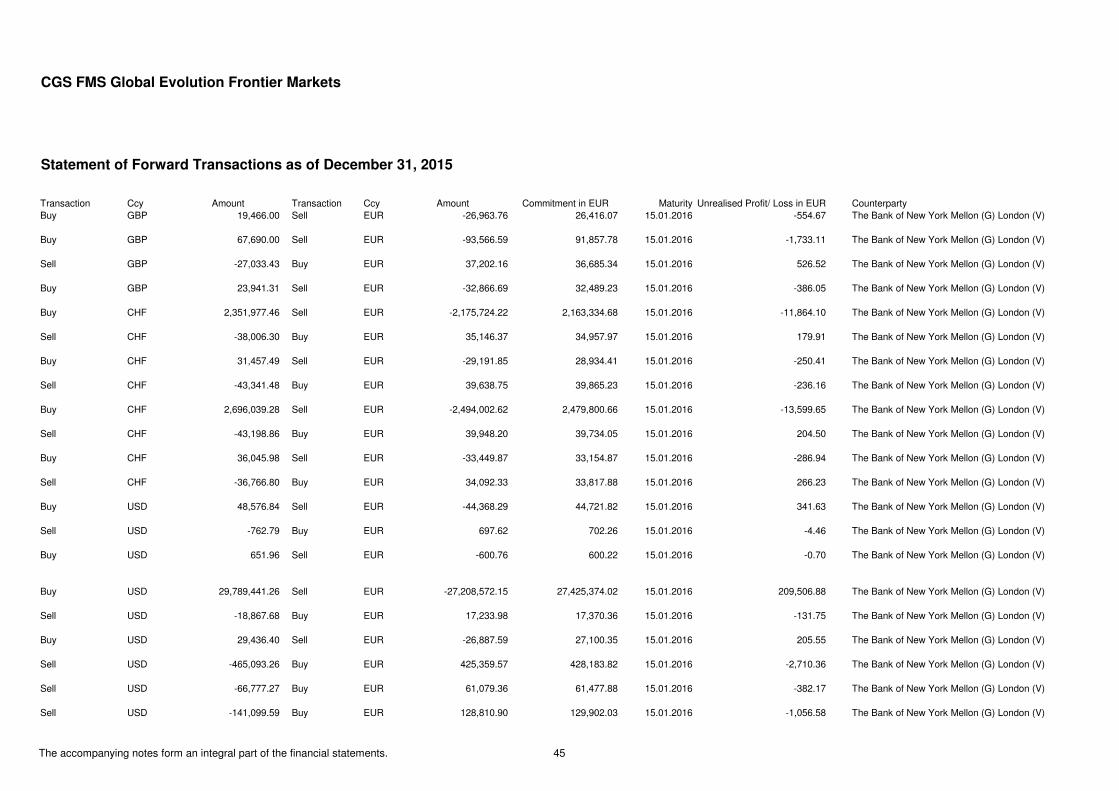
CGS FMS Global Evolution Frontier Markets
Statement of Forward Transactions as of December 31, 2015
Transaction Ccy Amount Transaction Ccy Amount Commitment in EUR Maturity Unrealised Profit/ Loss in EUR CounterpartyBuy GBP 19,466.00 Sell EUR -26,963.76 26,416.07 15.01.2016 -554.67 The Bank of New York Mellon (G) London (V)
Buy GBP 67,690.00 Sell EUR -93,566.59 91,857.78 15.01.2016 -1,733.11 The Bank of New York Mellon (G) London (V)
Sell GBP -27,033.43 Buy EUR 37,202.16 36,685.34 15.01.2016 526.52 The Bank of New York Mellon (G) London (V)
Buy GBP 23,941.31 Sell EUR -32,866.69 32,489.23 15.01.2016 -386.05 The Bank of New York Mellon (G) London (V)
Buy CHF 2,351,977.46 Sell EUR -2,175,724.22 2,163,334.68 15.01.2016 -11,864.10 The Bank of New York Mellon (G) London (V)
Sell CHF -38,006.30 Buy EUR 35,146.37 34,957.97 15.01.2016 179.91 The Bank of New York Mellon (G) London (V)
Buy CHF 31,457.49 Sell EUR -29,191.85 28,934.41 15.01.2016 -250.41 The Bank of New York Mellon (G) London (V)
Sell CHF -43,341.48 Buy EUR 39,638.75 39,865.23 15.01.2016 -236.16 The Bank of New York Mellon (G) London (V)
Buy CHF 2,696,039.28 Sell EUR -2,494,002.62 2,479,800.66 15.01.2016 -13,599.65 The Bank of New York Mellon (G) London (V)
Sell CHF -43,198.86 Buy EUR 39,948.20 39,734.05 15.01.2016 204.50 The Bank of New York Mellon (G) London (V)
Buy CHF 36,045.98 Sell EUR -33,449.87 33,154.87 15.01.2016 -286.94 The Bank of New York Mellon (G) London (V)
Sell CHF -36,766.80 Buy EUR 34,092.33 33,817.88 15.01.2016 266.23 The Bank of New York Mellon (G) London (V)
Buy USD 48,576.84 Sell EUR -44,368.29 44,721.82 15.01.2016 341.63 The Bank of New York Mellon (G) London (V)
Sell USD -762.79 Buy EUR 697.62 702.26 15.01.2016 -4.46 The Bank of New York Mellon (G) London (V)
Buy USD 651.96 Sell EUR -600.76 600.22 15.01.2016 -0.70 The Bank of New York Mellon (G) London (V)
Buy USD 29,789,441.26 Sell EUR -27,208,572.15 27,425,374.02 15.01.2016 209,506.88 The Bank of New York Mellon (G) London (V)
Sell USD -18,867.68 Buy EUR 17,233.98 17,370.36 15.01.2016 -131.75 The Bank of New York Mellon (G) London (V)
Buy USD 29,436.40 Sell EUR -26,887.59 27,100.35 15.01.2016 205.55 The Bank of New York Mellon (G) London (V)
Sell USD -465,093.26 Buy EUR 425,359.57 428,183.82 15.01.2016 -2,710.36 The Bank of New York Mellon (G) London (V)
Sell USD -66,777.27 Buy EUR 61,079.36 61,477.88 15.01.2016 -382.17 The Bank of New York Mellon (G) London (V)
Sell USD -141,099.59 Buy EUR 128,810.90 129,902.03 15.01.2016 -1,056.58 The Bank of New York Mellon (G) London (V)
The accompanying notes form an integral part of the financial statements. 45
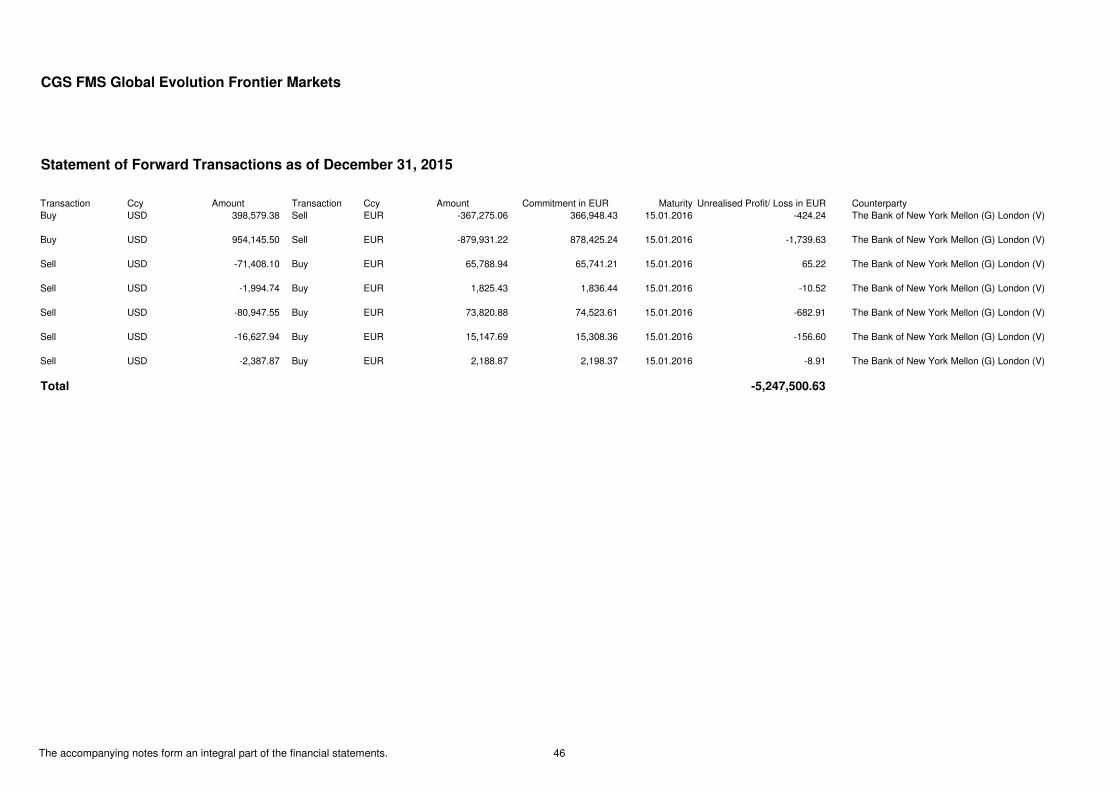
CGS FMS Global Evolution Frontier Markets
Statement of Forward Transactions as of December 31, 2015
Transaction Ccy Amount Transaction Ccy Amount Commitment in EUR Maturity Unrealised Profit/ Loss in EUR CounterpartyBuy USD 398,579.38 Sell EUR -367,275.06 366,948.43 15.01.2016 -424.24 The Bank of New York Mellon (G) London (V)
Buy USD 954,145.50 Sell EUR -879,931.22 878,425.24 15.01.2016 -1,739.63 The Bank of New York Mellon (G) London (V)
Sell USD -71,408.10 Buy EUR 65,788.94 65,741.21 15.01.2016 65.22 The Bank of New York Mellon (G) London (V)
Sell USD -1,994.74 Buy EUR 1,825.43 1,836.44 15.01.2016 -10.52 The Bank of New York Mellon (G) London (V)
Sell USD -80,947.55 Buy EUR 73,820.88 74,523.61 15.01.2016 -682.91 The Bank of New York Mellon (G) London (V)
Sell USD -16,627.94 Buy EUR 15,147.69 15,308.36 15.01.2016 -156.60 The Bank of New York Mellon (G) London (V)
Sell USD -2,387.87 Buy EUR 2,188.87 2,198.37 15.01.2016 -8.91 The Bank of New York Mellon (G) London (V)
Total -5,247,500.63
The accompanying notes form an integral part of the financial statements. 46
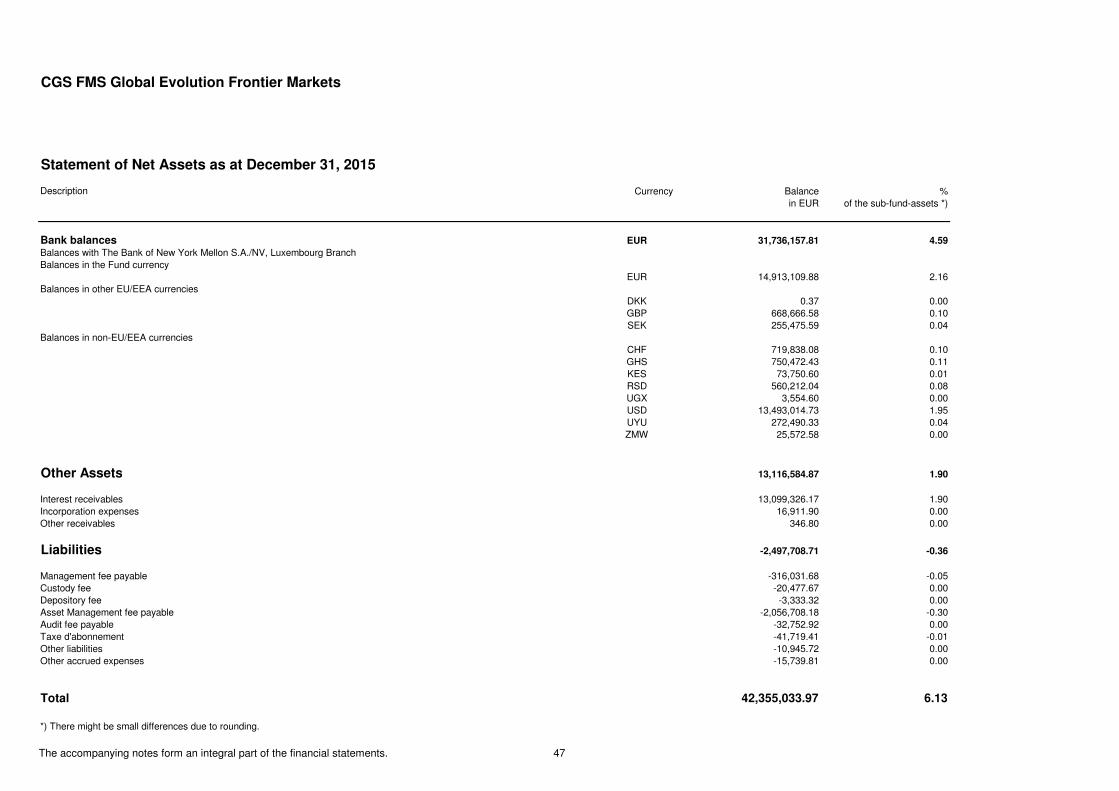
CGS FMS Global Evolution Frontier Markets
Statement of Net Assets as at December 31, 2015
Description Currency Balance %in EUR of the sub-fund-assets *)
Bank balances EUR 31,736,157.81 4.59
Balances with The Bank of New York Mellon S.A./NV, Luxembourg BranchBalances in the Fund currency
EUR 14,913,109.88 2.16Balances in other EU/EEA currencies
DKK 0.37 0.00GBP 668,666.58 0.10SEK 255,475.59 0.04
Balances in non-EU/EEA currenciesCHF 719,838.08 0.10GHS 750,472.43 0.11KES 73,750.60 0.01RSD 560,212.04 0.08UGX 3,554.60 0.00USD 13,493,014.73 1.95UYU 272,490.33 0.04ZMW 25,572.58 0.00
Other Assets 13,116,584.87 1.90
Interest receivables 13,099,326.17 1.90Incorporation expenses 16,911.90 0.00Other receivables 346.80 0.00
Liabilities -2,497,708.71 -0.36
Management fee payable -316,031.68 -0.05Custody fee -20,477.67 0.00Depository fee -3,333.32 0.00Asset Management fee payable -2,056,708.18 -0.30Audit fee payable -32,752.92 0.00Taxe d'abonnement -41,719.41 -0.01Other liabilities -10,945.72 0.00Other accrued expenses -15,739.81 0.00
Total 42,355,033.97 6.13
*) There might be small differences due to rounding.
The accompanying notes form an integral part of the financial statements. 47
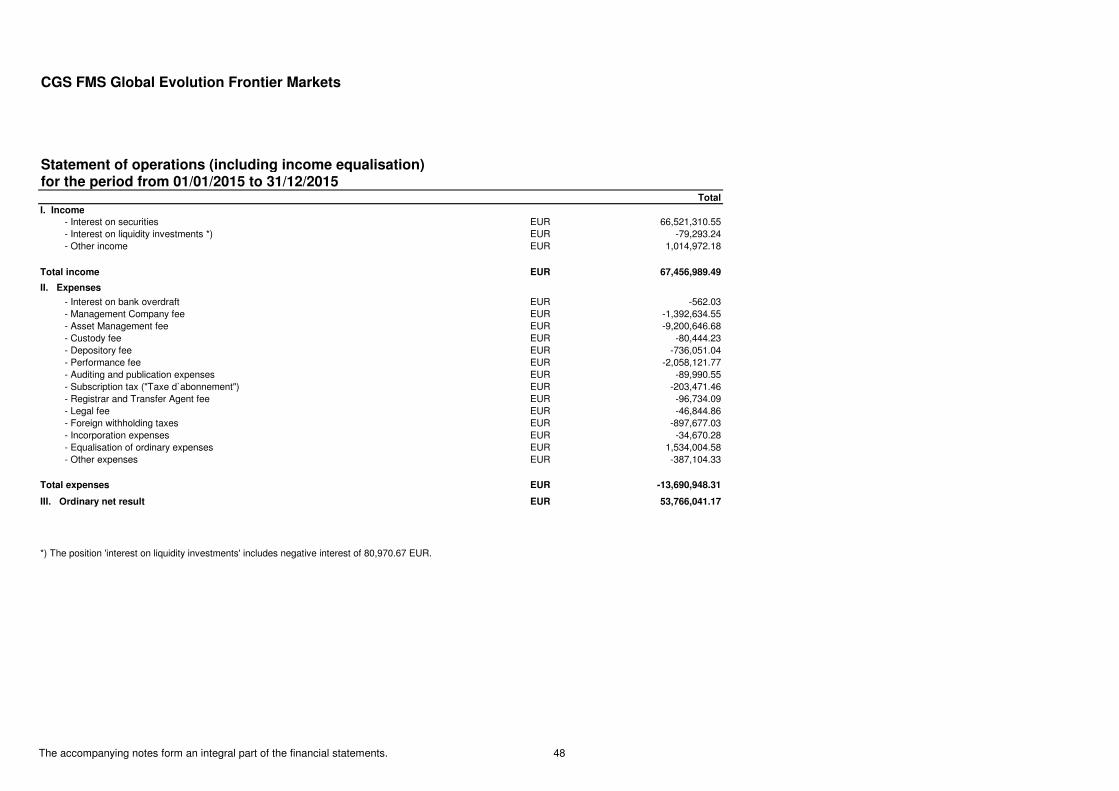
CGS FMS Global Evolution Frontier Markets
Statement of operations (including income equalisation)for the period from 01/01/2015 to 31/12/2015
Total
I. Income
- Interest on securities EUR 66,521,310.55 - Interest on liquidity investments *) EUR -79,293.24 - Other income EUR 1,014,972.18
Total income EUR 67,456,989.49
II. Expenses
- Interest on bank overdraft EUR -562.03 - Management Company fee EUR -1,392,634.55 - Asset Management fee EUR -9,200,646.68 - Custody fee EUR -80,444.23 - Depository fee EUR -736,051.04 - Performance fee EUR -2,058,121.77 - Auditing and publication expenses EUR -89,990.55 - Subscription tax ("Taxe d`abonnement") EUR -203,471.46 - Registrar and Transfer Agent fee EUR -96,734.09 - Legal fee EUR -46,844.86 - Foreign withholding taxes EUR -897,677.03 - Incorporation expenses EUR -34,670.28 - Equalisation of ordinary expenses EUR 1,534,004.58 - Other expenses EUR -387,104.33
Total expenses EUR -13,690,948.31
III. Ordinary net result EUR 53,766,041.17
*) The position 'interest on liquidity investments' includes negative interest of 80,970.67 EUR.
The accompanying notes form an integral part of the financial statements. 48

CGS FMS Global Evolution Frontier Markets
Statement of operations (including income equalisation)for the period from 01/01/2015 to 31/12/2015
Total
IV. Realised profit/loss on
1. Realised profit on EUR 146,735,925.49 - Securities EUR 62,829,911.05 - Forward exchange transactions EUR 82,748,350.02 - Swap transactions EUR 13,975.32 - Foreign exchange transactions EUR 1,143,689.102. Realised loss on EUR -168,840,576.18 - Securities EUR -35,853,322.70 - Forward exchange transactions EUR -124,487,221.95 - Foreign exchange transactions EUR -8,500,031.54
Total realised profit/loss EUR -22,104,650.69
V. Net change in unrealised profit/loss on
- Securities EUR -42,223,276.39 - Forward exchange transactions EUR 3,032,367.44 - Swap transactions EUR 393,143.39 - Foreign exchange transactions and other transactions EUR 1,702,441.05
Total net change in unrealised profit/loss EUR -37,095,324.52
VI. Result of operations for the period EUR -5,433,934.04
The accompanying notes form an integral part of the financial statements. 49
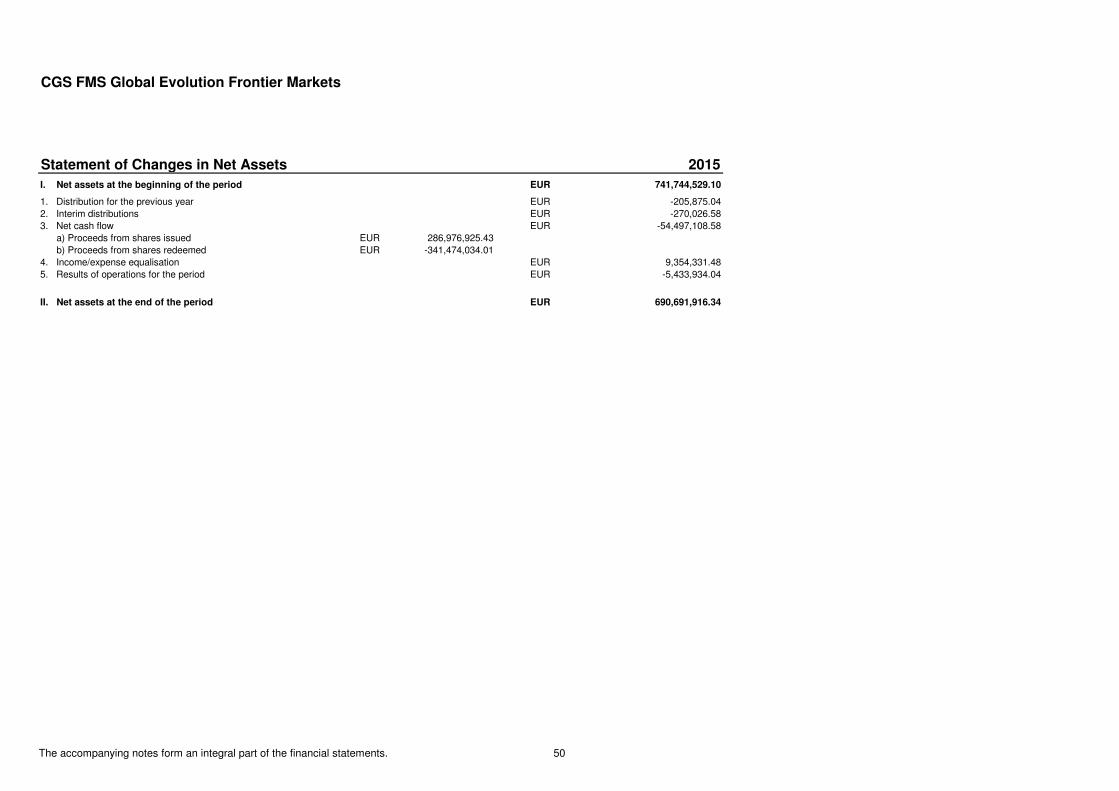
CGS FMS Global Evolution Frontier Markets
Statement of Changes in Net Assets 2015
I. Net assets at the beginning of the period EUR 741,744,529.10
1. Distribution for the previous year EUR -205,875.042. Interim distributions EUR -270,026.583. Net cash flow EUR -54,497,108.58 a) Proceeds from shares issued EUR 286,976,925.43 b) Proceeds from shares redeemed EUR -341,474,034.014. Income/expense equalisation EUR 9,354,331.485. Results of operations for the period EUR -5,433,934.04
II. Net assets at the end of the period EUR 690,691,916.34
The accompanying notes form an integral part of the financial statements. 50
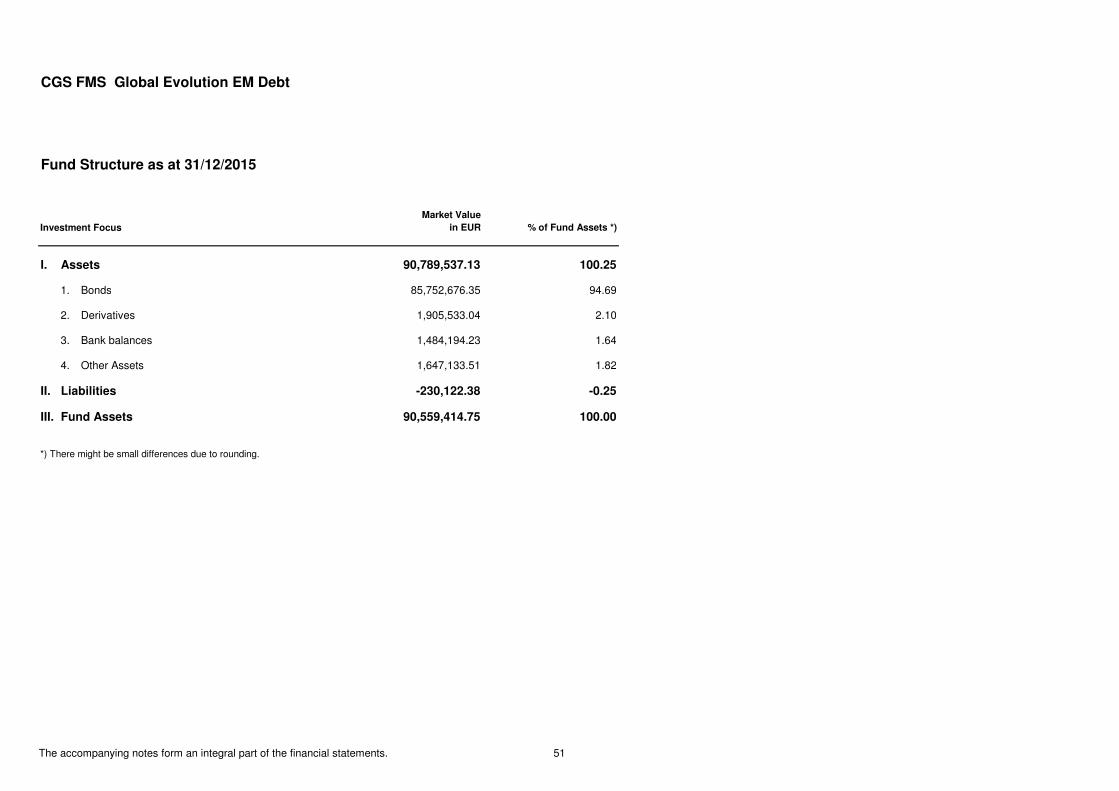
CGS FMS Global Evolution EM Debt
Fund Structure as at 31/12/2015
Investment Focus
Market Value
in EUR % of Fund Assets *)
I. Assets 90,789,537.13 100.25
1. Bonds 85,752,676.35 94.69
2. Derivatives 1,905,533.04 2.10
3. Bank balances 1,484,194.23 1.64
4. Other Assets 1,647,133.51 1.82
II. Liabilities -230,122.38 -0.25
III. Fund Assets 90,559,414.75 100.00
*) There might be small differences due to rounding.
The accompanying notes form an integral part of the financial statements. 51
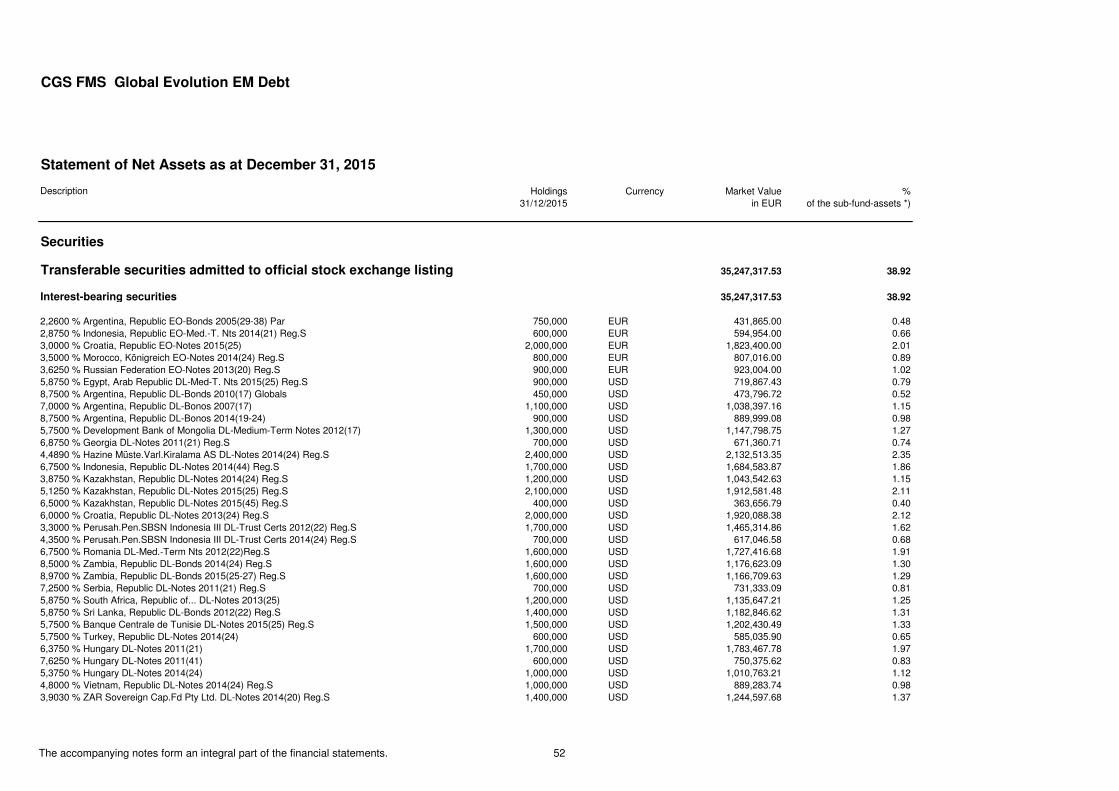
CGS FMS Global Evolution EM Debt
Statement of Net Assets as at December 31, 2015
Description Holdings Currency Market Value %31/12/2015 in EUR of the sub-fund-assets *)
Securities
Transferable securities admitted to official stock exchange listing 35,247,317.53 38.92
Interest-bearing securities 35,247,317.53 38.92
2,2600 % Argentina, Republic EO-Bonds 2005(29-38) Par 750,000 EUR 431,865.00 0.482,8750 % Indonesia, Republic EO-Med.-T. Nts 2014(21) Reg.S 600,000 EUR 594,954.00 0.663,0000 % Croatia, Republic EO-Notes 2015(25) 2,000,000 EUR 1,823,400.00 2.013,5000 % Morocco, Königreich EO-Notes 2014(24) Reg.S 800,000 EUR 807,016.00 0.893,6250 % Russian Federation EO-Notes 2013(20) Reg.S 900,000 EUR 923,004.00 1.025,8750 % Egypt, Arab Republic DL-Med-T. Nts 2015(25) Reg.S 900,000 USD 719,867.43 0.798,7500 % Argentina, Republic DL-Bonds 2010(17) Globals 450,000 USD 473,796.72 0.527,0000 % Argentina, Republic DL-Bonos 2007(17) 1,100,000 USD 1,038,397.16 1.158,7500 % Argentina, Republic DL-Bonos 2014(19-24) 900,000 USD 889,999.08 0.985,7500 % Development Bank of Mongolia DL-Medium-Term Notes 2012(17) 1,300,000 USD 1,147,798.75 1.276,8750 % Georgia DL-Notes 2011(21) Reg.S 700,000 USD 671,360.71 0.744,4890 % Hazine Müste.Varl.Kiralama AS DL-Notes 2014(24) Reg.S 2,400,000 USD 2,132,513.35 2.356,7500 % Indonesia, Republic DL-Notes 2014(44) Reg.S 1,700,000 USD 1,684,583.87 1.863,8750 % Kazakhstan, Republic DL-Notes 2014(24) Reg.S 1,200,000 USD 1,043,542.63 1.155,1250 % Kazakhstan, Republic DL-Notes 2015(25) Reg.S 2,100,000 USD 1,912,581.48 2.116,5000 % Kazakhstan, Republic DL-Notes 2015(45) Reg.S 400,000 USD 363,656.79 0.406,0000 % Croatia, Republic DL-Notes 2013(24) Reg.S 2,000,000 USD 1,920,088.38 2.123,3000 % Perusah.Pen.SBSN Indonesia III DL-Trust Certs 2012(22) Reg.S 1,700,000 USD 1,465,314.86 1.624,3500 % Perusah.Pen.SBSN Indonesia III DL-Trust Certs 2014(24) Reg.S 700,000 USD 617,046.58 0.686,7500 % Romania DL-Med.-Term Nts 2012(22)Reg.S 1,600,000 USD 1,727,416.68 1.918,5000 % Zambia, Republic DL-Bonds 2014(24) Reg.S 1,600,000 USD 1,176,623.09 1.308,9700 % Zambia, Republic DL-Bonds 2015(25-27) Reg.S 1,600,000 USD 1,166,709.63 1.297,2500 % Serbia, Republic DL-Notes 2011(21) Reg.S 700,000 USD 731,333.09 0.815,8750 % South Africa, Republic of... DL-Notes 2013(25) 1,200,000 USD 1,135,647.21 1.255,8750 % Sri Lanka, Republic DL-Bonds 2012(22) Reg.S 1,400,000 USD 1,182,846.62 1.315,7500 % Banque Centrale de Tunisie DL-Notes 2015(25) Reg.S 1,500,000 USD 1,202,430.49 1.335,7500 % Turkey, Republic DL-Notes 2014(24) 600,000 USD 585,035.90 0.656,3750 % Hungary DL-Notes 2011(21) 1,700,000 USD 1,783,467.78 1.977,6250 % Hungary DL-Notes 2011(41) 600,000 USD 750,375.62 0.835,3750 % Hungary DL-Notes 2014(24) 1,000,000 USD 1,010,763.21 1.124,8000 % Vietnam, Republic DL-Notes 2014(24) Reg.S 1,000,000 USD 889,283.74 0.983,9030 % ZAR Sovereign Cap.Fd Pty Ltd. DL-Notes 2014(20) Reg.S 1,400,000 USD 1,244,597.68 1.37
The accompanying notes form an integral part of the financial statements. 52
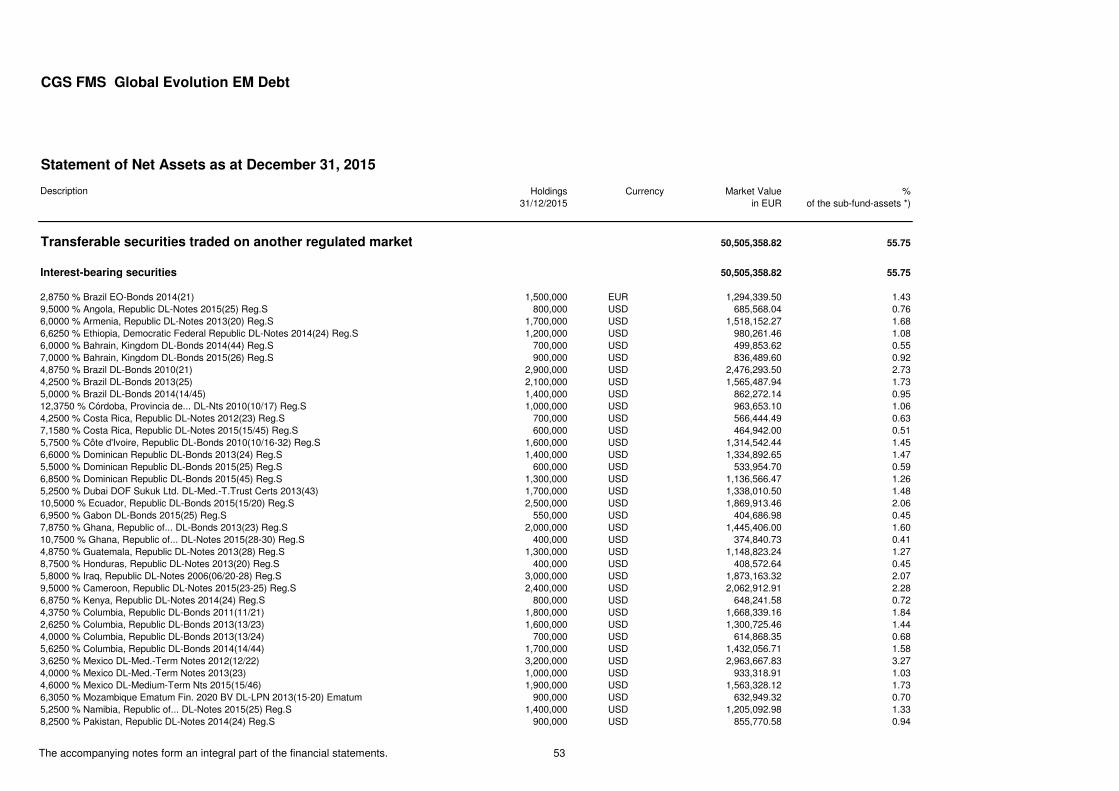
CGS FMS Global Evolution EM Debt
Statement of Net Assets as at December 31, 2015
Description Holdings Currency Market Value %31/12/2015 in EUR of the sub-fund-assets *)
Transferable securities traded on another regulated market 50,505,358.82 55.75
Interest-bearing securities 50,505,358.82 55.75
2,8750 % Brazil EO-Bonds 2014(21) 1,500,000 EUR 1,294,339.50 1.439,5000 % Angola, Republic DL-Notes 2015(25) Reg.S 800,000 USD 685,568.04 0.766,0000 % Armenia, Republic DL-Notes 2013(20) Reg.S 1,700,000 USD 1,518,152.27 1.686,6250 % Ethiopia, Democratic Federal Republic DL-Notes 2014(24) Reg.S 1,200,000 USD 980,261.46 1.086,0000 % Bahrain, Kingdom DL-Bonds 2014(44) Reg.S 700,000 USD 499,853.62 0.557,0000 % Bahrain, Kingdom DL-Bonds 2015(26) Reg.S 900,000 USD 836,489.60 0.924,8750 % Brazil DL-Bonds 2010(21) 2,900,000 USD 2,476,293.50 2.734,2500 % Brazil DL-Bonds 2013(25) 2,100,000 USD 1,565,487.94 1.735,0000 % Brazil DL-Bonds 2014(14/45) 1,400,000 USD 862,272.14 0.9512,3750 % Córdoba, Provincia de... DL-Nts 2010(10/17) Reg.S 1,000,000 USD 963,653.10 1.064,2500 % Costa Rica, Republic DL-Notes 2012(23) Reg.S 700,000 USD 566,444.49 0.637,1580 % Costa Rica, Republic DL-Notes 2015(15/45) Reg.S 600,000 USD 464,942.00 0.515,7500 % Côte d'Ivoire, Republic DL-Bonds 2010(10/16-32) Reg.S 1,600,000 USD 1,314,542.44 1.456,6000 % Dominican Republic DL-Bonds 2013(24) Reg.S 1,400,000 USD 1,334,892.65 1.475,5000 % Dominican Republic DL-Bonds 2015(25) Reg.S 600,000 USD 533,954.70 0.596,8500 % Dominican Republic DL-Bonds 2015(45) Reg.S 1,300,000 USD 1,136,566.47 1.265,2500 % Dubai DOF Sukuk Ltd. DL-Med.-T.Trust Certs 2013(43) 1,700,000 USD 1,338,010.50 1.4810,5000 % Ecuador, Republic DL-Bonds 2015(15/20) Reg.S 2,500,000 USD 1,869,913.46 2.066,9500 % Gabon DL-Bonds 2015(25) Reg.S 550,000 USD 404,686.98 0.457,8750 % Ghana, Republic of... DL-Bonds 2013(23) Reg.S 2,000,000 USD 1,445,406.00 1.6010,7500 % Ghana, Republic of... DL-Notes 2015(28-30) Reg.S 400,000 USD 374,840.73 0.414,8750 % Guatemala, Republic DL-Notes 2013(28) Reg.S 1,300,000 USD 1,148,823.24 1.278,7500 % Honduras, Republic DL-Notes 2013(20) Reg.S 400,000 USD 408,572.64 0.455,8000 % Iraq, Republic DL-Notes 2006(06/20-28) Reg.S 3,000,000 USD 1,873,163.32 2.079,5000 % Cameroon, Republic DL-Notes 2015(23-25) Reg.S 2,400,000 USD 2,062,912.91 2.286,8750 % Kenya, Republic DL-Notes 2014(24) Reg.S 800,000 USD 648,241.58 0.724,3750 % Columbia, Republic DL-Bonds 2011(11/21) 1,800,000 USD 1,668,339.16 1.842,6250 % Columbia, Republic DL-Bonds 2013(13/23) 1,600,000 USD 1,300,725.46 1.444,0000 % Columbia, Republic DL-Bonds 2013(13/24) 700,000 USD 614,868.35 0.685,6250 % Columbia, Republic DL-Bonds 2014(14/44) 1,700,000 USD 1,432,056.71 1.583,6250 % Mexico DL-Med.-Term Notes 2012(12/22) 3,200,000 USD 2,963,667.83 3.274,0000 % Mexico DL-Med.-Term Notes 2013(23) 1,000,000 USD 933,318.91 1.034,6000 % Mexico DL-Medium-Term Nts 2015(15/46) 1,900,000 USD 1,563,328.12 1.736,3050 % Mozambique Ematum Fin. 2020 BV DL-LPN 2013(15-20) Ematum 900,000 USD 632,949.32 0.705,2500 % Namibia, Republic of... DL-Notes 2015(25) Reg.S 1,400,000 USD 1,205,092.98 1.338,2500 % Pakistan, Republic DL-Notes 2014(24) Reg.S 900,000 USD 855,770.58 0.94
The accompanying notes form an integral part of the financial statements. 53
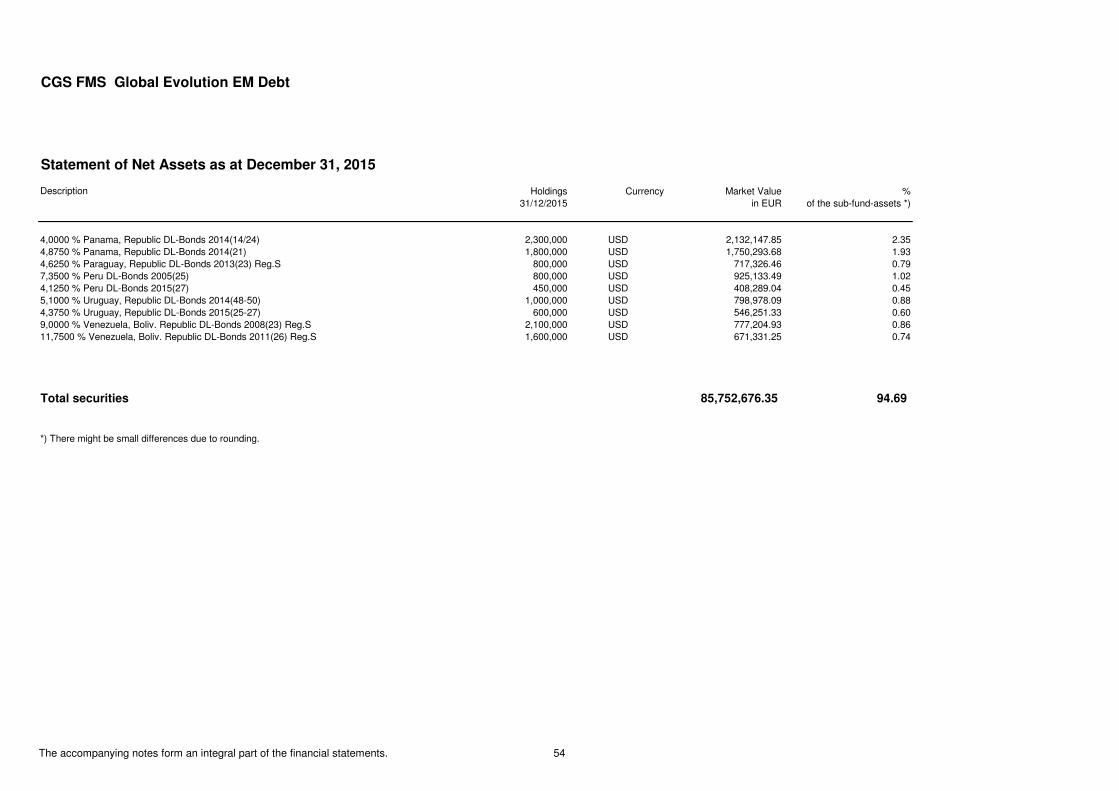
CGS FMS Global Evolution EM Debt
Statement of Net Assets as at December 31, 2015
Description Holdings Currency Market Value %31/12/2015 in EUR of the sub-fund-assets *)
4,0000 % Panama, Republic DL-Bonds 2014(14/24) 2,300,000 USD 2,132,147.85 2.354,8750 % Panama, Republic DL-Bonds 2014(21) 1,800,000 USD 1,750,293.68 1.934,6250 % Paraguay, Republic DL-Bonds 2013(23) Reg.S 800,000 USD 717,326.46 0.797,3500 % Peru DL-Bonds 2005(25) 800,000 USD 925,133.49 1.024,1250 % Peru DL-Bonds 2015(27) 450,000 USD 408,289.04 0.455,1000 % Uruguay, Republic DL-Bonds 2014(48-50) 1,000,000 USD 798,978.09 0.884,3750 % Uruguay, Republic DL-Bonds 2015(25-27) 600,000 USD 546,251.33 0.609,0000 % Venezuela, Boliv. Republic DL-Bonds 2008(23) Reg.S 2,100,000 USD 777,204.93 0.8611,7500 % Venezuela, Boliv. Republic DL-Bonds 2011(26) Reg.S 1,600,000 USD 671,331.25 0.74
Total securities 85,752,676.35 94.69
*) There might be small differences due to rounding.
The accompanying notes form an integral part of the financial statements. 54
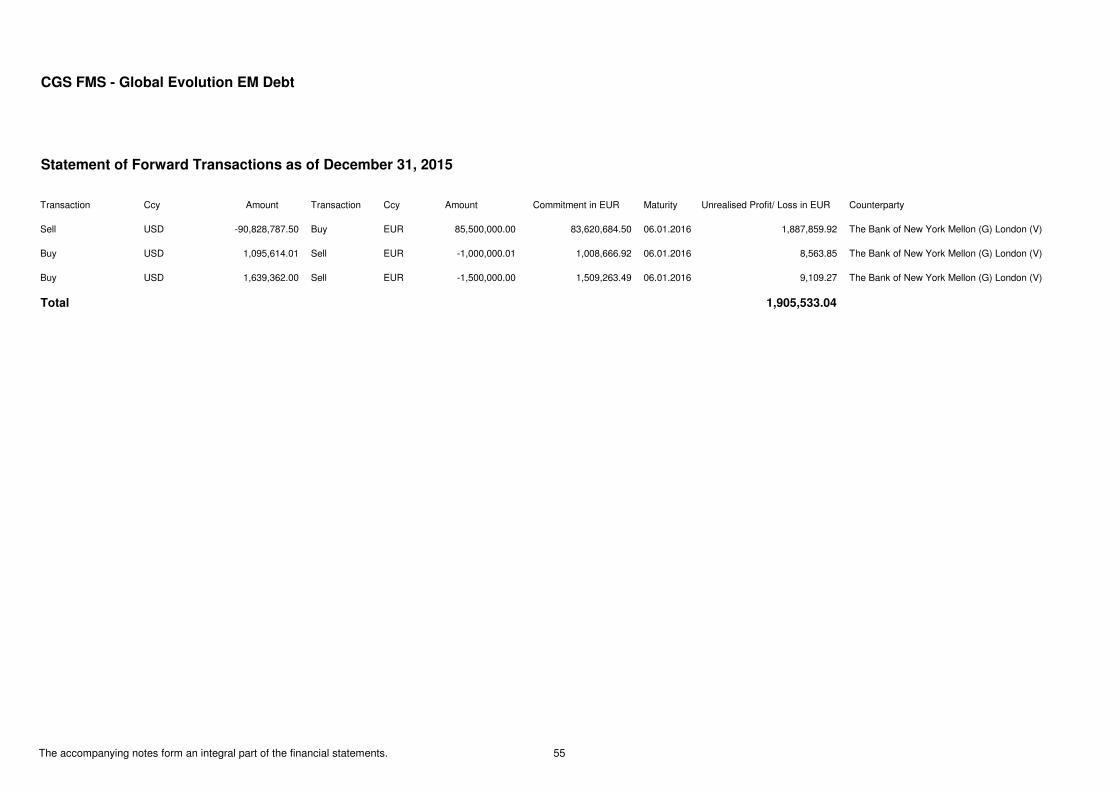
CGS FMS - Global Evolution EM Debt
Statement of Forward Transactions as of December 31, 2015
Transaction Ccy Amount Transaction Ccy Amount Commitment in EUR Maturity Unrealised Profit/ Loss in EUR Counterparty
Sell USD -90,828,787.50 Buy EUR 85,500,000.00 83,620,684.50 06.01.2016 1,887,859.92 The Bank of New York Mellon (G) London (V)
Buy USD 1,095,614.01 Sell EUR -1,000,000.01 1,008,666.92 06.01.2016 8,563.85 The Bank of New York Mellon (G) London (V)
Buy USD 1,639,362.00 Sell EUR -1,500,000.00 1,509,263.49 06.01.2016 9,109.27 The Bank of New York Mellon (G) London (V)
Total 1,905,533.04
The accompanying notes form an integral part of the financial statements. 55
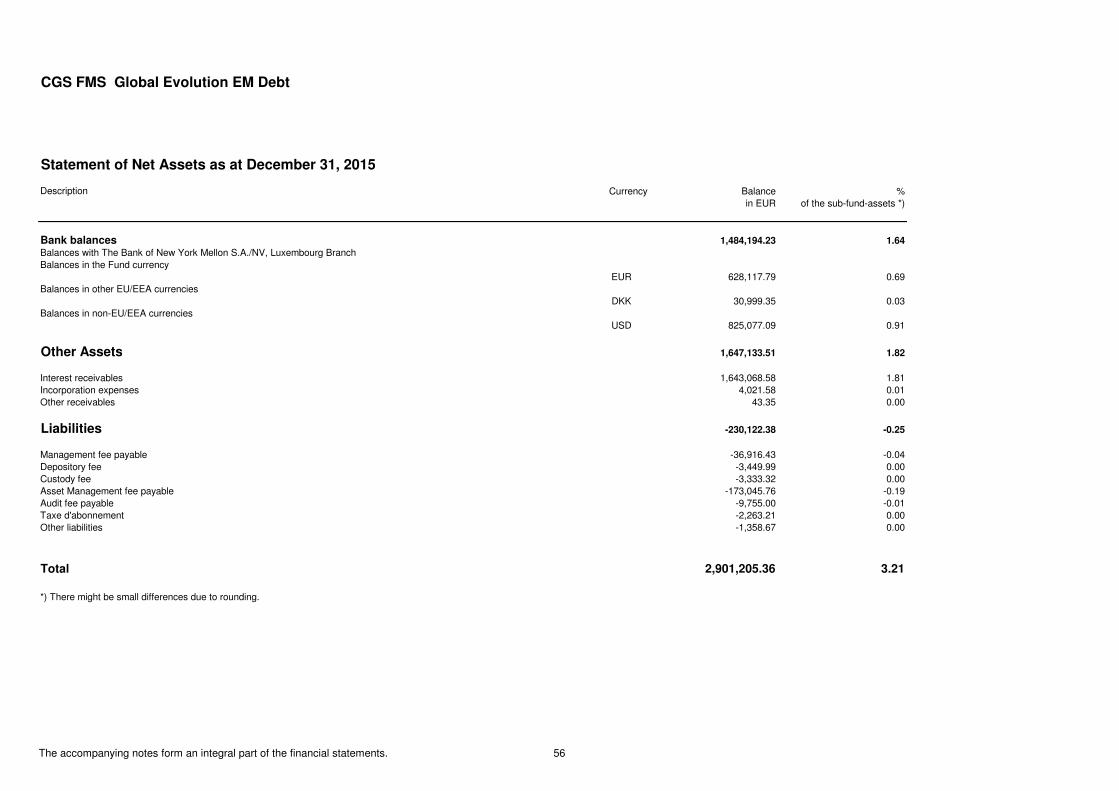
CGS FMS Global Evolution EM Debt
Statement of Net Assets as at December 31, 2015
Description Currency Balance %in EUR of the sub-fund-assets *)
Bank balances 1,484,194.23 1.64
Balances with The Bank of New York Mellon S.A./NV, Luxembourg BranchBalances in the Fund currency
EUR 628,117.79 0.69Balances in other EU/EEA currencies
DKK 30,999.35 0.03Balances in non-EU/EEA currencies
USD 825,077.09 0.91
Other Assets 1,647,133.51 1.82
Interest receivables 1,643,068.58 1.81Incorporation expenses 4,021.58 0.01Other receivables 43.35 0.00
Liabilities -230,122.38 -0.25
Management fee payable -36,916.43 -0.04Depository fee -3,449.99 0.00Custody fee -3,333.32 0.00Asset Management fee payable -173,045.76 -0.19Audit fee payable -9,755.00 -0.01Taxe d'abonnement -2,263.21 0.00Other liabilities -1,358.67 0.00
Total 2,901,205.36 3.21
*) There might be small differences due to rounding.
The accompanying notes form an integral part of the financial statements. 56

CGS FMS Global Evolution EM Debt
Statement of operations (including income equalisation)for the period from 01/01/2015 to 31/12/2015
Total
I. Income
- Interest on securities EUR 5,475,443.80 - Interest on liquidity investments *) EUR -5,578.70 - Other income EUR 410,712.06
Total income EUR 5,880,577.16
II. Expenses
- Interest on bank overdraft EUR -157.02 - Management Company fee EUR -174,947.44 - Asset Management fee EUR -842,268.65 - Custody fee EUR -14,350.57 - Depository fee EUR -13,099.38 - Performance fee EUR -130,666.18 - Auditing and publication expenses EUR -17,108.77 - Subscription tax ("Taxe d`abonnement") EUR -10,599.18 - Registrar and Transfer Agent fee EUR -8,585.48 - Legal fee EUR -16,759.03 - Foreign withholding taxes EUR -244.67 - Incorporation expenses EUR -8,043.14 - Equalisation of ordinary expenses EUR 249,729.66 - Other expenses EUR -75,161.96
Total expenses EUR -1,062,261.81
III. Ordinary net result EUR 4,818,315.35
*) The position 'interest on liquidity investments' includes negative interest of 5,578.70 EUR.
The accompanying notes form an integral part of the financial statements. 57

CGS FMS Global Evolution EM Debt
Statement of operations (including income equalisation)for the period from 01/01/2015 to 31/12/2015
Total
IV. Realised profit/loss on
1. Realised profit on EUR 28,909,334.74 - Securities EUR 17,942,339.06 - Forward exchange transactions EUR 9,869,061.05 - Foreign exchange transactions EUR 1,097,934.63
2. Realised loss on EUR -24,773,602.96 - Securities EUR -3,571,701.29 - Forward exchange transactions EUR -21,201,901.67
Total realised profit/loss EUR 4,135,731.78
V. Net change in unrealised profit/loss on
- Securities EUR -9,313,091.85 - Forward exchange transactions EUR 4,120,175.25 - Foreign exchange transactions and other transactions EUR -42,377.86
Total net change in unrealised profit/loss EUR -5,235,294.46
VI. Result of operations for the period EUR 3,718,752.67
The accompanying notes form an integral part of the financial statements. 58

CGS FMS Global Evolution EM Debt
Statement of Changes in Net Assets 2015
I. Net assets at the beginning of the period EUR 132,238,630.59
1. Distribution for the previous year EUR 0.002. Interim distributions EUR 0.003. Net cash flow EUR -41,977,625.13 a) Proceeds from shares issued EUR 39,944,881.70 b) Proceeds from shares redeemed EUR -81,922,506.834. Income/expense equalisation EUR -3,420,343.385. Results of operations for the period EUR 3,718,752.67
II. Net assets at the end of the period EUR 90,559,414.75
The accompanying notes form an integral part of the financial statements. 59
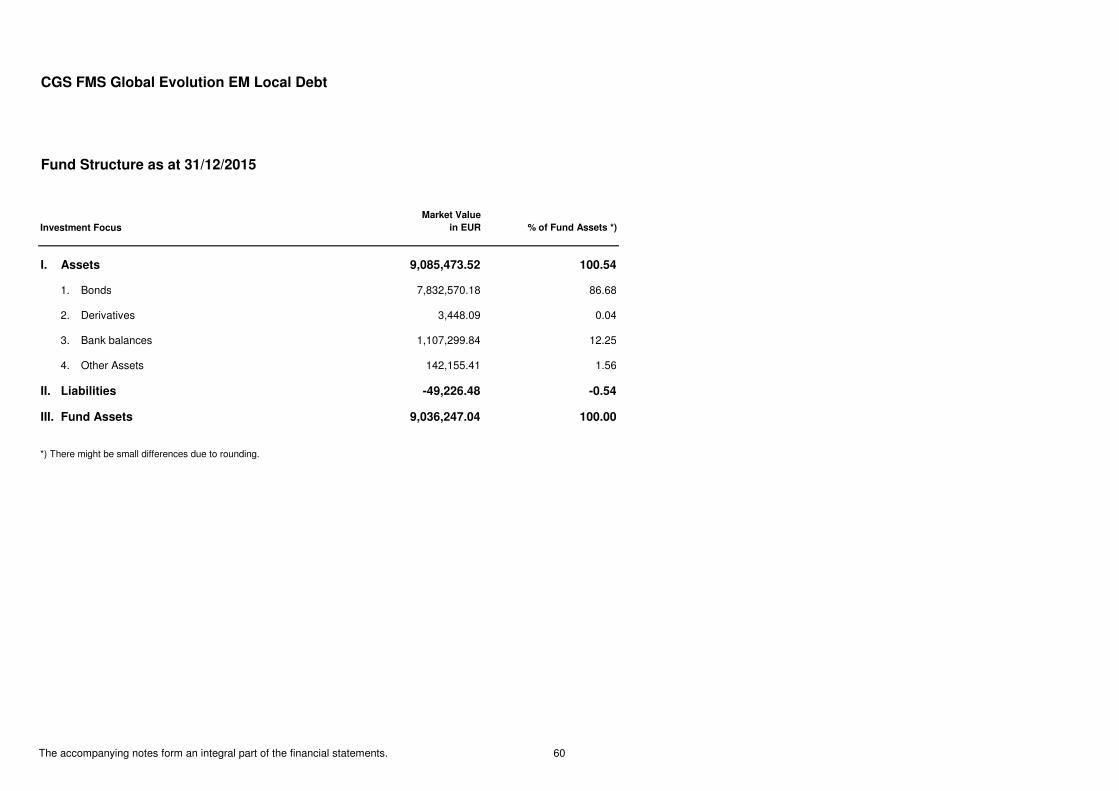
CGS FMS Global Evolution EM Local Debt
Fund Structure as at 31/12/2015
Investment Focus
Market Value
in EUR % of Fund Assets *)
I. Assets 9,085,473.52 100.54
1. Bonds 7,832,570.18 86.68
2. Derivatives 3,448.09 0.04
3. Bank balances 1,107,299.84 12.25
4. Other Assets 142,155.41 1.56
II. Liabilities -49,226.48 -0.54
III. Fund Assets 9,036,247.04 100.00
*) There might be small differences due to rounding.
The accompanying notes form an integral part of the financial statements. 60
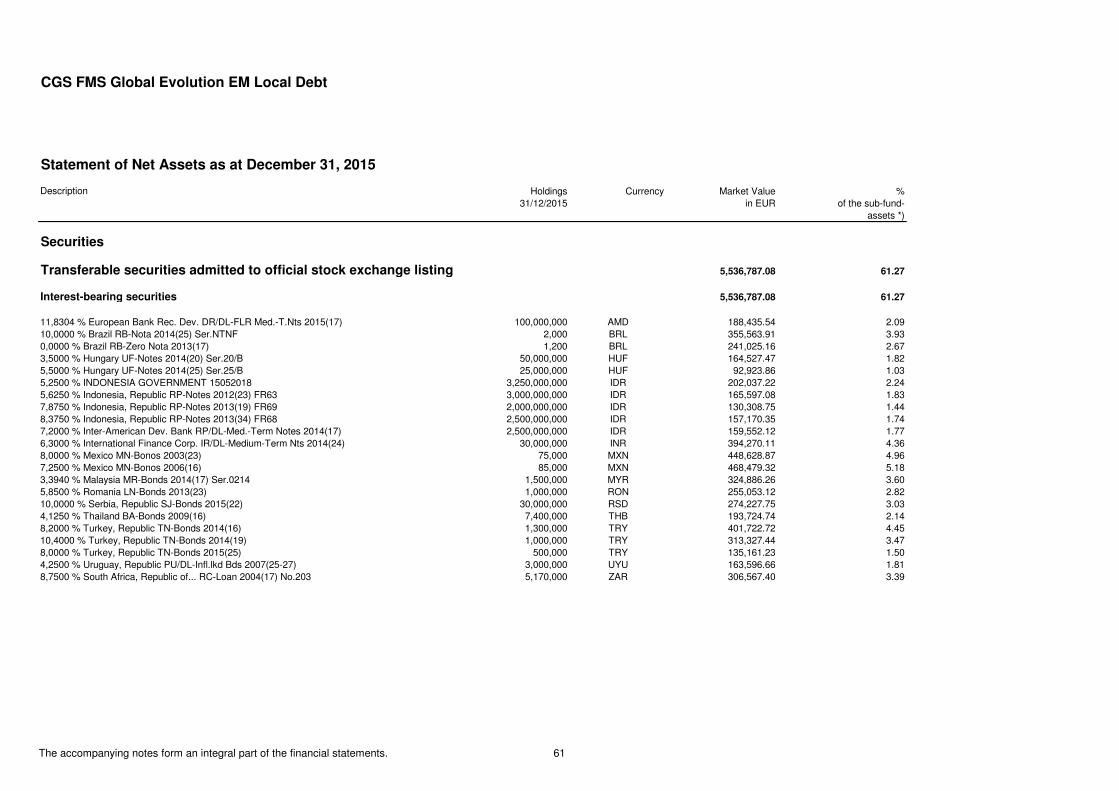
CGS FMS Global Evolution EM Local Debt
Statement of Net Assets as at December 31, 2015
Description Holdings Currency Market Value %31/12/2015 in EUR of the sub-fund-
assets *)
Securities
Transferable securities admitted to official stock exchange listing 5,536,787.08 61.27
Interest-bearing securities 5,536,787.08 61.27
11,8304 % European Bank Rec. Dev. DR/DL-FLR Med.-T.Nts 2015(17) 100,000,000 AMD 188,435.54 2.0910,0000 % Brazil RB-Nota 2014(25) Ser.NTNF 2,000 BRL 355,563.91 3.930,0000 % Brazil RB-Zero Nota 2013(17) 1,200 BRL 241,025.16 2.673,5000 % Hungary UF-Notes 2014(20) Ser.20/B 50,000,000 HUF 164,527.47 1.825,5000 % Hungary UF-Notes 2014(25) Ser.25/B 25,000,000 HUF 92,923.86 1.035,2500 % INDONESIA GOVERNMENT 15052018 3,250,000,000 IDR 202,037.22 2.245,6250 % Indonesia, Republic RP-Notes 2012(23) FR63 3,000,000,000 IDR 165,597.08 1.837,8750 % Indonesia, Republic RP-Notes 2013(19) FR69 2,000,000,000 IDR 130,308.75 1.448,3750 % Indonesia, Republic RP-Notes 2013(34) FR68 2,500,000,000 IDR 157,170.35 1.747,2000 % Inter-American Dev. Bank RP/DL-Med.-Term Notes 2014(17) 2,500,000,000 IDR 159,552.12 1.776,3000 % International Finance Corp. IR/DL-Medium-Term Nts 2014(24) 30,000,000 INR 394,270.11 4.368,0000 % Mexico MN-Bonos 2003(23) 75,000 MXN 448,628.87 4.967,2500 % Mexico MN-Bonos 2006(16) 85,000 MXN 468,479.32 5.183,3940 % Malaysia MR-Bonds 2014(17) Ser.0214 1,500,000 MYR 324,886.26 3.605,8500 % Romania LN-Bonds 2013(23) 1,000,000 RON 255,053.12 2.8210,0000 % Serbia, Republic SJ-Bonds 2015(22) 30,000,000 RSD 274,227.75 3.034,1250 % Thailand BA-Bonds 2009(16) 7,400,000 THB 193,724.74 2.148,2000 % Turkey, Republic TN-Bonds 2014(16) 1,300,000 TRY 401,722.72 4.4510,4000 % Turkey, Republic TN-Bonds 2014(19) 1,000,000 TRY 313,327.44 3.478,0000 % Turkey, Republic TN-Bonds 2015(25) 500,000 TRY 135,161.23 1.504,2500 % Uruguay, Republic PU/DL-Infl.lkd Bds 2007(25-27) 3,000,000 UYU 163,596.66 1.818,7500 % South Africa, Republic of... RC-Loan 2004(17) No.203 5,170,000 ZAR 306,567.40 3.39
The accompanying notes form an integral part of the financial statements. 61
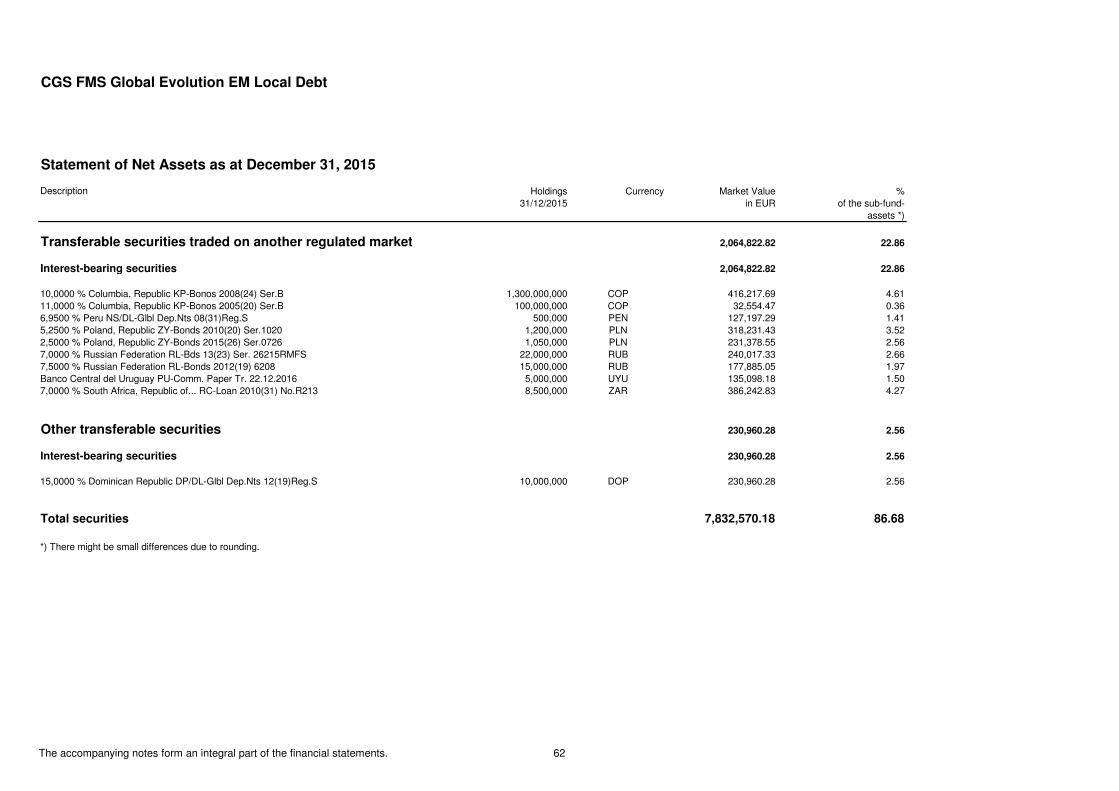
CGS FMS Global Evolution EM Local Debt
Statement of Net Assets as at December 31, 2015
Description Holdings Currency Market Value %31/12/2015 in EUR of the sub-fund-
assets *)
Transferable securities traded on another regulated market 2,064,822.82 22.86
Interest-bearing securities 2,064,822.82 22.86
10,0000 % Columbia, Republic KP-Bonos 2008(24) Ser.B 1,300,000,000 COP 416,217.69 4.6111,0000 % Columbia, Republic KP-Bonos 2005(20) Ser.B 100,000,000 COP 32,554.47 0.366,9500 % Peru NS/DL-Glbl Dep.Nts 08(31)Reg.S 500,000 PEN 127,197.29 1.415,2500 % Poland, Republic ZY-Bonds 2010(20) Ser.1020 1,200,000 PLN 318,231.43 3.522,5000 % Poland, Republic ZY-Bonds 2015(26) Ser.0726 1,050,000 PLN 231,378.55 2.567,0000 % Russian Federation RL-Bds 13(23) Ser. 26215RMFS 22,000,000 RUB 240,017.33 2.667,5000 % Russian Federation RL-Bonds 2012(19) 6208 15,000,000 RUB 177,885.05 1.97Banco Central del Uruguay PU-Comm. Paper Tr. 22.12.2016 5,000,000 UYU 135,098.18 1.507,0000 % South Africa, Republic of... RC-Loan 2010(31) No.R213 8,500,000 ZAR 386,242.83 4.27
Other transferable securities 230,960.28 2.56
Interest-bearing securities 230,960.28 2.56
15,0000 % Dominican Republic DP/DL-Glbl Dep.Nts 12(19)Reg.S 10,000,000 DOP 230,960.28 2.56
Total securities 7,832,570.18 86.68
*) There might be small differences due to rounding.
The accompanying notes form an integral part of the financial statements. 62
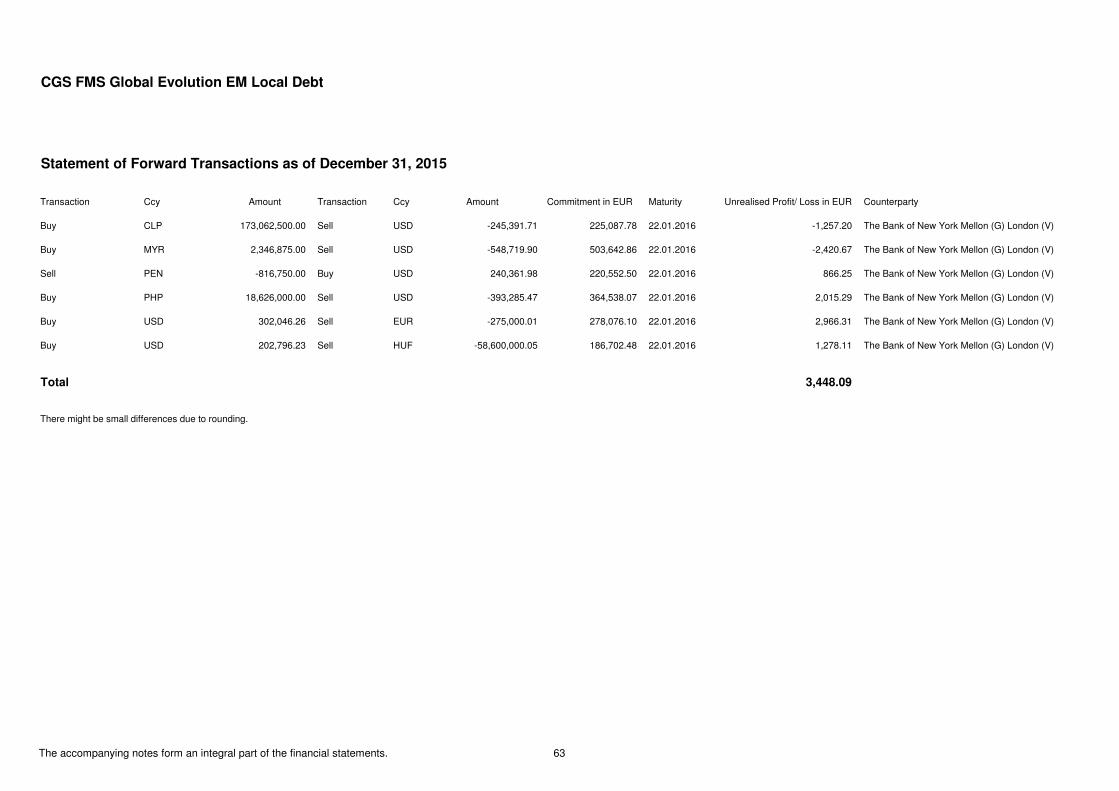
CGS FMS Global Evolution EM Local Debt
Statement of Forward Transactions as of December 31, 2015
Transaction Ccy Amount Transaction Ccy Amount Commitment in EUR Maturity Unrealised Profit/ Loss in EUR Counterparty
Buy CLP 173,062,500.00 Sell USD -245,391.71 225,087.78 22.01.2016 -1,257.20 The Bank of New York Mellon (G) London (V)
Buy MYR 2,346,875.00 Sell USD -548,719.90 503,642.86 22.01.2016 -2,420.67 The Bank of New York Mellon (G) London (V)
Sell PEN -816,750.00 Buy USD 240,361.98 220,552.50 22.01.2016 866.25 The Bank of New York Mellon (G) London (V)
Buy PHP 18,626,000.00 Sell USD -393,285.47 364,538.07 22.01.2016 2,015.29 The Bank of New York Mellon (G) London (V)
Buy USD 302,046.26 Sell EUR -275,000.01 278,076.10 22.01.2016 2,966.31 The Bank of New York Mellon (G) London (V)
Buy USD 202,796.23 Sell HUF -58,600,000.05 186,702.48 22.01.2016 1,278.11 The Bank of New York Mellon (G) London (V)
Total 3,448.09
There might be small differences due to rounding.
The accompanying notes form an integral part of the financial statements. 63
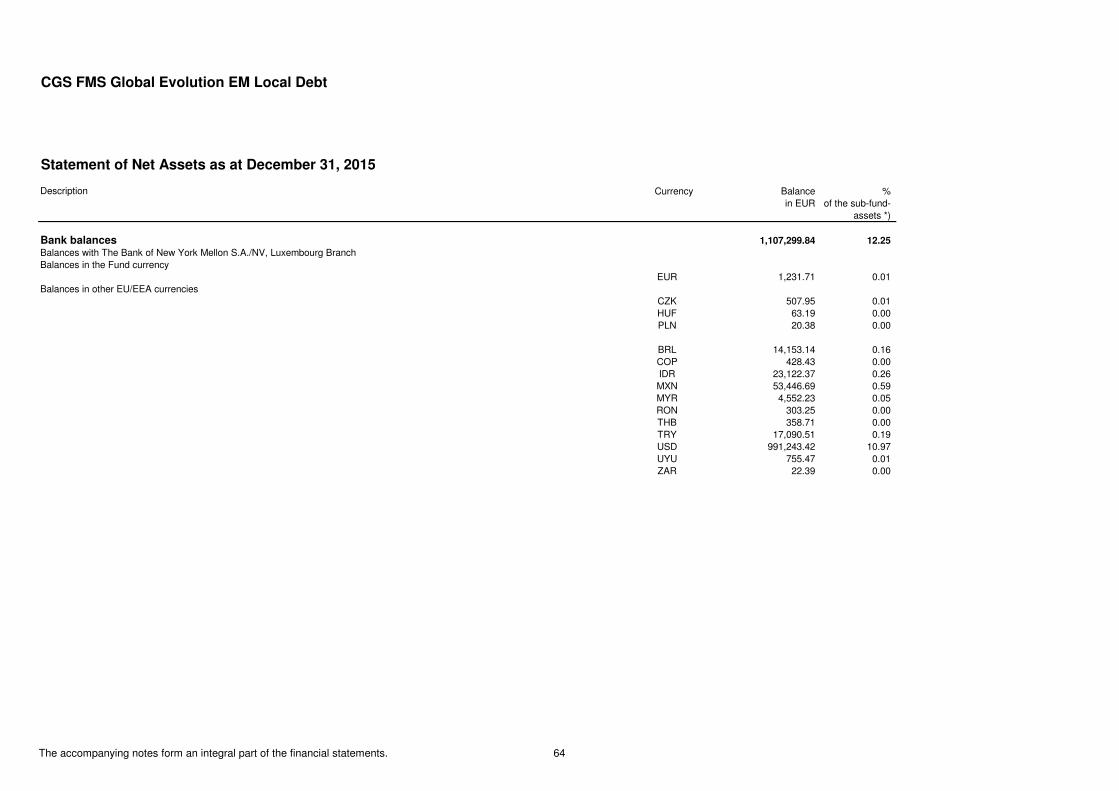
CGS FMS Global Evolution EM Local Debt
Statement of Net Assets as at December 31, 2015
Description Currency Balance %in EUR of the sub-fund-
assets *)
Bank balances 1,107,299.84 12.25
Balances with The Bank of New York Mellon S.A./NV, Luxembourg BranchBalances in the Fund currency
EUR 1,231.71 0.01Balances in other EU/EEA currencies
CZK 507.95 0.01HUF 63.19 0.00PLN 20.38 0.00
BRL 14,153.14 0.16COP 428.43 0.00IDR 23,122.37 0.26MXN 53,446.69 0.59MYR 4,552.23 0.05RON 303.25 0.00THB 358.71 0.00TRY 17,090.51 0.19USD 991,243.42 10.97UYU 755.47 0.01ZAR 22.39 0.00
The accompanying notes form an integral part of the financial statements. 64
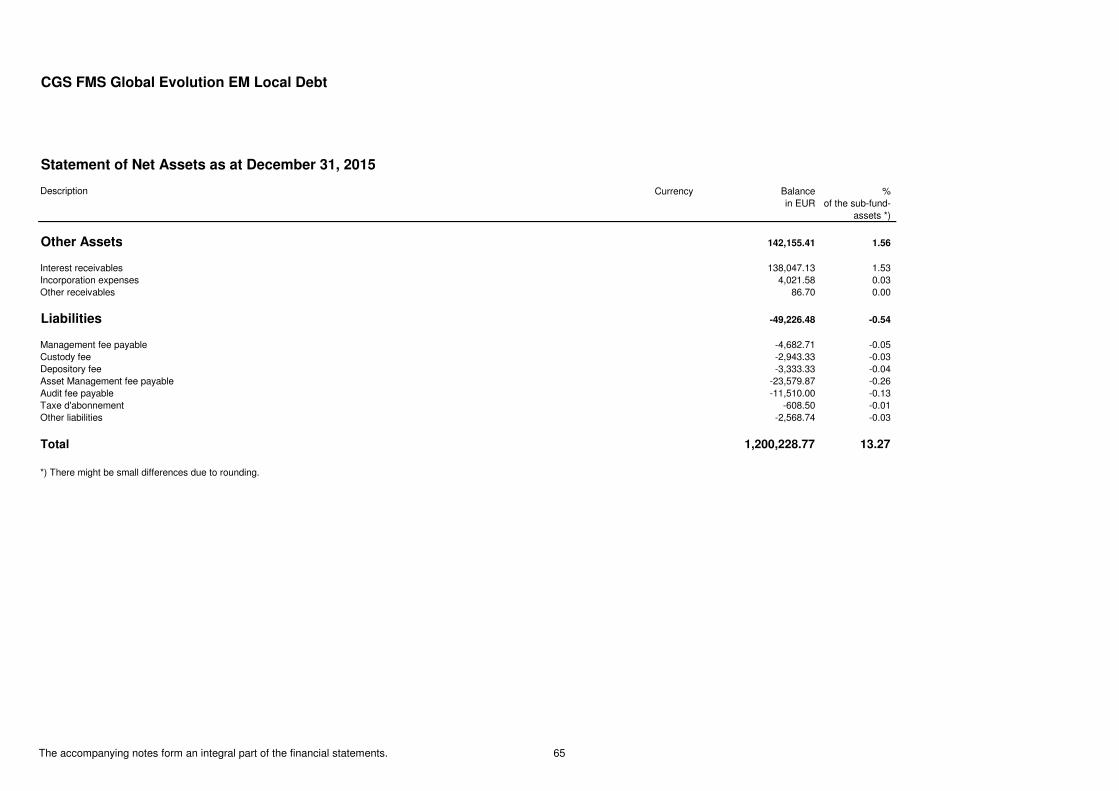
CGS FMS Global Evolution EM Local Debt
Statement of Net Assets as at December 31, 2015
Description Currency Balance %in EUR of the sub-fund-
assets *)
Other Assets 142,155.41 1.56
Interest receivables 138,047.13 1.53Incorporation expenses 4,021.58 0.03Other receivables 86.70 0.00
Liabilities -49,226.48 -0.54
Management fee payable -4,682.71 -0.05Custody fee -2,943.33 -0.03Depository fee -3,333.33 -0.04Asset Management fee payable -23,579.87 -0.26Audit fee payable -11,510.00 -0.13Taxe d'abonnement -608.50 -0.01Other liabilities -2,568.74 -0.03
Total 1,200,228.77 13.27
*) There might be small differences due to rounding.
The accompanying notes form an integral part of the financial statements. 65
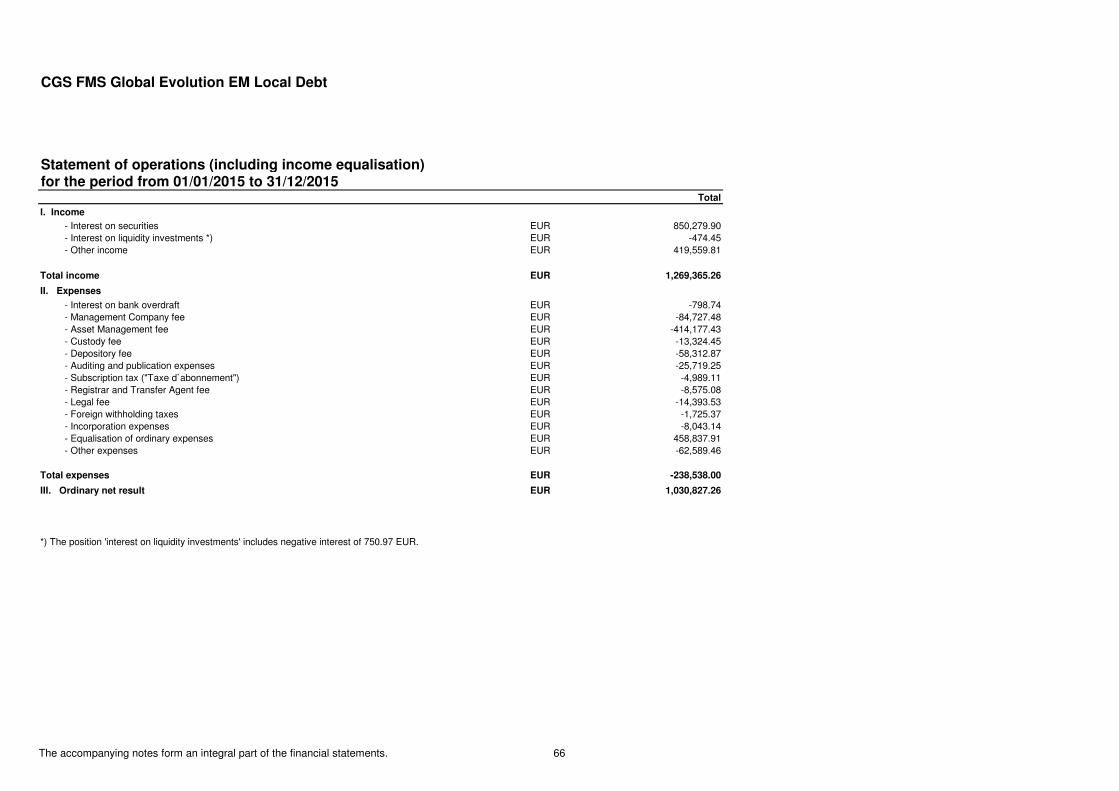
CGS FMS Global Evolution EM Local Debt
Statement of operations (including income equalisation)for the period from 01/01/2015 to 31/12/2015
Total
I. Income
- Interest on securities EUR 850,279.90 - Interest on liquidity investments *) EUR -474.45 - Other income EUR 419,559.81
Total income EUR 1,269,365.26
II. Expenses
- Interest on bank overdraft EUR -798.74 - Management Company fee EUR -84,727.48 - Asset Management fee EUR -414,177.43 - Custody fee EUR -13,324.45 - Depository fee EUR -58,312.87 - Auditing and publication expenses EUR -25,719.25 - Subscription tax ("Taxe d`abonnement") EUR -4,989.11 - Registrar and Transfer Agent fee EUR -8,575.08 - Legal fee EUR -14,393.53 - Foreign withholding taxes EUR -1,725.37 - Incorporation expenses EUR -8,043.14 - Equalisation of ordinary expenses EUR 458,837.91 - Other expenses EUR -62,589.46
Total expenses EUR -238,538.00
III. Ordinary net result EUR 1,030,827.26
*) The position 'interest on liquidity investments' includes negative interest of 750.97 EUR.
The accompanying notes form an integral part of the financial statements. 66
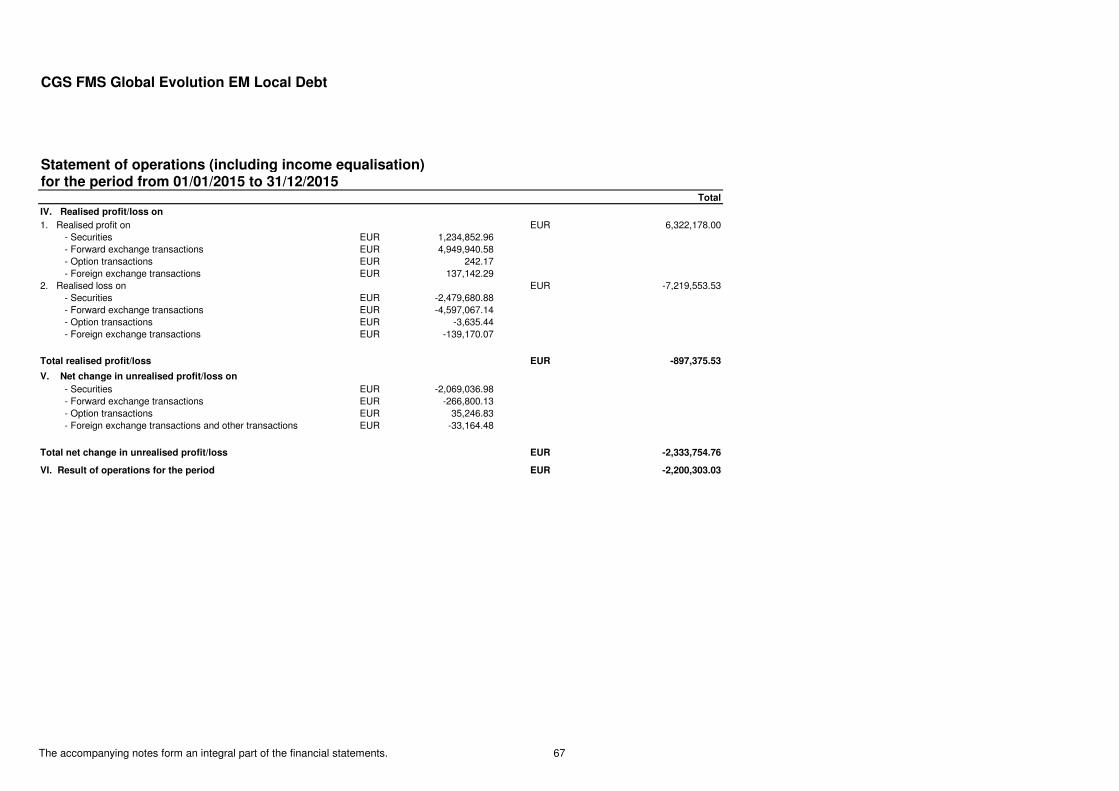
CGS FMS Global Evolution EM Local Debt
Statement of operations (including income equalisation)for the period from 01/01/2015 to 31/12/2015
Total
IV. Realised profit/loss on
1. Realised profit on EUR 6,322,178.00 - Securities EUR 1,234,852.96 - Forward exchange transactions EUR 4,949,940.58 - Option transactions EUR 242.17 - Foreign exchange transactions EUR 137,142.292. Realised loss on EUR -7,219,553.53 - Securities EUR -2,479,680.88 - Forward exchange transactions EUR -4,597,067.14 - Option transactions EUR -3,635.44 - Foreign exchange transactions EUR -139,170.07
Total realised profit/loss EUR -897,375.53
V. Net change in unrealised profit/loss on
- Securities EUR -2,069,036.98 - Forward exchange transactions EUR -266,800.13 - Option transactions EUR 35,246.83 - Foreign exchange transactions and other transactions EUR -33,164.48
Total net change in unrealised profit/loss EUR -2,333,754.76
VI. Result of operations for the period EUR -2,200,303.03
The accompanying notes form an integral part of the financial statements. 67

CGS FMS Global Evolution EM Local Debt
Statement of Changes in Net Assets 2015
I. Net assets at the beginning of the period EUR 96,252,390.04
1. Distribution for the previous year EUR 0.002. Interim distributions EUR 0.003. Net cash flow EUR -92,362,558.64 a) Proceeds from shares issued EUR 8,079,153.73 b) Proceeds from shares redeemed EUR -100,441,712.374. Income/expense equalisation EUR 7,346,718.675. Results of operations for the period EUR -2,200,303.03
II. Net assets at the end of the period EUR 9,036,247.04
The accompanying notes form an integral part of the financial statements. 68
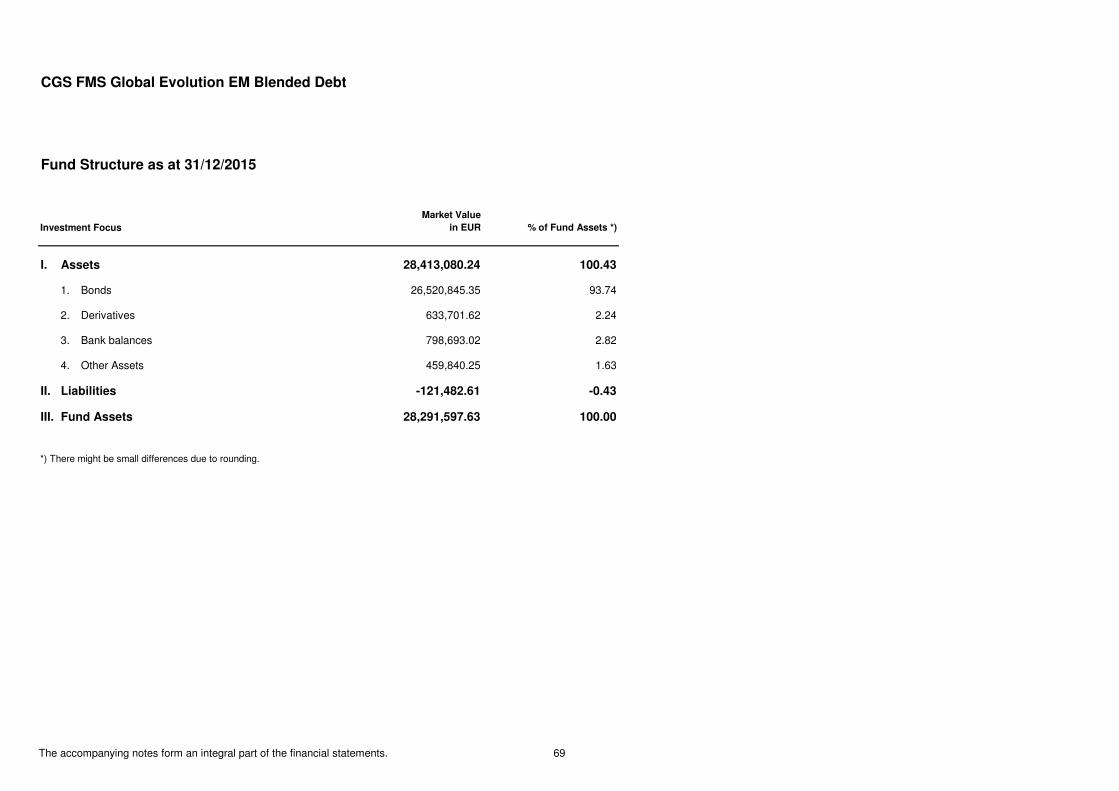
CGS FMS Global Evolution EM Blended Debt
Fund Structure as at 31/12/2015
Investment Focus
Market Value
in EUR % of Fund Assets *)
I. Assets 28,413,080.24 100.43
1. Bonds 26,520,845.35 93.74
2. Derivatives 633,701.62 2.24
3. Bank balances 798,693.02 2.82
4. Other Assets 459,840.25 1.63
II. Liabilities -121,482.61 -0.43
III. Fund Assets 28,291,597.63 100.00
*) There might be small differences due to rounding.
The accompanying notes form an integral part of the financial statements. 69

CGS FMS Global Evolution EM Blended Debt
Statement of Net Assets as at December 31, 2015
Description Holdings Currency Market Value %31/12/2015 in EUR of the sub-fund-
assets *)
Securities
Transferable securities admitted to official stock exchange listing 15,790,150.56 55.81
Interest-bearing securities 15,790,150.56 55.81
10,0000 % Brazil RB-Nota 2012(23) Ser.NTNF 3,500 BRL 650,177.61 2.3010,0000 % Brazil RB-Nota 2014(25) Ser.NTNF 3,000 BRL 533,345.86 1.890,0000 % Brazil RB-Zero Nota 2013(17) 1,400 BRL 281,196.02 0.992,2600 % Argentina, Republic EO-Bonds 2005(29-38) Par 300,000 EUR 172,746.00 0.612,8750 % Indonesia, Republic EO-Med.-T. Nts 2014(21) Reg.S 300,000 EUR 297,477.00 1.053,0000 % Croatia, Republic EO-Notes 2015(25) 300,000 EUR 273,510.00 0.973,6250 % Russisan Federation EO-Notes 2013(20) Reg.S 200,000 EUR 205,112.00 0.723,5000 % Hungary UF-Notes 2014(20) Ser.20/B 175,000,000 HUF 575,846.13 2.045,5000 % Hngary UF-Notes 2014(25) Ser.25/B 100,000,000 HUF 371,695.43 1.318,3750 % Indonesia, Republic RP-Notes 2013(24) FR70 5,000,000,000 IDR 325,424.46 1.158,3750 % Indonesia, Republic RP-Notes 2013(34) FR68 4,000,000,000 IDR 251,472.56 0.897,7500 % International Finance Corp. IR/DL-Medium-Term Nts 2013(16) 65,000,000 INR 912,978.67 3.2310,0000 % Mexico MN-Bonos 2005(24) 65,000 MXN 439,302.05 1.558,5000 % Mexico MN-Bonos 2009(18) 190,000 MXN 1,117,943.21 3.953,1720 % Malaysia MR-Bonds 2013(16) 3,000,000 MYR 646,914.03 2.293,3940 % Malaysia MR-Bonds 2014(17) Ser.0214 2,300,000 MYR 498,158.93 1.765,8500 % Romania LN-Bonds 2013(23) 1,000,000 RON 255,053.12 0.903,2500 % Thailand BA-Bonds 2011(17) 15,000,000 THB 393,752.59 1.398,2000 % Turkey, Republic TN-Bonds 2014(16) 225,000 TRY 69,528.93 0.2510,4000 % Turkey, Republic TN-Bonds 2014(19) 4,000,000 TRY 1,253,309.77 4.438,0000 % Turkey, Republic TN-Bonds 2015(25) 1,000,000 TRY 270,322.46 0.965,8750 % Egypt, Arab Republic DL-Med-T. Nts 2015(25) Reg.S 200,000 USD 159,970.54 0.57
The accompanying notes form an integral part of the financial statements. 70
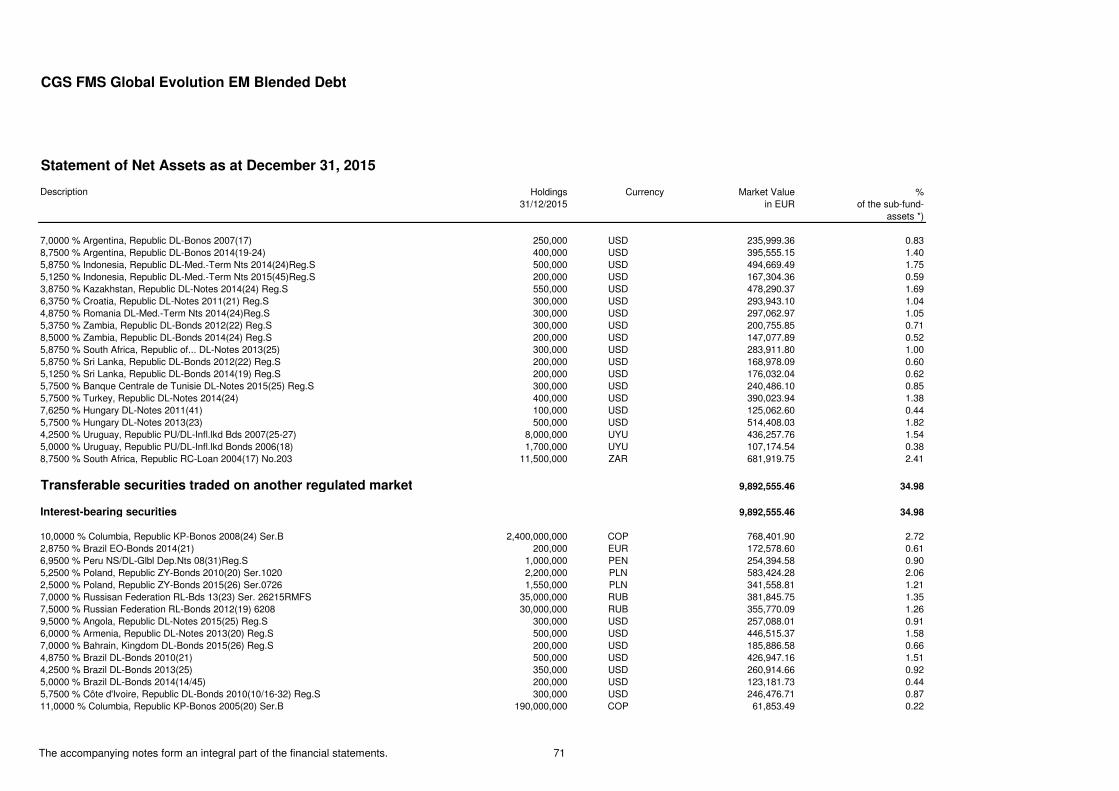
CGS FMS Global Evolution EM Blended Debt
Statement of Net Assets as at December 31, 2015
Description Holdings Currency Market Value %31/12/2015 in EUR of the sub-fund-
assets *)
7,0000 % Argentina, Republic DL-Bonos 2007(17) 250,000 USD 235,999.36 0.838,7500 % Argentina, Republic DL-Bonos 2014(19-24) 400,000 USD 395,555.15 1.405,8750 % Indonesia, Republic DL-Med.-Term Nts 2014(24)Reg.S 500,000 USD 494,669.49 1.755,1250 % Indonesia, Republic DL-Med.-Term Nts 2015(45)Reg.S 200,000 USD 167,304.36 0.593,8750 % Kazakhstan, Republic DL-Notes 2014(24) Reg.S 550,000 USD 478,290.37 1.696,3750 % Croatia, Republic DL-Notes 2011(21) Reg.S 300,000 USD 293,943.10 1.044,8750 % Romania DL-Med.-Term Nts 2014(24)Reg.S 300,000 USD 297,062.97 1.055,3750 % Zambia, Republic DL-Bonds 2012(22) Reg.S 300,000 USD 200,755.85 0.718,5000 % Zambia, Republic DL-Bonds 2014(24) Reg.S 200,000 USD 147,077.89 0.525,8750 % South Africa, Republic of... DL-Notes 2013(25) 300,000 USD 283,911.80 1.005,8750 % Sri Lanka, Republic DL-Bonds 2012(22) Reg.S 200,000 USD 168,978.09 0.605,1250 % Sri Lanka, Republic DL-Bonds 2014(19) Reg.S 200,000 USD 176,032.04 0.625,7500 % Banque Centrale de Tunisie DL-Notes 2015(25) Reg.S 300,000 USD 240,486.10 0.855,7500 % Turkey, Republic DL-Notes 2014(24) 400,000 USD 390,023.94 1.387,6250 % Hungary DL-Notes 2011(41) 100,000 USD 125,062.60 0.445,7500 % Hungary DL-Notes 2013(23) 500,000 USD 514,408.03 1.824,2500 % Uruguay, Republic PU/DL-Infl.lkd Bds 2007(25-27) 8,000,000 UYU 436,257.76 1.545,0000 % Uruguay, Republic PU/DL-Infl.lkd Bonds 2006(18) 1,700,000 UYU 107,174.54 0.388,7500 % South Africa, Republic RC-Loan 2004(17) No.203 11,500,000 ZAR 681,919.75 2.41
Transferable securities traded on another regulated market 9,892,555.46 34.98
Interest-bearing securities 9,892,555.46 34.98
10,0000 % Columbia, Republic KP-Bonos 2008(24) Ser.B 2,400,000,000 COP 768,401.90 2.722,8750 % Brazil EO-Bonds 2014(21) 200,000 EUR 172,578.60 0.616,9500 % Peru NS/DL-Glbl Dep.Nts 08(31)Reg.S 1,000,000 PEN 254,394.58 0.905,2500 % Poland, Republic ZY-Bonds 2010(20) Ser.1020 2,200,000 PLN 583,424.28 2.062,5000 % Poland, Republic ZY-Bonds 2015(26) Ser.0726 1,550,000 PLN 341,558.81 1.217,0000 % Russisan Federation RL-Bds 13(23) Ser. 26215RMFS 35,000,000 RUB 381,845.75 1.357,5000 % Russian Federation RL-Bonds 2012(19) 6208 30,000,000 RUB 355,770.09 1.269,5000 % Angola, Republic DL-Notes 2015(25) Reg.S 300,000 USD 257,088.01 0.916,0000 % Armenia, Republic DL-Notes 2013(20) Reg.S 500,000 USD 446,515.37 1.587,0000 % Bahrain, Kingdom DL-Bonds 2015(26) Reg.S 200,000 USD 185,886.58 0.664,8750 % Brazil DL-Bonds 2010(21) 500,000 USD 426,947.16 1.514,2500 % Brazil DL-Bonds 2013(25) 350,000 USD 260,914.66 0.925,0000 % Brazil DL-Bonds 2014(14/45) 200,000 USD 123,181.73 0.445,7500 % Côte d'Ivoire, Republic DL-Bonds 2010(10/16-32) Reg.S 300,000 USD 246,476.71 0.8711,0000 % Columbia, Republic KP-Bonos 2005(20) Ser.B 190,000,000 COP 61,853.49 0.22
The accompanying notes form an integral part of the financial statements. 71
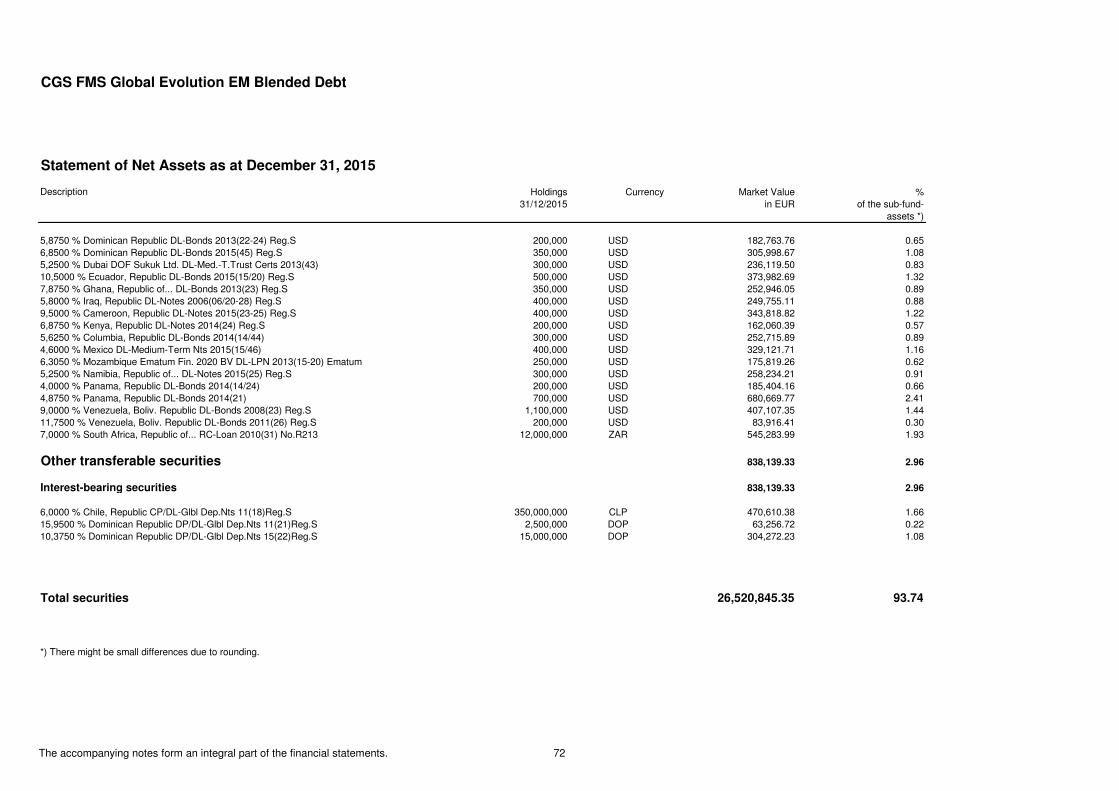
CGS FMS Global Evolution EM Blended Debt
Statement of Net Assets as at December 31, 2015
Description Holdings Currency Market Value %31/12/2015 in EUR of the sub-fund-
assets *)
5,8750 % Dominican Republic DL-Bonds 2013(22-24) Reg.S 200,000 USD 182,763.76 0.656,8500 % Dominican Republic DL-Bonds 2015(45) Reg.S 350,000 USD 305,998.67 1.085,2500 % Dubai DOF Sukuk Ltd. DL-Med.-T.Trust Certs 2013(43) 300,000 USD 236,119.50 0.8310,5000 % Ecuador, Republic DL-Bonds 2015(15/20) Reg.S 500,000 USD 373,982.69 1.327,8750 % Ghana, Republic of... DL-Bonds 2013(23) Reg.S 350,000 USD 252,946.05 0.895,8000 % Iraq, Republic DL-Notes 2006(06/20-28) Reg.S 400,000 USD 249,755.11 0.889,5000 % Cameroon, Republic DL-Notes 2015(23-25) Reg.S 400,000 USD 343,818.82 1.226,8750 % Kenya, Republic DL-Notes 2014(24) Reg.S 200,000 USD 162,060.39 0.575,6250 % Columbia, Republic DL-Bonds 2014(14/44) 300,000 USD 252,715.89 0.894,6000 % Mexico DL-Medium-Term Nts 2015(15/46) 400,000 USD 329,121.71 1.166,3050 % Mozambique Ematum Fin. 2020 BV DL-LPN 2013(15-20) Ematum 250,000 USD 175,819.26 0.625,2500 % Namibia, Republic of... DL-Notes 2015(25) Reg.S 300,000 USD 258,234.21 0.914,0000 % Panama, Republic DL-Bonds 2014(14/24) 200,000 USD 185,404.16 0.664,8750 % Panama, Republic DL-Bonds 2014(21) 700,000 USD 680,669.77 2.419,0000 % Venezuela, Boliv. Republic DL-Bonds 2008(23) Reg.S 1,100,000 USD 407,107.35 1.4411,7500 % Venezuela, Boliv. Republic DL-Bonds 2011(26) Reg.S 200,000 USD 83,916.41 0.307,0000 % South Africa, Republic of... RC-Loan 2010(31) No.R213 12,000,000 ZAR 545,283.99 1.93
Other transferable securities 838,139.33 2.96
Interest-bearing securities 838,139.33 2.96
6,0000 % Chile, Republic CP/DL-Glbl Dep.Nts 11(18)Reg.S 350,000,000 CLP 470,610.38 1.6615,9500 % Dominican Republic DP/DL-Glbl Dep.Nts 11(21)Reg.S 2,500,000 DOP 63,256.72 0.2210,3750 % Dominican Republic DP/DL-Glbl Dep.Nts 15(22)Reg.S 15,000,000 DOP 304,272.23 1.08
Total securities 26,520,845.35 93.74
*) There might be small differences due to rounding.
The accompanying notes form an integral part of the financial statements. 72
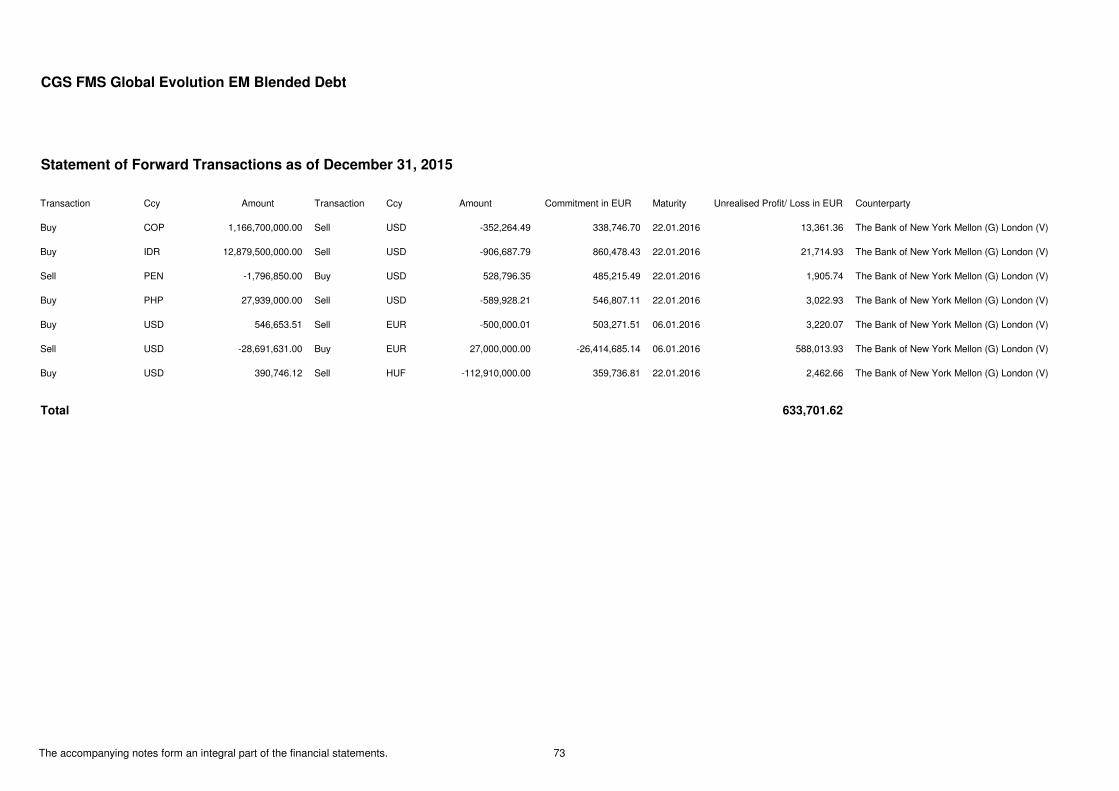
CGS FMS Global Evolution EM Blended Debt
Statement of Forward Transactions as of December 31, 2015
Transaction Ccy Amount Transaction Ccy Amount Commitment in EUR Maturity Unrealised Profit/ Loss in EUR Counterparty
Buy COP 1,166,700,000.00 Sell USD -352,264.49 338,746.70 22.01.2016 13,361.36 The Bank of New York Mellon (G) London (V)
Buy IDR 12,879,500,000.00 Sell USD -906,687.79 860,478.43 22.01.2016 21,714.93 The Bank of New York Mellon (G) London (V)
Sell PEN -1,796,850.00 Buy USD 528,796.35 485,215.49 22.01.2016 1,905.74 The Bank of New York Mellon (G) London (V)
Buy PHP 27,939,000.00 Sell USD -589,928.21 546,807.11 22.01.2016 3,022.93 The Bank of New York Mellon (G) London (V)
Buy USD 546,653.51 Sell EUR -500,000.01 503,271.51 06.01.2016 3,220.07 The Bank of New York Mellon (G) London (V)
Sell USD -28,691,631.00 Buy EUR 27,000,000.00 -26,414,685.14 06.01.2016 588,013.93 The Bank of New York Mellon (G) London (V)
Buy USD 390,746.12 Sell HUF -112,910,000.00 359,736.81 22.01.2016 2,462.66 The Bank of New York Mellon (G) London (V)
Total 633,701.62
The accompanying notes form an integral part of the financial statements. 73
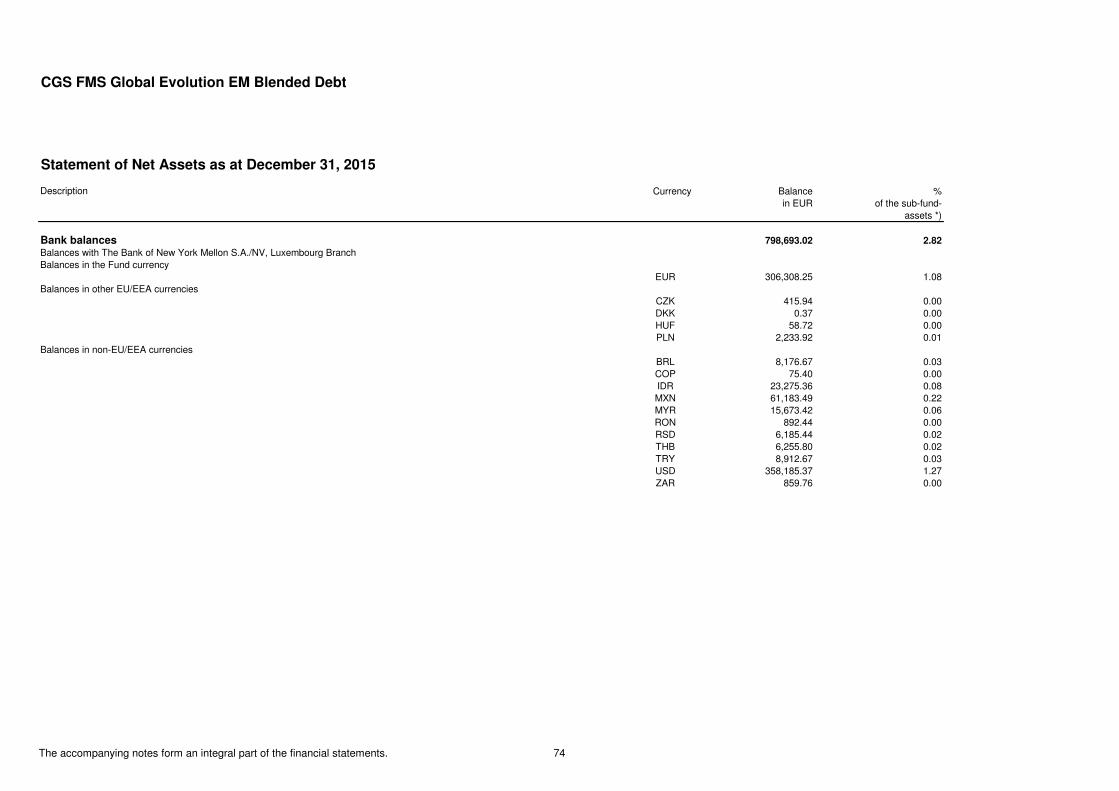
CGS FMS Global Evolution EM Blended Debt
Statement of Net Assets as at December 31, 2015
Description Currency Balance %in EUR of the sub-fund-
assets *)
Bank balances 798,693.02 2.82
Balances with The Bank of New York Mellon S.A./NV, Luxembourg BranchBalances in the Fund currency
EUR 306,308.25 1.08Balances in other EU/EEA currencies
CZK 415.94 0.00DKK 0.37 0.00HUF 58.72 0.00PLN 2,233.92 0.01
Balances in non-EU/EEA currenciesBRL 8,176.67 0.03COP 75.40 0.00IDR 23,275.36 0.08MXN 61,183.49 0.22MYR 15,673.42 0.06RON 892.44 0.00RSD 6,185.44 0.02THB 6,255.80 0.02TRY 8,912.67 0.03USD 358,185.37 1.27ZAR 859.76 0.00
The accompanying notes form an integral part of the financial statements. 74
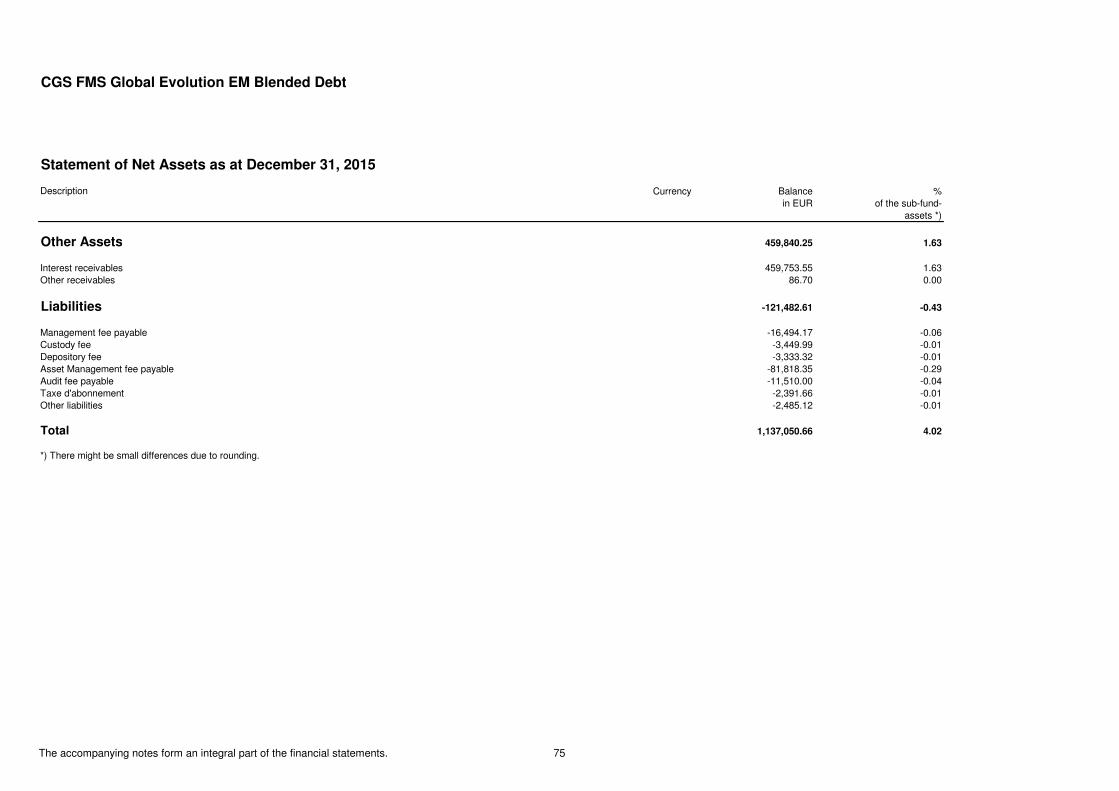
CGS FMS Global Evolution EM Blended Debt
Statement of Net Assets as at December 31, 2015
Description Currency Balance %in EUR of the sub-fund-
assets *)
Other Assets 459,840.25 1.63
Interest receivables 459,753.55 1.63Other receivables 86.70 0.00
Liabilities -121,482.61 -0.43
Management fee payable -16,494.17 -0.06Custody fee -3,449.99 -0.01Depository fee -3,333.32 -0.01Asset Management fee payable -81,818.35 -0.29Audit fee payable -11,510.00 -0.04Taxe d'abonnement -2,391.66 -0.01Other liabilities -2,485.12 -0.01
Total 1,137,050.66 4.02
*) There might be small differences due to rounding.
The accompanying notes form an integral part of the financial statements. 75

CGS FMS Global Evolution EM Blended Debt
Statement of operations (including income equalisation)for the period from 01/01/2015 to 31/12/2015
Total
I. Income
- Interest on securities EUR 1,886,952.95 - Interest on liquidity investments *) EUR -2,423.90
Total income EUR 1,884,529.05
II. Expenses
- Interest on bank overdraft EUR -747.30 - Management Company fee EUR -73,771.86 - Asset Management fee EUR -364,309.50 - Custody fee EUR -13,574.41 - Depository fee EUR -11,678.17 - Auditing and publication expenses EUR -29,635.31 - Subscription tax ("Taxe d`abonnement") EUR -10,467.06 - Registrar and Transfer Agent fee EUR -6,252.96 - Legal fee EUR -14,788.93 - Foreign withholding taxes EUR -27,259.64 - Equalisation of ordinary expenses EUR 36,043.14 - Other expenses EUR -70,931.10
Total expenses EUR -587,373.10
III. Ordinary net result EUR 1,297,155.95
*) The position 'interest on liquidity investments' includes negative interest of 2,610.63 EUR.
The accompanying notes form an integral part of the financial statements. 76
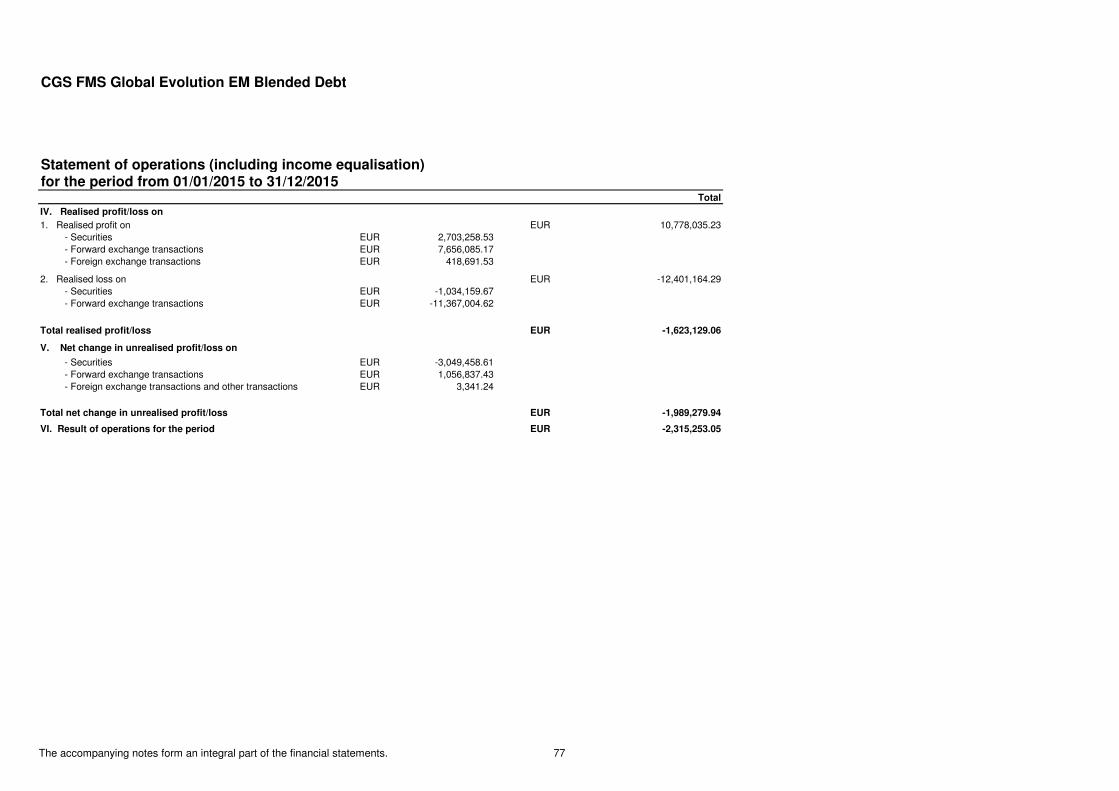
CGS FMS Global Evolution EM Blended Debt
Statement of operations (including income equalisation)for the period from 01/01/2015 to 31/12/2015
Total
IV. Realised profit/loss on
1. Realised profit on EUR 10,778,035.23 - Securities EUR 2,703,258.53 - Forward exchange transactions EUR 7,656,085.17 - Foreign exchange transactions EUR 418,691.53
2. Realised loss on EUR -12,401,164.29 - Securities EUR -1,034,159.67 - Forward exchange transactions EUR -11,367,004.62
Total realised profit/loss EUR -1,623,129.06
V. Net change in unrealised profit/loss on
- Securities EUR -3,049,458.61 - Forward exchange transactions EUR 1,056,837.43 - Foreign exchange transactions and other transactions EUR 3,341.24
Total net change in unrealised profit/loss EUR -1,989,279.94
VI. Result of operations for the period EUR -2,315,253.05
The accompanying notes form an integral part of the financial statements. 77
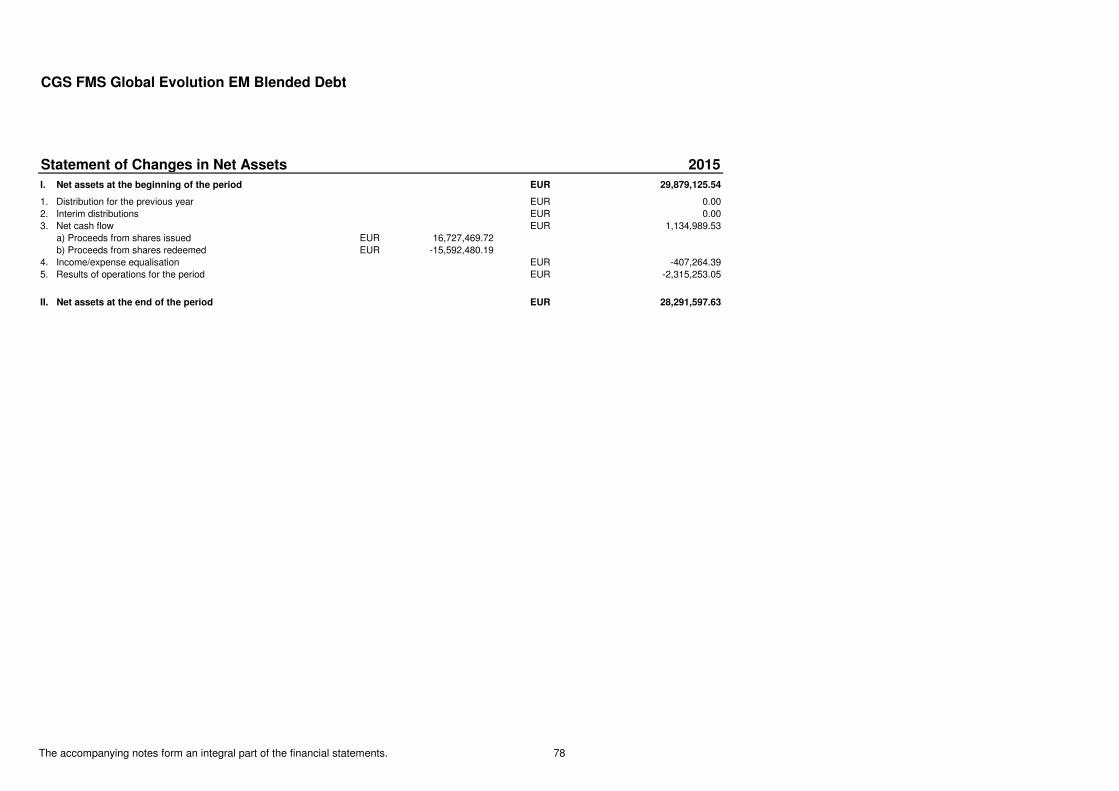
CGS FMS Global Evolution EM Blended Debt
Statement of Changes in Net Assets 2015
I. Net assets at the beginning of the period EUR 29,879,125.54
1. Distribution for the previous year EUR 0.002. Interim distributions EUR 0.003. Net cash flow EUR 1,134,989.53 a) Proceeds from shares issued EUR 16,727,469.72 b) Proceeds from shares redeemed EUR -15,592,480.194. Income/expense equalisation EUR -407,264.395. Results of operations for the period EUR -2,315,253.05
II. Net assets at the end of the period EUR 28,291,597.63
The accompanying notes form an integral part of the financial statements. 78

CGS FMS Global Evolution EM Debt and FX
Fund Structure as at 31/12/2015
Investment Focus
Market Value
in EUR % of Fund Assets *)
I. Assets 46,433,568.23 100.37
1. Bonds 36,143,014.20 78.13
2. Derivatives 1,028,252.29 2.22
3. Bank balances 8,442,964.14 18.25
4. Other Assets 819,337.60 1.77
II. Liabilities -174,006.31 -0.37
III. Fund Assets 46,259,561.92 100.00
*) There might be small differences due to rounding.
The accompanying notes form an integral part of the financial statements. 79
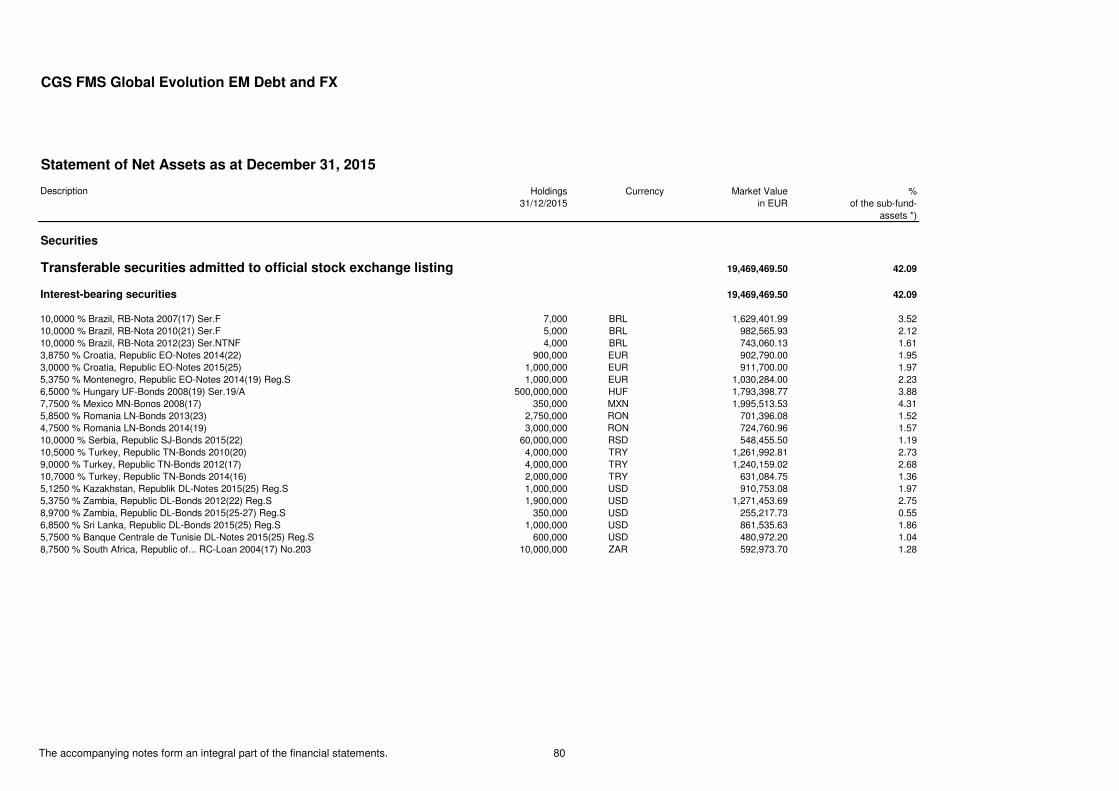
CGS FMS Global Evolution EM Debt and FX
Statement of Net Assets as at December 31, 2015
Description Holdings Currency Market Value %31/12/2015 in EUR of the sub-fund-
assets *)
Securities
Transferable securities admitted to official stock exchange listing 19,469,469.50 42.09
Interest-bearing securities 19,469,469.50 42.09
10,0000 % Brazil, RB-Nota 2007(17) Ser.F 7,000 BRL 1,629,401.99 3.5210,0000 % Brazil, RB-Nota 2010(21) Ser.F 5,000 BRL 982,565.93 2.1210,0000 % Brazil, RB-Nota 2012(23) Ser.NTNF 4,000 BRL 743,060.13 1.613,8750 % Croatia, Republic EO-Notes 2014(22) 900,000 EUR 902,790.00 1.953,0000 % Croatia, Republic EO-Notes 2015(25) 1,000,000 EUR 911,700.00 1.975,3750 % Montenegro, Republic EO-Notes 2014(19) Reg.S 1,000,000 EUR 1,030,284.00 2.236,5000 % Hungary UF-Bonds 2008(19) Ser.19/A 500,000,000 HUF 1,793,398.77 3.887,7500 % Mexico MN-Bonos 2008(17) 350,000 MXN 1,995,513.53 4.315,8500 % Romania LN-Bonds 2013(23) 2,750,000 RON 701,396.08 1.524,7500 % Romania LN-Bonds 2014(19) 3,000,000 RON 724,760.96 1.5710,0000 % Serbia, Republic SJ-Bonds 2015(22) 60,000,000 RSD 548,455.50 1.1910,5000 % Turkey, Republic TN-Bonds 2010(20) 4,000,000 TRY 1,261,992.81 2.739,0000 % Turkey, Republic TN-Bonds 2012(17) 4,000,000 TRY 1,240,159.02 2.6810,7000 % Turkey, Republic TN-Bonds 2014(16) 2,000,000 TRY 631,084.75 1.365,1250 % Kazakhstan, Republik DL-Notes 2015(25) Reg.S 1,000,000 USD 910,753.08 1.975,3750 % Zambia, Republic DL-Bonds 2012(22) Reg.S 1,900,000 USD 1,271,453.69 2.758,9700 % Zambia, Republic DL-Bonds 2015(25-27) Reg.S 350,000 USD 255,217.73 0.556,8500 % Sri Lanka, Republic DL-Bonds 2015(25) Reg.S 1,000,000 USD 861,535.63 1.865,7500 % Banque Centrale de Tunisie DL-Notes 2015(25) Reg.S 600,000 USD 480,972.20 1.048,7500 % South Africa, Republic of... RC-Loan 2004(17) No.203 10,000,000 ZAR 592,973.70 1.28
The accompanying notes form an integral part of the financial statements. 80
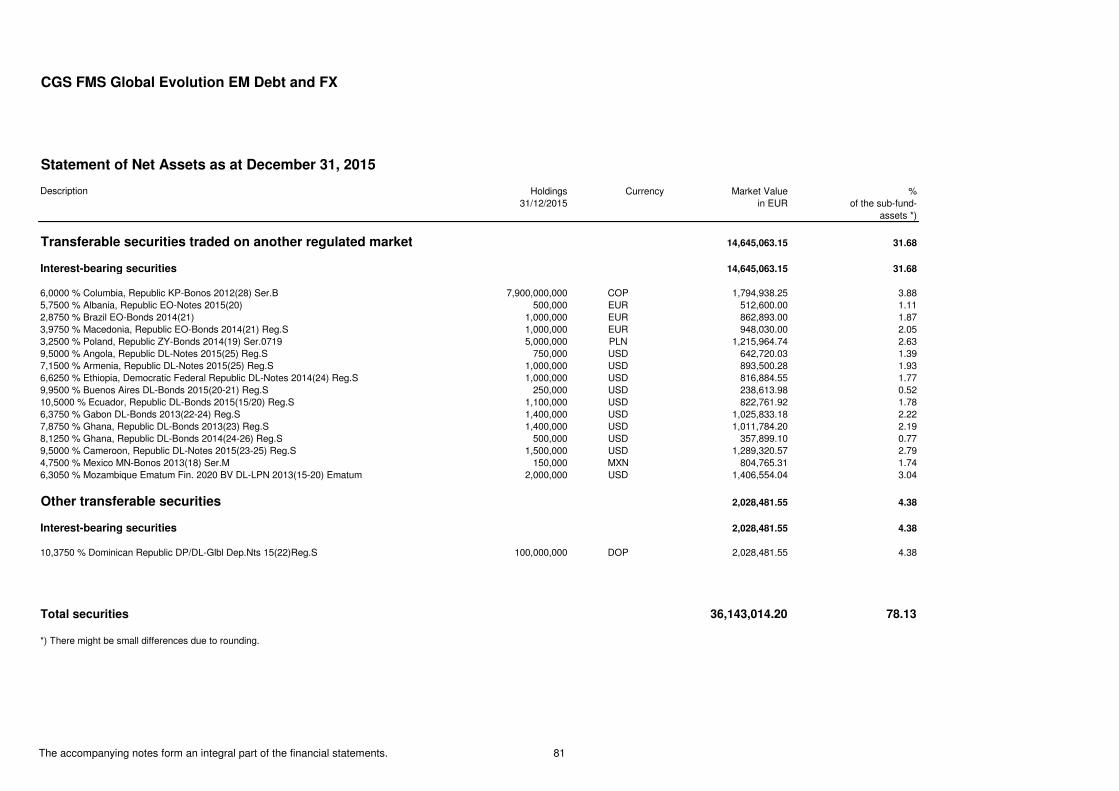
CGS FMS Global Evolution EM Debt and FX
Statement of Net Assets as at December 31, 2015
Description Holdings Currency Market Value %31/12/2015 in EUR of the sub-fund-
assets *)
Transferable securities traded on another regulated market 14,645,063.15 31.68
Interest-bearing securities 14,645,063.15 31.68
6,0000 % Columbia, Republic KP-Bonos 2012(28) Ser.B 7,900,000,000 COP 1,794,938.25 3.885,7500 % Albania, Republic EO-Notes 2015(20) 500,000 EUR 512,600.00 1.112,8750 % Brazil EO-Bonds 2014(21) 1,000,000 EUR 862,893.00 1.873,9750 % Macedonia, Republic EO-Bonds 2014(21) Reg.S 1,000,000 EUR 948,030.00 2.053,2500 % Poland, Republic ZY-Bonds 2014(19) Ser.0719 5,000,000 PLN 1,215,964.74 2.639,5000 % Angola, Republic DL-Notes 2015(25) Reg.S 750,000 USD 642,720.03 1.397,1500 % Armenia, Republic DL-Notes 2015(25) Reg.S 1,000,000 USD 893,500.28 1.936,6250 % Ethiopia, Democratic Federal Republic DL-Notes 2014(24) Reg.S 1,000,000 USD 816,884.55 1.779,9500 % Buenos Aires DL-Bonds 2015(20-21) Reg.S 250,000 USD 238,613.98 0.5210,5000 % Ecuador, Republic DL-Bonds 2015(15/20) Reg.S 1,100,000 USD 822,761.92 1.786,3750 % Gabon DL-Bonds 2013(22-24) Reg.S 1,400,000 USD 1,025,833.18 2.227,8750 % Ghana, Republic DL-Bonds 2013(23) Reg.S 1,400,000 USD 1,011,784.20 2.198,1250 % Ghana, Republic DL-Bonds 2014(24-26) Reg.S 500,000 USD 357,899.10 0.779,5000 % Cameroon, Republic DL-Notes 2015(23-25) Reg.S 1,500,000 USD 1,289,320.57 2.794,7500 % Mexico MN-Bonos 2013(18) Ser.M 150,000 MXN 804,765.31 1.746,3050 % Mozambique Ematum Fin. 2020 BV DL-LPN 2013(15-20) Ematum 2,000,000 USD 1,406,554.04 3.04
Other transferable securities 2,028,481.55 4.38
Interest-bearing securities 2,028,481.55 4.38
10,3750 % Dominican Republic DP/DL-Glbl Dep.Nts 15(22)Reg.S 100,000,000 DOP 2,028,481.55 4.38
Total securities 36,143,014.20 78.13
*) There might be small differences due to rounding.
The accompanying notes form an integral part of the financial statements. 81
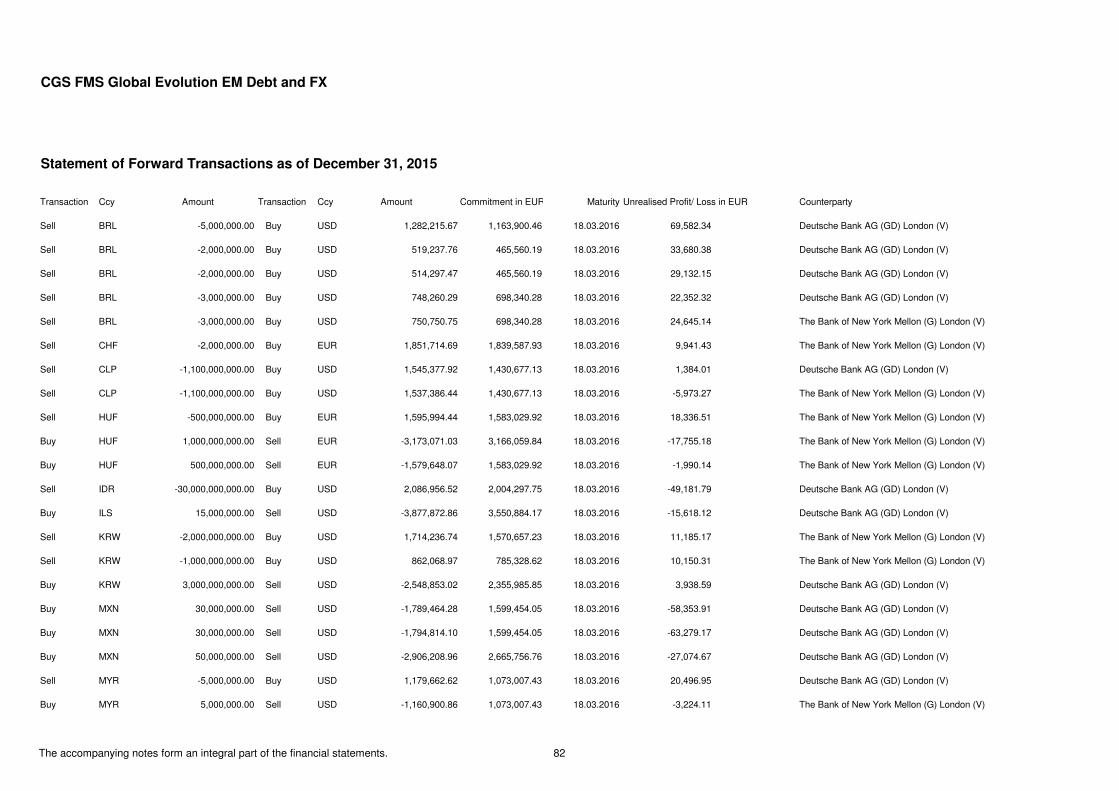
CGS FMS Global Evolution EM Debt and FX
Statement of Forward Transactions as of December 31, 2015
Transaction Ccy Amount Transaction Ccy Amount Commitment in EUR Maturity Unrealised Profit/ Loss in EUR Counterparty
Sell BRL -5,000,000.00 Buy USD 1,282,215.67 1,163,900.46 18.03.2016 69,582.34 Deutsche Bank AG (GD) London (V)
Sell BRL -2,000,000.00 Buy USD 519,237.76 465,560.19 18.03.2016 33,680.38 Deutsche Bank AG (GD) London (V)
Sell BRL -2,000,000.00 Buy USD 514,297.47 465,560.19 18.03.2016 29,132.15 Deutsche Bank AG (GD) London (V)
Sell BRL -3,000,000.00 Buy USD 748,260.29 698,340.28 18.03.2016 22,352.32 Deutsche Bank AG (GD) London (V)
Sell BRL -3,000,000.00 Buy USD 750,750.75 698,340.28 18.03.2016 24,645.14 The Bank of New York Mellon (G) London (V)
Sell CHF -2,000,000.00 Buy EUR 1,851,714.69 1,839,587.93 18.03.2016 9,941.43 The Bank of New York Mellon (G) London (V)
Sell CLP -1,100,000,000.00 Buy USD 1,545,377.92 1,430,677.13 18.03.2016 1,384.01 Deutsche Bank AG (GD) London (V)
Sell CLP -1,100,000,000.00 Buy USD 1,537,386.44 1,430,677.13 18.03.2016 -5,973.27 The Bank of New York Mellon (G) London (V)
Sell HUF -500,000,000.00 Buy EUR 1,595,994.44 1,583,029.92 18.03.2016 18,336.51 The Bank of New York Mellon (G) London (V)
Buy HUF 1,000,000,000.00 Sell EUR -3,173,071.03 3,166,059.84 18.03.2016 -17,755.18 The Bank of New York Mellon (G) London (V)
Buy HUF 500,000,000.00 Sell EUR -1,579,648.07 1,583,029.92 18.03.2016 -1,990.14 The Bank of New York Mellon (G) London (V)
Sell IDR -30,000,000,000.00 Buy USD 2,086,956.52 2,004,297.75 18.03.2016 -49,181.79 Deutsche Bank AG (GD) London (V)
Buy ILS 15,000,000.00 Sell USD -3,877,872.86 3,550,884.17 18.03.2016 -15,618.12 Deutsche Bank AG (GD) London (V)
Sell KRW -2,000,000,000.00 Buy USD 1,714,236.74 1,570,657.23 18.03.2016 11,185.17 The Bank of New York Mellon (G) London (V)
Sell KRW -1,000,000,000.00 Buy USD 862,068.97 785,328.62 18.03.2016 10,150.31 The Bank of New York Mellon (G) London (V)
Buy KRW 3,000,000,000.00 Sell USD -2,548,853.02 2,355,985.85 18.03.2016 3,938.59 Deutsche Bank AG (GD) London (V)
Buy MXN 30,000,000.00 Sell USD -1,789,464.28 1,599,454.05 18.03.2016 -58,353.91 Deutsche Bank AG (GD) London (V)
Buy MXN 30,000,000.00 Sell USD -1,794,814.10 1,599,454.05 18.03.2016 -63,279.17 Deutsche Bank AG (GD) London (V)
Buy MXN 50,000,000.00 Sell USD -2,906,208.96 2,665,756.76 18.03.2016 -27,074.67 Deutsche Bank AG (GD) London (V)
Sell MYR -5,000,000.00 Buy USD 1,179,662.62 1,073,007.43 18.03.2016 20,496.95 Deutsche Bank AG (GD) London (V)
Buy MYR 5,000,000.00 Sell USD -1,160,900.86 1,073,007.43 18.03.2016 -3,224.11 The Bank of New York Mellon (G) London (V)
The accompanying notes form an integral part of the financial statements. 82
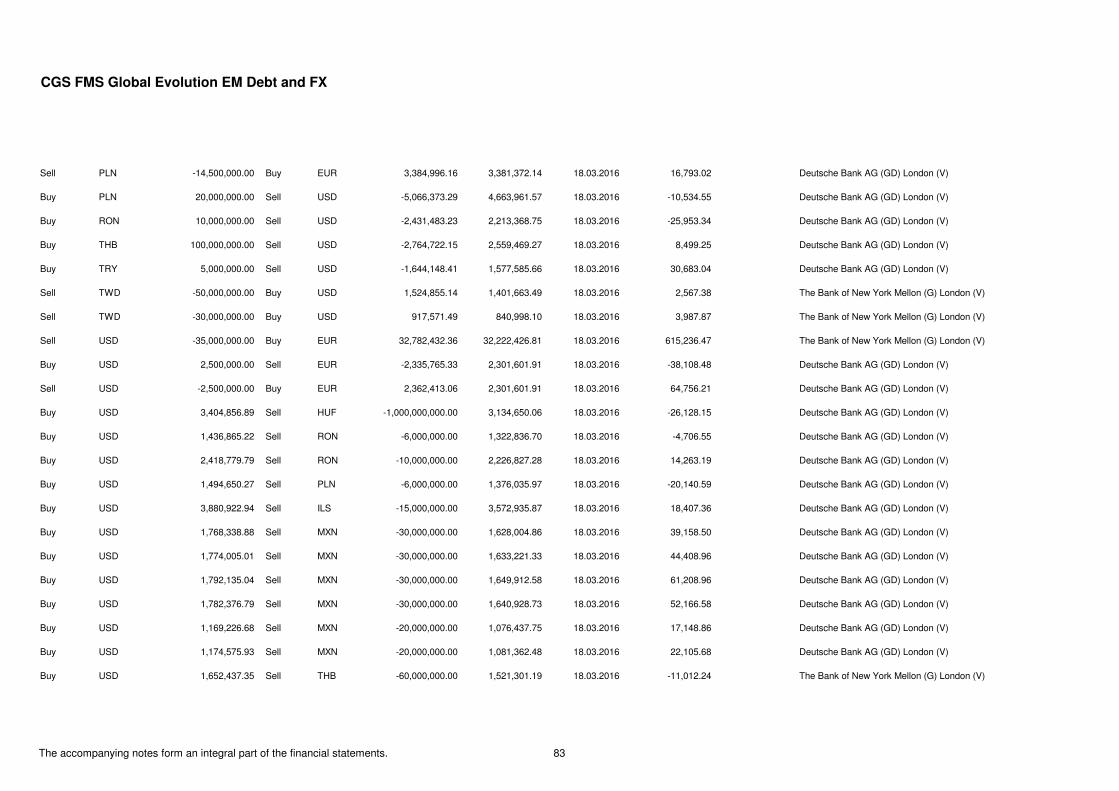
CGS FMS Global Evolution EM Debt and FX
Sell PLN -14,500,000.00 Buy EUR 3,384,996.16 3,381,372.14 18.03.2016 16,793.02 Deutsche Bank AG (GD) London (V)
Buy PLN 20,000,000.00 Sell USD -5,066,373.29 4,663,961.57 18.03.2016 -10,534.55 Deutsche Bank AG (GD) London (V)
Buy RON 10,000,000.00 Sell USD -2,431,483.23 2,213,368.75 18.03.2016 -25,953.34 Deutsche Bank AG (GD) London (V)
Buy THB 100,000,000.00 Sell USD -2,764,722.15 2,559,469.27 18.03.2016 8,499.25 Deutsche Bank AG (GD) London (V)
Buy TRY 5,000,000.00 Sell USD -1,644,148.41 1,577,585.66 18.03.2016 30,683.04 Deutsche Bank AG (GD) London (V)
Sell TWD -50,000,000.00 Buy USD 1,524,855.14 1,401,663.49 18.03.2016 2,567.38 The Bank of New York Mellon (G) London (V)
Sell TWD -30,000,000.00 Buy USD 917,571.49 840,998.10 18.03.2016 3,987.87 The Bank of New York Mellon (G) London (V)
Sell USD -35,000,000.00 Buy EUR 32,782,432.36 32,222,426.81 18.03.2016 615,236.47 The Bank of New York Mellon (G) London (V)
Buy USD 2,500,000.00 Sell EUR -2,335,765.33 2,301,601.91 18.03.2016 -38,108.48 Deutsche Bank AG (GD) London (V)
Sell USD -2,500,000.00 Buy EUR 2,362,413.06 2,301,601.91 18.03.2016 64,756.21 Deutsche Bank AG (GD) London (V)
Buy USD 3,404,856.89 Sell HUF -1,000,000,000.00 3,134,650.06 18.03.2016 -26,128.15 Deutsche Bank AG (GD) London (V)
Buy USD 1,436,865.22 Sell RON -6,000,000.00 1,322,836.70 18.03.2016 -4,706.55 Deutsche Bank AG (GD) London (V)
Buy USD 2,418,779.79 Sell RON -10,000,000.00 2,226,827.28 18.03.2016 14,263.19 Deutsche Bank AG (GD) London (V)
Buy USD 1,494,650.27 Sell PLN -6,000,000.00 1,376,035.97 18.03.2016 -20,140.59 Deutsche Bank AG (GD) London (V)
Buy USD 3,880,922.94 Sell ILS -15,000,000.00 3,572,935.87 18.03.2016 18,407.36 Deutsche Bank AG (GD) London (V)
Buy USD 1,768,338.88 Sell MXN -30,000,000.00 1,628,004.86 18.03.2016 39,158.50 Deutsche Bank AG (GD) London (V)
Buy USD 1,774,005.01 Sell MXN -30,000,000.00 1,633,221.33 18.03.2016 44,408.96 Deutsche Bank AG (GD) London (V)
Buy USD 1,792,135.04 Sell MXN -30,000,000.00 1,649,912.58 18.03.2016 61,208.96 Deutsche Bank AG (GD) London (V)
Buy USD 1,782,376.79 Sell MXN -30,000,000.00 1,640,928.73 18.03.2016 52,166.58 Deutsche Bank AG (GD) London (V)
Buy USD 1,169,226.68 Sell MXN -20,000,000.00 1,076,437.75 18.03.2016 17,148.86 Deutsche Bank AG (GD) London (V)
Buy USD 1,174,575.93 Sell MXN -20,000,000.00 1,081,362.48 18.03.2016 22,105.68 Deutsche Bank AG (GD) London (V)
Buy USD 1,652,437.35 Sell THB -60,000,000.00 1,521,301.19 18.03.2016 -11,012.24 The Bank of New York Mellon (G) London (V)
The accompanying notes form an integral part of the financial statements. 83
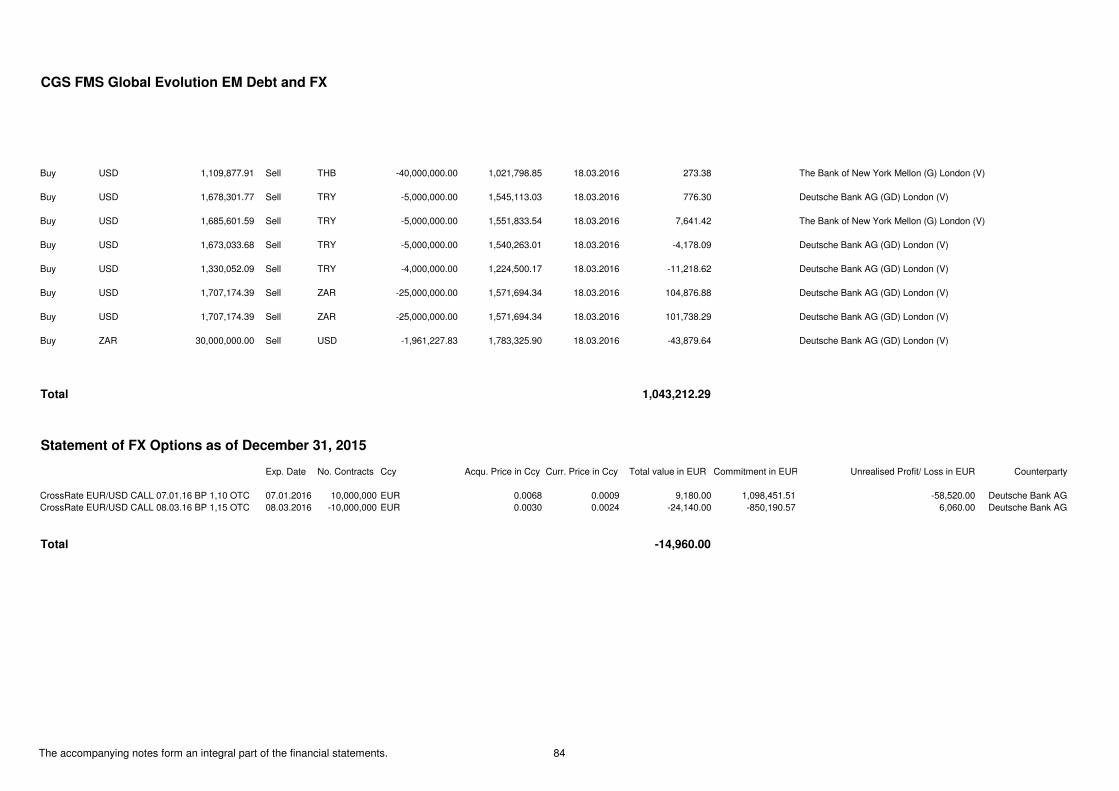
CGS FMS Global Evolution EM Debt and FX
Buy USD 1,109,877.91 Sell THB -40,000,000.00 1,021,798.85 18.03.2016 273.38 The Bank of New York Mellon (G) London (V)
Buy USD 1,678,301.77 Sell TRY -5,000,000.00 1,545,113.03 18.03.2016 776.30 Deutsche Bank AG (GD) London (V)
Buy USD 1,685,601.59 Sell TRY -5,000,000.00 1,551,833.54 18.03.2016 7,641.42 The Bank of New York Mellon (G) London (V)
Buy USD 1,673,033.68 Sell TRY -5,000,000.00 1,540,263.01 18.03.2016 -4,178.09 Deutsche Bank AG (GD) London (V)
Buy USD 1,330,052.09 Sell TRY -4,000,000.00 1,224,500.17 18.03.2016 -11,218.62 Deutsche Bank AG (GD) London (V)
Buy USD 1,707,174.39 Sell ZAR -25,000,000.00 1,571,694.34 18.03.2016 104,876.88 Deutsche Bank AG (GD) London (V)
Buy USD 1,707,174.39 Sell ZAR -25,000,000.00 1,571,694.34 18.03.2016 101,738.29 Deutsche Bank AG (GD) London (V)
Buy ZAR 30,000,000.00 Sell USD -1,961,227.83 1,783,325.90 18.03.2016 -43,879.64 Deutsche Bank AG (GD) London (V)
Total 1,043,212.29
Statement of FX Options as of December 31, 2015
Exp. Date No. Contracts Ccy Acqu. Price in Ccy Curr. Price in Ccy Total value in EUR Commitment in EUR Unrealised Profit/ Loss in EUR Counterparty
CrossRate EUR/USD CALL 07.01.16 BP 1,10 OTC 07.01.2016 10,000,000 EUR 0.0068 0.0009 9,180.00 1,098,451.51 -58,520.00 Deutsche Bank AGCrossRate EUR/USD CALL 08.03.16 BP 1,15 OTC 08.03.2016 -10,000,000 EUR 0.0030 0.0024 -24,140.00 -850,190.57 6,060.00 Deutsche Bank AG
Total -14,960.00
The accompanying notes form an integral part of the financial statements. 84
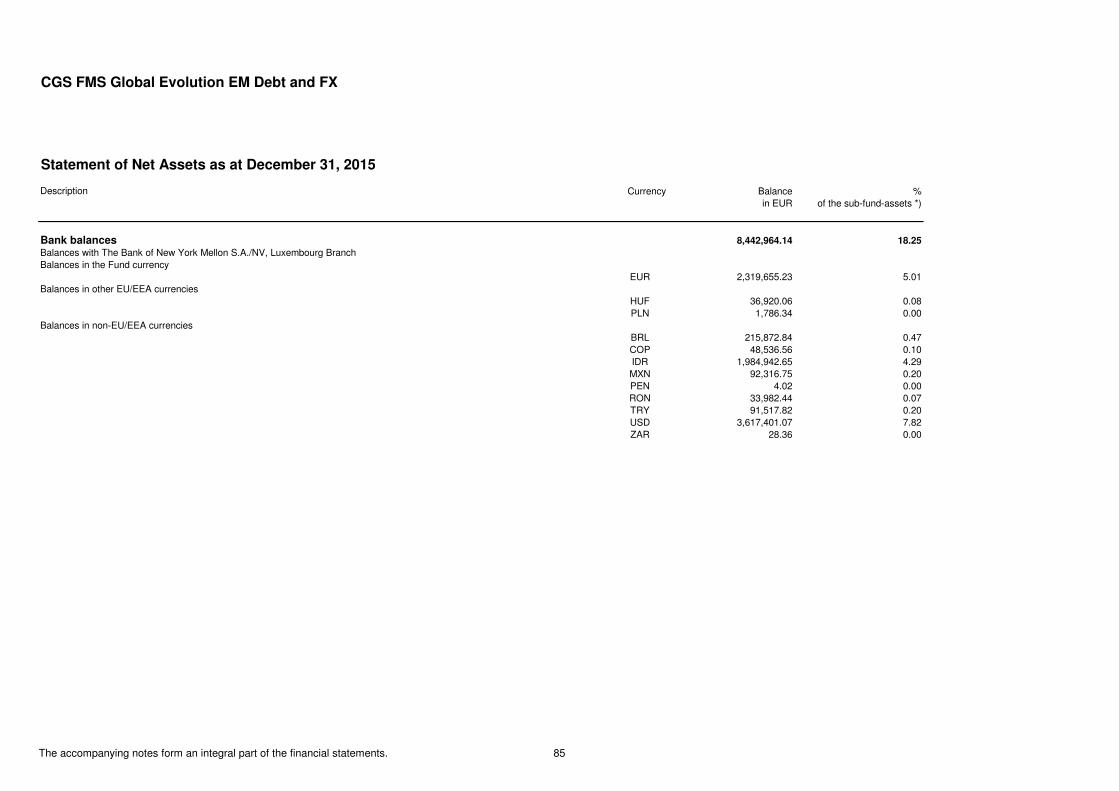
CGS FMS Global Evolution EM Debt and FX
Statement of Net Assets as at December 31, 2015
Description Currency Balance %in EUR of the sub-fund-assets *)
Bank balances 8,442,964.14 18.25
Balances with The Bank of New York Mellon S.A./NV, Luxembourg BranchBalances in the Fund currency
EUR 2,319,655.23 5.01Balances in other EU/EEA currencies
HUF 36,920.06 0.08PLN 1,786.34 0.00
Balances in non-EU/EEA currenciesBRL 215,872.84 0.47COP 48,536.56 0.10IDR 1,984,942.65 4.29MXN 92,316.75 0.20PEN 4.02 0.00RON 33,982.44 0.07TRY 91,517.82 0.20USD 3,617,401.07 7.82ZAR 28.36 0.00
The accompanying notes form an integral part of the financial statements. 85
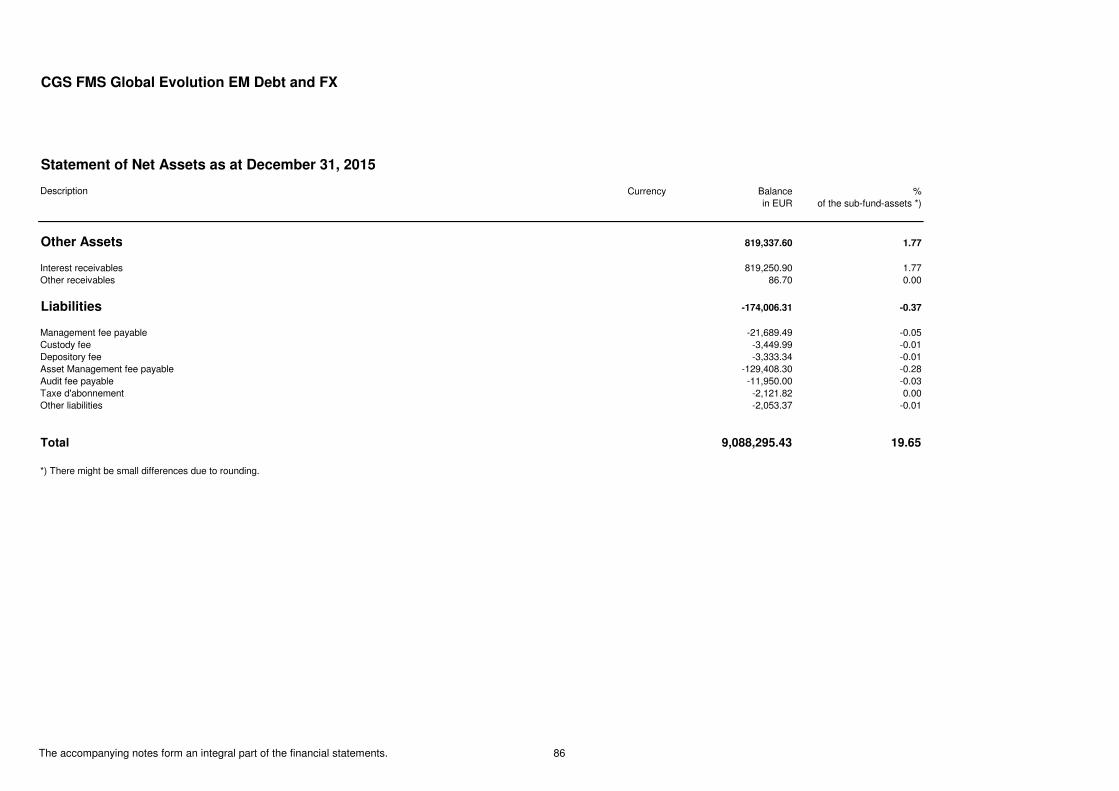
CGS FMS Global Evolution EM Debt and FX
Statement of Net Assets as at December 31, 2015
Description Currency Balance %in EUR of the sub-fund-assets *)
Other Assets 819,337.60 1.77
Interest receivables 819,250.90 1.77Other receivables 86.70 0.00
Liabilities -174,006.31 -0.37
Management fee payable -21,689.49 -0.05Custody fee -3,449.99 -0.01Depository fee -3,333.34 -0.01Asset Management fee payable -129,408.30 -0.28Audit fee payable -11,950.00 -0.03Taxe d'abonnement -2,121.82 0.00Other liabilities -2,053.37 -0.01
Total 9,088,295.43 19.65
*) There might be small differences due to rounding.
The accompanying notes form an integral part of the financial statements. 86

CGS FMS Global Evolution EM Debt and FX
Statement of operations (including income equalisation)for the period from 01/01/2015 to 31/12/2015
Total
I. Income
- Interest on securities EUR 3,160,525.58 - Interest on liquidity investments *) EUR -3,344.78 - Other income EUR 73,830.09
Total income EUR 3,231,010.89
II. Expenses
- Interest on bank overdraft EUR -215.01 - Management Company fee EUR -96,779.92 - Asset Management fee EUR -562,850.20 - Custody fee EUR -5,128.70 - Depository fee EUR -20,596.88 - Performance fee EUR -108,399.33 - Auditing and publication expenses EUR -18,609.48 - Subscription tax ("Taxe d`abonnement") EUR -9,824.37 - Registrar and Transfer Agent fee EUR -7,937.93 - Legal fee EUR -13,345.40 - Foreign withholding taxes EUR -47,987.35 - Equalisation of ordinary expenses EUR 12,053.42 - Other expenses EUR -71,962.39
Total expenses EUR -951,583.54
III. Ordinary net result EUR 2,279,427.35
*) The position 'interest on liquidity investments' includes negative interest of 6,735.82 EUR.
The accompanying notes form an integral part of the financial statements. 87
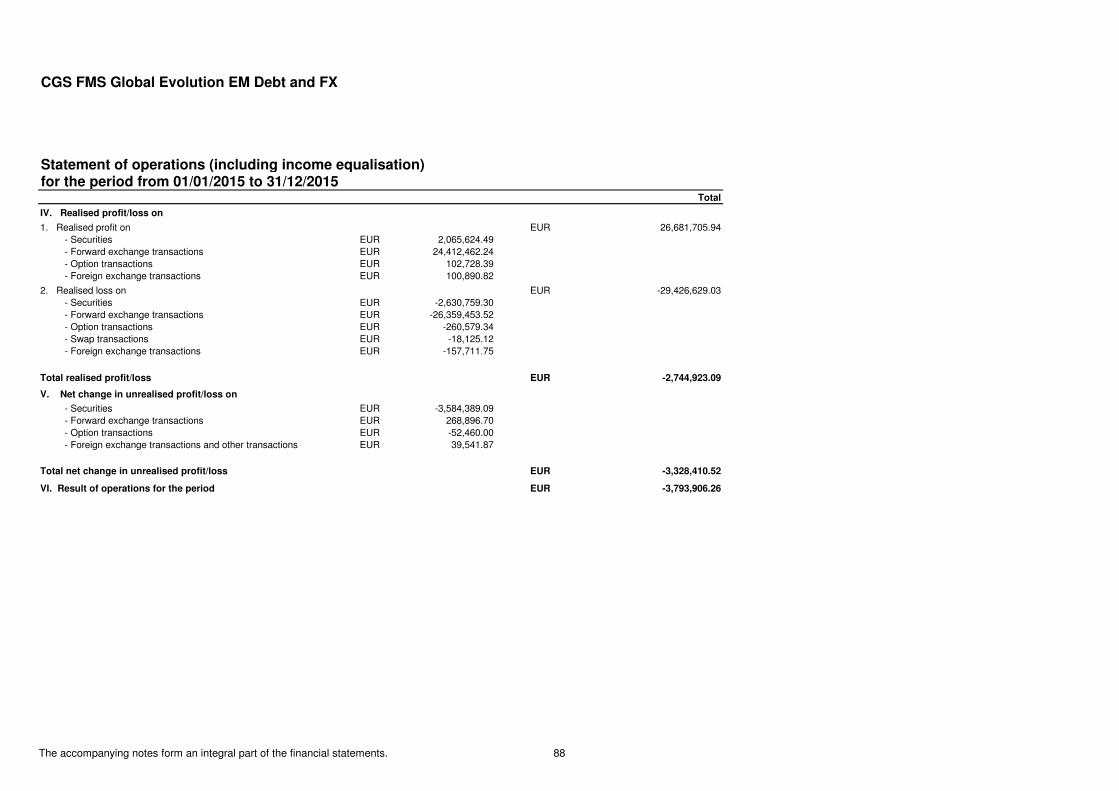
CGS FMS Global Evolution EM Debt and FX
Statement of operations (including income equalisation)for the period from 01/01/2015 to 31/12/2015
Total
IV. Realised profit/loss on
1. Realised profit on EUR 26,681,705.94 - Securities EUR 2,065,624.49 - Forward exchange transactions EUR 24,412,462.24 - Option transactions EUR 102,728.39 - Foreign exchange transactions EUR 100,890.82
2. Realised loss on EUR -29,426,629.03 - Securities EUR -2,630,759.30 - Forward exchange transactions EUR -26,359,453.52 - Option transactions EUR -260,579.34 - Swap transactions EUR -18,125.12 - Foreign exchange transactions EUR -157,711.75
Total realised profit/loss EUR -2,744,923.09
V. Net change in unrealised profit/loss on
- Securities EUR -3,584,389.09 - Forward exchange transactions EUR 268,896.70 - Option transactions EUR -52,460.00 - Foreign exchange transactions and other transactions EUR 39,541.87
Total net change in unrealised profit/loss EUR -3,328,410.52
VI. Result of operations for the period EUR -3,793,906.26
The accompanying notes form an integral part of the financial statements. 88
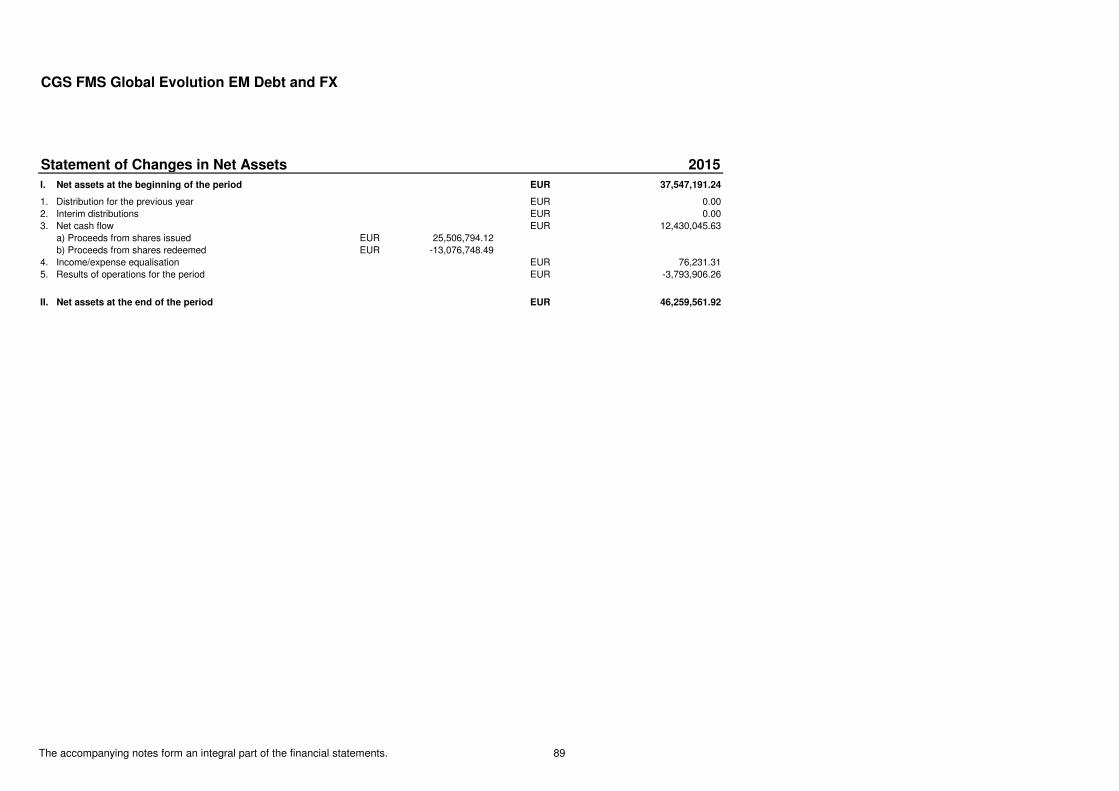
CGS FMS Global Evolution EM Debt and FX
Statement of Changes in Net Assets 2015
I. Net assets at the beginning of the period EUR 37,547,191.24
1. Distribution for the previous year EUR 0.002. Interim distributions EUR 0.003. Net cash flow EUR 12,430,045.63 a) Proceeds from shares issued EUR 25,506,794.12 b) Proceeds from shares redeemed EUR -13,076,748.494. Income/expense equalisation EUR 76,231.315. Results of operations for the period EUR -3,793,906.26
II. Net assets at the end of the period EUR 46,259,561.92
The accompanying notes form an integral part of the financial statements. 89

CGS FMS Global Evolution Emerging Frontier
Fund Structure as at 31/12/2015
Investment Focus
Market Value
in USD % of Fund Assets *)
I. Assets 260,207,451.13 100.16
1. Bonds 238,399,553.83 91.77
2. Derivatives 90,887.80 0.03
3. Bank balances 16,903,734.74 6.51
4. Other Assets 4,813,274.76 1.85
II. Liabilities -432,125.19 -0.16
III. Fund Assets 259,775,325.94 100.00
*) There might be small differences due to rounding.
The accompanying notes form an integral part of the financial statements. 90
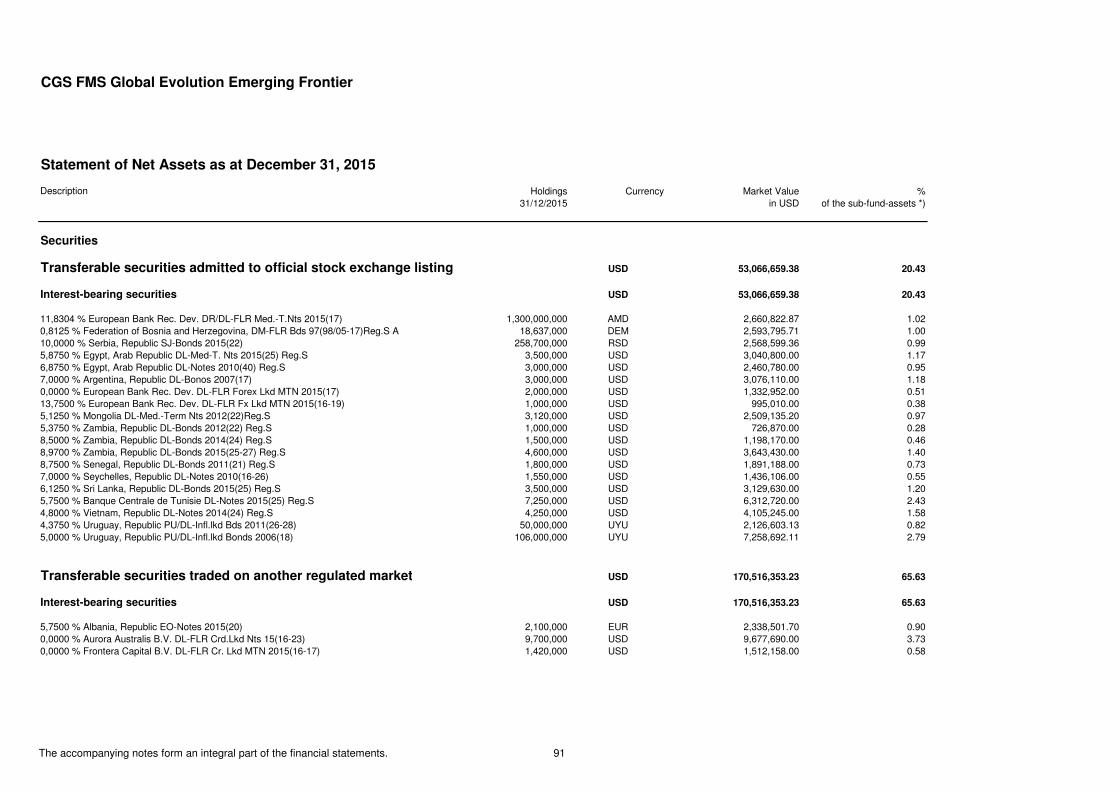
CGS FMS Global Evolution Emerging Frontier
Statement of Net Assets as at December 31, 2015
Description Holdings Currency Market Value %31/12/2015 in USD of the sub-fund-assets *)
Securities
Transferable securities admitted to official stock exchange listing USD 53,066,659.38 20.43
Interest-bearing securities USD 53,066,659.38 20.43
11,8304 % European Bank Rec. Dev. DR/DL-FLR Med.-T.Nts 2015(17) 1,300,000,000 AMD 2,660,822.87 1.020,8125 % Federation of Bosnia and Herzegovina, DM-FLR Bds 97(98/05-17)Reg.S A 18,637,000 DEM 2,593,795.71 1.0010,0000 % Serbia, Republic SJ-Bonds 2015(22) 258,700,000 RSD 2,568,599.36 0.995,8750 % Egypt, Arab Republic DL-Med-T. Nts 2015(25) Reg.S 3,500,000 USD 3,040,800.00 1.176,8750 % Egypt, Arab Republic DL-Notes 2010(40) Reg.S 3,000,000 USD 2,460,780.00 0.957,0000 % Argentina, Republic DL-Bonos 2007(17) 3,000,000 USD 3,076,110.00 1.180,0000 % European Bank Rec. Dev. DL-FLR Forex Lkd MTN 2015(17) 2,000,000 USD 1,332,952.00 0.5113,7500 % European Bank Rec. Dev. DL-FLR Fx Lkd MTN 2015(16-19) 1,000,000 USD 995,010.00 0.385,1250 % Mongolia DL-Med.-Term Nts 2012(22)Reg.S 3,120,000 USD 2,509,135.20 0.975,3750 % Zambia, Republic DL-Bonds 2012(22) Reg.S 1,000,000 USD 726,870.00 0.288,5000 % Zambia, Republic DL-Bonds 2014(24) Reg.S 1,500,000 USD 1,198,170.00 0.468,9700 % Zambia, Republic DL-Bonds 2015(25-27) Reg.S 4,600,000 USD 3,643,430.00 1.408,7500 % Senegal, Republic DL-Bonds 2011(21) Reg.S 1,800,000 USD 1,891,188.00 0.737,0000 % Seychelles, Republic DL-Notes 2010(16-26) 1,550,000 USD 1,436,106.00 0.556,1250 % Sri Lanka, Republic DL-Bonds 2015(25) Reg.S 3,500,000 USD 3,129,630.00 1.205,7500 % Banque Centrale de Tunisie DL-Notes 2015(25) Reg.S 7,250,000 USD 6,312,720.00 2.434,8000 % Vietnam, Republic DL-Notes 2014(24) Reg.S 4,250,000 USD 4,105,245.00 1.584,3750 % Uruguay, Republic PU/DL-Infl.lkd Bds 2011(26-28) 50,000,000 UYU 2,126,603.13 0.825,0000 % Uruguay, Republic PU/DL-Infl.lkd Bonds 2006(18) 106,000,000 UYU 7,258,692.11 2.79
Transferable securities traded on another regulated market USD 170,516,353.23 65.63
Interest-bearing securities USD 170,516,353.23 65.63
5,7500 % Albania, Republic EO-Notes 2015(20) 2,100,000 EUR 2,338,501.70 0.900,0000 % Aurora Australis B.V. DL-FLR Crd.Lkd Nts 15(16-23) 9,700,000 USD 9,677,690.00 3.730,0000 % Frontera Capital B.V. DL-FLR Cr. Lkd MTN 2015(16-17) 1,420,000 USD 1,512,158.00 0.58
The accompanying notes form an integral part of the financial statements. 91
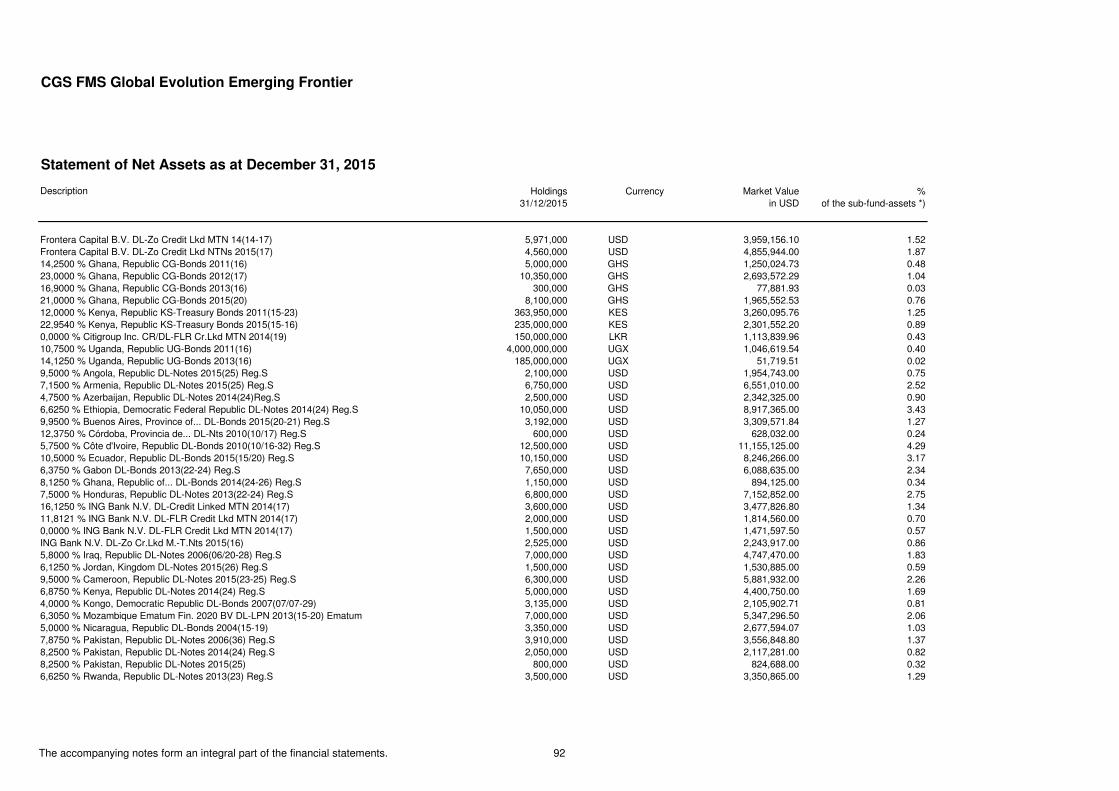
CGS FMS Global Evolution Emerging Frontier
Statement of Net Assets as at December 31, 2015
Description Holdings Currency Market Value %31/12/2015 in USD of the sub-fund-assets *)
Frontera Capital B.V. DL-Zo Credit Lkd MTN 14(14-17) 5,971,000 USD 3,959,156.10 1.52Frontera Capital B.V. DL-Zo Credit Lkd NTNs 2015(17) 4,560,000 USD 4,855,944.00 1.8714,2500 % Ghana, Republic CG-Bonds 2011(16) 5,000,000 GHS 1,250,024.73 0.4823,0000 % Ghana, Republic CG-Bonds 2012(17) 10,350,000 GHS 2,693,572.29 1.0416,9000 % Ghana, Republic CG-Bonds 2013(16) 300,000 GHS 77,881.93 0.0321,0000 % Ghana, Republic CG-Bonds 2015(20) 8,100,000 GHS 1,965,552.53 0.7612,0000 % Kenya, Republic KS-Treasury Bonds 2011(15-23) 363,950,000 KES 3,260,095.76 1.2522,9540 % Kenya, Republic KS-Treasury Bonds 2015(15-16) 235,000,000 KES 2,301,552.20 0.890,0000 % Citigroup Inc. CR/DL-FLR Cr.Lkd MTN 2014(19) 150,000,000 LKR 1,113,839.96 0.4310,7500 % Uganda, Republic UG-Bonds 2011(16) 4,000,000,000 UGX 1,046,619.54 0.4014,1250 % Uganda, Republic UG-Bonds 2013(16) 185,000,000 UGX 51,719.51 0.029,5000 % Angola, Republic DL-Notes 2015(25) Reg.S 2,100,000 USD 1,954,743.00 0.757,1500 % Armenia, Republic DL-Notes 2015(25) Reg.S 6,750,000 USD 6,551,010.00 2.524,7500 % Azerbaijan, Republic DL-Notes 2014(24)Reg.S 2,500,000 USD 2,342,325.00 0.906,6250 % Ethiopia, Democratic Federal Republic DL-Notes 2014(24) Reg.S 10,050,000 USD 8,917,365.00 3.439,9500 % Buenos Aires, Province of... DL-Bonds 2015(20-21) Reg.S 3,192,000 USD 3,309,571.84 1.2712,3750 % Córdoba, Provincia de... DL-Nts 2010(10/17) Reg.S 600,000 USD 628,032.00 0.245,7500 % Côte d'Ivoire, Republic DL-Bonds 2010(10/16-32) Reg.S 12,500,000 USD 11,155,125.00 4.2910,5000 % Ecuador, Republic DL-Bonds 2015(15/20) Reg.S 10,150,000 USD 8,246,266.00 3.176,3750 % Gabon DL-Bonds 2013(22-24) Reg.S 7,650,000 USD 6,088,635.00 2.348,1250 % Ghana, Republic of... DL-Bonds 2014(24-26) Reg.S 1,150,000 USD 894,125.00 0.347,5000 % Honduras, Republic DL-Notes 2013(22-24) Reg.S 6,800,000 USD 7,152,852.00 2.7516,1250 % ING Bank N.V. DL-Credit Linked MTN 2014(17) 3,600,000 USD 3,477,826.80 1.3411,8121 % ING Bank N.V. DL-FLR Credit Lkd MTN 2014(17) 2,000,000 USD 1,814,560.00 0.700,0000 % ING Bank N.V. DL-FLR Credit Lkd MTN 2014(17) 1,500,000 USD 1,471,597.50 0.57ING Bank N.V. DL-Zo Cr.Lkd M.-T.Nts 2015(16) 2,525,000 USD 2,243,917.00 0.865,8000 % Iraq, Republic DL-Notes 2006(06/20-28) Reg.S 7,000,000 USD 4,747,470.00 1.836,1250 % Jordan, Kingdom DL-Notes 2015(26) Reg.S 1,500,000 USD 1,530,885.00 0.599,5000 % Cameroon, Republic DL-Notes 2015(23-25) Reg.S 6,300,000 USD 5,881,932.00 2.266,8750 % Kenya, Republic DL-Notes 2014(24) Reg.S 5,000,000 USD 4,400,750.00 1.694,0000 % Kongo, Democratic Republic DL-Bonds 2007(07/07-29) 3,135,000 USD 2,105,902.71 0.816,3050 % Mozambique Ematum Fin. 2020 BV DL-LPN 2013(15-20) Ematum 7,000,000 USD 5,347,296.50 2.065,0000 % Nicaragua, Republic DL-Bonds 2004(15-19) 3,350,000 USD 2,677,594.07 1.037,8750 % Pakistan, Republic DL-Notes 2006(36) Reg.S 3,910,000 USD 3,556,848.80 1.378,2500 % Pakistan, Republic DL-Notes 2014(24) Reg.S 2,050,000 USD 2,117,281.00 0.828,2500 % Pakistan, Republic DL-Notes 2015(25) 800,000 USD 824,688.00 0.326,6250 % Rwanda, Republic DL-Notes 2013(23) Reg.S 3,500,000 USD 3,350,865.00 1.29
The accompanying notes form an integral part of the financial statements. 92
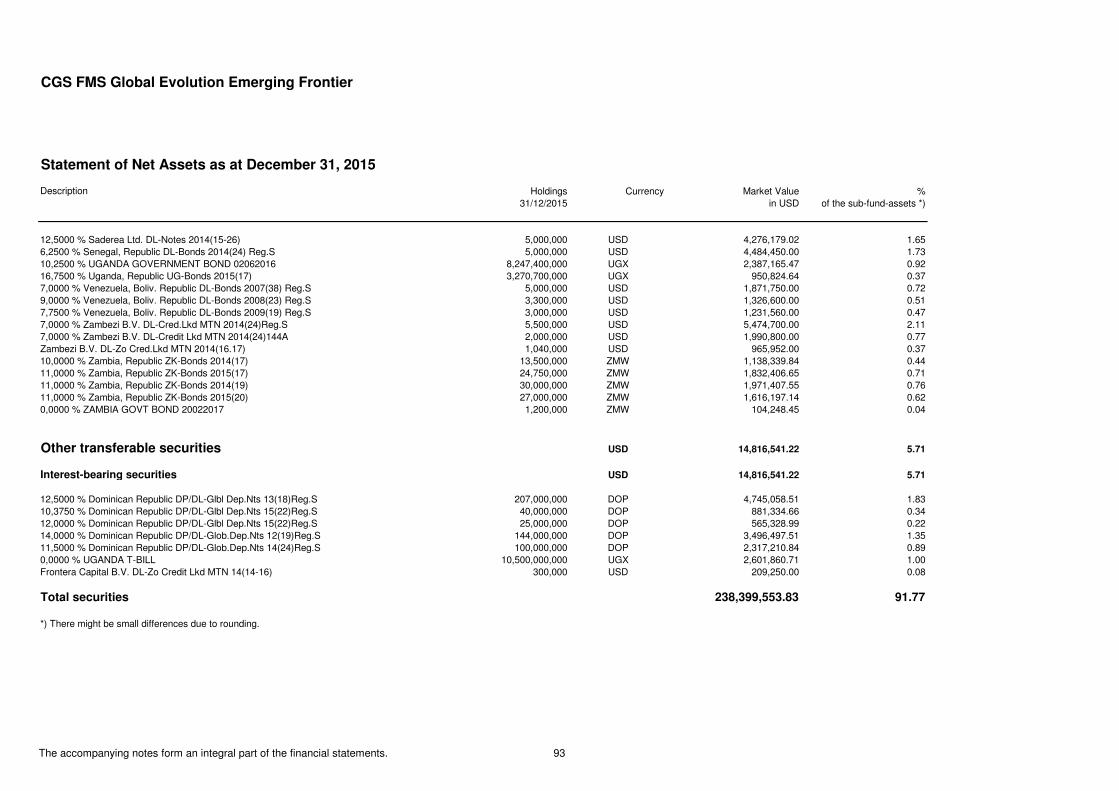
CGS FMS Global Evolution Emerging Frontier
Statement of Net Assets as at December 31, 2015
Description Holdings Currency Market Value %31/12/2015 in USD of the sub-fund-assets *)
12,5000 % Saderea Ltd. DL-Notes 2014(15-26) 5,000,000 USD 4,276,179.02 1.656,2500 % Senegal, Republic DL-Bonds 2014(24) Reg.S 5,000,000 USD 4,484,450.00 1.7310,2500 % UGANDA GOVERNMENT BOND 02062016 8,247,400,000 UGX 2,387,165.47 0.9216,7500 % Uganda, Republic UG-Bonds 2015(17) 3,270,700,000 UGX 950,824.64 0.377,0000 % Venezuela, Boliv. Republic DL-Bonds 2007(38) Reg.S 5,000,000 USD 1,871,750.00 0.729,0000 % Venezuela, Boliv. Republic DL-Bonds 2008(23) Reg.S 3,300,000 USD 1,326,600.00 0.517,7500 % Venezuela, Boliv. Republic DL-Bonds 2009(19) Reg.S 3,000,000 USD 1,231,560.00 0.477,0000 % Zambezi B.V. DL-Cred.Lkd MTN 2014(24)Reg.S 5,500,000 USD 5,474,700.00 2.117,0000 % Zambezi B.V. DL-Credit Lkd MTN 2014(24)144A 2,000,000 USD 1,990,800.00 0.77Zambezi B.V. DL-Zo Cred.Lkd MTN 2014(16.17) 1,040,000 USD 965,952.00 0.3710,0000 % Zambia, Republic ZK-Bonds 2014(17) 13,500,000 ZMW 1,138,339.84 0.4411,0000 % Zambia, Republic ZK-Bonds 2015(17) 24,750,000 ZMW 1,832,406.65 0.7111,0000 % Zambia, Republic ZK-Bonds 2014(19) 30,000,000 ZMW 1,971,407.55 0.7611,0000 % Zambia, Republic ZK-Bonds 2015(20) 27,000,000 ZMW 1,616,197.14 0.620,0000 % ZAMBIA GOVT BOND 20022017 1,200,000 ZMW 104,248.45 0.04
Other transferable securities USD 14,816,541.22 5.71
Interest-bearing securities USD 14,816,541.22 5.71
12,5000 % Dominican Republic DP/DL-Glbl Dep.Nts 13(18)Reg.S 207,000,000 DOP 4,745,058.51 1.8310,3750 % Dominican Republic DP/DL-Glbl Dep.Nts 15(22)Reg.S 40,000,000 DOP 881,334.66 0.3412,0000 % Dominican Republic DP/DL-Glbl Dep.Nts 15(22)Reg.S 25,000,000 DOP 565,328.99 0.2214,0000 % Dominican Republic DP/DL-Glob.Dep.Nts 12(19)Reg.S 144,000,000 DOP 3,496,497.51 1.3511,5000 % Dominican Republic DP/DL-Glob.Dep.Nts 14(24)Reg.S 100,000,000 DOP 2,317,210.84 0.890,0000 % UGANDA T-BILL 10,500,000,000 UGX 2,601,860.71 1.00Frontera Capital B.V. DL-Zo Credit Lkd MTN 14(14-16) 300,000 USD 209,250.00 0.08
Total securities 238,399,553.83 91.77
*) There might be small differences due to rounding.
The accompanying notes form an integral part of the financial statements. 93
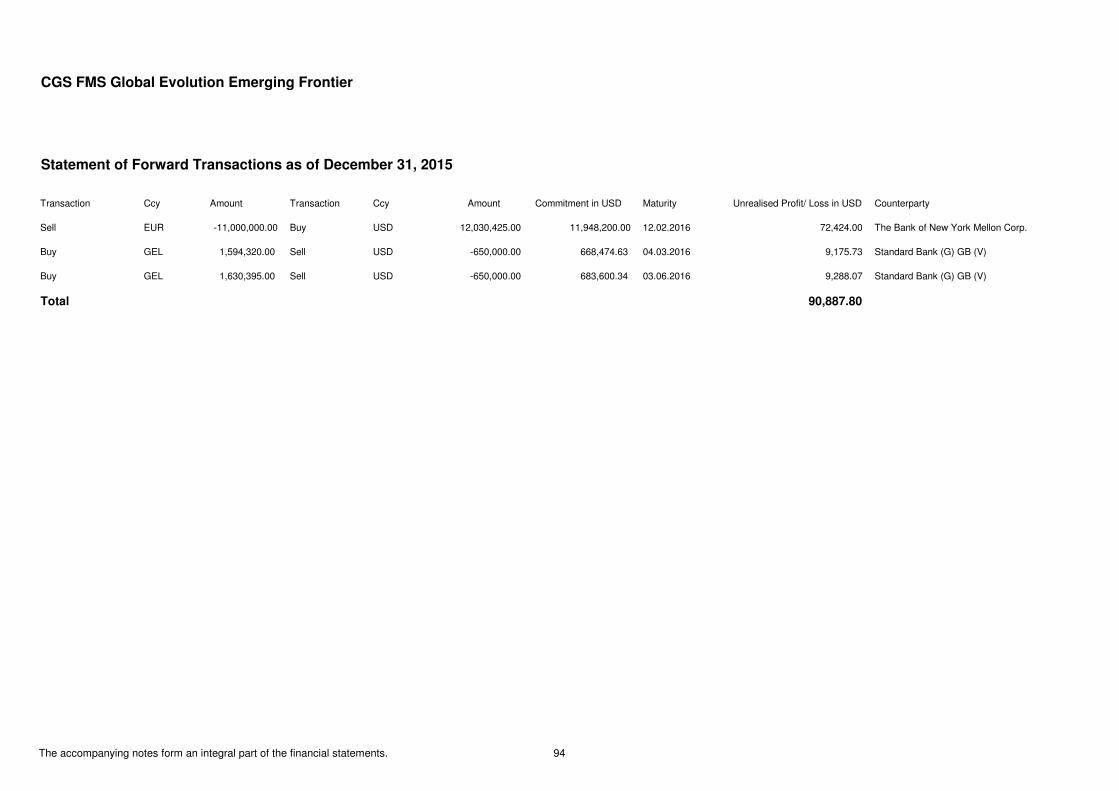
CGS FMS Global Evolution Emerging Frontier
Statement of Forward Transactions as of December 31, 2015
Transaction Ccy Amount Transaction Ccy Amount Commitment in USD Maturity Unrealised Profit/ Loss in USD Counterparty
Sell EUR -11,000,000.00 Buy USD 12,030,425.00 11,948,200.00 12.02.2016 72,424.00 The Bank of New York Mellon Corp.
Buy GEL 1,594,320.00 Sell USD -650,000.00 668,474.63 04.03.2016 9,175.73 Standard Bank (G) GB (V)
Buy GEL 1,630,395.00 Sell USD -650,000.00 683,600.34 03.06.2016 9,288.07 Standard Bank (G) GB (V)
Total 90,887.80
The accompanying notes form an integral part of the financial statements. 94
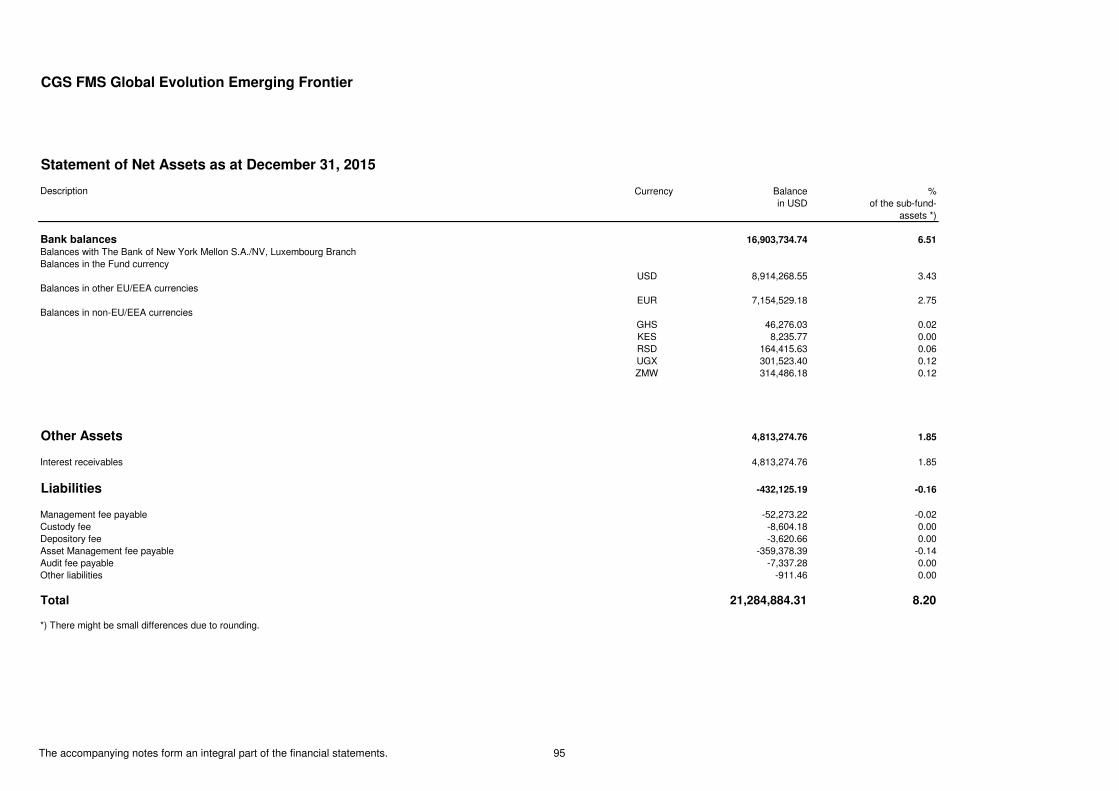
CGS FMS Global Evolution Emerging Frontier
Statement of Net Assets as at December 31, 2015
Description Currency Balance %in USD of the sub-fund-
assets *)
Bank balances 16,903,734.74 6.51
Balances with The Bank of New York Mellon S.A./NV, Luxembourg BranchBalances in the Fund currency
USD 8,914,268.55 3.43Balances in other EU/EEA currencies
EUR 7,154,529.18 2.75Balances in non-EU/EEA currencies
GHS 46,276.03 0.02KES 8,235.77 0.00RSD 164,415.63 0.06UGX 301,523.40 0.12ZMW 314,486.18 0.12
Other Assets 4,813,274.76 1.85
Interest receivables 4,813,274.76 1.85
Liabilities -432,125.19 -0.16
Management fee payable -52,273.22 -0.02Custody fee -8,604.18 0.00Depository fee -3,620.66 0.00Asset Management fee payable -359,378.39 -0.14Audit fee payable -7,337.28 0.00Other liabilities -911.46 0.00
Total 21,284,884.31 8.20
*) There might be small differences due to rounding.
The accompanying notes form an integral part of the financial statements. 95
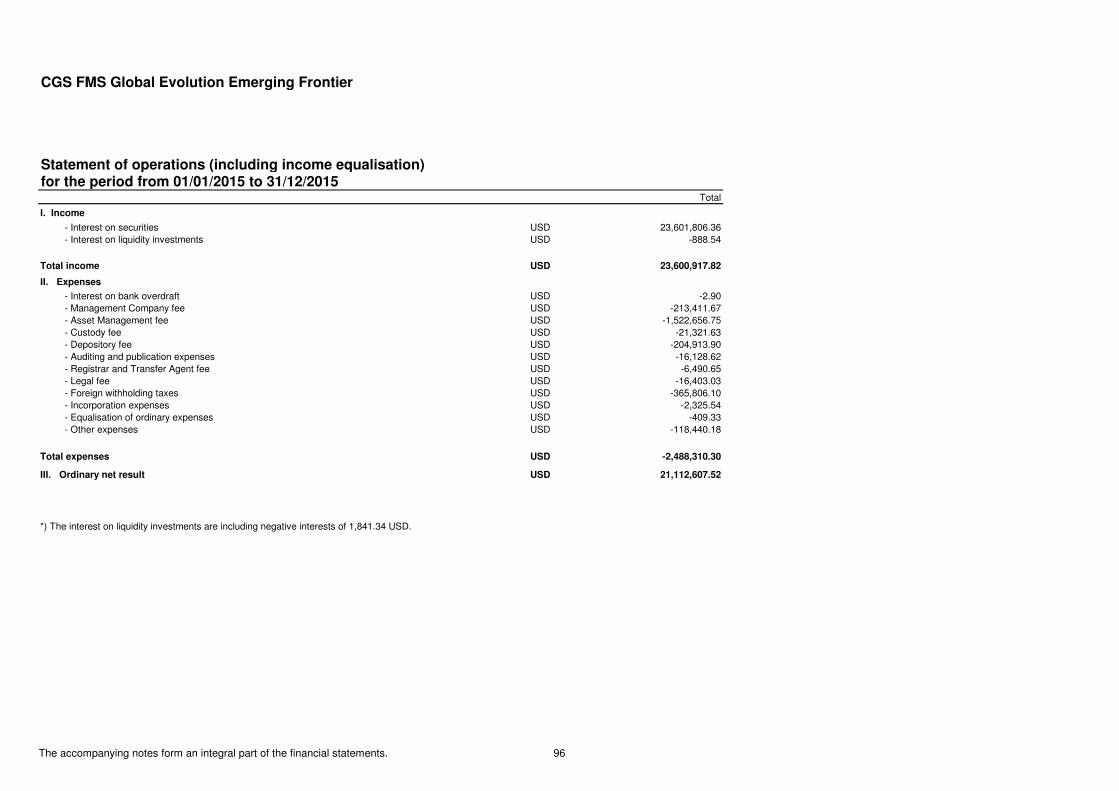
CGS FMS Global Evolution Emerging Frontier
Statement of operations (including income equalisation)for the period from 01/01/2015 to 31/12/2015
Total
I. Income
- Interest on securities USD 23,601,806.36 - Interest on liquidity investments USD -888.54
Total income USD 23,600,917.82
II. Expenses
- Interest on bank overdraft USD -2.90 - Management Company fee USD -213,411.67 - Asset Management fee USD -1,522,656.75 - Custody fee USD -21,321.63 - Depository fee USD -204,913.90 - Auditing and publication expenses USD -16,128.62 - Registrar and Transfer Agent fee USD -6,490.65 - Legal fee USD -16,403.03 - Foreign withholding taxes USD -365,806.10 - Incorporation expenses USD -2,325.54 - Equalisation of ordinary expenses USD -409.33 - Other expenses USD -118,440.18
Total expenses USD -2,488,310.30
III. Ordinary net result USD 21,112,607.52
*) The interest on liquidity investments are including negative interests of 1,841.34 USD.
The accompanying notes form an integral part of the financial statements. 96
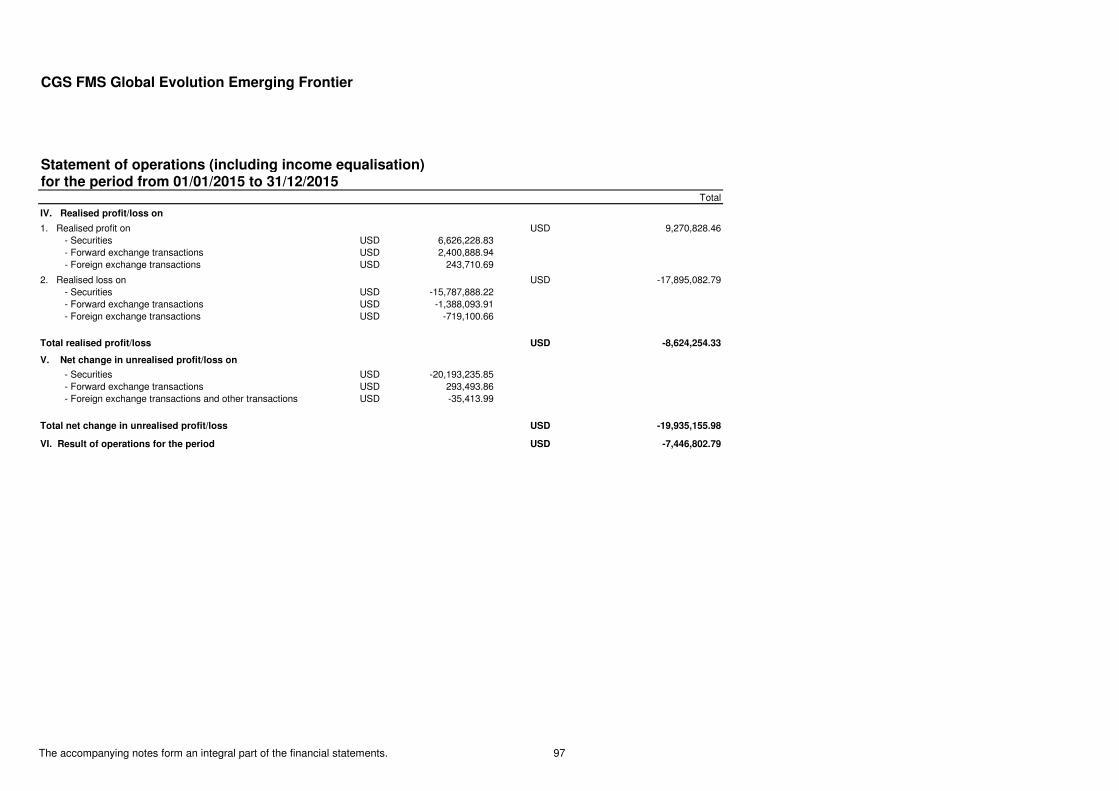
CGS FMS Global Evolution Emerging Frontier
Statement of operations (including income equalisation)for the period from 01/01/2015 to 31/12/2015
Total
IV. Realised profit/loss on
1. Realised profit on USD 9,270,828.46 - Securities USD 6,626,228.83 - Forward exchange transactions USD 2,400,888.94 - Foreign exchange transactions USD 243,710.69
2. Realised loss on USD -17,895,082.79 - Securities USD -15,787,888.22 - Forward exchange transactions USD -1,388,093.91 - Foreign exchange transactions USD -719,100.66
Total realised profit/loss USD -8,624,254.33
V. Net change in unrealised profit/loss on
- Securities USD -20,193,235.85 - Forward exchange transactions USD 293,493.86 - Foreign exchange transactions and other transactions USD -35,413.99
Total net change in unrealised profit/loss USD -19,935,155.98
VI. Result of operations for the period USD -7,446,802.79
The accompanying notes form an integral part of the financial statements. 97
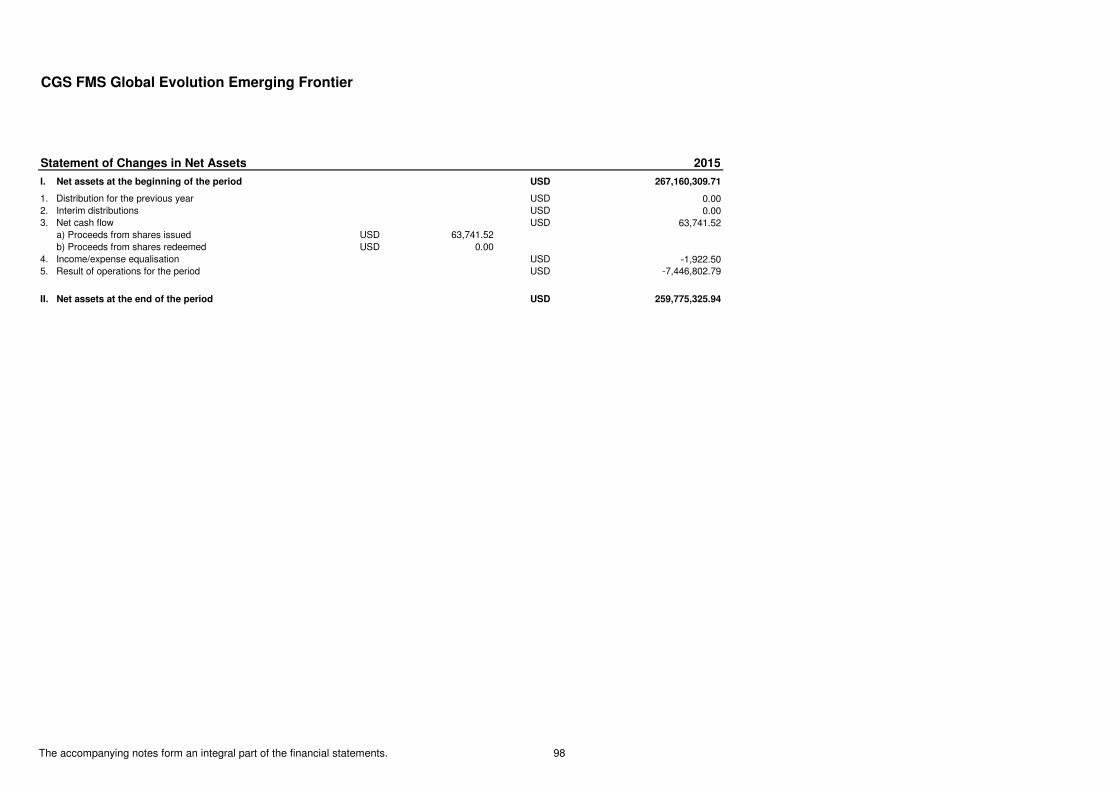
CGS FMS Global Evolution Emerging Frontier
Statement of Changes in Net Assets 2015
I. Net assets at the beginning of the period USD 267,160,309.71
1. Distribution for the previous year USD 0.002. Interim distributions USD 0.003. Net cash flow USD 63,741.52 a) Proceeds from shares issued USD 63,741.52 b) Proceeds from shares redeemed USD 0.004. Income/expense equalisation USD -1,922.505. Result of operations for the period USD -7,446,802.79
II. Net assets at the end of the period USD 259,775,325.94
The accompanying notes form an integral part of the financial statements. 98
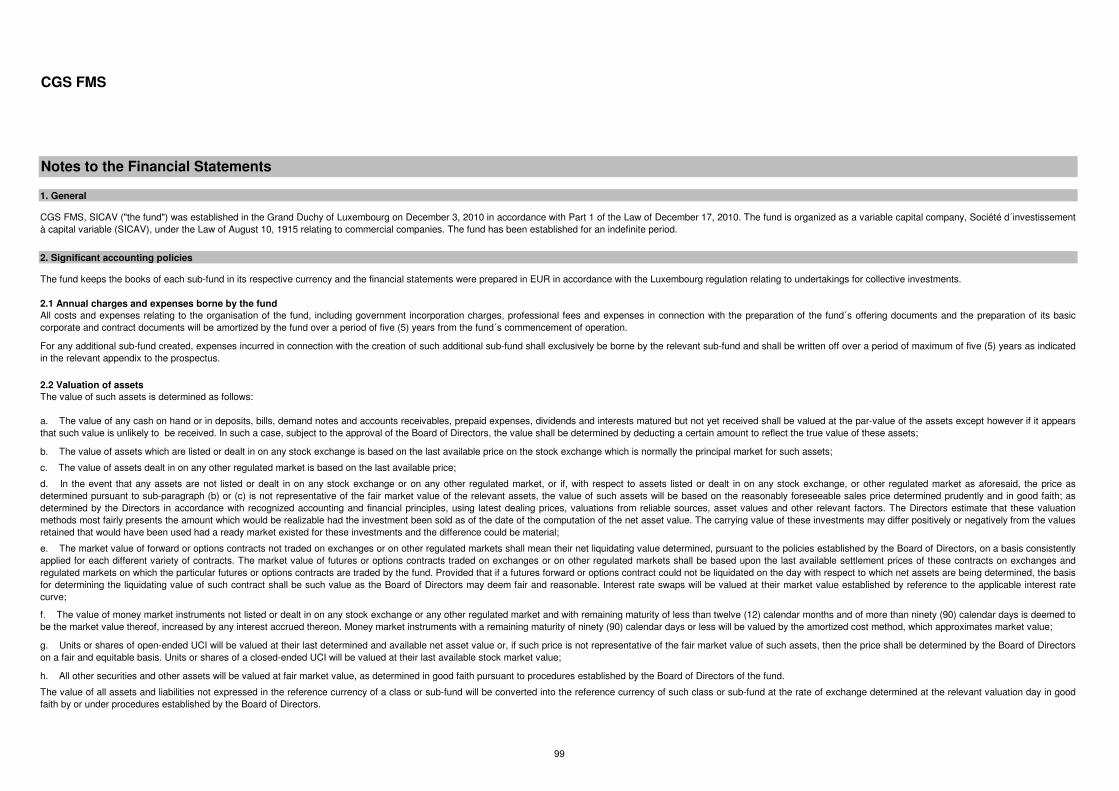
CGS FMS
1. General
2.1 Annual charges and expenses borne by the fund
2.2 Valuation of assets
g. Units or shares of open-ended UCI will be valued at their last determined and available net asset value or, if such price is not representative of the fair market value of such assets, then the price shall be determined by the Board of Directorson a fair and equitable basis. Units or shares of a closed-ended UCI will be valued at their last available stock market value;
h. All other securities and other assets will be valued at fair market value, as determined in good faith pursuant to procedures established by the Board of Directors of the fund.
All costs and expenses relating to the organisation of the fund, including government incorporation charges, professional fees and expenses in connection with the preparation of the fund´s offering documents and the preparation of its basiccorporate and contract documents will be amortized by the fund over a period of five (5) years from the fund´s commencement of operation.
For any additional sub-fund created, expenses incurred in connection with the creation of such additional sub-fund shall exclusively be borne by the relevant sub-fund and shall be written off over a period of maximum of five (5) years as indicatedin the relevant appendix to the prospectus.
e. The market value of forward or options contracts not traded on exchanges or on other regulated markets shall mean their net liquidating value determined, pursuant to the policies established by the Board of Directors, on a basis consistentlyapplied for each different variety of contracts. The market value of futures or options contracts traded on exchanges or on other regulated markets shall be based upon the last available settlement prices of these contracts on exchanges andregulated markets on which the particular futures or options contracts are traded by the fund. Provided that if a futures forward or options contract could not be liquidated on the day with respect to which net assets are being determined, the basisfor determining the liquidating value of such contract shall be such value as the Board of Directors may deem fair and reasonable. Interest rate swaps will be valued at their market value established by reference to the applicable interest ratecurve;
Notes to the Financial Statements
CGS FMS, SICAV ("the fund") was established in the Grand Duchy of Luxembourg on December 3, 2010 in accordance with Part 1 of the Law of December 17, 2010. The fund is organized as a variable capital company, Société d´investissementà capital variable (SICAV), under the Law of August 10, 1915 relating to commercial companies. The fund has been established for an indefinite period.
2. Significant accounting policies
The fund keeps the books of each sub-fund in its respective currency and the financial statements were prepared in EUR in accordance with the Luxembourg regulation relating to undertakings for collective investments.
f. The value of money market instruments not listed or dealt in on any stock exchange or any other regulated market and with remaining maturity of less than twelve (12) calendar months and of more than ninety (90) calendar days is deemed tobe the market value thereof, increased by any interest accrued thereon. Money market instruments with a remaining maturity of ninety (90) calendar days or less will be valued by the amortized cost method, which approximates market value;
The value of all assets and liabilities not expressed in the reference currency of a class or sub-fund will be converted into the reference currency of such class or sub-fund at the rate of exchange determined at the relevant valuation day in goodfaith by or under procedures established by the Board of Directors.
The value of such assets is determined as follows:
a. The value of any cash on hand or in deposits, bills, demand notes and accounts receivables, prepaid expenses, dividends and interests matured but not yet received shall be valued at the par-value of the assets except however if it appearsthat such value is unlikely to be received. In such a case, subject to the approval of the Board of Directors, the value shall be determined by deducting a certain amount to reflect the true value of these assets;
b. The value of assets which are listed or dealt in on any stock exchange is based on the last available price on the stock exchange which is normally the principal market for such assets;
c. The value of assets dealt in on any other regulated market is based on the last available price;
d. In the event that any assets are not listed or dealt in on any stock exchange or on any other regulated market, or if, with respect to assets listed or dealt in on any stock exchange, or other regulated market as aforesaid, the price asdetermined pursuant to sub-paragraph (b) or (c) is not representative of the fair market value of the relevant assets, the value of such assets will be based on the reasonably foreseeable sales price determined prudently and in good faith; asdetermined by the Directors in accordance with recognized accounting and financial principles, using latest dealing prices, valuations from reliable sources, asset values and other relevant factors. The Directors estimate that these valuationmethods most fairly presents the amount which would be realizable had the investment been sold as of the date of the computation of the net asset value. The carrying value of these investments may differ positively or negatively from the valuesretained that would have been used had a ready market existed for these investments and the difference could be material;
99
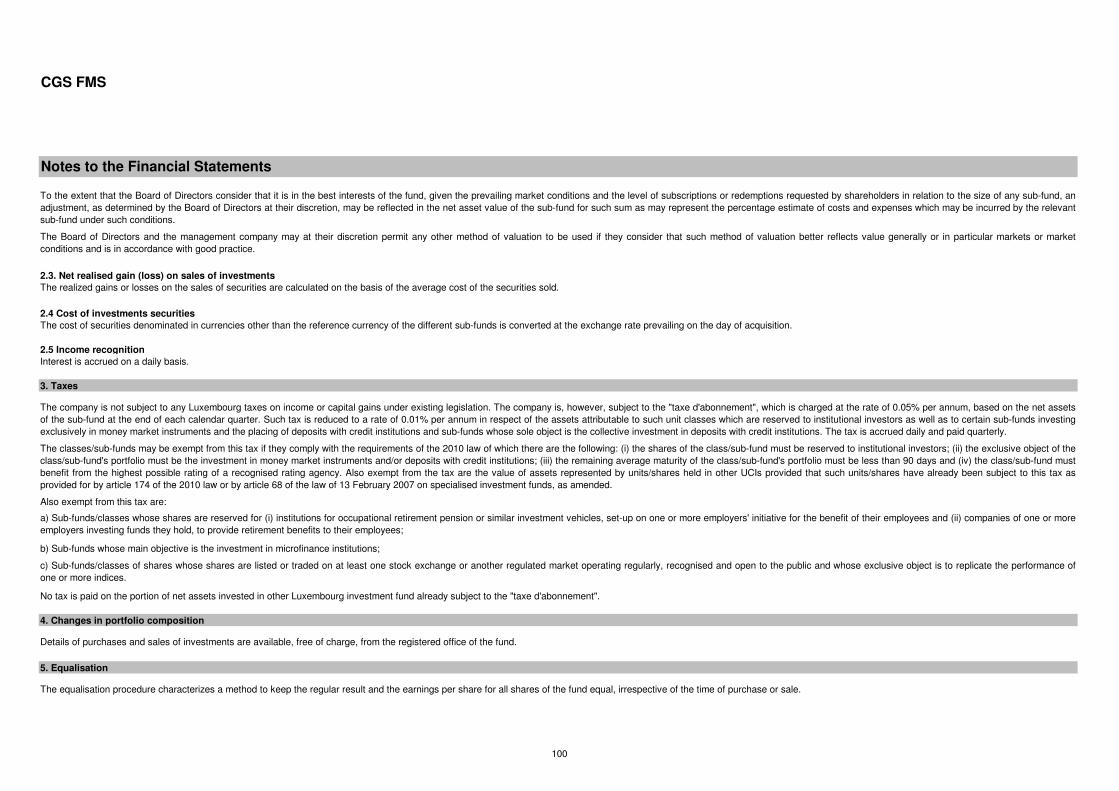
CGS FMS
Notes to the Financial Statements
2.4 Cost of investments securities
2.5 Income recognition
The company is not subject to any Luxembourg taxes on income or capital gains under existing legislation. The company is, however, subject to the "taxe d'abonnement", which is charged at the rate of 0.05% per annum, based on the net assetsof the sub-fund at the end of each calendar quarter. Such tax is reduced to a rate of 0.01% per annum in respect of the assets attributable to such unit classes which are reserved to institutional investors as well as to certain sub-funds investingexclusively in money market instruments and the placing of deposits with credit institutions and sub-funds whose sole object is the collective investment in deposits with credit institutions. The tax is accrued daily and paid quarterly.
The classes/sub-funds may be exempt from this tax if they comply with the requirements of the 2010 law of which there are the following: (i) the shares of the class/sub-fund must be reserved to institutional investors; (ii) the exclusive object of theclass/sub-fund's portfolio must be the investment in money market instruments and/or deposits with credit institutions; (iii) the remaining average maturity of the class/sub-fund's portfolio must be less than 90 days and (iv) the class/sub-fund mustbenefit from the highest possible rating of a recognised rating agency. Also exempt from the tax are the value of assets represented by units/shares held in other UCIs provided that such units/shares have already been subject to this tax asprovided for by article 174 of the 2010 law or by article 68 of the law of 13 February 2007 on specialised investment funds, as amended.
Also exempt from this tax are:
a) Sub-funds/classes whose shares are reserved for (i) institutions for occupational retirement pension or similar investment vehicles, set-up on one or more employers' initiative for the benefit of their employees and (ii) companies of one or moreemployers investing funds they hold, to provide retirement benefits to their employees;
b) Sub-funds whose main objective is the investment in microfinance institutions;
c) Sub-funds/classes of shares whose shares are listed or traded on at least one stock exchange or another regulated market operating regularly, recognised and open to the public and whose exclusive object is to replicate the performance ofone or more indices.
No tax is paid on the portion of net assets invested in other Luxembourg investment fund already subject to the "taxe d'abonnement".
4. Changes in portfolio composition
Details of purchases and sales of investments are available, free of charge, from the registered office of the fund.
The equalisation procedure characterizes a method to keep the regular result and the earnings per share for all shares of the fund equal, irrespective of the time of purchase or sale.
To the extent that the Board of Directors consider that it is in the best interests of the fund, given the prevailing market conditions and the level of subscriptions or redemptions requested by shareholders in relation to the size of any sub-fund, anadjustment, as determined by the Board of Directors at their discretion, may be reflected in the net asset value of the sub-fund for such sum as may represent the percentage estimate of costs and expenses which may be incurred by the relevantsub-fund under such conditions.
The Board of Directors and the management company may at their discretion permit any other method of valuation to be used if they consider that such method of valuation better reflects value generally or in particular markets or marketconditions and is in accordance with good practice.
3. Taxes
5. Equalisation
2.3. Net realised gain (loss) on sales of investments
The realized gains or losses on the sales of securities are calculated on the basis of the average cost of the securities sold.
The cost of securities denominated in currencies other than the reference currency of the different sub-funds is converted at the exchange rate prevailing on the day of acquisition.
Interest is accrued on a daily basis.
100
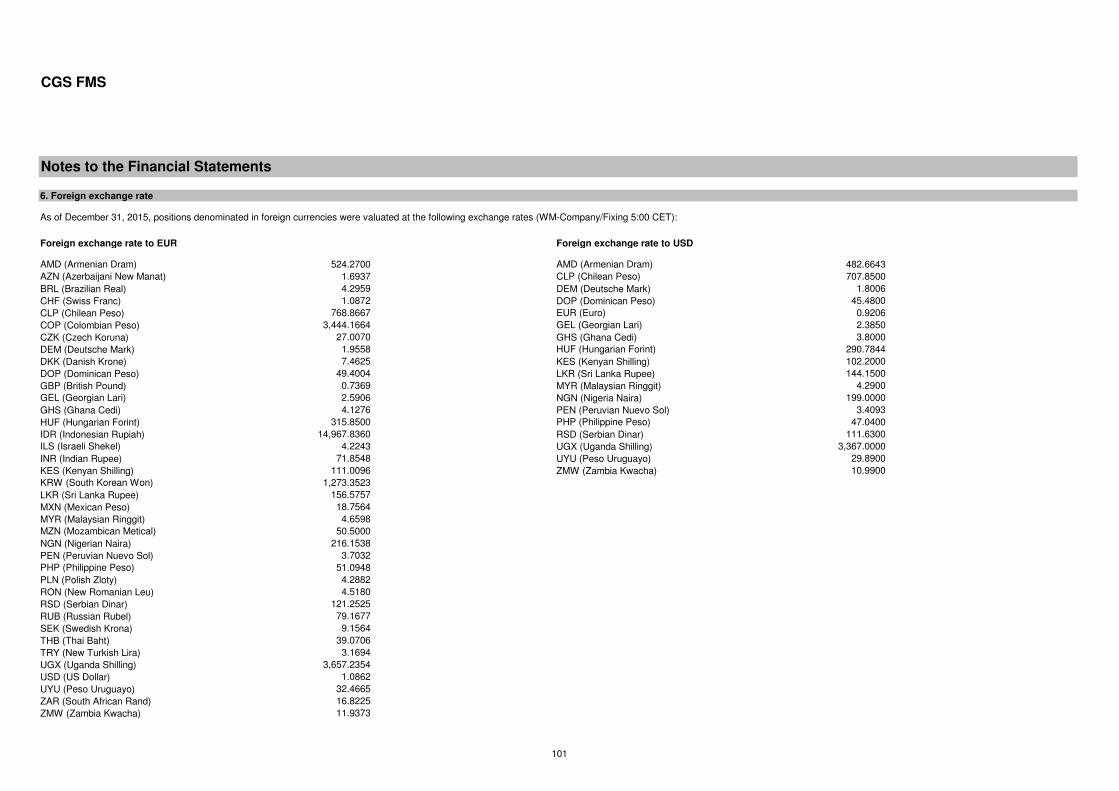
CGS FMS
Notes to the Financial Statements
Foreign exchange rate to EUR Foreign exchange rate to USD
AMD (Armenian Dram) 524.2700 AMD (Armenian Dram) 482.6643AZN (Azerbaijani New Manat) 1.6937 CLP (Chilean Peso) 707.8500BRL (Brazilian Real) 4.2959 DEM (Deutsche Mark) 1.8006CHF (Swiss Franc) 1.0872 DOP (Dominican Peso) 45.4800CLP (Chilean Peso) 768.8667 EUR (Euro) 0.9206COP (Colombian Peso) 3,444.1664 GEL (Georgian Lari) 2.3850CZK (Czech Koruna) 27.0070 GHS (Ghana Cedi) 3.8000DEM (Deutsche Mark) 1.9558 HUF (Hungarian Forint) 290.7844DKK (Danish Krone) 7.4625 KES (Kenyan Shilling) 102.2000DOP (Dominican Peso) 49.4004 LKR (Sri Lanka Rupee) 144.1500GBP (British Pound) 0.7369 MYR (Malaysian Ringgit) 4.2900GEL (Georgian Lari) 2.5906 NGN (Nigeria Naira) 199.0000GHS (Ghana Cedi) 4.1276 PEN (Peruvian Nuevo Sol) 3.4093HUF (Hungarian Forint) 315.8500 PHP (Philippine Peso) 47.0400IDR (Indonesian Rupiah) 14,967.8360 RSD (Serbian Dinar) 111.6300ILS (Israeli Shekel) 4.2243 UGX (Uganda Shilling) 3,367.0000INR (Indian Rupee) 71.8548 UYU (Peso Uruguayo) 29.8900KES (Kenyan Shilling) 111.0096 ZMW (Zambia Kwacha) 10.9900KRW (South Korean Won) 1,273.3523LKR (Sri Lanka Rupee) 156.5757MXN (Mexican Peso) 18.7564MYR (Malaysian Ringgit) 4.6598MZN (Mozambican Metical) 50.5000NGN (Nigerian Naira) 216.1538PEN (Peruvian Nuevo Sol) 3.7032PHP (Philippine Peso) 51.0948PLN (Polish Zloty) 4.2882RON (New Romanian Leu) 4.5180RSD (Serbian Dinar) 121.2525RUB (Russian Rubel) 79.1677SEK (Swedish Krona) 9.1564THB (Thai Baht) 39.0706TRY (New Turkish Lira) 3.1694UGX (Uganda Shilling) 3,657.2354USD (US Dollar) 1.0862UYU (Peso Uruguayo) 32.4665ZAR (South African Rand) 16.8225ZMW (Zambia Kwacha) 11.9373
As of December 31, 2015, positions denominated in foreign currencies were valuated at the following exchange rates (WM-Company/Fixing 5:00 CET):
6. Foreign exchange rate
101
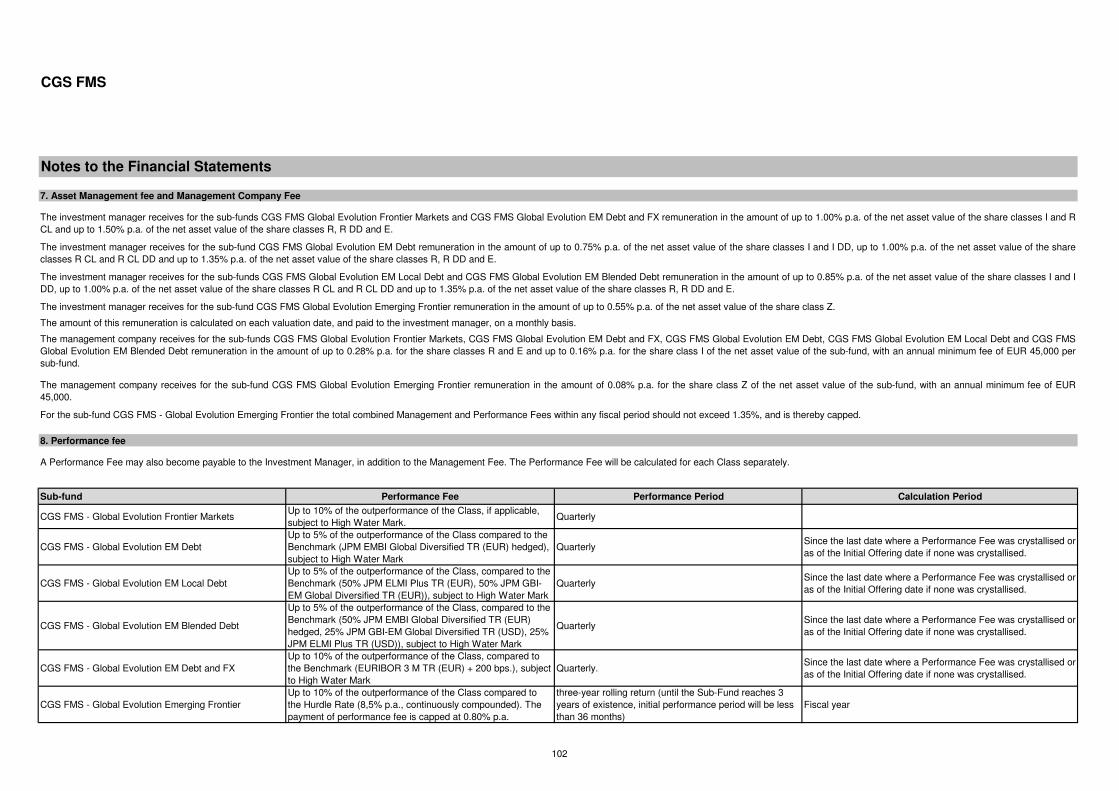
CGS FMS
Notes to the Financial Statements
Sub-fund Performance Fee Performance Period Calculation Period
CGS FMS - Global Evolution Frontier Markets Up to 10% of the outperformance of the Class, if applicable, subject to High Water Mark.
Quarterly
CGS FMS - Global Evolution EM Debt Up to 5% of the outperformance of the Class compared to the Benchmark (JPM EMBI Global Diversified TR (EUR) hedged), subject to High Water Mark
QuarterlySince the last date where a Performance Fee was crystallised or as of the Initial Offering date if none was crystallised.
CGS FMS - Global Evolution EM Local Debt Up to 5% of the outperformance of the Class, compared to the Benchmark (50% JPM ELMI Plus TR (EUR), 50% JPM GBI-EM Global Diversified TR (EUR)), subject to High Water Mark
QuarterlySince the last date where a Performance Fee was crystallised or as of the Initial Offering date if none was crystallised.
CGS FMS - Global Evolution EM Blended Debt
Up to 5% of the outperformance of the Class, compared to the Benchmark (50% JPM EMBI Global Diversified TR (EUR) hedged, 25% JPM GBI-EM Global Diversified TR (USD), 25% JPM ELMI Plus TR (USD)), subject to High Water Mark
QuarterlySince the last date where a Performance Fee was crystallised or as of the Initial Offering date if none was crystallised.
CGS FMS - Global Evolution EM Debt and FX Up to 10% of the outperformance of the Class, compared to the Benchmark (EURIBOR 3 M TR (EUR) + 200 bps.), subject to High Water Mark
Quarterly.Since the last date where a Performance Fee was crystallised or as of the Initial Offering date if none was crystallised.
CGS FMS - Global Evolution Emerging Frontier Up to 10% of the outperformance of the Class compared to the Hurdle Rate (8,5% p.a., continuously compounded). The payment of performance fee is capped at 0.80% p.a.
three-year rolling return (until the Sub-Fund reaches 3 years of existence, initial performance period will be less than 36 months)
Fiscal year
For the sub-fund CGS FMS - Global Evolution Emerging Frontier the total combined Management and Performance Fees within any fiscal period should not exceed 1.35%, and is thereby capped.
The amount of this remuneration is calculated on each valuation date, and paid to the investment manager, on a monthly basis.
The investment manager receives for the sub-fund CGS FMS Global Evolution EM Debt remuneration in the amount of up to 0.75% p.a. of the net asset value of the share classes I and I DD, up to 1.00% p.a. of the net asset value of the shareclasses R CL and R CL DD and up to 1.35% p.a. of the net asset value of the share classes R, R DD and E.
The investment manager receives for the sub-funds CGS FMS Global Evolution EM Local Debt and CGS FMS Global Evolution EM Blended Debt remuneration in the amount of up to 0.85% p.a. of the net asset value of the share classes I and IDD, up to 1.00% p.a. of the net asset value of the share classes R CL and R CL DD and up to 1.35% p.a. of the net asset value of the share classes R, R DD and E.
The investment manager receives for the sub-fund CGS FMS Global Evolution Emerging Frontier remuneration in the amount of up to 0.55% p.a. of the net asset value of the share class Z.
The management company receives for the sub-fund CGS FMS Global Evolution Emerging Frontier remuneration in the amount of 0.08% p.a. for the share class Z of the net asset value of the sub-fund, with an annual minimum fee of EUR45,000.
The management company receives for the sub-funds CGS FMS Global Evolution Frontier Markets, CGS FMS Global Evolution EM Debt and FX, CGS FMS Global Evolution EM Debt, CGS FMS Global Evolution EM Local Debt and CGS FMSGlobal Evolution EM Blended Debt remuneration in the amount of up to 0.28% p.a. for the share classes R and E and up to 0.16% p.a. for the share class I of the net asset value of the sub-fund, with an annual minimum fee of EUR 45,000 persub-fund.
8. Performance fee
A Performance Fee may also become payable to the Investment Manager, in addition to the Management Fee. The Performance Fee will be calculated for each Class separately.
7. Asset Management fee and Management Company Fee
The investment manager receives for the sub-funds CGS FMS Global Evolution Frontier Markets and CGS FMS Global Evolution EM Debt and FX remuneration in the amount of up to 1.00% p.a. of the net asset value of the share classes I and R CL and up to 1.50% p.a. of the net asset value of the share classes R, R DD and E.
102
CGS FMS
Notes to the Financial Statements
CGS FMS - Global Evolution Emerging Frontier
Following a Performance Period in which no Performance Fee has been charged, no Performance Fee will accrue until such time as the cumulative percentage growth in the Net Asset Value per Share of the relevant Class exceeds the HurdleRate.
The total combined Management and Performance Fees within any fiscal period should not exceed 1.35%, and is thereby capped.
The Performance Period shall be based on a three-year rolling return with each Performance Period ending on 31 December ("Annual Date") in each year (the "Performance Period"). However, in the case of the initial issue of Shares, the firstPerformance Period will commence on the Business Day immediately following the Launch Date and end on the following Annual Date. For the purposes of the first calculation of the Performance Fee, the starting point for the relevant Net AssetValue per Share of each relevant Class is the Initial Offering Price.
The accumulative return of the Hurdle Rate is calculated as follows:
Formula = (1,085^(d/(days in calculation period)))-1 (as percentage)
If the Net Asset Value per Share of each relevant Class at the end of a Performance Period is lower than the accumulative return of the Hurdle Rate, no Performance Fee is due. The Performance Fee will accrue and be taken into account in thecalculation of the Net Asset Value per Share at each Valuation Day. No adjustment of the Net Asset Value for the accrued Performance Fee will be made to calculate the Performance Fee. The amount accrued at each Valuation Day will bedetermined by calculating the Performance Fee that would be payable if the Valuation Day was the last day of the current Performance Period.
The Performance Fee payment is capped at 0.80% p.a. of the average of Net Asset Value of the Sub-Fund on each Valuation Day in the Calculation Period; there is no refund or clawback of previously paid Performance Fees.
The Performance Fee will accrue and be taken into account in the calculation of the Net Asset Value per Share at each Valuation Day and will be payable quarterly in arrears in respect of each Performance Period.
The Performance Fee becomes due in the event the Net Asset Value per Share at the end of the Performance Period exceeds the High Water Mark. The High Water Mark shall be the highest Net Asset Value per Share at the end of any previousPerformance Period where a Performance Fee has been crystallised for the relevant Class or the Initial Offering Price if there has not been a former Performance Fee crystallized.
The Performance Period shall run quarterly with each Performance Period ending on 31 March, 30 June, 30 September and 31 December ("Quarter Date") in each year (the "Performance Period"). However, in the case of the initial issue ofShares, the first Performance Period will commence on the Business Day immediately following the Launch Date and end on the following Quarter Date. In case the Net Asset Value per Share at the end of a Performance Period is below the HighWater Mark, no new (lower) High Water Mark is set but the prior (higher) High Water Mark stand as a reference for the following Performance Period.
For the purposes of the first calculation of the Performance Fee, the starting point for the relevant Net Asset Value per Share of each relevant Class is the Initial Offering Price.
The Performance Fee amounts to 10% of the outperformance of each relevant Class. An outperformance exists if the Net Asset Value per Share of each relevant Class at the end of a Performance Period is higher than the High Water Mark. ThePerformance fee is calculated quarterly after the end of each Performance Period based on the average quarterly market value as determined by the Administration Agent. The average market value will be calculated by averaging the value ofeach relevant Class as of each Business of the relevant Performance Period.
If the Net Asset Value per Share of each relevant Class at the end of a Performance Period is lower than the High Water Mark, no performance fee is due.
The Performance Fee will accrue and be taken into account in the calculation of the Net Asset Value per Share at each Valuation Day. The amount accrued at each Valuation Day will be determined by calculating the Performance Fee that wouldbe payable if the Valuation Day was the last day of the current Performance Period.
Following a Performance Period in which no Performance Fee has been charged, no Performance Fee will accrue until such time as the cumulative percentage growth in the Net Asset Value per Share of the relevant Class exceeds the HighWater Mark.
The amount of the Performance Fee will be calculated by the Management Company.
The level of the Performance Fee will not be changed unless, thirty (30) calendar days before the change, the Fund has revised and made available the updated Prospectus to the Shareholders and has given notice of its intentions and the date ofcommencement of the change to Shareholders. In case such a change results in an increase of fees payable out of the Sub-Fund's assets, any such notice must include the information that Shareholders who do not agree with such change mayrequest redemption of all or part of their Shares free of any charges at the relevant Net Asset Value per Share until the end of the above-mentioned thirty (30)-day period.
CGS FMS - Global Evolution Frontier Markets, CGS FMS - Global Evolution EM Debt, CGS FMS - Global Evolution EM Local Debt, CGS FMS - Global Evolution EM Blended Debt, CGS FMS - Global Evolution EM Debt and FX
The Investment Manager is entitled to a Performance Fee of up to 10% of the amount the performance of the Net Asset Value per Share outperforms the Hurdle Rate. An outperformance exists if the Net Asset Value per Share of each relevantClass at the end of a Performance Period is higher than the accumulative return of the Hurdle Rate. The Performance Fee is calculated annually after the end of each Performance Period based on the average Net Asset Value as determined bythe Administration Agent. The average Net Asset Value will be calculated by averaging the Net Asset Value per Share of each relevant Class as of each Business day of the relevant Performance Period.
103
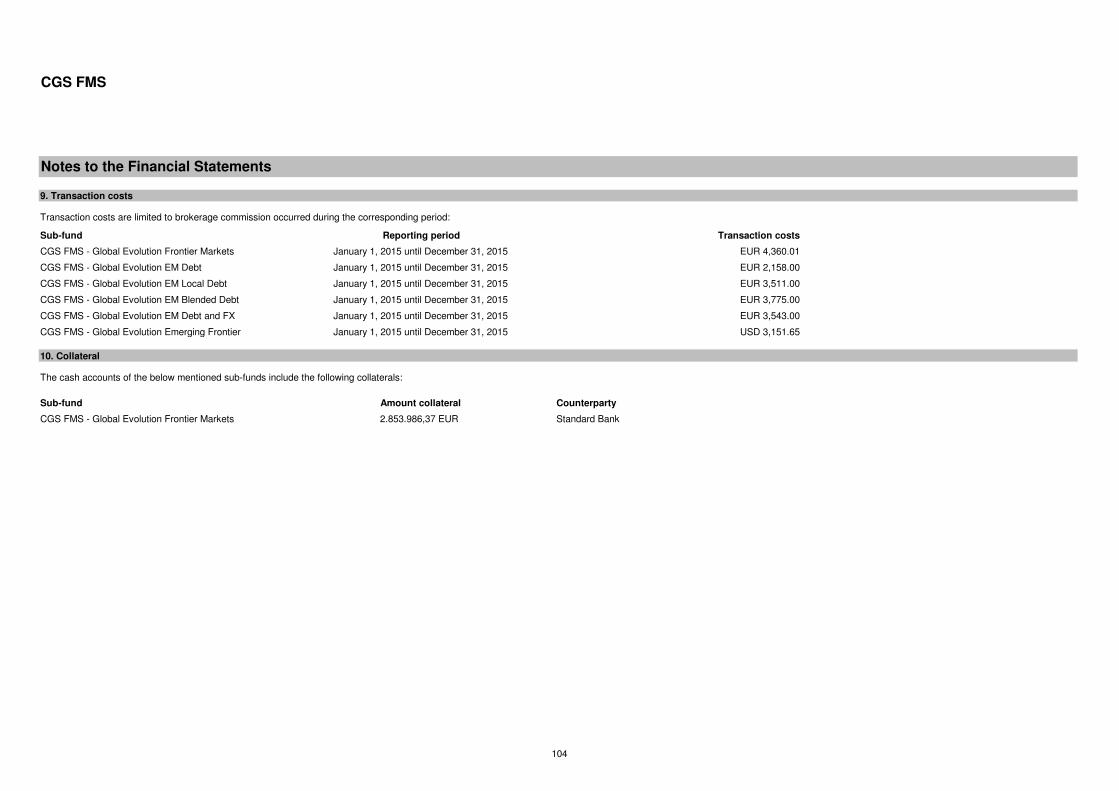
CGS FMS
Notes to the Financial Statements
Sub-fund Reporting period Transaction costs
CGS FMS - Global Evolution Frontier Markets January 1, 2015 until December 31, 2015 EUR 4,360.01
CGS FMS - Global Evolution EM Debt January 1, 2015 until December 31, 2015 EUR 2,158.00
CGS FMS - Global Evolution EM Local Debt January 1, 2015 until December 31, 2015 EUR 3,511.00
CGS FMS - Global Evolution EM Blended Debt January 1, 2015 until December 31, 2015 EUR 3,775.00
CGS FMS - Global Evolution EM Debt and FX January 1, 2015 until December 31, 2015 EUR 3,543.00
CGS FMS - Global Evolution Emerging Frontier January 1, 2015 until December 31, 2015 USD 3,151.65
Sub-fund Amount collateral Counterparty
CGS FMS - Global Evolution Frontier Markets 2.853.986,37 EUR Standard Bank
The cash accounts of the below mentioned sub-funds include the following collaterals:
Transaction costs are limited to brokerage commission occurred during the corresponding period:
9. Transaction costs
10. Collateral
104
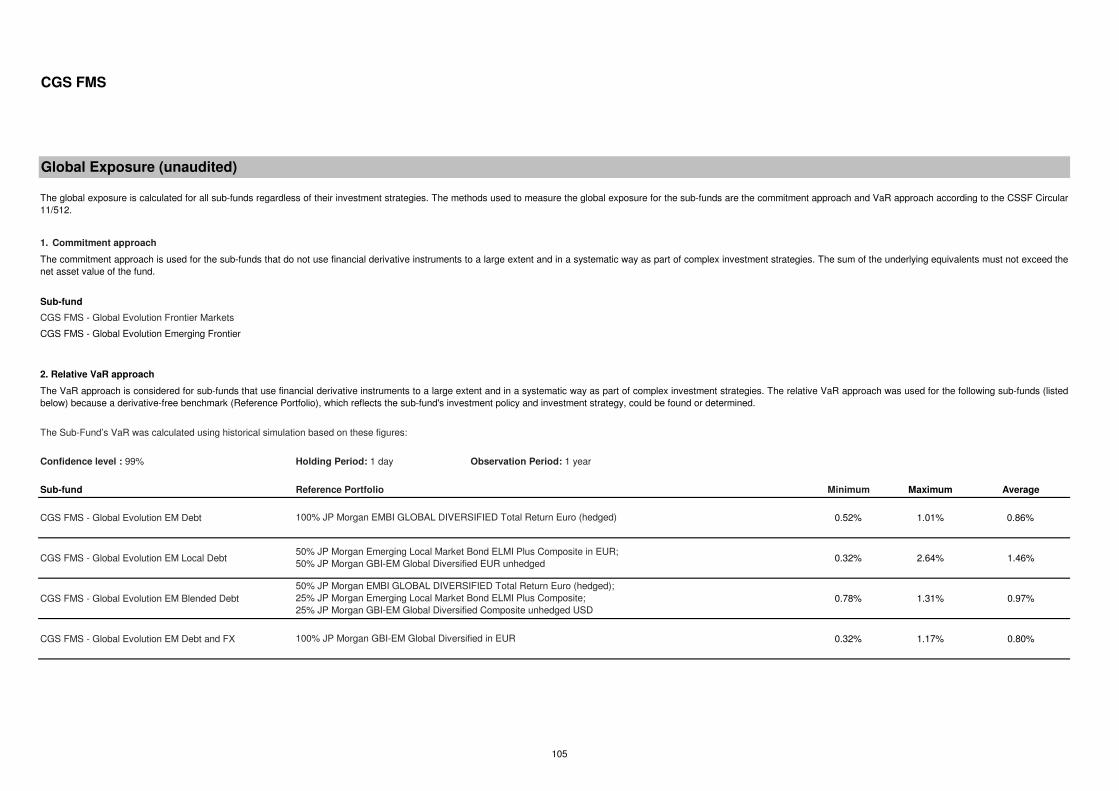
CGS FMS
1. Commitment approach
Sub-fund
CGS FMS - Global Evolution Frontier Markets
CGS FMS - Global Evolution Emerging Frontier
2. Relative VaR approach
Confidence level : 99% Holding Period: 1 day Observation Period: 1 year
Sub-fund Reference Portfolio Minimum Maximum Average
CGS FMS - Global Evolution EM Debt 0.52% 1.01% 0.86%
CGS FMS - Global Evolution EM Local Debt 0.32% 2.64% 1.46%
CGS FMS - Global Evolution EM Blended Debt 0.78% 1.31% 0.97%
CGS FMS - Global Evolution EM Debt and FX 0.32% 1.17% 0.80%
Global Exposure (unaudited)
The VaR approach is considered for sub-funds that use financial derivative instruments to a large extent and in a systematic way as part of complex investment strategies. The relative VaR approach was used for the following sub-funds (listedbelow) because a derivative-free benchmark (Reference Portfolio), which reflects the sub-fund's investment policy and investment strategy, could be found or determined.
The commitment approach is used for the sub-funds that do not use financial derivative instruments to a large extent and in a systematic way as part of complex investment strategies. The sum of the underlying equivalents must not exceed thenet asset value of the fund.
The global exposure is calculated for all sub-funds regardless of their investment strategies. The methods used to measure the global exposure for the sub-funds are the commitment approach and VaR approach according to the CSSF Circular11/512.
The Sub-Fund’s VaR was calculated using historical simulation based on these figures:
50% JP Morgan Emerging Local Market Bond ELMI Plus Composite in EUR; 50% JP Morgan GBI-EM Global Diversified EUR unhedged
100% JP Morgan EMBI GLOBAL DIVERSIFIED Total Return Euro (hedged)
50% JP Morgan EMBI GLOBAL DIVERSIFIED Total Return Euro (hedged); 25% JP Morgan Emerging Local Market Bond ELMI Plus Composite;25% JP Morgan GBI-EM Global Diversified Composite unhedged USD
100% JP Morgan GBI-EM Global Diversified in EUR
105
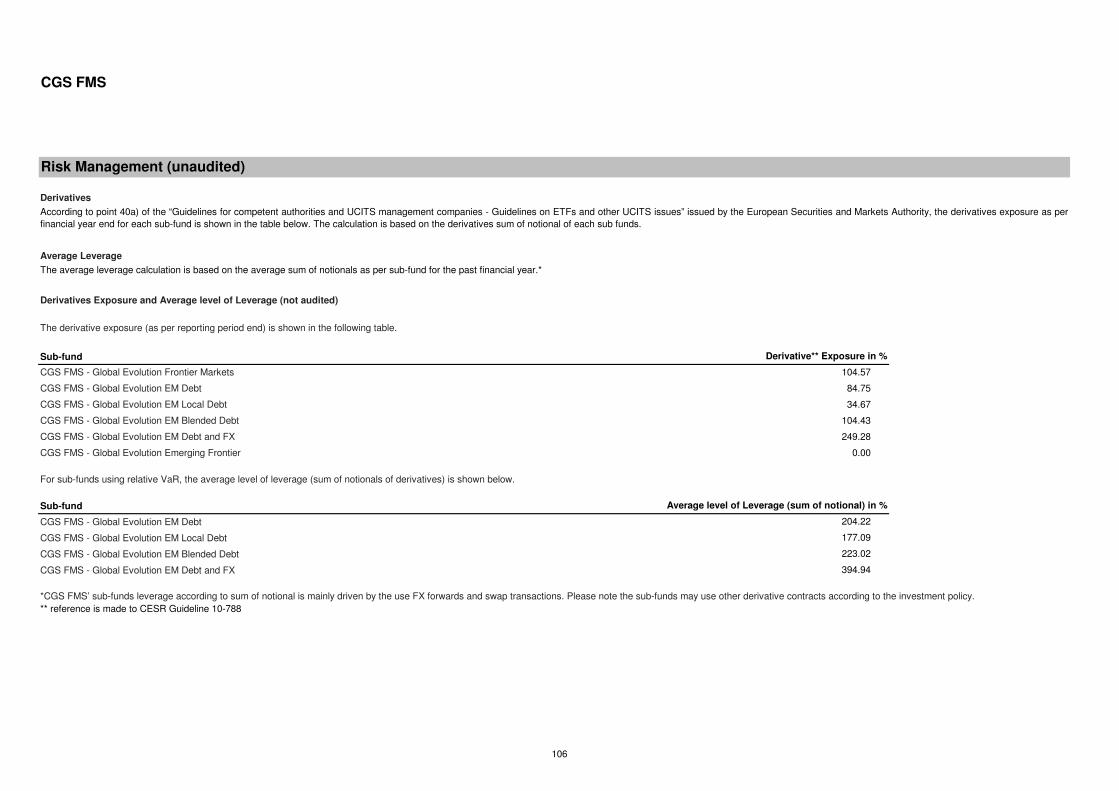
CGS FMS
Derivatives
Average Leverage
Derivatives Exposure and Average level of Leverage (not audited)
Sub-fund
For sub-funds using relative VaR, the average level of leverage (sum of notionals of derivatives) is shown below.
Sub-fund
CGS FMS - Global Evolution EM Debt
CGS FMS - Global Evolution EM Local Debt
CGS FMS - Global Evolution EM Blended Debt
CGS FMS - Global Evolution EM Debt and FX
** reference is made to CESR Guideline 10-788
223.02
394.94
177.09
Risk Management (unaudited)
249.28
0.00
Average level of Leverage (sum of notional) in %
204.22
Derivative** Exposure in %
104.57
CGS FMS - Global Evolution Emerging Frontier
CGS FMS - Global Evolution Frontier Markets
CGS FMS - Global Evolution EM Debt
CGS FMS - Global Evolution EM Debt and FX
*CGS FMS’ sub-funds leverage according to sum of notional is mainly driven by the use FX forwards and swap transactions. Please note the sub-funds may use other derivative contracts according to the investment policy.
CGS FMS - Global Evolution EM Local Debt
CGS FMS - Global Evolution EM Blended Debt
84.75
34.67
104.43
The derivative exposure (as per reporting period end) is shown in the following table.
According to point 40a) of the “Guidelines for competent authorities and UCITS management companies - Guidelines on ETFs and other UCITS issues” issued by the European Securities and Markets Authority, the derivatives exposure as perfinancial year end for each sub-fund is shown in the table below. The calculation is based on the derivatives sum of notional of each sub funds.
The average leverage calculation is based on the average sum of notionals as per sub-fund for the past financial year.*
106
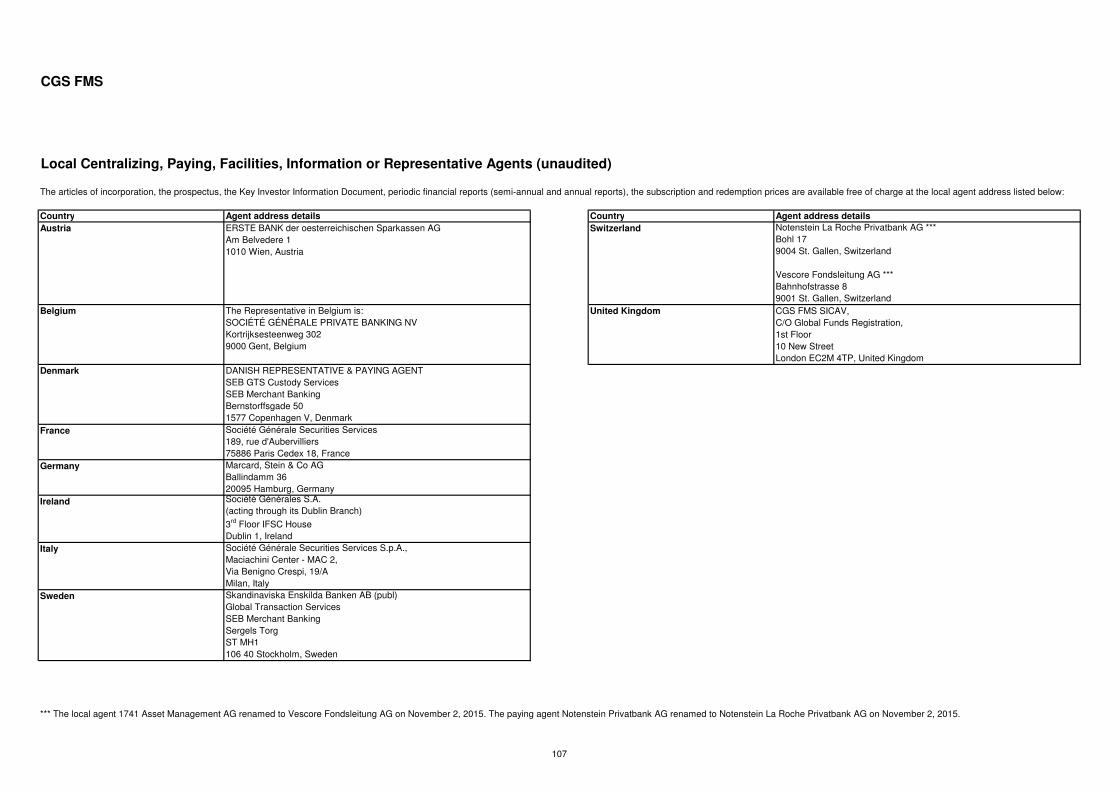
CGS FMS
Country Agent address details Country Agent address details
Austria ERSTE BANK der oesterreichischen Sparkassen AG Am Belvedere 1 1010 Wien, Austria
Switzerland Notenstein La Roche Privatbank AG ***Bohl 179004 St. Gallen, Switzerland
Vescore Fondsleitung AG ***Bahnhofstrasse 8 9001 St. Gallen, Switzerland
Belgium The Representative in Belgium is:SOCIÉTÉ GÉNÉRALE PRIVATE BANKING NVKortrijksesteenweg 3029000 Gent, Belgium
United Kingdom CGS FMS SICAV,C/O Global Funds Registration,1st Floor10 New StreetLondon EC2M 4TP, United Kingdom
Denmark DANISH REPRESENTATIVE & PAYING AGENTSEB GTS Custody ServicesSEB Merchant BankingBernstorffsgade 501577 Copenhagen V, Denmark
France Société Générale Securities Services189, rue d'Aubervilliers75886 Paris Cedex 18, France
Germany Marcard, Stein & Co AGBallindamm 3620095 Hamburg, Germany
Ireland Société Générales S.A.(acting through its Dublin Branch)
3rd Floor IFSC House Dublin 1, Ireland
Italy Société Générale Securities Services S.p.A., Maciachini Center - MAC 2, Via Benigno Crespi, 19/A Milan, Italy
Sweden Skandinaviska Enskilda Banken AB (publ)Global Transaction Services SEB Merchant BankingSergels TorgST MH1106 40 Stockholm, Sweden
*** The local agent 1741 Asset Management AG renamed to Vescore Fondsleitung AG on November 2, 2015. The paying agent Notenstein Privatbank AG renamed to Notenstein La Roche Privatbank AG on November 2, 2015.
Local Centralizing, Paying, Facilities, Information or Representative Agents (unaudited)
The articles of incorporation, the prospectus, the Key Investor Information Document, periodic financial reports (semi-annual and annual reports), the subscription and redemption prices are available free of charge at the local agent address listed below:
107


