18
SHARED STRATEGY STUDY 2006 THE STATE OF COLLABORATION THE STATE OF COLLABORATION INSIDE Manufacturers’ and Retailers’ Stance On Demand Planning TPM Data Sync Supply Chain Execution

S H A R E D S T R A T E G Y S T U D Y 2 0 0 6
THE STATE OF COLLABORATIONTHE STATE OF COLLABORATION
INSIDEManufacturers’ andRetailers’ Stance On 4Demand Planning 4TPM 4Data Sync 4Supply Chain Execution
SS-11-06-p01-Cover.qxd 10/18/06 4:09 PM Page 1

SS2 | SHARED STRATEGY STUDY | NOVEMBER 2006
S H A R E D S T R A T E G Y S T U D Y 2 0 0 6
THE STATE OF COLLABORATION
Letter from Forrester ResearchRFID WITHIN CONSUMER PACKAGED GOODS IS EVOLVING AT A NATURAL PACE
SS4 | SETTING THE STAGETo benchmark collaborative activities, we surveyed 80 manufacturersand 89 retailers.
SS6 | STATE OF COLLABORATIONWe examined collaborative opportunities that spanned the supply chain —everything from demand forecasting and new product development throughmore mundane aspects of supply chain execution. One clear outcome of thisstudy is that collaboration is on the rise between trading partners.
SS8 | DEMAND PLANNINGDemand planning and forecasting tops the list in overall ROI ranking (acrossboth retailers and manufacturers) for the second year in a row.
SS10 | PRODUCT DEVELOPMENTRetailers became much more interested in collaborating on productdevelopment in 2006, but manufacturers’ opinions of it as a generator of ROIfell significantly from 2005 to 2006.
SS12 | CUSTOMIZED RESEARCHCustomer Centric MerchandisingInfosys explores best practices.
SS14 | ASSORTMENT PLANNINGRetailers give assortment planning collaboration the biggest jump in rankingfor ROI value.
SS16 | TRADE PROMOTION MANAGEMENTOur survey shows a solid increase in activity and a big increase in valueperception for manufacturers. Why the jump?
SS17 | MARKETING COLLABORATIONCollaborative marketing had the biggest jump in activity from 2005 to 2006,but the perceived ROI has shifted.
SS18 | DATA SYNCManufacturers are making headway in data sync adoption. What does this meanfor GDS overall?
SS19 | CASE STUDY: COTT BEVERAGESCopy to come for this synopsis. Please put enough room for this to be two lines.Thank you very much.
SS20 | RFIDRFID is the least shared data among retailers and manufacturers. Manufacturershave made some headway in sharing RFID data with retailers, but adoptionplans remain unchanged from last year.
SS20 | SUPPLY CHAIN EXECUTIONOutside of assortment planning, replenishment and order managementcollaboration have the highest activity among manufacturers and retailers. Andadoption of the foundational technologies for execution is high. But despitehigh activity the perceived value is low.
SS23 | PRICE OPTIMIZATIONRetailer activity increased while manufacturers’ declined slightly, but valueperception of price optimization stayed steady.
EDITOR’S NOTE:Some figures on charts may not total 100 due to rounding.
S H A R E D S T R A T E G Y S T U D Y 2 0 0 6
THE STATE OF COLLABORATIONTHE STATE OF COLLABORATION
INSIDEManufacturers’ andRetailers’ Stance On 4Demand Planning 4TPM 4Data Sync 4Supply Chain Execution
SS-11-06-p01-Cover.qxd 10/18/06 4:09 PM Page 1
Table of Contents
COMPETE, COOPERATE, COLLABORATE: These terms and the various degreesbetween them (“coopetition”) represent the daily challenges and opportunities thatabound between trading partners in the consumer goods supply chain. But aside fromputting out daily fires, the real challenge facing manufacturers and retailers alike isfiguring out how to succeed in a dynamic collaborative environment, where today’scollaborator is tomorrow’s competitor — and vice versa. Collaborating successfully — sothat the consumer as well as both trading partners benefits — requires a strong process,enabled by powerful collaborative technologies, and that most fundamental of allingredients, trust.
The following study is the second year that Forrester Research, in partnership withConsumer Goods Technology and RIS News, examines the degree of collaboration betweenmanufacturers and retailers. It digs deeply into the state of manufacturer and retailer collaborationby analyzing the areas where firms work together, the technologies that they use to supportcollaboration, and the benefits and challenges of relying more on trading partners.
This study is packed full of insights into the collaborative behavior of manufacturers and retailers,and I hope you find it insightful as you embark on your own collaborative initiatives for 2007.
Enjoy!Nikki BairdPrincipal Analyst - B2C Supply Chain Research, Forrester Research
SS_p02.REV2 10/26/06 2:22 PM Page 4

SS4 | SHARED STRATEGY STUDY | NOVEMBER 2006
S H A R E D S T R A T E G Y S T U D Y 2 0 0 6
THE STATE OF COLLABORATION
To benchmark collaborative activities, wesurveyed 80 manufacturers and 89retailers. Here is a snapshot of our diversegroup of survey participants:
PARTICIPANTS REPRESENT BOTH MID-SIZE AND LARGE FIRMSNearly 40 percent of retail participantscame from firms with greater than $1billion in revenue, a significant increaseover last year (see Figure 1) . Butrespondents from manufacturers withgreater than $1 bi l l ion in revenueincreased even more — 70 percent ofrespondents versus 38 percent in 2005.
PARTICIPANTS ARE INCREASINGLY GLOBALThis year ’s part icipants sel l in moremarkets overall. But manufacturers aremaking greater global strides than theirretai l counterparts. For example, 71percent of manufacturers sell products inEurope versus only 12 percent of retailers.The same trend carries across SouthAmerican, Middle Eastern and Asia Pacificmarkets. However, manufacturer (100percent) and retailer (99 percent) surveyparticipants are equally present in theNorth American market.
PARTICIPANTS SELL A BROAD RANGE OFCONSUMER PRODUCT CATEGORIESParticipants sell nearly every category ofconsumer product (see Figure 2). Topcategories include food and beverage,over-the-counter and household products,and apparel and footwear.
PARTICIPANTS ARE COMPRISED OF SENIOR EXECUTIVESPart icipants are high-level decis ion-makers, with 82 percent of retailers and61 percent of manufacturers coming fromC-level or senior management ranks (seeFigure 3). Additionally, 58 percent of retailand 45 percent of manufacturerpart icipants have IT responsibi l i t ies (see Figure 4).
PARTICIPANTS HAVE CIOS THAT REPORT TO TOP EXECUTIVES More than half of retail participants (55percent) indicate the CIO reports to theCEO. The majority of manufacturerpart icipants (53 percent) indicate aslightly more distant relationship, with theCIO reporting to the CFO.
Setting the StageA BREAKDOWN OF THE 2006 SHARED STRATEGY STUDY PARTICIPANTS
WHAT PRODUCTS DOES YOUR COMPANY SELL?
WHAT WERE YOUR COMPANY’S GLOBAL REVENUES LAST YEAR?
WHICH OF THE FOLLOWING BEST DESCRIBES YOUR POSITION?
WHICH BUSINESS FUNCTIONS DO YOU HAVE RESPONSIBILITY FOR?
RETAILERS 2006 MANUFACTURERS 2006
29%
26%19%
20%
6% 11%
15%
35%
35%
5%
< $250 Million
< $250 Million
$250 - $999 Million
$250 - $999 Million
$1 - $5 Billion$1 - $5 Billion
>$5 Billion>$5 Billion
Don’t Know/Can’t Answer
Don’t Know/Can’t Answer
RETAILERS 2006 MANUFACTURERS 2006
35%C-level
47%
18%10%
51%
39%
Executive
Manager
Manager
Executive
C-level
FOOD &BEVERAGE
44%
ALCOHOL/TOBACCO
OTHE CPG/OTC &
HOUSEHOLD
RX DRUGS APPAREL/FOOTWEAR
CONSUMERELECTRONICS
CONSUMERDURABLES
SPORTINGGOODS
HOME SOFTGOODS
OFFICESUPPLIES
AUTOAFTERMARKET
OTHER
6%
15%
2%
14%19%
4%0%
30%
3%
24%26%
7%
28%
9%
4%
59%
3%
19%
34%
44%
30%
6%
44%
RETAILERS 2006 MANUFACTURERS 2006
RETAILERS 2006 MANUFACTURERS 2006
IT MARKETING &ADVERTISING
SUPPLY CHAIN SALES/MERCHANDISING
CATEGORYMANAGEMENT
58%
PRODUCTDEVELOPMENT
OTHER
45%
4%9%
19%23%22%
36%
3%
16%
33%36%
10%
29%
Figure 1
Figure 2
Figure 3
Figure 4
SS-p4.rev2 10/25/06 10:00 AM Page 4

SS6 | SHARED STRATEGY STUDY | NOVEMBER 2006
S H A R E D S T R A T E G Y S T U D Y 2 0 0 6
THE STATE OF COLLABORATION
ONE CLEAR OUTCOME OF THIS STUDY ISthat collaboration is on the rise between tradingpartners. Retailer and manufacturer studyparticipants indicate a greater involvement incollaborative activities across the supply chain.Attitudes about the success and impact of
collaboration are positive, and the perceived valueof collaborative activities across retailers andmanufacturers has increased. A clear majority ofretailers (70 percent) and manufacturers (88percent) agree that collaborating with tradingpartners has positively impacted their revenueand profit. On the flip side, 67 percent of retailersand 81 percent of manufacturers agree that theysuffer adverse business effects when they don’tcollaborate with their trading partners.
And despite an overall outlook that is slightlypessimistic for 2007, 48 percent of retailers and42 percent of manufacturers plan to increase ITspending in 2007, with a nearly correspondingboost to collaborative technologies. Forty-sevenpercent of retailers and 46 percent ofmanufacturers believe that their spending oncollaborative technology will increase in 2007,but challenges persist.
Retailers and manufacturers have differentROI priorities. While retailers overall rankassortment planning and inventory managementas the most important ROI opportunities,manufacturers focus much more on demandplanning and trade promotion management —creating an opportunity for missed expectationsbetween trading partners.
Lack of resources and cooperation constraincollaborative relationships. Successfulcollaboration efforts in 2005 pave the way formore trust between partners in 2006. But asidefrom resource constraints — a challenge every ITbudget must contend with — participantsindicate challenges arising from lack ofcooperation from their trading partners as asignificant barrier. For example, 43 percent ofretailers and 48 percent of manufacturers citeconflicting or misaligned goals as a major sourceof contention. In addition, 52 percent of retailersand 63 percent of manufacturers cite limitedexternal resources and support from tradingpartners as challenging, while 43 percent ofretailers and 53 percent of manufacturers citeaccess (or lack of access) to timely and relevantdata as a key challenge.
In the pages that follow, we examinedcollaborative opportunities that span the supplychain — everything from demand forecasting andnew product development through moremundane aspects of supply chain execution.While some of these categories have been a focusfor collaboration for many years (CPFR, forexample), and some are fairly recent additions(RFID), one theme is common across allcategories — there is still plenty of room for improvement.
The State of CollaborationCOLLABORATION INCREASES BUT, CHALLENGES PERSIST
DO YOU COLLABORATE WITH TRADING PARTNERS FOR THE FOLLOWING ACTIVITIES?
WHAT IS THE OUTLOOK FOR YOUR INDUSTRY NEXT YEAR?
RETAILERS 2006 MANUFACTURERS 2006
RETAILERS 2006 MANUFACTURERS 2006
DEMANDPLANNING ANDFORECASTING
PRODUCTDEVELOPMENT
NEWITEM
INTRO
ASSORTMENTPLANNING
INVENTORYMANAGEMENT
& REPLENISHMENTPLANNING
PRICEOPTIMIZATION
TPM MARKETING ORDERMANAGEMENT
TRANSPORTATIONMANAGEMENT
43%
49%
45%
29%
58%
54%
59%
67%
52%
58%
46%
28%
55%58%
47%
42%
52%
64%
47%
38%
EXTREMELYCHALLENGING
14%
SOMEWHATCHALLENGING
SOMEWHATGOOD
VERY GOOD NO ANSWER
0%
18%17%
12%
7%
25%
53%
36%
18%
SS-p6-7.rev2 10/25/06 10:01 AM Page 4

S H A R E D S T R A T E G Y S T U D Y 2 0 0 6
THE STATE OF COLLABORATION
WHICH THREE COLLABORATIVE ACTIVITIES HAVE THE HIGHESTRETURN ON INVESTMENT? (% RANKING IN THE TOP 3)
LACK OF TRUST BETWEEN TRADING PARTNERS CHALLENGES MY COMPANY’S
ABILITY TO COLLABORATE WITH ITS TRADING PARTNERS. (% AGREE)
RETAILERS 2006 MANUFACTURERS 2006
RETAILERS 2006 MANUFACTURERS 2006
SHARED STRATEGY STUDY | NOVEMBER 2006 | SS7
DEMANDPLANNING ANDFORECASTING
PRODUCTDEVELOPMENT
NEWITEM
INTRO
ASSORTMENTPLANNING
INVENTORYMANAGEMENT
& REPLENISHMENTPLANNING
PRICEOPTIMIZATION
TPM MARKETING ORDERMANAGEMENT
TRANSPORTATIONMANAGEMENT
40%
63%
24%
8%
16%
25%
44%
34%
48%
32% 33%
21%
57%
13%
21%
15%
19%19%
13%14%
% AGREEING
28%
35%
HOW WILL YOUR COMPANY’S 2007 IT SPENDINGCOMPARE WITH THIS YEAR?
HOW WILL YOUR COMPANY’S 2007 COLLABORATION TECHNOLOGY SPENDING
COMPARE WITH THIS YEAR?
48%HIGHER
5%
38%
10%DON’T KNOW/
CAN’T ANSWER
LOWER
FLAT
RETAILERS 2006 MANUFACTURERS 2006
42%HIGHER
8%LOWER
39%FLAT
11%DON’T KNOW/
CAN’T ANSWER
RETAILERS 2006 MANUFACTURERS 2006
30%FLAT
HIGHER
47%
22%DON’T KNOW/
CAN’T ANSWER
1% LOWER
46%HIGHER
13%DON’T KNOW/
CAN’T ANSWER
36%FLAT
6%LOWER
SS-p6-7.rev2 10/25/06 10:01 AM Page 5

SS8 | SHARED STRATEGY STUDY | NOVEMBER 2006
S H A R E D S T R A T E G Y S T U D Y 2 0 0 6
THE STATE OF COLLABORATION
IN AGREEMENTDemand planning and forecasting top thelist for value. This category topped the list inoverall ROI ranking (across both retailersand manufacturers) for the second year in arow. Retailer adoption of demand planningand forecasting tools has increased over lastyear, and CPFR adoption remains strong.Demand planning and forecasting has beendeployed by manufacturers much more thanretailers because retailers have historicallynot paid much attention to demandforecasting. Recently, however, retailers arestarting to pay attention because they areseeing the substantial benefits their suppliersare realizing. But, there is a difference in howit is being implemented, which is more like atypical supplier implementation. In the past,retail merchandise planners forecasted fortheir product category, and now retailers aresetting up independent demand forecastinggroups that are responsible for the overalldemand forecast and it becomes the inputthe merchandisers use when they start theirplanning process.
STILL A BARRIERDespite the adoption rates for both demandplanning and CPFR, data sharing is still abarrier to success because granularity islacking. Few retailers share or storeneighborhood level POS data with theirtrading partners, and few manufacturershave a place to put that data, even if theyget it. This is a key problem formanufacturers as retailers are trying to getmore granular in how they forecast andultimately in how they plan — down to thestore/sku level. Retailers have the necessarydata but they are not sharing it, so it isparticularly challenging for manufacturersto keep up without the same level of detail.
The Demand Signal Repository is gainingin popularity. Now that more retailers aresharing some level of data, suppliers can nolonger leverage the data insights with silo-ed retail-specific databases. Thus the needfor a centralized repository to gather datafrom all retailer trading partners andnormalize and cleanse it once, then takeaggregated slices for use by variousprocesses throughout the enterprise.
Demand Planning and ForecastingCATEGORY TOPS LIST IN OVERALL ROI RANKING WITH BOTH
RETAILERS AND MANUFACTURERS FOR SECOND YEAR
DemandPlaning &Forecasting EVALUATING PILOTING
INITIALROLLOUT
FULLYDEPLOYED UPGRADING NO PLANS
DON’TKNOW/CAN’T
ANSWER
RETAILERS2006
24% 6% 19% 27% 6% 6% 11%
MFRS.2006
8% 5% 15% 54% 14% 1% 4%
CPFR EVALUATING PILOTINGINITIAL
ROLLOUTFULLY
DEPLOYED UPGRADING NO PLANS
DON’TKNOW/CAN’T
ANSWER
RETAILERS2006
22% 8% 10% 22% 5% 18% 17%
MFRS.2006
17% 10% 21% 23% 5% 15% 10%
EVALUATING PILOTINGINITIAL
ROLLOUTFULLY
DEPLOYED UPGRADING NO PLANS
DON’TKNOW/CAN’T
ANSWER
RETAILERS2006
28% 8% 10% 13% 5% 18% 19%
MFRS.2006
25% 8% 15% 19% 6% 15% 12%
Chain-level POSNO SHARING/LIMITED
SHARINGREGULAR/EXTENSIVE
SHARINGDON’T KNOW/CAN’T
ANSWER
RETAILERS 200653% 27% 21%
MANUFACTURERS2006
44% 49% 7%
Store-level or neighborhood-levelPOS
NO SHARING/LIMITEDSHARING
REGULAR/EXTENSIVESHARING
DON’T KNOW/CAN’TANSWER
RETAILERS 200663% 19% 18%
MANUFACTURERS2006
56% 35% 9%
AT WHAT STAGE ARE YOU IN THE ADOPTION OF THESE APPLICATIONS?
HOW WOULD YOU DESCRIBE THE DATA SHARING AND USE BETWEENYOU AND YOUR TRADING PARTNER FOR THESE KEY TYPES OF DATA?
At what stage are you in adoption of a demand signal repository?
Use of downstreamdemand-datain demandplanning & forecasting (% using)
RETAILERS 200655%
MFRS 200668%
SS-p8.rev2.qxd 10/25/06 10:03 AM Page 4
SS10 | SHARED STRATEGY STUDY | NOVEMBER 2006
S H A R E D S T R A T E G Y S T U D Y 2 0 0 6
THE STATE OF COLLABORATION
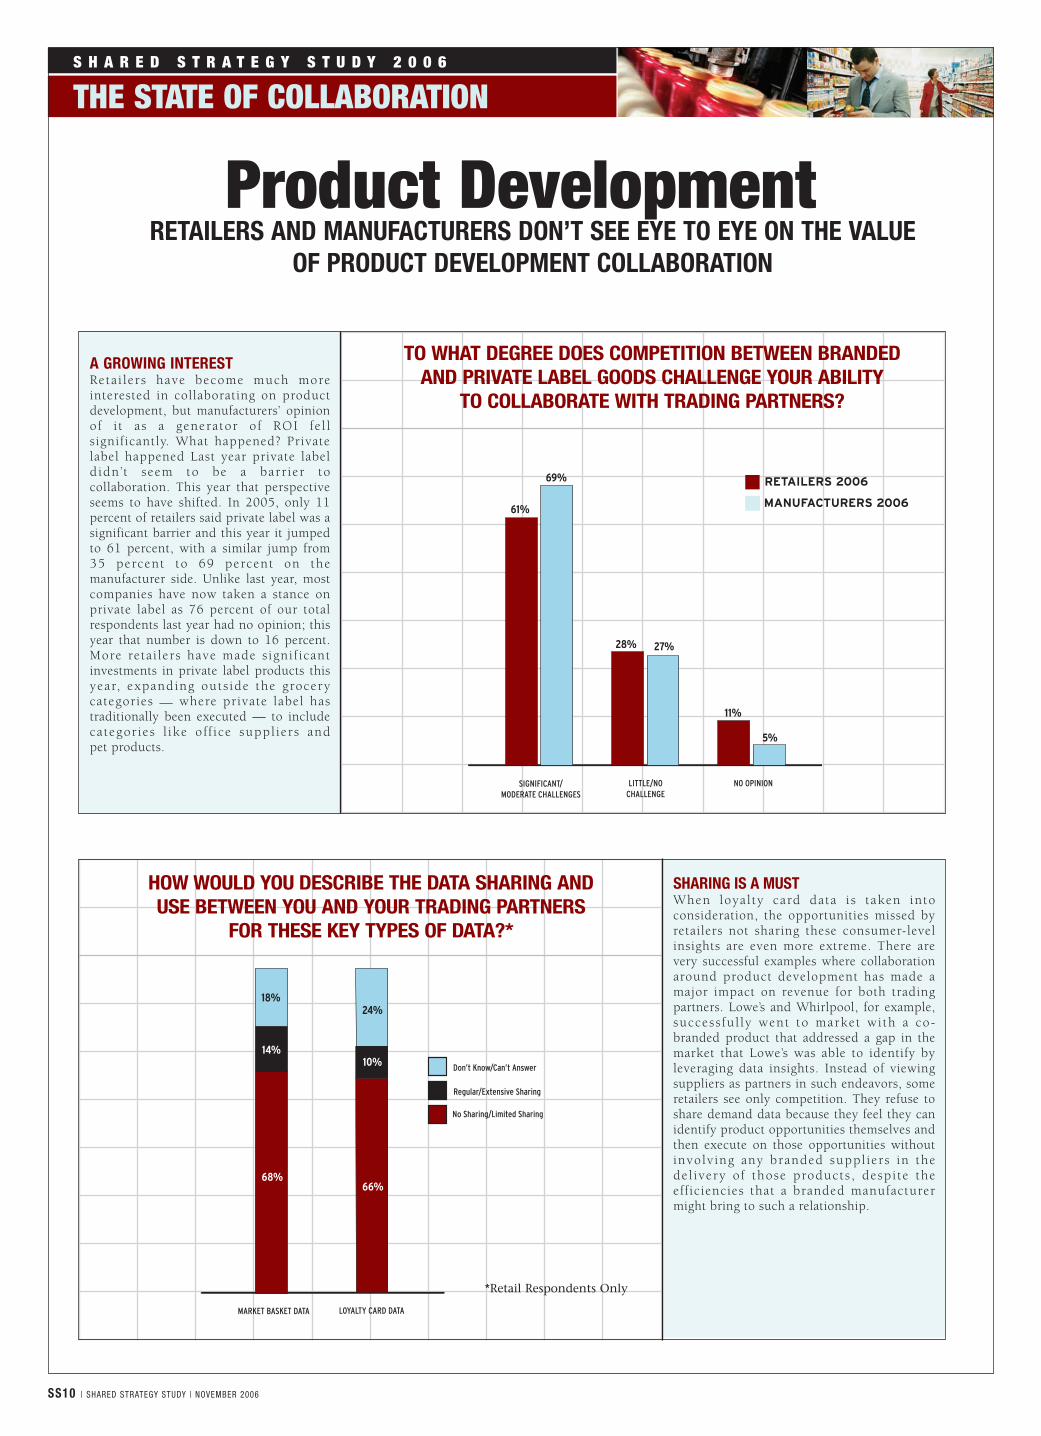
A GROWING INTERESTReta i lers have become much moreinterested in collaborating on productdevelopment, but manufacturers’ opinionof i t as a generator o f ROI fe l lsignificantly. What happened? Privatelabel happened Last year private labeldidn ’t seem to be a barr ier tocollaboration. This year that perspectiveseems to have shifted. In 2005, only 11percent of retailers said private label was asignificant barrier and this year it jumpedto 61 percent, with a similar jump from35 percent to 69 percent on themanufacturer side. Unlike last year, mostcompanies have now taken a stance onprivate label as 76 percent of our totalrespondents last year had no opinion; thisyear that number is down to 16 percent.More reta i lers have made s igni f icantinvestments in private label products thisyear, expanding outs ide the grocerycategories — where private label hastraditionally been executed — to includecategor ies l ike off ice suppl iers and pet products.
SHARING IS A MUSTWhen loya l ty card data i s taken intoconsideration, the opportunities missed byretailers not sharing these consumer-levelinsights are even more extreme. There arevery successful examples where collaborationaround product development has made amajor impact on revenue for both tradingpartners. Lowe’s and Whirlpool, for example,success fu l ly went to market wi th a co-branded product that addressed a gap in themarket that Lowe’s was able to identify byleveraging data insights. Instead of viewingsuppliers as partners in such endeavors, someretailers see only competition. They refuse toshare demand data because they feel they canidentify product opportunities themselves andthen execute on those opportunities withoutinvolv ing any branded suppl iers in thedel ivery of those products , despi te theefficiencies that a branded manufacturermight bring to such a relationship.
Product DevelopmentRETAILERS AND MANUFACTURERS DON’T SEE EYE TO EYE ON THE VALUE
OF PRODUCT DEVELOPMENT COLLABORATION
MARKET BASKET DATA LOYALTY CARD DATA
68%66%
10%14%
18%24%
No Sharing/Limited Sharing
Regular/Extensive Sharing
Don’t Know/Can’t Answer
TO WHAT DEGREE DOES COMPETITION BETWEEN BRANDED AND PRIVATE LABEL GOODS CHALLENGE YOUR ABILITY
TO COLLABORATE WITH TRADING PARTNERS?
HOW WOULD YOU DESCRIBE THE DATA SHARING AND USE BETWEEN YOU AND YOUR TRADING PARTNERS
FOR THESE KEY TYPES OF DATA?*
RETAILERS 2006
MANUFACTURERS 2006
SIGNIFICANT/MODERATE CHALLENGES
61%
LITTLE/NOCHALLENGE
NO OPINION
28% 27%
11%
5%
69%
*Retail Respondents Only
SS-p10.qxd.REV2 10/25/06 10:04 AM Page 4

S H A R E D S T R A T E G Y S T U D Y 2 0 0 6
CUSTOMIZED RESEARCH
SS12 | SHARED STRATEGIES | NOVEMBER 2006
CUSTOMER-FACING INITIATIVES HAVE ALWAYS BEENa key focus of the consumer goods (CG) industry,but lately, that focus has shifted considerably to theend consumer. Consumers now shop in manydifferent channels to fulfill their needs, and theproduct assortment available in any given retailoutlet impacts how and what they buy. CG suppliersand retailers are both struggling to make anemotional connection with the consumer and areattempting to understand individual consumerneeds and then adapt to meet those needs.
This is particularly challenging in a world wheretraditional outreach vehicles, like television ads, areno longer as effective, and many companies areturning to creative marketing and granularmerchandising strategies to target specific shoppersin specific stores. This month, we have partneredwith Infosys to dig a little further into theseconsumer-level merchandising and categorymanagement strategies.
THE COMPANIESOur research involved a wide range of CG companies— 70 percent of which are either category captainsor regularly provide category level insights to themajority of their retail trading partners. Showing thechanging priorities, almost half of our respondents’category management efforts are focused on assort-ments, compared to only 10 percent focusing onpromotions and only 7 percent on pricing.
While Figure 1 shows that most merchandisingand category management activities occur at the keyaccount level (74 percent) or the channel level (54percent), there are retailers and suppliers who areattempting to perform these activities at a moregranular level.
Only 26 percent of companies are organized toalso merchandise at the demographically alignedstore cluster level, while almost twice as many (49percent) are organized at the customer specific storecluster level.
We expect this trend in more granular consumerfocused merchandising and channel management tocontinue as barriers are removed.
SEVERAL BARRIERSThose barriers exist in several different areas. Thefirst challenge involves creating the category insightsthemselves that can then lead to more granular mer-chandising. Those insights rely on consumer andcategory level data, which is often not available ornot leveraged properly. In fact, data issues were theprimary challenge cited by our respondents.Timeliness of data was cited by 27 percent of ourrespondents as the biggest challenge in creatinginsights, while 22 percent claimed that not enoughretailers share the data to begin with. Another 16 per-cent claimed data cleanliness was the problem.
Data sharing is certainly on the rise, with Wal-Mart leading the way by providing tools and data onRetail Link which is available in 15 minuteincrements. Other retailers are following suit byproviding point of sale (POS) data to their largersuppliers. However, the challenge on the supplierside is gathering, cleansing and normalizing thehuge volume of POS data and then turning that data
Consumer-Centric Merchandising SUPPLIERS AND RETAILERS ARE BOTH STRUGGLING TO MAKE EMOTIONAL CONNECTION WITH CONSUMER
HOW ARE MERCHANDISING/CATEGORY MANAGEMENT ACTIVITIES ORGANIZED?
WHAT ARE THE CHALLENGES TO EFFECTIVELY EXECUTING PLANS BASED ON GRANULAR INSIGHTS
AT CUSTOMER SPECIFIC STORE CLUSTERS?
CUSTOMERSPECIFIC STORE
CLUSTERS
DEMOGRAPHICALLYALIGNED
STORE CLUSTERS
CHANNELS KEYACCOUNTS
GEOGRAPHY
0%
49%
26%
54%
74%
31%
OTHER
SUPPLY CHAIN CAN NOT EXECUTE
BASED ONGRANULAR LEVEL
INSIGHTS
SUPPLY COSTSWOULD BE
HIGHER THANBENEFITS
THERE ARE NOPROCESSESIN PLACE TO
SUPPORT EXECUTIONAT A STORE/STORE
CLUSTER LEVEL
TOO MUCHOF A CULTURAL
CHANGE
ORGANIZATION STRUCTURAL
CHANGES WILL BEREQUIRED
EFFECTIVE RETAILEXECUTION
IS A CHALLENGE
25%
LACK OF TIMELYVISIBILITY OF
PRODUCT MOVEMENTTO THE RETAIL SHELF
OTHER
6%
31%
53%
22%
31%
25%
28%
FIGURE 1
FIGURE 2
SS-p12-13rev.qxd 10/30/06 11:31 AM Page 12

BY KARA ROMANOW
SHARED STRATEGIES | NOVEMBER 2006 | SS13
into insights which can be acted upon. Our research showed that POS data, cited by 79percent of respondents, is the data type most used to drive insights to help improvemerchandising at retail. Consumer demographic data, syndicated data and loyalty data werenext at 56 percent, 51 percent and 51 percent respectively.
If every retailer provides data, but in a proprietary technology or format, it becomes verydifficult to manage the data and almost impossible to get any cross-retailer insights. Someretailers, like CVS and Walgreens, have recognized this and are pursuing an exchange model,but standards may be required for data sharing to become ubiquitous.
In the meantime, individual category managers will continue to use the data they haveaccess to for account management, and leaders will be the first to figure out how to leveragethe data for key initiatives like consumer level merchandising.
MORE CHALLENGESIn addition to the data challenges, Figure 2 shows the operational and cultural challenges thatprevent successful execution of plans based on granular level category insights at customerspecific store clusters. The biggest challenge by far is effective retail execution, cited by 53 per-cent of our respondents. This is the one area that will require true collaboration between retailand supplier trading partners, particularly to avoid the finger-pointing that often occurs whensomething goes wrong. Trading partners must work together to attain their common goal:Having the product that the consumer wants on the shelf when the consumer wants it in orderto increase sales.
The other challenges were grouped closer together, with 31 percent naming lack ofbusiness processes, 31 percent naming lack of timely visibility into product movement to theshelf, followed by high supply costs at 28 percent, inability of supply chain to execute at amore granular level at 25 percent, culture change challenges at 25 percent, with organizationchanges coming in at 22 percent. Many of these challenges are usually related and often haveinter-dependencies, like culture changes and organizational changes, or inability of supplychain to execute with lack of business processes to support more granular activities.
BOTTOM LINEBut the bottom line, as displayed in Figure 3, is the need for retailers and suppliers to figureout how to work together more effectively. When asked what the most important factor to asuccessful working relationship was, 36 percent of those surveyed cited collaborative businessplanning. Suppliers want to engage with retailers up front to initiate and execute on strategiesthat, while initially difficult and complex to manage, have proven to be very successful inincreasing sales and connecting with specific consumers. Store or store cluster merchandisingis one such opportunity whose time has come. ss
For a more in-depth look into this research about Consumer-CentricMerchandising visit: www.consumergoods.com and download theentire survey.
Additional topics surveyed include:
4Retail Perspective 4Sources of Data
4Media Outlets 4Outsourced Functions
4Insights into new product development
SPONSORED BY:
In today’s competitive marketplace, the fight for shoppers hasintensified. The blurring of channels, proliferation of products, changingconsumer demographic profiles, declining shopper trips and the Wal-Martphenomenon have all contributed to the challenges faced by both consumergoods (CG) companies and retailers. Success in this environment requires CGcompanies and retailers to further intensify their focus on consumers bytransforming their category management processes. This calls for theestablishment of new processes to enable collaboration with trading partnersand deployment of appropriate tools and technologies to effectively managedata and leverage insights. This enables successfully serving shoppersthrough strong execution capabilities.
By working with leading retail and CG companies, Infosys has found that managing a multitude of data sources to obtain meaningfulcustomer/shopper insights is challenging. However, leveragingcustomer/shopper insights to effect change in the merchandising andmarketing mix is as big a challenge.
Based on our learnings and experience, we have developed best practicesthat can be used to effectively enable consumer-centric merchandising.These insights have helped our customers achieve significant benefits.
BEST PRACTICES IN CONSUMER-CENTRIC MERCHANDISINGOptimize merchandising
● Understand the role a product and its category plays in a consumer context and leverage this for macro space planning
● Leverage customer segmentation and store clustering to better understand consumer buying behavior
● Optimize space and assortment plans synchronously
Focus on execution● Leverage technologies like RFID and mobile devices to improve retail
execution to achieve a reduction in out-of-stocks and better customer service
● Collaborate with trading partners in consumer-centric merchandising initiatives
Establish the right data infrastructure● Develop an enterprise data strategy to help determine the information
needs and existing gaps and avoid implementing piecemeal initiatives● Focus on establishing the right processes and tools to help both
maintain and mine the data (structured and unstructured) for consumer insights
● Do not wait for the ultimate solution to be built; leverage skilled resources in the interim to derive insights from several data sources
Manage the implementation● Develop future state processes before deciding which tools/solutions
will support them● Plan for significant change management initiatives
— BY KISHOR GUMMARAJU, HEAD, CPG SOLUTIONS INFOSYS
BEST PRACTICES
WHAT DO YOU THINK WILL BE THE MOST IMPORTANTASPECTS TO FOCUS ON TO HELP YOU WORK BETTER
WITH YOUR RETAIL PARTNERS?
CATEGORY INSIGHTSFOCUSED ON THE
CUSTOMER’S CONTEXT
OPEN SHARINGOF DATA
IMPROVED SUPPLY CHAIN
EXECUTION
COLLABORATIONBUSINESS PLANNING
MORE REGULARINTERACTION
0%
22%
11%
36%
6%
DATA CLEANUP
22%
3%
OTHER
FIGURE 3
& Category Management
SS-p12-13rev.qxd 10/30/06 12:20 PM Page 13

SS14 | SHARED STRATEGY STUDY | NOVEMBER 2006
S H A R E D S T R A T E G Y S T U D Y 2 0 0 6
THE STATE OF COLLABORATION
UNIQUE ASSORTMENTSWith the concept of customer centrici tyincreasing in popularity, retailers have beenfocused on providing unique assortments,ei ther by store or tai lored to localdemographics. While only 10 percent ofretailers are executing these assortments at thestore level, 40 percent are assorting regionallyor by store cluster. Unfortunately, only 17percent of manufacturers can provide regionalor store cluster assortments; 42 percent areproviding assortments at the retail chain level,and 32 percent cannot even provide that levelof granularity. This is proving to be a majordisconnect as more retailers plan on moving toa more granular level in their assortmentplanning and most manufacturers cannotexecute at that level. Even for retailers, whenstart ing down a path of more granularplanning, unique assortments by item by storebecome impossible to manage, even withsophisticated technology. Therefore, retailershave started to select specif ic productcategories, which will benefit from the moregranular assortments. Picking these categoriesaccording to consumer attr ibute preference has become a challenge from a planning perspective.
GRANULARITY INCREASEBoth manufacturers and retailers anticipate anincrease in the granularity of the assortment, 58percent and 64 percent respectively, but there isa difference in opinion on who wil l beresponsible for the execution. Providing uniquecase packs to individual stores will increasesupply chain costs and decrease supply chainefficiency, and 62 percent of manufacturershave no illusions that they will be bearing thebrunt of these cost increases. Somemanufacturers (19 percent) may be able to relyon third party logistics providers for packingand shipping the more granular assortments,but retailers are a little more uncertain of howto approach the delivery. More than one-third(38 percent) agree that the manufacturers willbear the cost, but 28 percent feel they will beresponsible and a full 27 percent aren’t sureyet. While this move toward more granularassortments by store is definitely on the rise,the quest ion of who wil l execute on theconsumer centric vis ion is st i l l verymuch unanswered.
Assortment PlanningRETAILERS GIVE ASSORTMENT PLANNING COLLABORATION
BIGGEST JUMP IN RANKING FOR ROI VALUE
ONE SIZE FITS ALL A LIMITED SET OF CHOICES
RETAILER-SPECIFICASSORTMENT
REGIONAL ORSTORE CLUSTERS
UNIQUEASSORTMENTS
BY STORE
6%
DON’T KNOW/CAN’T ANSWER
5%
1%
4%
9%10%
17%
40%42%
24%
27%
16%
RETAILER MANUFACTURER 3PL OTHER
28%
DON’T KNOW/CAN’T ANSWER
2%
38%
62%
8%
19%
0%3%
27%
14%
HOW GRANULAR IS YOUR PRODUCT ASSORTMENT TODAY?
WHO WILL BE RESPONSIBLE FOR PACKING AND SHIPPING MORE GRANULAR ASSORTMENTS?
RETAILERS 2006 MANUFACTURERS 2006
RETAILERS 2006 MANUFACTURERS 2006
SS-p14.qxd.REV2 10/25/06 10:05 AM Page 4

SS16 | SHARED STRATEGY STUDY | NOVEMBER 2006
S H A R E D S T R A T E G Y S T U D Y 2 0 0 6
THE STATE OF COLLABORATION
ADOPTION RISESTrade promotion management (TPM)technology is f inal ly being adopted bymanufacturers as last year’s investments arebecoming implemented, with a 12 percentincrease in fully deployed TPM applications.Early adopters are even planning upgrades, as11 percent of this year’s respondents report.There is a wide range, however, in the TPMcapabilities that are being implemented, withsome companies implementing basic deductionmanagement and others doing sophisticatedpromotion optimization and planning. It is thiscrawl-walk-run mentality that has finallymotivated companies sitting on the sidelines toadopt TPM technology, as they realize they canimplement incremental ly and addsophistication as they progress. While thenumber of those companies with no plans toimplement has certainly decreased 8 percent,there are still 14 percent of companies who arespending 20 percent of their revenues on tradefunds with no formal application to help themmanage and ensure efficiency of that spend. It’stime to get off the fence.
TIED TO TPMSales Force Automation (SFA) deployments formanufacturers are slightly behind TPM, withonly 23 percent fully deployed, a slight (5percent) increase from last year. However, thereis some movement from 2005 as we see 8percent fewer companies with no plans, and 15percent fewer evaluations, as they have movedto pilot stage or initial rollout over the year. Inthe consumer goods industry, SFA tends to betightly tied to TPM, as the means to get thenewly optimized promotion plans into thehands of the sales force. A parallel can bedrawn to the new interest in space planning onthe retail side because of the focus on moregranular assortments. Once the planning hasbeen done, the plan needs to be executed on —the last mile if you will — and the appropriatetechnology should then be implemented.
Trade Promotion ManagementWITH MORE IMPLEMENTATIONS AND UPGRADES PLANNED,
MANUFACTURERS BELIEVE IN THE VALUE OF TPM
EVALUATING PILOTING INITIAL ROLLOUT FULLY DEPLOYED UPGRADING
23%
26%
4%
6%
14%
22%
11%
5%
32%
20%
7%
4%
7%
11%
NO PLANS DON’T KNOW/CAN’T ANSWER
EVALUATING PILOTING INITIAL ROLLOUT FULLY DEPLOYED UPGRADING
26%
14%
19%
8%
23%
18%
7%7%
NO PLANS DON’T KNOW/CAN’T ANSWER
11%
16%
10%
7%
26%
8%
AT WHAT STAGE ARE YOU IN THE ADOPTION OF TRADE PROMOTION MANAGEMENT APPLICATIONS?
AT WHAT STAGE ARE YOU IN THE ADOPTIONOF SALES FORCE AUTOMATION APPLICATIONS?
MANUFACTURERS 2005 MANUFACTURERS 2006
MANUFACTURERS 2005 MANUFACTURERS 2006
SS-p16.qxd.REV2 10/25/06 10:09 AM Page 4

S H A R E D S T R A T E G Y S T U D Y 2 0 0 6
THE STATE OF COLLABORATION
BIG JUMPMarketing saw one of the biggest jumps inactivity from 2005 to 2006, with 15 percent ofretailers and 17 percent of manufacturersstating that they collaborated on marketingactivities in 2005 versus 47 percent of retailersand 42 percent of manufacturers in 2006.However, the collaboration does not extend todata sharing. Retailers don’t share the data thatis most valuable in marketing activities withalmost half of retailers sharing no loyalty carddata or market basket data and only 20 percentdoing regular sharing of consumerdemographic data. The loyalty and marketbasket data is necessary for segmenting themarket and designing effective communicationsand promotions. Manufacturers have their ownsources of data to counterbalance what retailershave, but as with any supply chaincollaboration, without one version of the truthas a start ing point, the mutual value ofcollaborative marketing will remain limited.
GREATER POTENTIALA lot of potential value remains untapped inmarketing collaboration. Trading partners arenot only not sharing a lot of data that wouldenable marketing activities but they’re notusing it for their own internal marketingstrategies. As the long-t ime owners ofconsumer-level demand data, retailers shouldbe the most proficient at using that data inmarketing decisions. However, due to thecomplexity of the analysis and the challengesinvolved in incorporating any insights that areteased out of loyalty or market basket data,most of those insights have remained lockedinside retailers’ customer data warehouses.Until data use improves internally, both forretailers and manufacturers, there will be nofoundation in place for sharing that data as partof a collaborative process. At only 23 percentfor retailers and 26 percent for manufacturers,there is a lot of room for improvement ascompanies look to leverage downstream datafor consumer advertising and marketing.
Marketing CollaborationCOLLABORATIVE MARKETING ACTIVITY JUMPS FROM 2005 TO 2006,
BUT PERCEIVED ROI HAS SHIFTED
LOYALTY CARD DATAMARKET BASKET DATA CONSUMERDEMOGRAPHICS
49%50%
35%
25%
16%19%
14%
18%
10% 20%
20%24%
No Sharing
Limited Sharing
Regular/Extensive Sharing
Don’t Know/Can’t Answer
CONSUMER ADVERTISINGAND MARKETING STRATEGIES
23%26%
HOW WOULD YOU DESCRIBE THE DATA SHARING PROCESS BETWEENYOU AND YOUR TRADING PARTNERS FOR THESE KEY TYPES OF DATA?*
FOR WHICH ACTIVITIES ARE YOU USING DOWNSTREAM DEMAND DATA?
(% ANSWERED YES)
RETAILERS 2006 MANUFACTURERS 2006
SHARED STRATEGY STUDY | NOVEMBER 2006 | SS17
*Retailer Response Only
SS-p17.qxp.REV2 10/25/06 10:10 AM Page 4

SS18 | SHARED STRATEGY STUDY | NOVEMBER 2006
S H A R E D S T R A T E G Y S T U D Y 2 0 0 6
THE STATE OF COLLABORATION
GDS UPTAKECritical mass for global data synchronization(GDS) is getting a little closer, and there isfinally an uptake in participation for retailerswho have been sitting on the sidelines whiledemanding that their suppliers participate. Thepercentage of retailers evaluating GDS has risen6 percent from 15 percent to 21 percent, andthe percentage piloting or in initial rollout hasincreased 6 percent from 12 percent to 18percent. The increased retail involvement inGDS is a direct result of the majority ofmanufacturers (59 percent) who are either fullydeployed, in initial rollout or piloting. Withalmost one-third of manufacturers ful ly-deployed, the industry is nearing critical masswhere it makes it worthwhile for retailers toinvest and start to realize the benefits ofsynchronized data. GDS is also beingrecognized as a foundational requirement forRFID and other collaborative supply chaininitiatives where data sharing is a key element.
MORE TO DOMany retailers don’t feel that there is datasharing happening between trading partners,but Master Data Management (MDM) can beconsidered a private closed-loop version ofGDS where i tem master data is sharedinternally. The implementation effort is similar,and if GDS efforts are stalled because thingsaren’t in order internally, MDM is a goodindicator of how much work is yet to be done.And our survey shows that there is still muchwork to be done, particularly on the retail sidewhere only 18 percent are fully deployed.Twenty-three percent of retailers are evaluatingMDM, but they are only at the initial stages of amulti-year project and won’t see benefits forsome time. Since MDM and GDS are so closelyrelated, it is not a surprise that 50 percent ofmanufacturers are either fully deployed or ininitial rollout with MDM, since it is often thefoundational element that facilitates GDS.Unfortunately, however, MDM needs to beimplemented before there will be a significantuptick in GDS; there is no value in connectingto share data if you are only sharing garbage.
Data SynchronizationMANUFACTURERS ARE MAKING HEADWAY IN DATA SYNC ADOPTION
EVALUATING PILOTING INITIAL ROLLOUT FULLY DEPLOYED UPGRADING
21%
NO PLANS DON’T KNOW/CAN’T ANSWER
12%
15%
18%
12%
5%
36%
1%3%
28%
9%
22%
9%9%
EVALUATING PILOTING INITIAL ROLLOUT FULLY DEPLOYED UPGRADING NO PLANS DON’T KNOW/CAN’T ANSWER
23%
17%
13%
19%
8%
12%
8%
10%
29%
18%
21%
12%
4%
6%
AT WHAT STAGE ARE YOU IN THE ADOPTION OF GLOBAL DATA SYNCHRONIZATION?
AT WHAT STAGE ARE YOU IN ADOPTIONOF MASTER DATA MANAGEMENT?
RETAILERS 2006 MANUFACTURERS 2006
RETAILERS 2006 MANUFACTURERS 2006
SS-p18.qxp.REV2 10/25/06 10:27 AM Page 4

Despite what you might have readabout Americans’ bulging waistlines,the fact is that more Americans aremaking healthful food choices. Needproof? Consider all of the grocerystores and big box megastores that are
expanding their selections of natural and organicproducts. No longer a niche market, health food isdefinitely here to stay.
For Tree of Life, a division of $2.3 billion (U.S.),Netherlands-based Royal Wessanen NV, it’s a trendthat has the sweet smell of success. Tree of Life, amulti-million dollar enterprise, owns a dozendistribution centers (DC) across the United States.and supplies the United States, Caribbean andCanadian food retailers with the products, servicesand marketing edge that adds to their bottom line.
Supporting Tree of Life’s efforts to help theircustomers turn this trend into transactions aresolutions from JDA Software. The company usesAdvanced Warehouse Replenishment (AWR), SpacePlanning by Intactix, plus Manugistics’ NetWORKSfor Inbound Transportation and NetWORKS Routingfor Outbound Transportation.
THE ART OF REPLENISHMENTTree of Life’s homegrown AS/400-driven hostsystem was a sound platform for sales order entryand warehouse management. But as the companygrew, the system lacked support for a dynamicbuying process that removed the guesswork fromproduct procurement.
“Before AWR, we didn’t have the ability to enterplans, bookings or automatically adjust for leadtime changes. Our procurement process had a verynarrow view of what inventory was needed andwhen,” says Johnson. “There was a lot more art thanscience behind how we used to buy. With AWR, wecan now apply a lot more of the science to ourbuying processes.”
In addit ion to improved f i l l rates andreductions in inventory, Johnson points outincreased sales, improved forecast accuracy,decreased overstocks, better freight loads andimproved productivity as benefits.
GREATER FREIGHT EFFICIENCIESAWR also supported the company’s transition froma regional to a national procurement structure 18months ago.
“As a natural and specialty food distributioncompany, we may buy in cases, by the pallet layer orby the full pallet of product. We may have to buyproduct from eight vendors or more to fill up atruck,” Johnson explains. “Recently, we’ve streamlinedthe process so that fewer buyers are buying productfrom one region.”
According to Johnson the centralized buying andAWR have already resulted in improved inboundfreight efficiencies, now at 75 percent of capacity, upfrom the 55 percent its inbound trucks were runningjust a year ago.
ON TIME, ON BUDGETTo manage the many inbound trucks headed for theDCs, Tree of Life taps the functionality of JDA’sTransportation by Manugistics for inboundtransportation. According to Ken Kelly, manager ofinbound load planning, its objective is simple:Determine the most efficient way to move productsbased on carriers, rates and delivery times.
“In the first eight months of 2006 more than25,000 orders came through our DCs,” Kelly says.
“With that level of volume we need to find thelowest-cost carrier, but it’s also a balancing act.We’re trying to optimize how we move productwhile living up to our service commitmentbased on those multi-stops.”
“With JDA’s Transportation by Manugisticssolution, our planners can tap into a repository ofrate information to analyze the cheapest way tomove product,” Kelly added. “That alone is atremendous benefit to our business model and thebottom line.”
PATH TO ISO CERTIFICATION Six years after Tree of Life implemented theapplications, the company is now positioned to takeits success to the next level.
“For two years, we’ve focused on putting ‘the rightpeople, technology and processes’ into place,” explainsJohnson. “All three of these are critical for our ISO9001 and 14001 certification and JDA plays animportant role in making this happen.”
Johnson also believes that the solutions are important contributors to their businesstransformation.
“Over the past few years we’ve transformed ourstrategy and our business model,” Johnson says. “Atthe same time we’ve become very self-sufficientwith the technology and, not coincidentally, verysuccessful in achieving our business goals. Certainlywe’re delighted with these accomplishments andrecognize we’ve gotten to this point with the help ofJDA and Manugistics.” ■
S H A R E D S T R A T E G Y S T U D Y 2 0 0 6
THE STATE OF COLLABORATION
Seizing OpportunityTREE OF LIFE INCREASES FILL RATES AND REDUCES INVENTORY
AS DEMAND FOR HEALTHY FOOD GROWS
SHARED STRATEGY STUDY | NOVEMBER 2006 | SS19
COTT MOVES TODEMAND PLANNINGCott Corporation, one of the world’s largestretailer brand beverages suppliers, success-fully completed the implementation of a new demand planning system for its NorthAmerican supply chain, a key initiative in thecompany’s cost reduction and efficiency goals.Earlier in the year Cott selected ManugisticsInc., which was recently acquired by JDASoftware Group, to supply an advanced, web-enabled demand and supply planning system to help maximize Cott’s NorthAmerican supply chain performance.
The demand planning portion of the systemwas launched live on June 29, 2006, aheadof schedule. Progress on implementing thesupply planning portion is on schedule withall of Cott’s North American plants expectedto be complete by the end of the year. “Theprogress being made in our North Americansupply chain is a critical component of ourplan to aggressively reduce costs and improveservice to our customers,” says Brent Willis,Cott president and CEO. “We expect this system to help improve our operating marginswith reduced waste and better visibility andcontrol over our entire supply chain.”
“The demand and supply planning solutionwe are delivering to Cott will enhancedecision-making on product demand,availability and shipment deliveries,” saysRonald Kubera, JDA’s senior vice president of supply chain. “Customers in today’s fast-paced retail environment need to know thattheir suppliers can meet their demands. Using our supply chain solutions will enhanceand strengthen Cott’s ability to respond tothose demands.” ●
5Tree of Life’s proprietaryproducts include both natural and organicfoods and supplements as well as a selection of the finestimported, ethnic and gourmet specialty food products.
SS-p19.qxp 10/26/06 2:17 PM Page 4

SS20 | SHARED STRATEGIES | NOVEMBER 2006
S H A R E D S T R A T E G Y S T U D Y 2 0 0 6
THE STATE OF COLLABORATION
SLIGHT HEADWAYRetailers and manufacturers both have madeslight headway in the adoption of RFID, butoverall progress is still nowhere near the criticalmass required to move RFID fromexperimentation to widespread adoption. Thepercent of participants with no plans decreasedslightly from 2005 to 2006 for both retailersand manufacturers, and those evaluating RFIDcorrespondingly increased. Overal l ,manufacturer adoption is more aggressive thantheir retai l counterparts, but with only 5percent of manufacturer participants and 3percent of retail with fully deployed RFIDimplementations, this technology still has a longway to go. The good news, however, is that theindustry is now looking at RFID in a morestrategic l ight, beyond the original retai lmandates. Suppliers are considering initiativeslike electronic proof of delivery or promotiontracking, and retailers are looking at targeteditem level tagging to focus on problematiccategories or products. Adoption has takenmuch longer than the initial hype would havesuggested, but the industry, as well as thetechnology itself, is making progress.
LACK OF SHARINGPartly because adoption is so low, RFID datasharing among trading partners is also low. Butthe correlation doesn’t hold across level ofadoption — many participants who indicatedthat they were rolling out or fully deployed onRFID did not share that data with tradingpartners. This is a perplexing contradiction —the whole point of RFID is to provide supplychain transparency so that retai lers andmanufacturers can work more closely togetherto prevent stock-outs. However, part of thechallenge lies in the infrastructure required tosupport this type of data sharing. As withglobal data synchronization, without theinfrastructure and discipline to internallysupport these new data types, it’s very difficultto share that data externally. In recognition ofthe challenge, trading partners are starting tolook at master data management, demandsignal repositories, global data sync and RFIDas pieces of the same problem.
Radio Frequency IdentificationRFID DATA IS THE LEAST SHARED AMONG RETAILERS AND MANUFACTURERS
EVALUATING PILOTING INITIAL ROLLOUT FULLY DEPLOYED UPGRADING
30%
NO PLANS DON’T KNOW/CAN’T ANSWER
20%
14%
18%
15%
41%
2%1%
5%3%
5%
22%
3%
23%
MANUFACTURERS 2006RETAILERS 2006
No Sharing
Any Sharing
Don’t Know/Can’t Answer
33%
56%
35%
46%
20%
10%
AT WHAT STAGE ARE YOU IN THE ADOPTION OF RFID?
HOW WOULD YOU DESCRIBE THE DATA SHARING PROCESS BETWEEN YOU AND YOUR TRADING PARTNERS FOR RFID DATA?
RETAILERS 2006 MANUFACTURERS 2006
SS-p20.qxd.REV2 10/25/06 10:29 AM Page 4
SS22 | SHARED STRATEGY STUDY | NOVEMBER 2006
S H A R E D S T R A T E G Y S T U D Y 2 0 0 6
THE STATE OF COLLABORATION
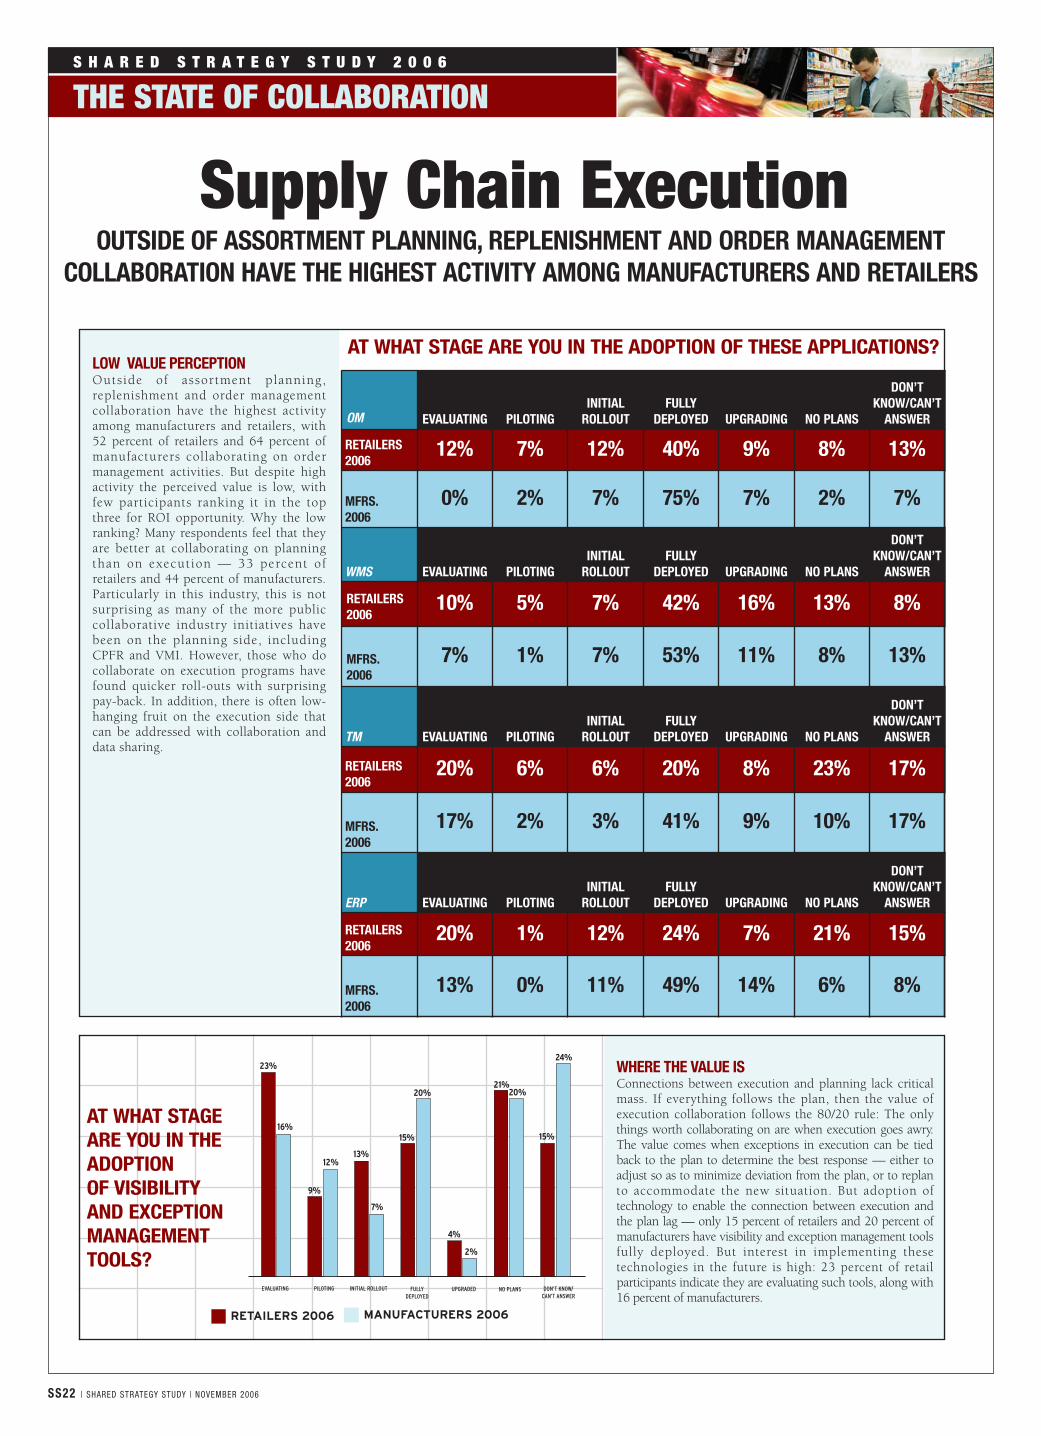
LOW VALUE PERCEPTIONOutside of assortment planning,replenishment and order managementcollaboration have the highest activityamong manufacturers and retailers, with52 percent of retailers and 64 percent ofmanufacturers collaborating on ordermanagement activities. But despite highactivity the perceived value is low, withfew participants ranking it in the topthree for ROI opportunity. Why the lowranking? Many respondents feel that theyare better at collaborating on planningthan on execution — 33 percent ofretailers and 44 percent of manufacturers.Particularly in this industry, this is notsurprising as many of the more publiccollaborative industry initiatives havebeen on the planning side, includingCPFR and VMI. However, those who docollaborate on execution programs havefound quicker roll-outs with surprisingpay-back. In addition, there is often low-hanging fruit on the execution side thatcan be addressed with collaboration anddata sharing.
Supply Chain ExecutionOUTSIDE OF ASSORTMENT PLANNING, REPLENISHMENT AND ORDER MANAGEMENT
COLLABORATION HAVE THE HIGHEST ACTIVITY AMONG MANUFACTURERS AND RETAILERS
AT WHAT STAGE ARE YOU IN THE ADOPTION OF THESE APPLICATIONS?
AT WHAT STAGEARE YOU IN THEADOPTION OF VISIBILITYAND EXCEPTIONMANAGEMENTTOOLS?
RETAILERS 2006 MANUFACTURERS 2006
OM EVALUATING PILOTINGINITIAL
ROLLOUTFULLY
DEPLOYED UPGRADING NO PLANS
DON’TKNOW/CAN’T
ANSWER
RETAILERS2006
12% 7% 12% 40% 9% 8% 13%
MFRS.2006
0% 2% 7% 75% 7% 2% 7%
WMS EVALUATING PILOTINGINITIAL
ROLLOUTFULLY
DEPLOYED UPGRADING NO PLANS
DON’TKNOW/CAN’T
ANSWER
RETAILERS2006
10% 5% 7% 42% 16% 13% 8%
MFRS.2006
7% 1% 7% 53% 11% 8% 13%
TM EVALUATING PILOTINGINITIAL
ROLLOUTFULLY
DEPLOYED UPGRADING NO PLANS
DON’TKNOW/CAN’T
ANSWER
RETAILERS2006
20% 6% 6% 20% 8% 23% 17%
MFRS.2006
17% 2% 3% 41% 9% 10% 17%
ERP EVALUATING PILOTINGINITIAL
ROLLOUTFULLY
DEPLOYED UPGRADING NO PLANS
DON’TKNOW/CAN’T
ANSWER
RETAILERS2006
20% 1% 12% 24% 7% 21% 15%
MFRS.2006
13% 0% 11% 49% 14% 6% 8%
EVALUATING
23%
PILOTING INITIAL ROLLOUT FULLYDEPLOYED
UPGRADED DON’T KNOW/CAN’T ANSWER
NO PLANS
16%
12%
9%
7%
13%
20%
15%
4%
2%
20%21%
24%
15%
WHERE THE VALUE ISConnections between execution and planning lack criticalmass. If everything follows the plan, then the value ofexecution collaboration follows the 80/20 rule: The onlythings worth collaborating on are when execution goes awry.The value comes when exceptions in execution can be tiedback to the plan to determine the best response — either toadjust so as to minimize deviation from the plan, or to replanto accommodate the new situation. But adoption oftechnology to enable the connection between execution andthe plan lag — only 15 percent of retailers and 20 percent ofmanufacturers have visibility and exception management toolsfully deployed. But interest in implementing thesetechnologies in the future is high: 23 percent of retailparticipants indicate they are evaluating such tools, along with16 percent of manufacturers.
SS-p22-23rev2.qxd 10/25/06 10:30 AM Page 4
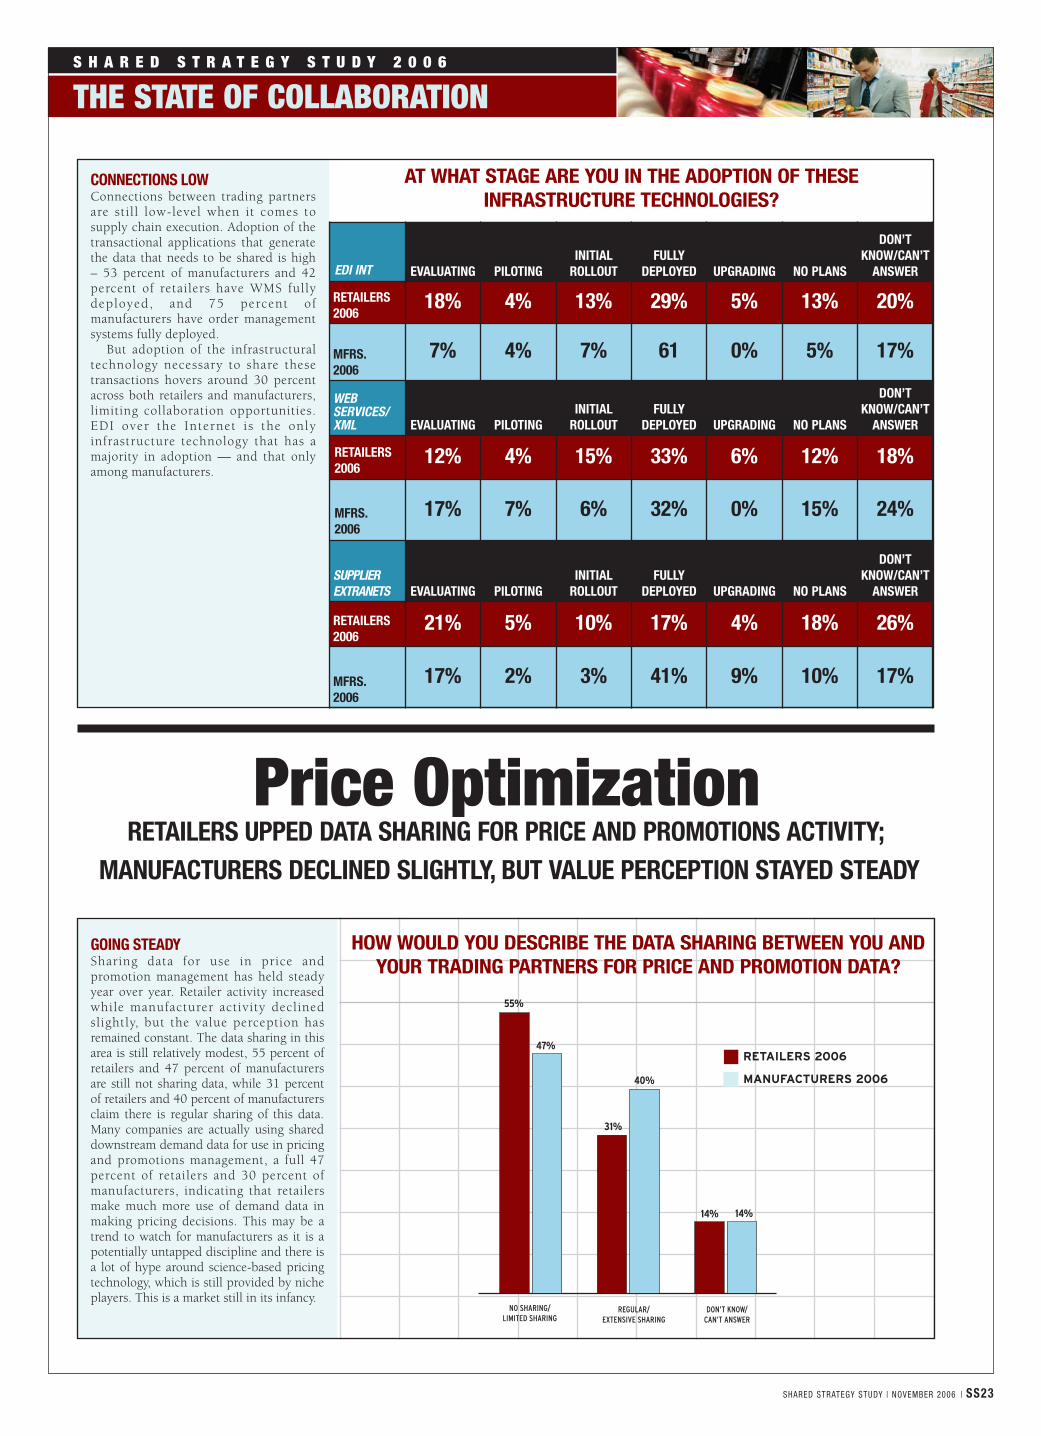
CONNECTIONS LOWConnections between trading partnersare still low-level when it comes tosupply chain execution. Adoption of thetransactional applications that generatethe data that needs to be shared is high– 53 percent of manufacturers and 42percent of retailers have WMS fullydeployed, and 75 percent ofmanufacturers have order managementsystems fully deployed.
But adoption of the infrastructuraltechnology necessary to share thesetransactions hovers around 30 percentacross both retailers and manufacturers,limiting collaboration opportunities.EDI over the Internet is the onlyinfrastructure technology that has amajority in adoption — and that onlyamong manufacturers.
GOING STEADYSharing data for use in price andpromotion management has held steadyyear over year. Retailer activity increasedwhile manufacturer activity declinedslightly, but the value perception hasremained constant. The data sharing in thisarea is still relatively modest, 55 percent ofretailers and 47 percent of manufacturersare still not sharing data, while 31 percentof retailers and 40 percent of manufacturersclaim there is regular sharing of this data.Many companies are actually using shareddownstream demand data for use in pricingand promotions management, a full 47percent of retailers and 30 percent ofmanufacturers, indicating that retailersmake much more use of demand data inmaking pricing decisions. This may be atrend to watch for manufacturers as it is apotentially untapped discipline and there isa lot of hype around science-based pricingtechnology, which is still provided by nicheplayers. This is a market still in its infancy.
Price OptimizationRETAILERS UPPED DATA SHARING FOR PRICE AND PROMOTIONS ACTIVITY;
MANUFACTURERS DECLINED SLIGHTLY, BUT VALUE PERCEPTION STAYED STEADY
AT WHAT STAGE ARE YOU IN THE ADOPTION OF THESE INFRASTRUCTURE TECHNOLOGIES?
HOW WOULD YOU DESCRIBE THE DATA SHARING BETWEEN YOU ANDYOUR TRADING PARTNERS FOR PRICE AND PROMOTION DATA?
S H A R E D S T R A T E G Y S T U D Y 2 0 0 6
THE STATE OF COLLABORATION
RETAILERS 2006
MANUFACTURERS 2006
SHARED STRATEGY STUDY | NOVEMBER 2006 | SS23
EDI INT EVALUATING PILOTINGINITIAL
ROLLOUTFULLY
DEPLOYED UPGRADING NO PLANS
DON’TKNOW/CAN’T
ANSWER
RETAILERS2006
18% 4% 13% 29% 5% 13% 20%
MFRS.2006
7% 4% 7% 61 0% 5% 17%
WEBSERVICES/XML EVALUATING PILOTING
INITIALROLLOUT
FULLYDEPLOYED UPGRADING NO PLANS
DON’TKNOW/CAN’T
ANSWER
RETAILERS2006
12% 4% 15% 33% 6% 12% 18%
MFRS.2006
17% 7% 6% 32% 0% 15% 24%
SUPPLIEREXTRANETS EVALUATING PILOTING
INITIALROLLOUT
FULLYDEPLOYED UPGRADING NO PLANS
DON’TKNOW/CAN’T
ANSWER
RETAILERS2006
21% 5% 10% 17% 4% 18% 26%
MFRS.2006
17% 2% 3% 41% 9% 10% 17%
NO SHARING/LIMITED SHARING
55%
REGULAR/EXTENSIVE SHARING
DON’T KNOW/CAN’T ANSWER
47%
31%
40%
14%14%
SS-p22-23rev2.qxd 10/25/06 10:30 AM Page 5

CGT WISHES TO THANK THE SPONSORS OFS H A R E D S T R A T E G Y S T U D Y 2 0 0 6
THE STATE OF COLLABORATION
SS-11-06-p24 Thank you.qxd 10/25/06 1:01 PM Page 1


