15
Ch. 10 Correlation and Regression 10-1 Notes Scatter Diagrams and Linear Correlation
| Date post: | 28-Dec-2015 |
| Category: |
Documents |
| Upload: | dora-randall |
| View: | 233 times |
| Download: | 0 times |
Ch. 10 Correlation and Regression
10-1 NotesScatter Diagrams and
Linear Correlation
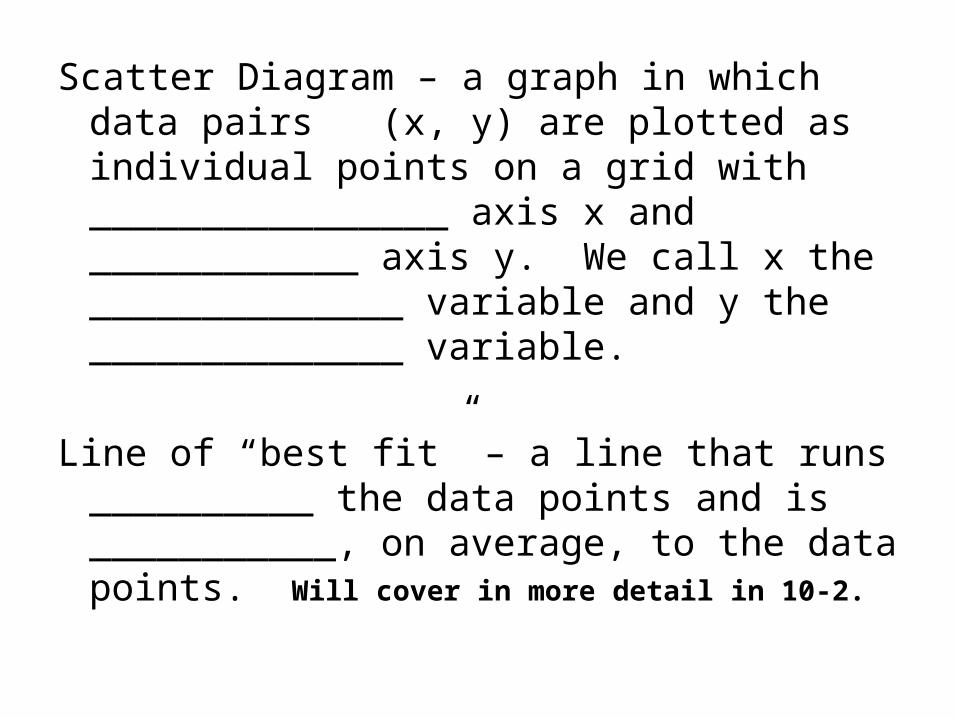
Scatter Diagram – a graph in which data pairs (x, y) are plotted as individual points on a grid with ________________ axis x and ____________ axis y. We call x the ______________ variable and y the ______________ variable.
Line of “best fit” – a line that runs __________ the data points and is ___________, on average, to the data points. Will cover in more detail in 10-2.

Ex. 1 A large industrial plant has seven divisions that do the same type of work. A safety inspector visits each division of 20 workers quarterly. The number x of work-hours devoted to safety training and the number y of work-hours lost due to industry-related accidents are recorded for each separate division below:
Safety Report Division 1 2 3 4 5 6 7
x 10.0 19.5 30.0 45.0 50.0 65.0 80.0
y 80 65 68 55 35 10 12
a) Make a scatter diagram for these pairs.
b) As the number of hours spent training increases, what happens to the number of hours lost to accidents?
c) Does a line fit the data reasonably well?
d) Draw a line that you think “fits best”.
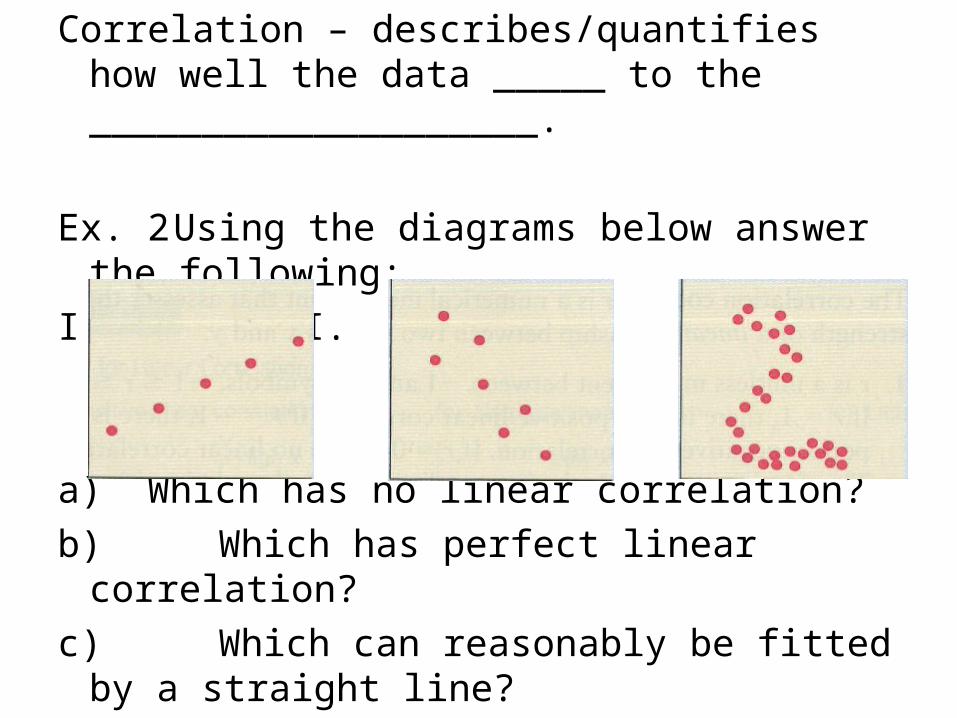
Correlation – describes/quantifies how well the data _____ to the ____________________.
Ex. 2 Using the diagrams below answer the following:
I. II. III.
a) Which has no linear correlation?b) Which has perfect linear correlation?c) Which can reasonably be fitted by a straight
line?

CorrelationPositive Correlation – low values of x are
associated with _____ values of y and high values of x are associated with _____ values of y.
Negative Correlation – low values of x are associated with _____ values of y and high values of x are associated with _____ values of y.

Which of the above are negatively correlated?
Which of the above are positively correlated?
Sample Correlation Coefficient (r) – a mathematical measurement that describes the _____________ of the __________ association between two variables of a sample.
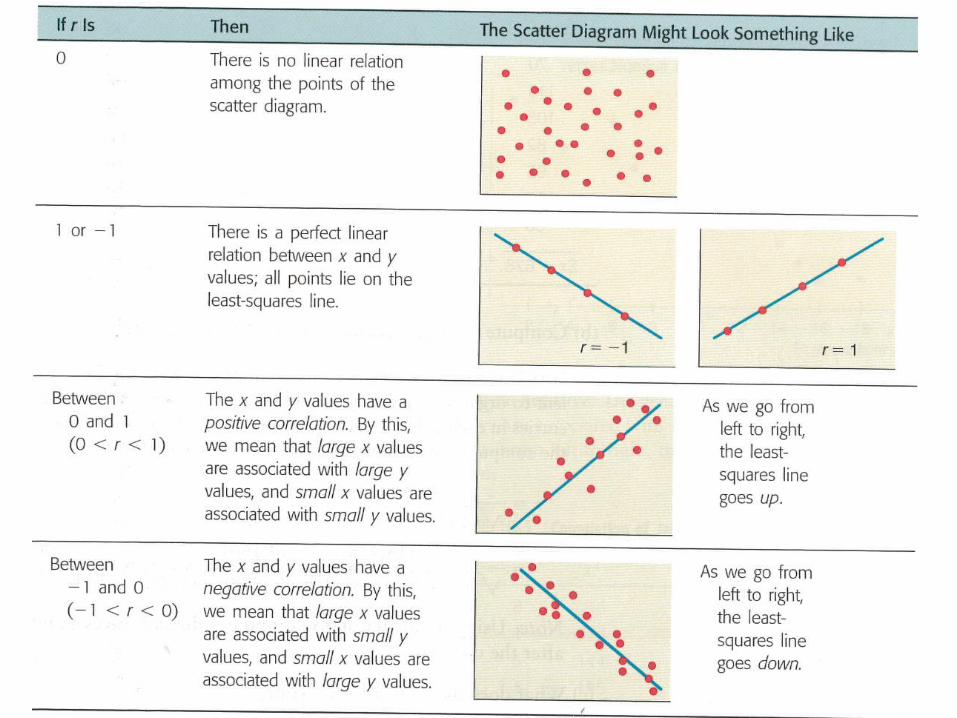
1.r is a unitless measurement between ___ and ___. In symbols, ___ < r < ___. If r = ___, there is perfect positive linear correlation. If r = ___, there is perfect negative linear correlation. If r = ___, there is no linear correlation. The closer r is to ___ or ___, the better a line describes the relationship between the two variables x and y.
2.Positive values of r imply that as x increases, y tends to ____________. Negative values of r imply that as x increases, y tends to ____________.
3.The value of r is the same regardless of which variable is the _____________ variable and which is the ___________ variable.
4.the value of r does not change when either variable is ____________________________.

Tech NotesTo find r using TI 83/84First use CATALOG, find Diagnostic On, and
press Enter twice.Then, when you use STAT, CALC, option
8:LinReg(a+bx), the value of r will be given.
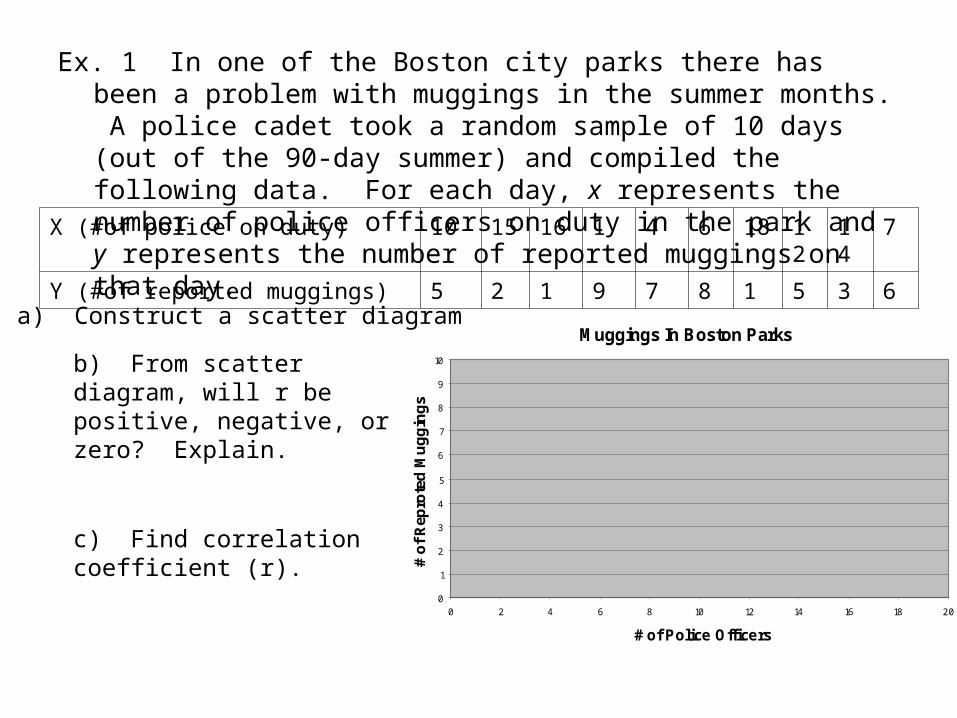
Ex. 1 In one of the Boston city parks there has been a problem with muggings in the summer months. A police cadet took a random sample of 10 days (out of the 90-day summer) and compiled the following data. For each day, x represents the number of police officers on duty in the park and y represents the number of reported muggings on that day.
X (#of police on duty) 10 15 16 1 4 6 18 12 14 7
Y (#of reported muggings) 5 2 1 9 7 8 1 5 3 6
a) Construct a scatter diagramMuggings In Boston Parks
0
1
2
3
4
5
6
7
8
9
10
0 2 4 6 8 10 12 14 16 18 20
# of Police Officers
# o
f R
epro
ted
Mu
gg
ing
s
b) From scatter diagram, will r be positive, negative, or zero? Explain.
c) Find correlation coefficient (r).
Final thoughts about correlation1. r = ________ correlation coefficient; whereas
ρ = __________ correlation coefficient.
2. Just because two variables have a strong correlation does not imply that one ________ the other. Sometimes the strong relationship can be caused by another variable (________ ______________).
3. Correlation between two variables consisting of ____________ is usually stronger than between _____________ values.
Assignment Day 1P. 503 #1, 2, 3, 5, 7, 9, 11, 13, 14
Day 2P. 504 #6, 8, 10, 12, 15, 16


