40
ESTIMATING PROCESS CHAPTER - 13 CHAPTER - 13
| Date post: | 17-Oct-2014 |
| Category: |
Documents |
| Upload: | ankitthebest |
| View: | 246 times |
| Download: | 2 times |
ESTIMATING PROCESS
CHAPTER - 13CHAPTER - 13
ESTIMATING USING HAND HELD DEVICES
The Need: Estimators need a way to increase efficiency and lessen the chance for error when collecting estimate information in the field. Hand-held devices ensure estimators have the information they need to collect all project details necessary to deliver and accurate and complete bid.
The Technology: Designed for hand-held devices, estimating programs or personal digital assistants (PDAs) equip estimators with all the tools needed to perform detailed takeoffs remotely. Then, when convenient, data can be transferred to desktop software to instantly generate a detailed estimate.
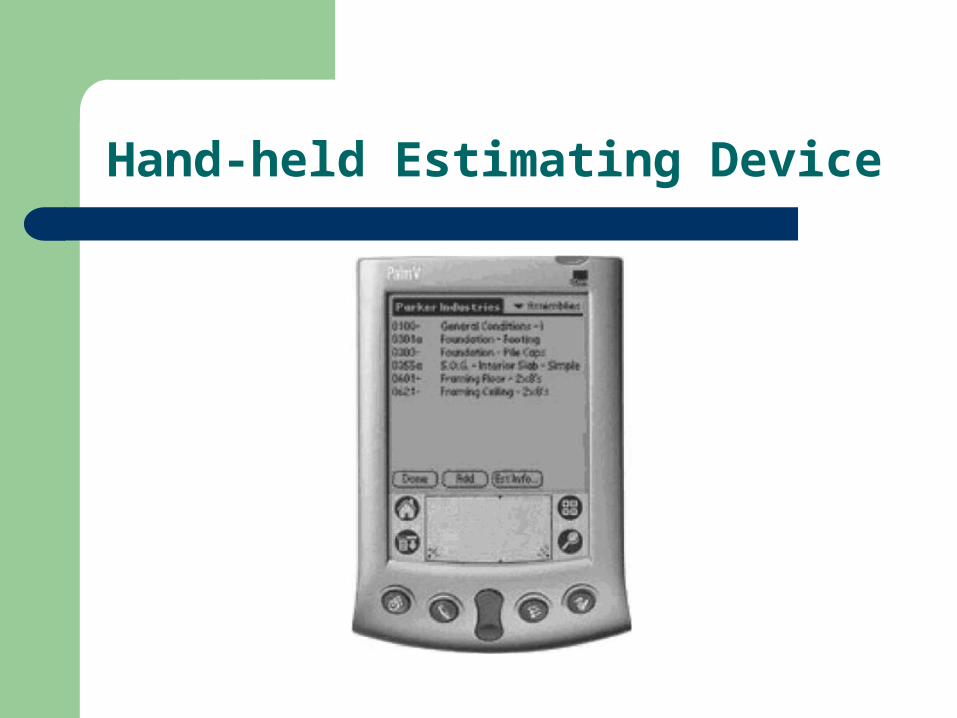
Hand-held Estimating Device
ESTIMATING CONSTRUCTION COSTS
The key to a good job and successful cost control is the development of a good estimate as the basis for bid submittal.
Estimating is the process of looking into the future and trying to predict project costs and resource requirements.
TYPES OF ESTIMATES
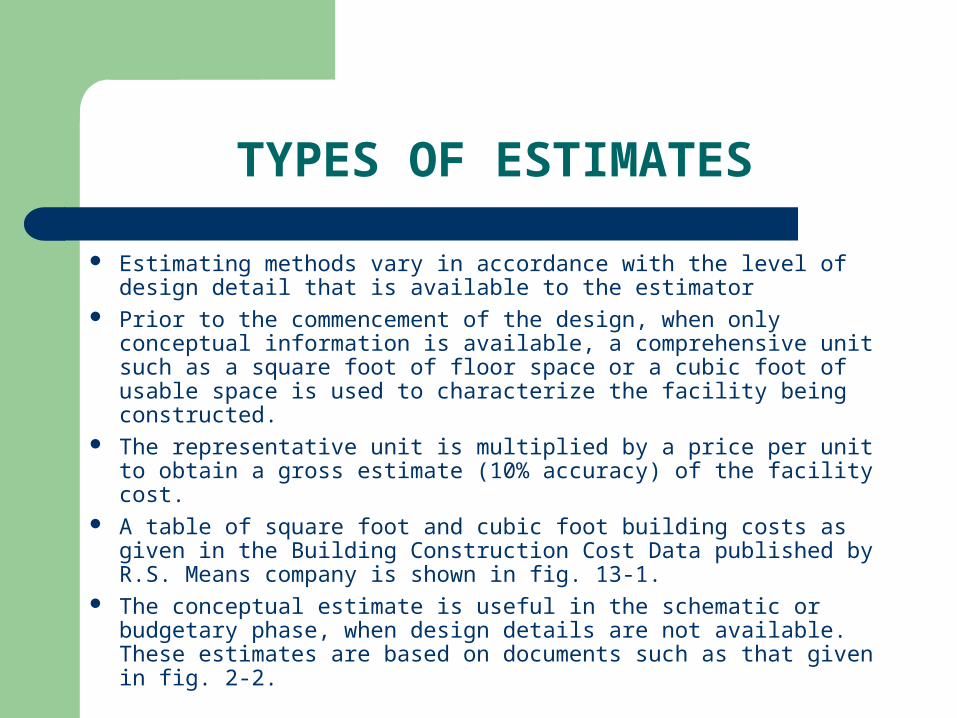
Estimating methods vary in accordance with the level of design detail that is available to the estimator
Prior to the commencement of the design, when only conceptual information is available, a comprehensive unit such as a square foot of floor space or a cubic foot of usable space is used to characterize the facility being constructed.
The representative unit is multiplied by a price per unit to obtain a gross estimate (10% accuracy) of the facility cost.
A table of square foot and cubic foot building costs as given in the Building Construction Cost Data published by R.S. Means company is shown in fig. 13-1.
The conceptual estimate is useful in the schematic or budgetary phase, when design details are not available. These estimates are based on documents such as that given in fig. 2-2.
TYPES OF ESTIMATES CONT’D
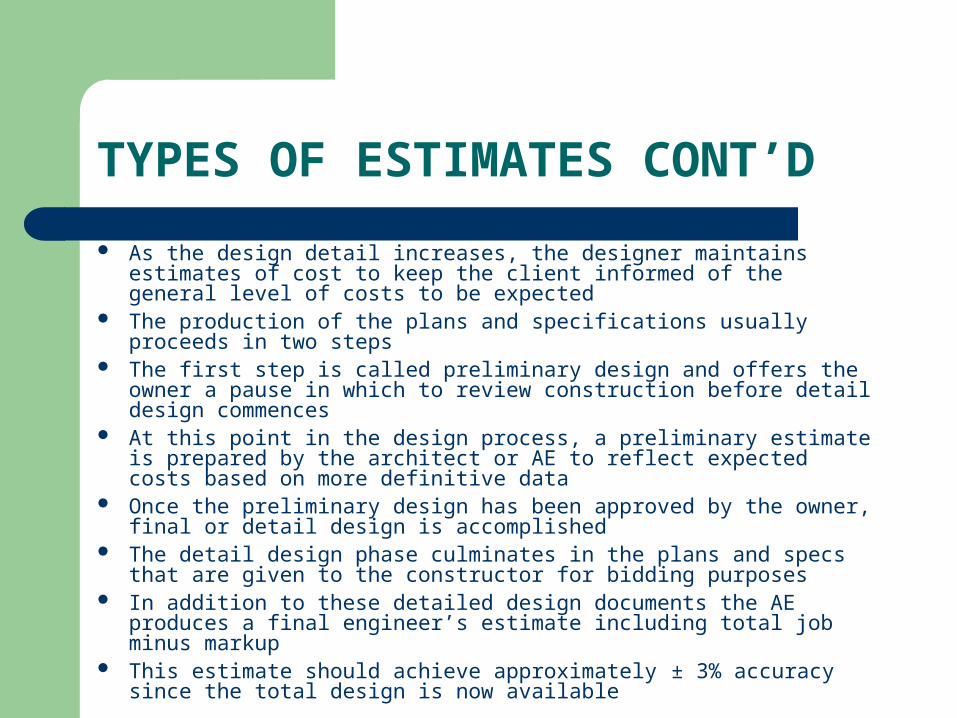
As the design detail increases, the designer maintains estimates of cost to keep the client informed of the general level of costs to be expected
The production of the plans and specifications usually proceeds in two steps
The first step is called preliminary design and offers the owner a pause in which to review construction before detail design commences
At this point in the design process, a preliminary estimate is prepared by the architect or AE to reflect expected costs based on more definitive data
Once the preliminary design has been approved by the owner, final or detail design is accomplished
The detail design phase culminates in the plans and specs that are given to the constructor for bidding purposes
In addition to these detailed design documents the AE produces a final engineer’s estimate including total job minus markup
This estimate should achieve approximately ± 3% accuracy since the total design is now available

Figure 13-1 Costs Based on a Representative Unit
TYPES OF ESTIMATES CONT’D
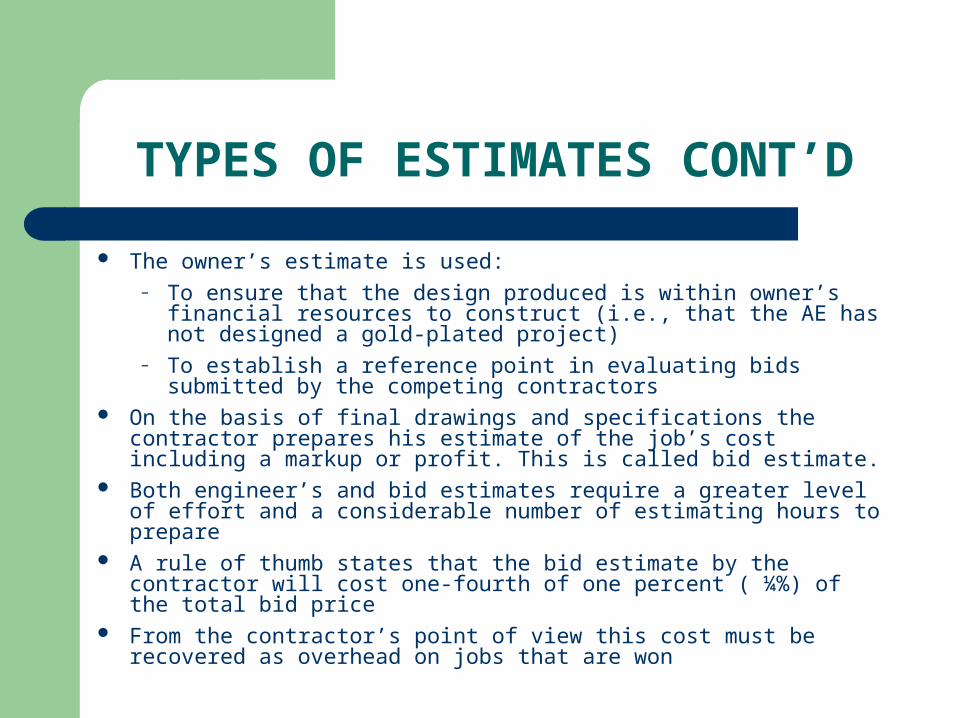
The owner’s estimate is used:– To ensure that the design produced is within owner’s financial
resources to construct (i.e., that the AE has not designed a gold-plated project)
– To establish a reference point in evaluating bids submitted by the competing contractors
On the basis of final drawings and specifications the contractor prepares his estimate of the job’s cost including a markup or profit. This is called bid estimate.
Both engineer’s and bid estimates require a greater level of effort and a considerable number of estimating hours to prepare
A rule of thumb states that the bid estimate by the contractor will cost one-fourth of one percent ( ¼%) of the total bid price
From the contractor’s point of view this cost must be recovered as overhead on jobs that are won

TYPES OF ESTIMATES CONT’D
In building construction, these four levels of estimates are the ones most commonly encountered: conceptual, preliminary estimate, engineer’s estimate and bid estimate
A listing of estimates commonly developed in conjunction with large and complex industrial projects is given in fig. 13-2
This includes an Order of Magnitude (ROM), similar in purpose to conceptual estimates in building construction. That is used to replace gross costs for planning and decisions purpose before the preliminary and definitive design phases begin
The definitive estimate, as used on complex industrial projects, is a pre-final estimate developed just prior to the production of final drawings and specifications. The estimate is prepared when the project scope is well defined. The pricing is based on formal vendor’s quotations and predictable market costs
The amount of variability is, of course, quite high at the magnitude level and decreases to the 3 to 5% range as bid level documents become available
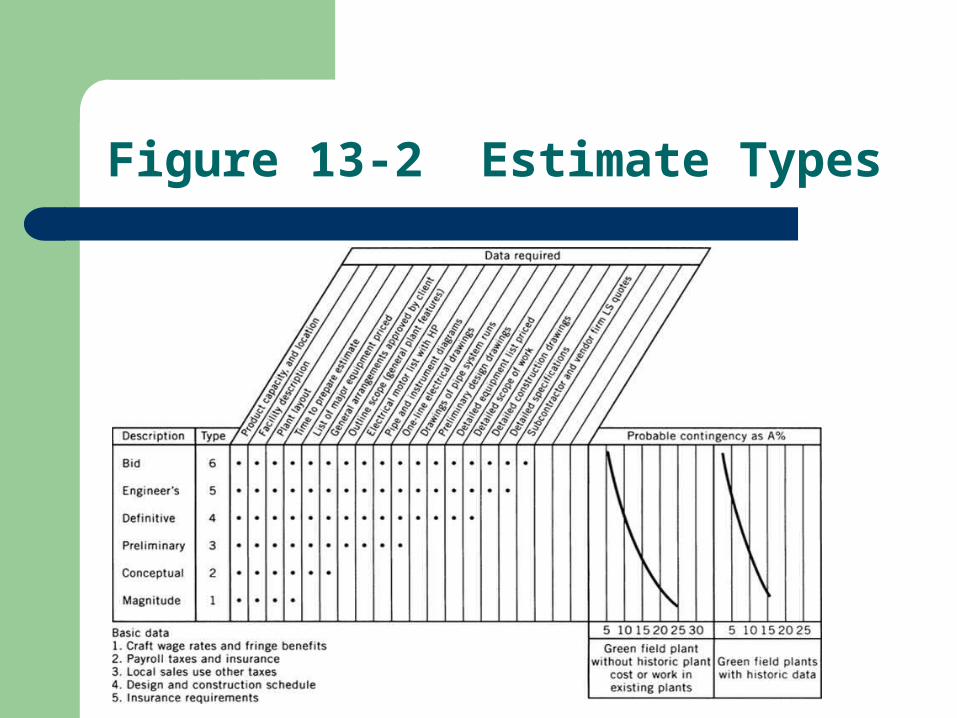
Figure 13-2 Estimate Types
DETAILED ESTIMATE PREPARATION
The preparation of a detailed bid-level estimate requires that the estimator break the project into cost centers or cost sub-elements. That is when a project is broken down into subcomponents that will generate costs.
Construction cost centers relate to some physical subcomponents of the project, such as foundation piles, excavation, steel erection, interior drywall installation and the like.
Certain nonphysical components of the work generate costs, these cost centers may also be considered. Many of the items or “indirects” are not directly connected with physical components
These costs include insurance and bonding premiums, fees for licenses and permits, safety and minority participating programs, home office overhead projected as allocated to the job. These items are sometimes referred to as General Conditions or general requirements
DETAILED ESTIMATE PREPARATION CONT’D
The process of estimating is part art, part science. The estimator generally follows certain steps in developing the estimate
– Break the project into cost centers– Estimate the quantities required for cost centers that represent physical end items
(e.g. cubic yards of earth, linear feet of pipe etc). For physical systems this procedure is commonly called quantity take off.
– Price out the quantities determined in step 2 using historical data, vendor quotations, supplier catalogs and other pricing information. The pricing may be base on a price per unit (unit cost) basis or a lump sum (one job) basis. Price developments for physical work items may require an analysis of the production rates to be achieved based on resource analysis. If this is used, the estimator must:
Assume a work team composition to include number of workers and equipment used
On the basis of team composition, estimates on an hourly production rate are based on the technology used
Make an estimate of the efficiency to be achieved on this job Calculate the effective unit price
– Calculate the total price for each cost center The estimator usually summarizes the values for each cost center on a summary sheet
such as that shown in Figure 13-3.

Figure 13-3 Typical Estimating Summary
DEFINITIONS OF COST CENTERS
The subdivisions into which the project is divided for detail cost estimation purposes are variously referred to as:
– Estimating accounts– Line items– Cost Accounts– Work Packages
As described in Chapter 6, the team “work package” has become current over the past 20 years and is commonly used to indicate a subdivision of the project that is used for both cost control and scheduling (i.e. control time)
When both cost and time control systems are combined into an integrated project management system, work packages are controlled to determine cost vs. estimate and time vs. schedule
The subdividing of the project into work packages results in the definition of a work breakdown structure (WBS)
A work package is a well defined scope of work that usually terminates in a deliverable product. Each work package may vary in size but must be a measurable and controllable unit of work to be performed. It also must be identifiable in a numerical accounting system in order to permit capture of both budget and actual performance information. A work package is a cost center.
QUANTITY TAKEOFF
The development of the quantities of work to be placed in appropriate units (e.g. square feet, cubic yards, etc.) is referred to as the quantity takeoff (QTO) or quantity surveying. The procedures employed by the estimator to calculate these quantities should incorporate steps to minimize errors. Five of the most common errors experienced during quantity takeoff are:
– Arithmetic: Errors in addition, subtraction and multiplication– Transposition: Mistakes in copying or transferring figures, dimensions, etc.– Errors of Omission: Overlooking items called for or required to accomplish the
work– Poor Reference: Scaling drawings rather than using the dimensions indicated– Unrealistic waste or loss factors
The first step in quantity takeoff procedures is to identify the materials required by each estimating account or work package
After that, relevant dimensions are recorded on a spreadsheet so that quantity calculations in the required unit of measure can be made
Before the calculations for the QTO are performed, detailed working drawings are sometimes required to clarify the contract drawings and specifications or the chosen construction method (e.g. forming technique)
QUANTITY TAKEOFF CONT’D
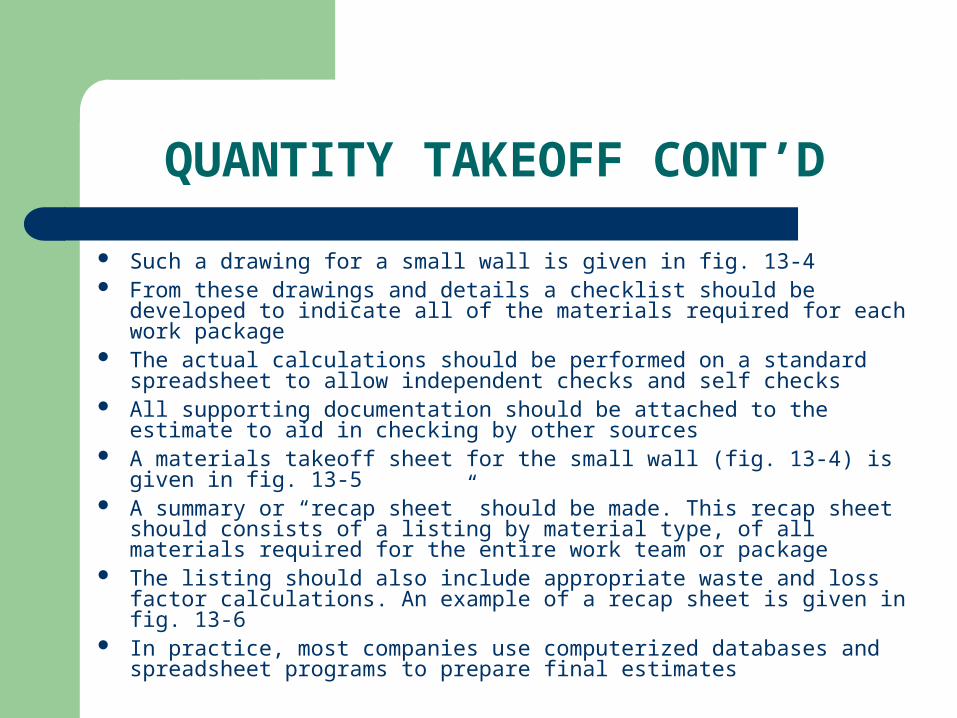
Such a drawing for a small wall is given in fig. 13-4 From these drawings and details a checklist should be developed to
indicate all of the materials required for each work package The actual calculations should be performed on a standard spreadsheet
to allow independent checks and self checks All supporting documentation should be attached to the estimate to aid in
checking by other sources A materials takeoff sheet for the small wall (fig. 13-4) is given in fig. 13-5 A summary or “recap sheet” should be made. This recap sheet should
consists of a listing by material type, of all materials required for the entire work team or package
The listing should also include appropriate waste and loss factor calculations. An example of a recap sheet is given in fig. 13-6
In practice, most companies use computerized databases and spreadsheet programs to prepare final estimates
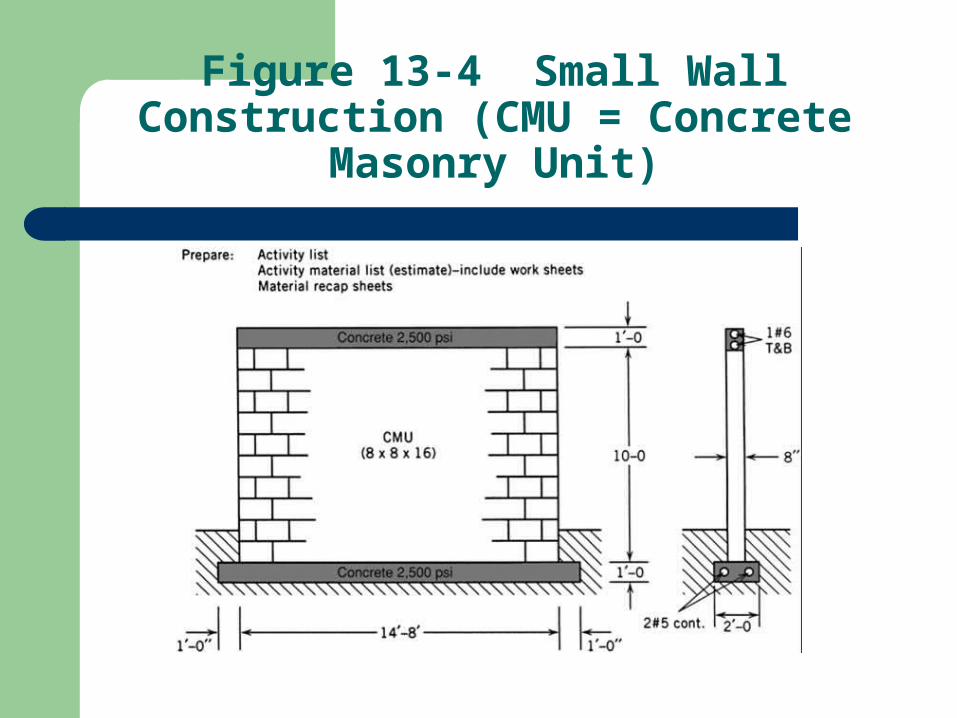
Figure 13-4 Small Wall Construction (CMU = Concrete Masonry Unit)
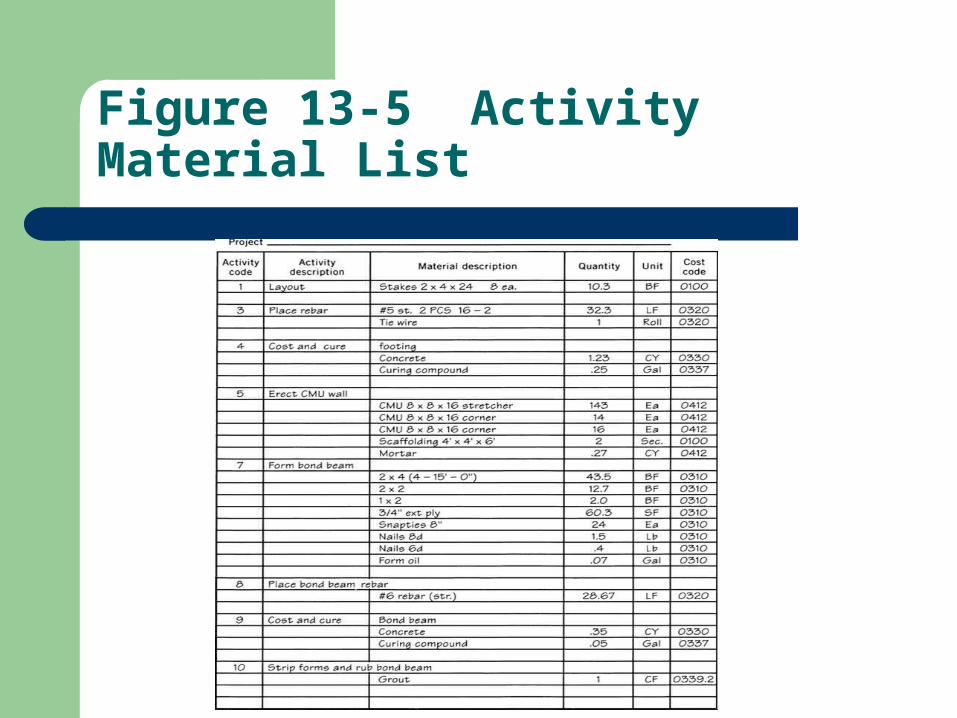
Figure 13-5 Activity Material List
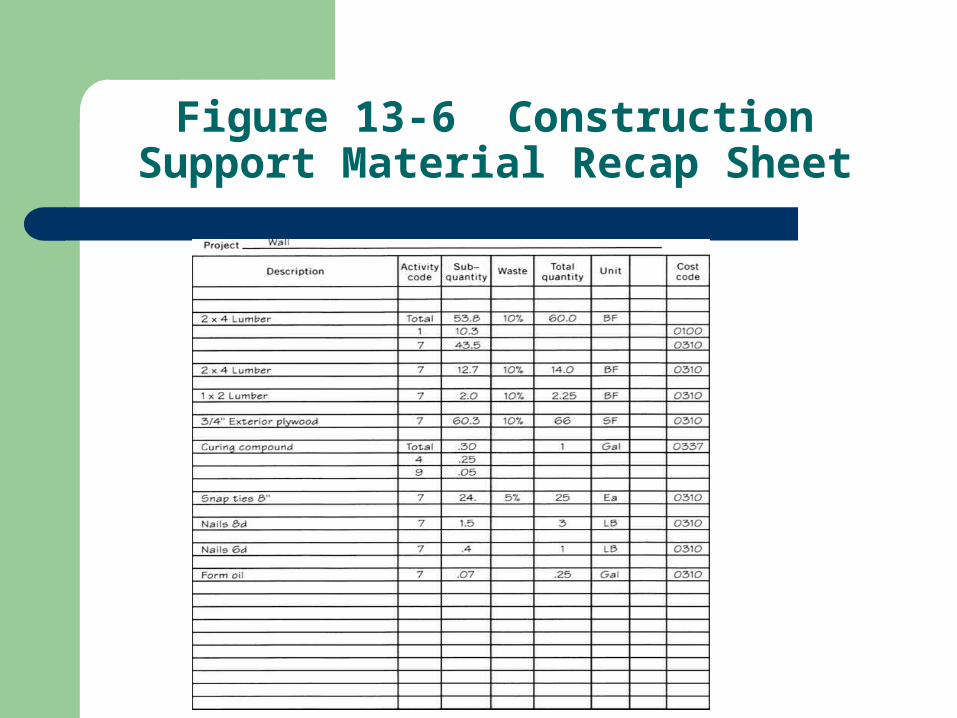
Figure 13-6 Construction Support Material Recap Sheet
METHODS OF DETAILED COST DETERMINATION
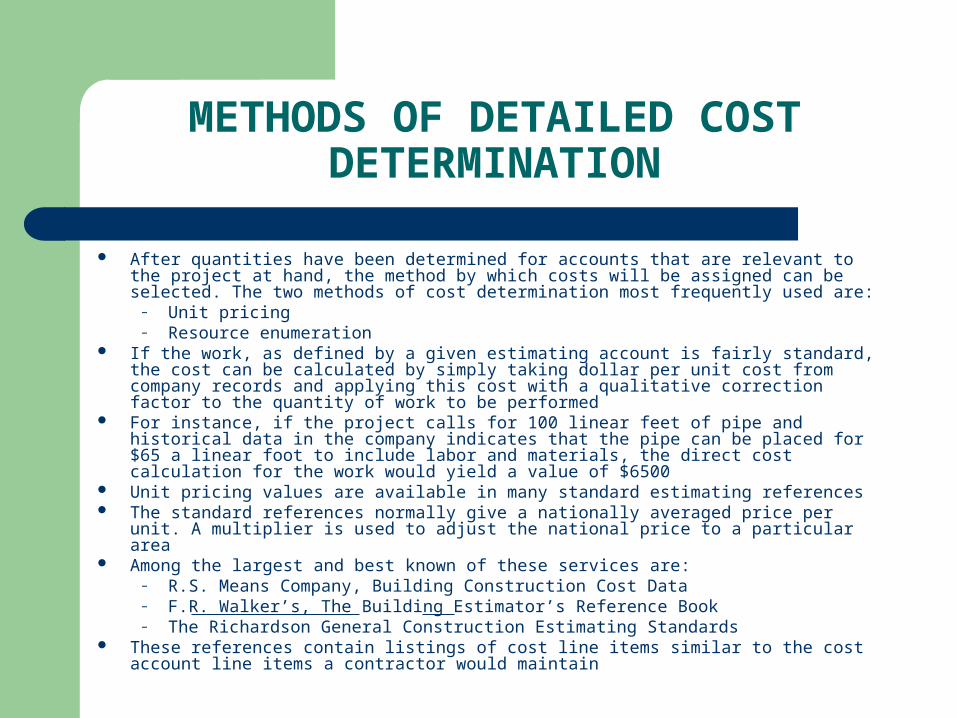
After quantities have been determined for accounts that are relevant to the project at hand, the method by which costs will be assigned can be selected. The two methods of cost determination most frequently used are:
– Unit pricing– Resource enumeration
If the work, as defined by a given estimating account is fairly standard, the cost can be calculated by simply taking dollar per unit cost from company records and applying this cost with a qualitative correction factor to the quantity of work to be performed
For instance, if the project calls for 100 linear feet of pipe and historical data in the company indicates that the pipe can be placed for $65 a linear foot to include labor and materials, the direct cost calculation for the work would yield a value of $6500
Unit pricing values are available in many standard estimating references The standard references normally give a nationally averaged price per unit. A multiplier is
used to adjust the national price to a particular area Among the largest and best known of these services are:
– R.S. Means Company, Building Construction Cost Data– F.R. Walker’s, The Building Estimator’s Reference Book– The Richardson General Construction Estimating Standards
These references contain listings of cost line items similar to the cost account line items a contractor would maintain
METHODS OF DETAILED COST DETERMINATION CONT’D
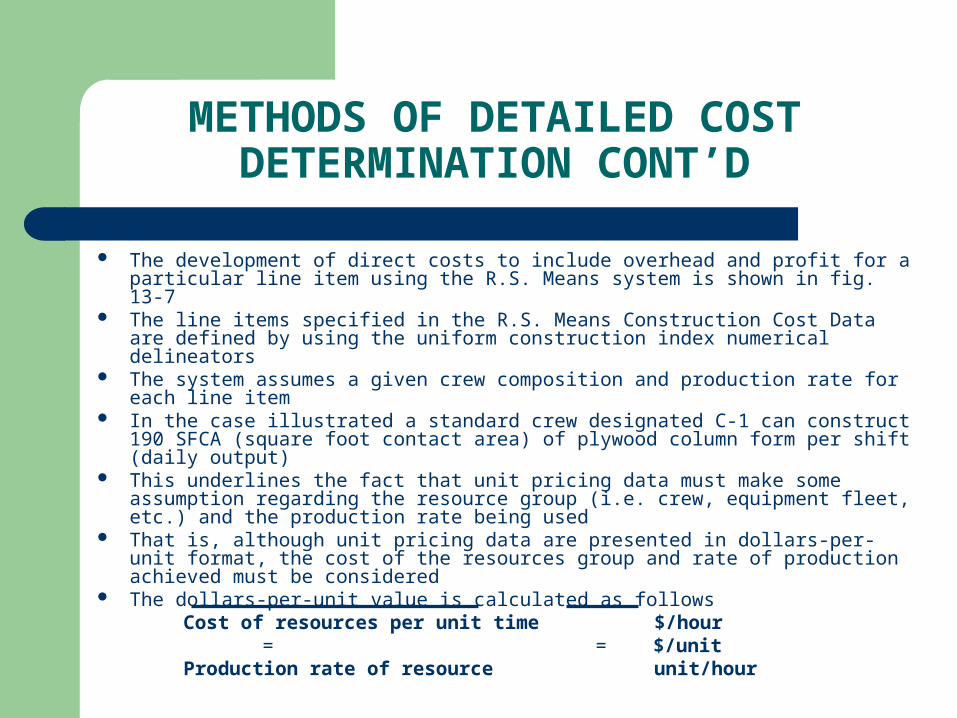
The development of direct costs to include overhead and profit for a particular line item using the R.S. Means system is shown in fig. 13-7
The line items specified in the R.S. Means Construction Cost Data are defined by using the uniform construction index numerical delineators
The system assumes a given crew composition and production rate for each line item
In the case illustrated a standard crew designated C-1 can construct 190 SFCA (square foot contact area) of plywood column form per shift (daily output)
This underlines the fact that unit pricing data must make some assumption regarding the resource group (i.e. crew, equipment fleet, etc.) and the production rate being used
That is, although unit pricing data are presented in dollars-per-unit format, the cost of the resources group and rate of production achieved must be considered
The dollars-per-unit value is calculated as followsCost of resources per unit time $/hour
= = $/unit Production rate of resource unit/hour

METHODS OF DETAILED COST DETERMINATION CONT’D
The unit cost is the ratio of resource costs to production rate. The crew composition and assumed cost for the crew are shown in the middle of fig. 13-7
In the R.S. Means system two costs are specified for each line item. The bare cost is the direct cost for labor and materials. The total cost includes the cost of burdens, taxes and subcontractor overhead and profit (inclusive O&P)
In fig. 13-7, the bare cost of the C-1 crew is calculated as $798.20 per shift. Therefore, the bare unit installation cost is:
$798.20/shift
= $4.20/SFCA
190 units/ship
METHODS OF DETAILED COST DETERMINATION CONT’D
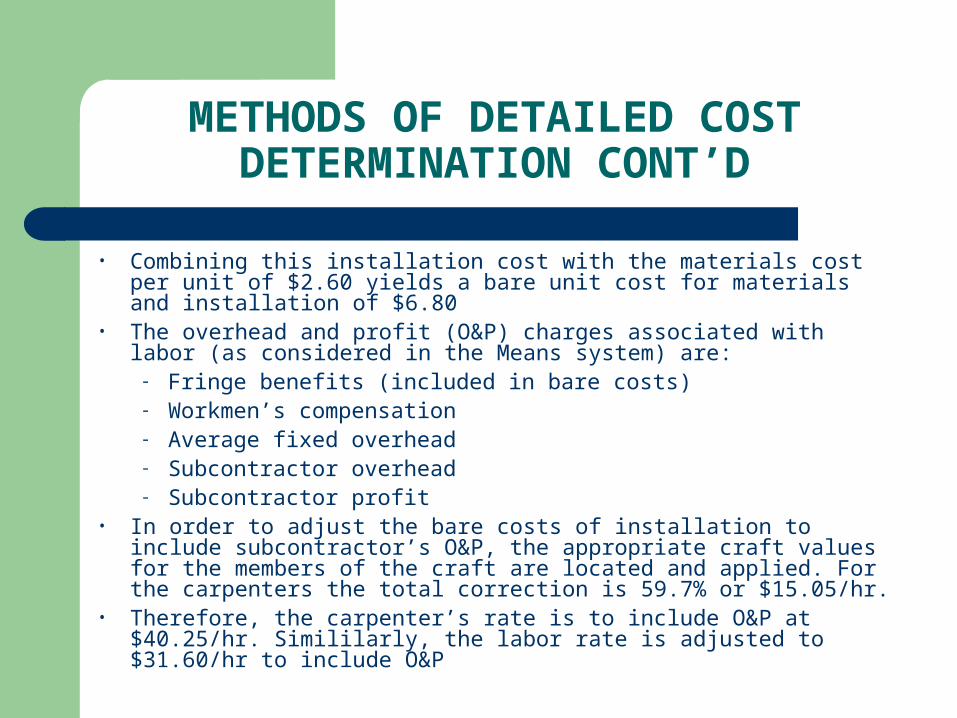
• Combining this installation cost with the materials cost per unit of $2.60 yields a bare unit cost for materials and installation of $6.80
• The overhead and profit (O&P) charges associated with labor (as considered in the Means system) are:
- Fringe benefits (included in bare costs)- Workmen’s compensation- Average fixed overhead- Subcontractor overhead- Subcontractor profit
• In order to adjust the bare costs of installation to include subcontractor’s O&P, the appropriate craft values for the members of the craft are located and applied. For the carpenters the total correction is 59.7% or $15.05/hr.
• Therefore, the carpenter’s rate is to include O&P at $40.25/hr. Simililarly, the labor rate is adjusted to $31.60/hr to include O&P
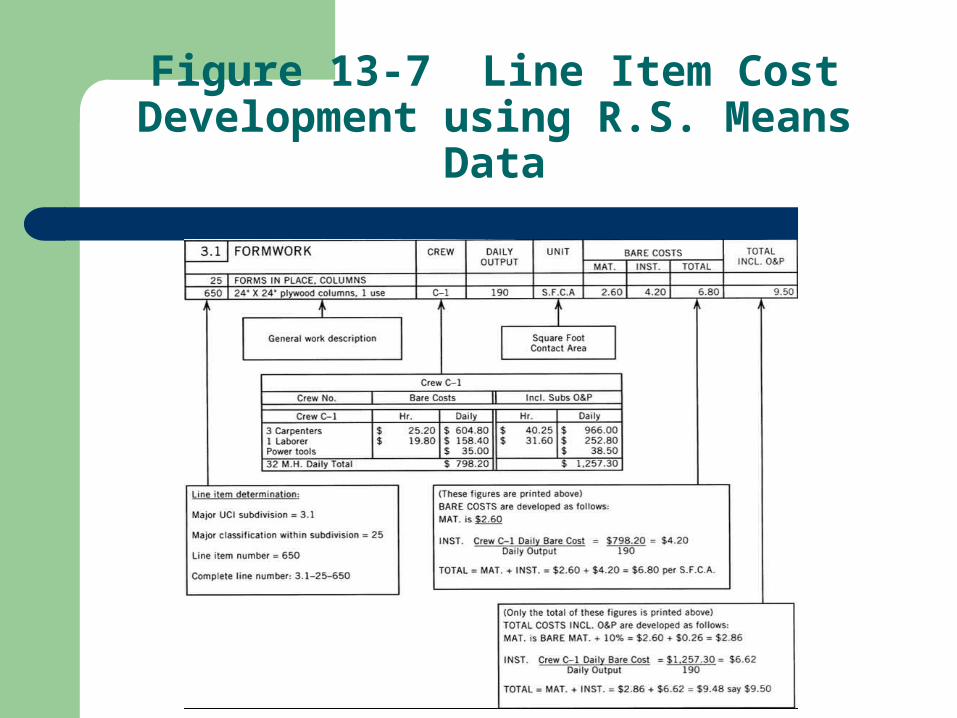
Figure 13-7 Line Item Cost Development using R.S. Means Data
METHODS OF DETAILED COST DETERMINATION CONT’D
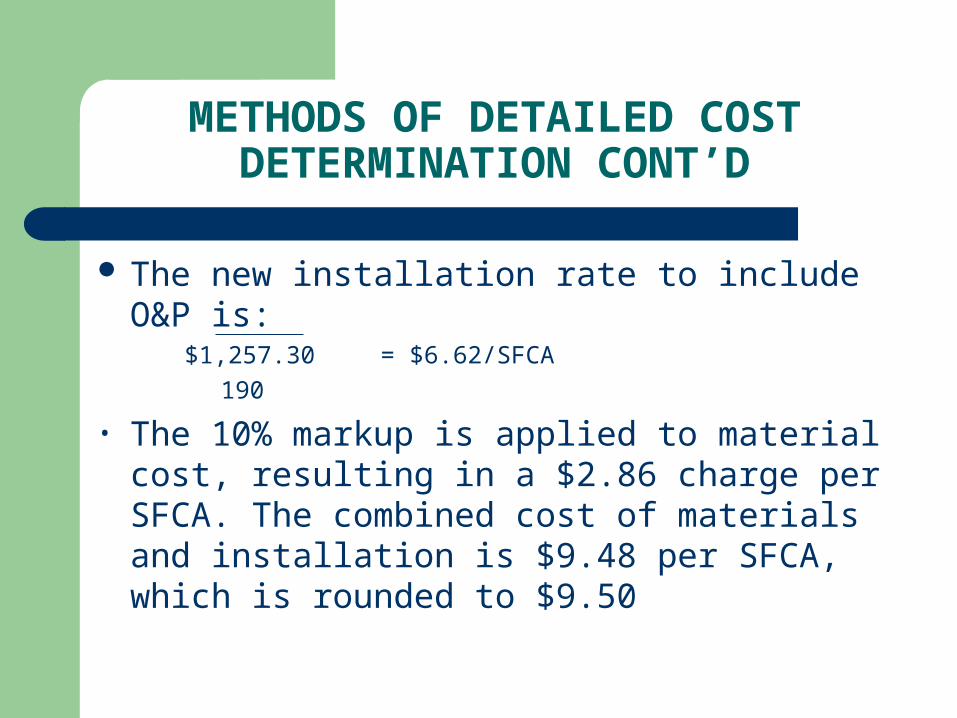
The new installation rate to include O&P is:$1,257.30 = $6.62/SFCA
190
• The 10% markup is applied to material cost, resulting in a $2.86 charge per SFCA. The combined cost of materials and installation is $9.48 per SFCA, which is rounded to $9.50
PROBLEMS WITH UNIT-COST METHOD
The data that the contractor has available from company records are presented as dollars per unit and in most cases no records of the crew composition, cost and production rates are maintained
Since on each job the crew composition, costs and production rates achieved are probably unique to the individual job, the figure represents an aggregate cost per unit
The actual number of man-hours used and the productivity achieved are masked by the dollar-per-unit figure
Therefore the unit price available from averaging values on previous jobs has to be treated with some caution
Since every job is unique, some of the estimator’s intuition must be applied to ensure that the value is adopted to the conditions of the job being estimated
PROBLEMS WITH UNIT-COST METHOD CONT’D
Clearly the numerator (cost of resources per unit time) of the unit-cost ratio will vary significantly over time as the costs of labor and machines vary
The costs of all components of the construction process have risen sharply over the past 20 years. This is shown dramatically in the ENR Construction and Building Costs indexes shown in chapter 2
In order to factor out the inflationary escalation inherent in resource costs, some contractors maintain the ratio of man-hours or resource hours required rather then dollars per unit. This establishes a company data-base tied to resource hours required rather than dollars per unit
Therefore, the contractor can retrieve a man-hour or resource-hour (RH) per unit for each line item
The value is calculated as:Resource hours per hour = RH/unit Units per hour
PROBLEMS WITH UNIT-COST METHOD CONT’D
The cost per unit can then be calculated by multiplying the resource hours per unit value by the average hourly cost per resource
If it takes 25 resource-hours per unit and the average cost of a resource-hour is $20.00, the unit cost will be $500.00 per unit
This method recognizes that the number of resource-hours required per unit is much more stable over the years than the cost per unit
Therefore, data on resource-hours per unit collected over several years will not be affected by inflationary trends and escalation in the cost of goods and services
Use of unit-pricing approach assumes that historical data have been maintained for commonly encounter cost accounts. Data collected and linked to a reference unit such as a cubic yard or square foot
PROBLEMS WITH UNIT-COST METHOD CONT’D
On a typical job 80 to 90% of the work to be accomplished can be estimated by calculating the number of reference units and multiplying this number by the unit price
One approach to the quantification of these site and job unique factors is proposed by Louis Dallavia
Although the Dallavia method does reflect in an approximate way the factors that are considered by an estimator in adjusting general unit prices to a given project
The system defines a % efficiency factor based on a production range index for each of the eight job characteristics
The method of calculating the percent efficiency factor and the table production range are shown in fig. 13-8
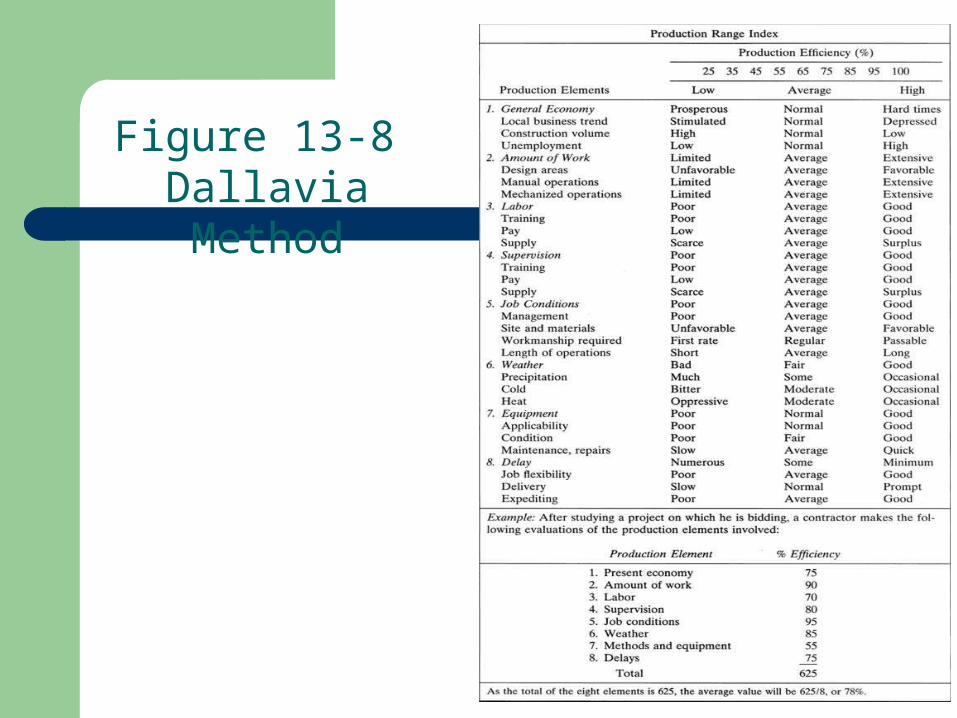
Figure 13-8 Dallavia Method
RESOURCE ENUMERATION
Unusual architectural items that are unique to the structure and require special forming or erection procedures are typical of such work. In such cases, the price must be developed by breaking the special work item into its sub features and assigning a typical resource group to each sub feature
The productivity to be achieved by the resource group must be estimated by using either historical data or engineering instruction. The breakdown of the cost center into its sub elements would occur much the same as for wall section of 13-5, subdivided for quantity
See fig. 13-9 for resource enumeration An example of resource enumeration applied to concrete-placing
operation is shown in fig. 13-10 and an example on pg. 216 The resource enumeration approach has the advantage over unit pricing
in that it allows the estimator to establish a style the resource set or crew to be used to the work in question
The basic equation for unit pricing is shown on pg. 216
RESOURCE ENUMERATION CONT’D
In the unit pricing approach the resource costs and the production rates are the aggregate value of resources and rate accumulated on a number of jobs over the period of historical data collection
With the resource enumeration approach, the estimator specifies a particular crew or resource group at a particular charge rate and a particular production level for the specific work element being estimated
This should yield a much more precise cost-per-unit definition The disadvantage with such a detailed level of cost definition is the fact
that it is time consuming Therefore, resource enumeration estimating would be used only when:
– Items for which no unit cost data are available– “Big ticket” items, which constitute a large percentage of the overall cost of
the job and for which such a precise cost analysis may lead to cost savings– Extremely complex work for which unit-pricing deemed in adequate
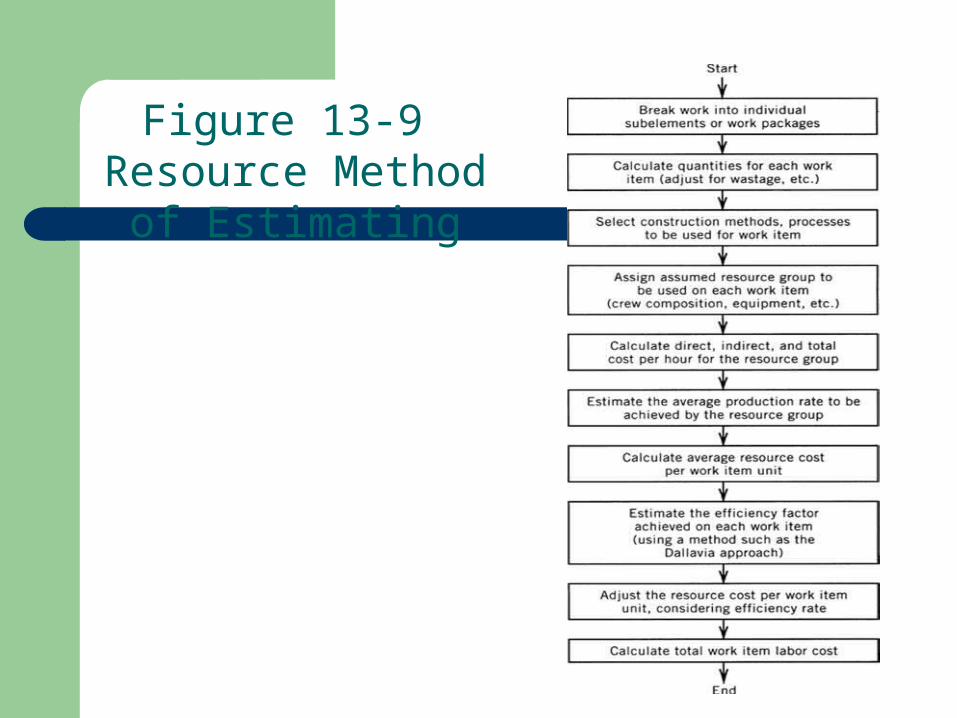
Figure 13-9 Resource Method of Estimating

Figure 13-10 Labor Resource Enumeration
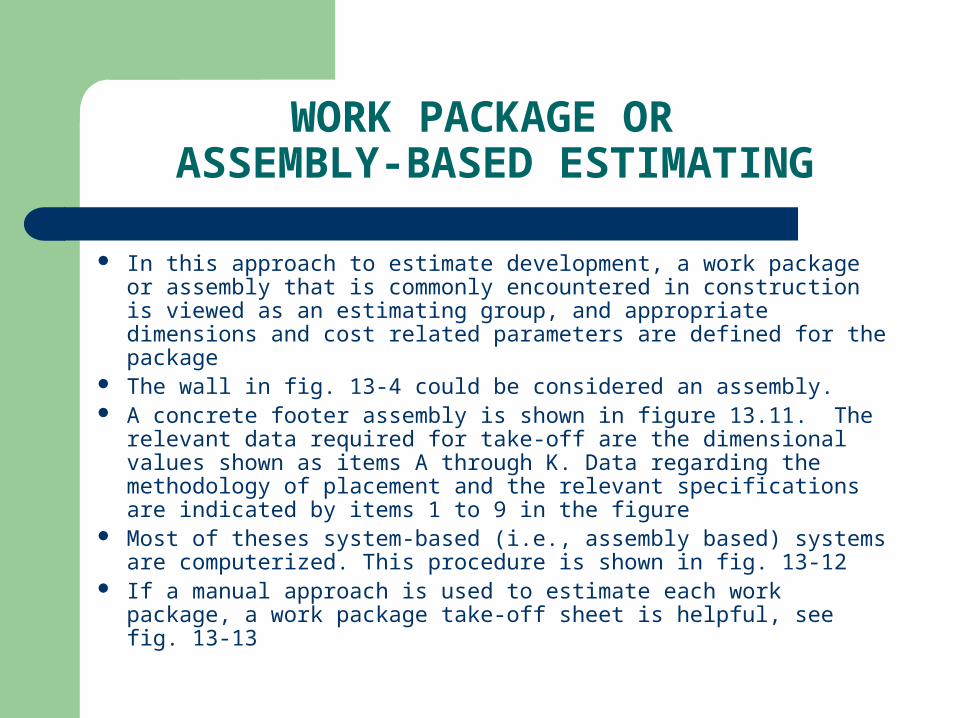
WORK PACKAGE OR ASSEMBLY-BASED ESTIMATING
In this approach to estimate development, a work package or assembly that is commonly encountered in construction is viewed as an estimating group, and appropriate dimensions and cost related parameters are defined for the package
The wall in fig. 13-4 could be considered an assembly. A concrete footer assembly is shown in figure 13.11. The
relevant data required for take-off are the dimensional values shown as items A through K. Data regarding the methodology of placement and the relevant specifications are indicated by items 1 to 9 in the figure
Most of theses system-based (i.e., assembly based) systems are computerized. This procedure is shown in fig. 13-12
If a manual approach is used to estimate each work package, a work package take-off sheet is helpful, see fig. 13-13
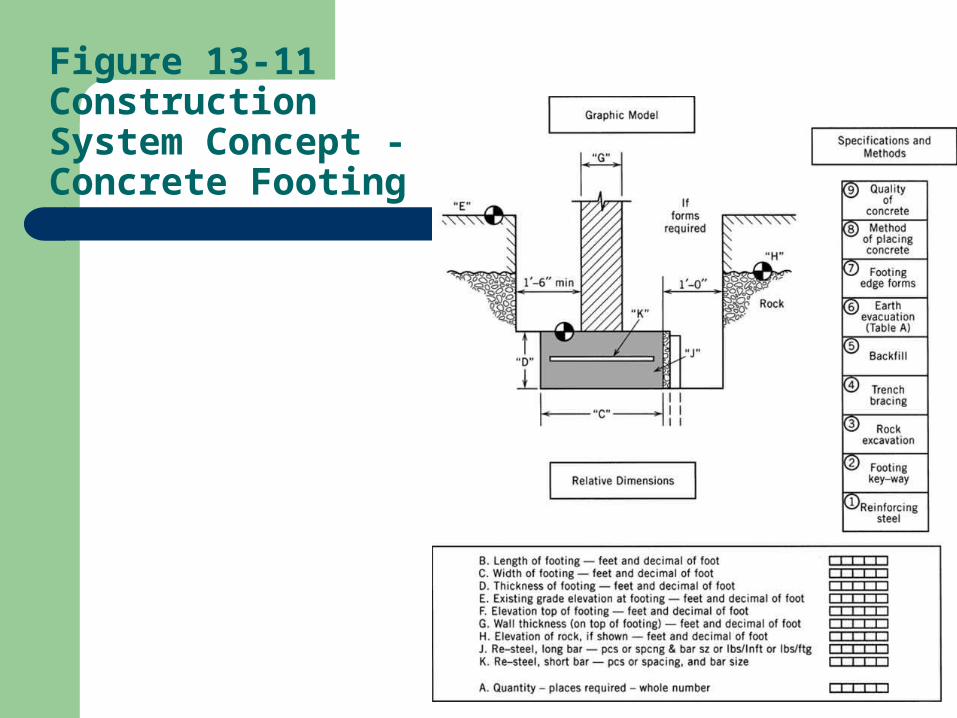
Figure 13-11 Construction System Concept - Concrete Footing
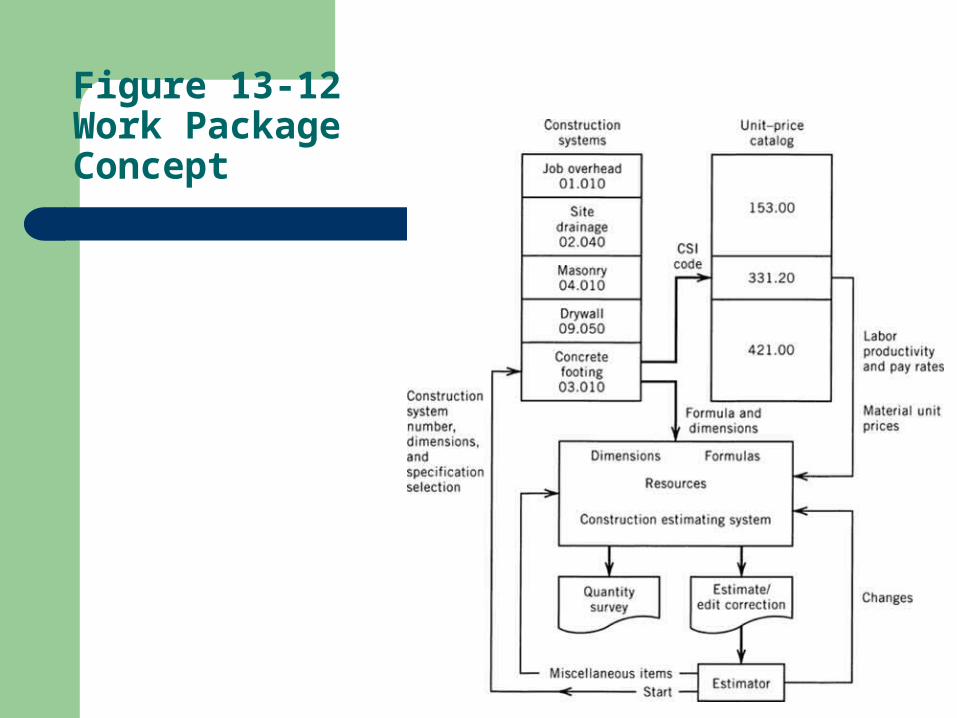
Figure 13-12 Work Package Concept
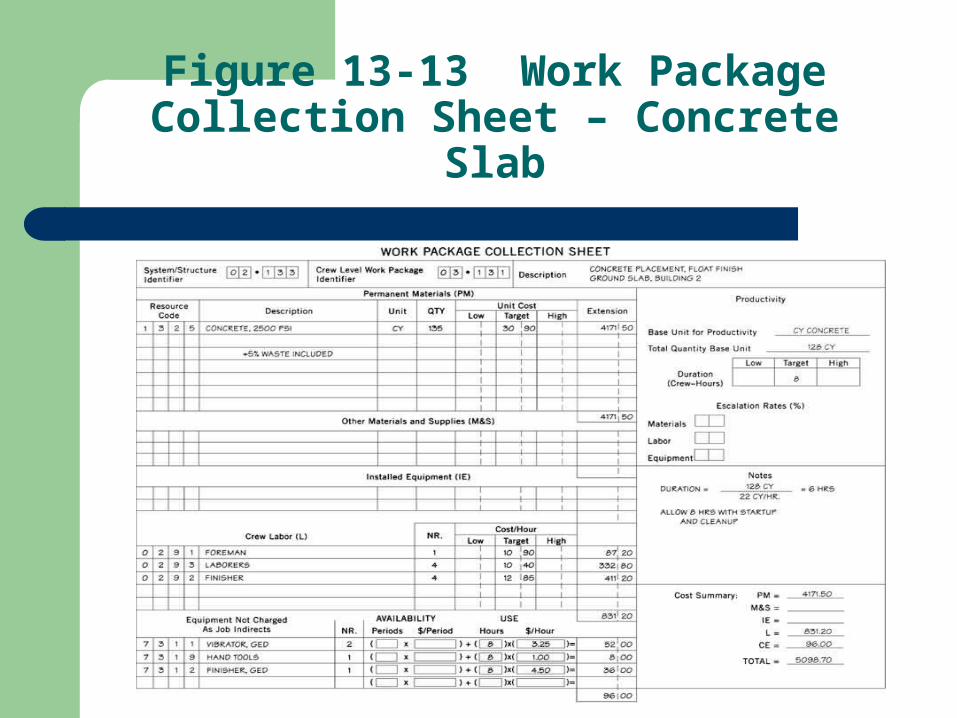
Figure 13-13 Work Package Collection Sheet – Concrete Slab
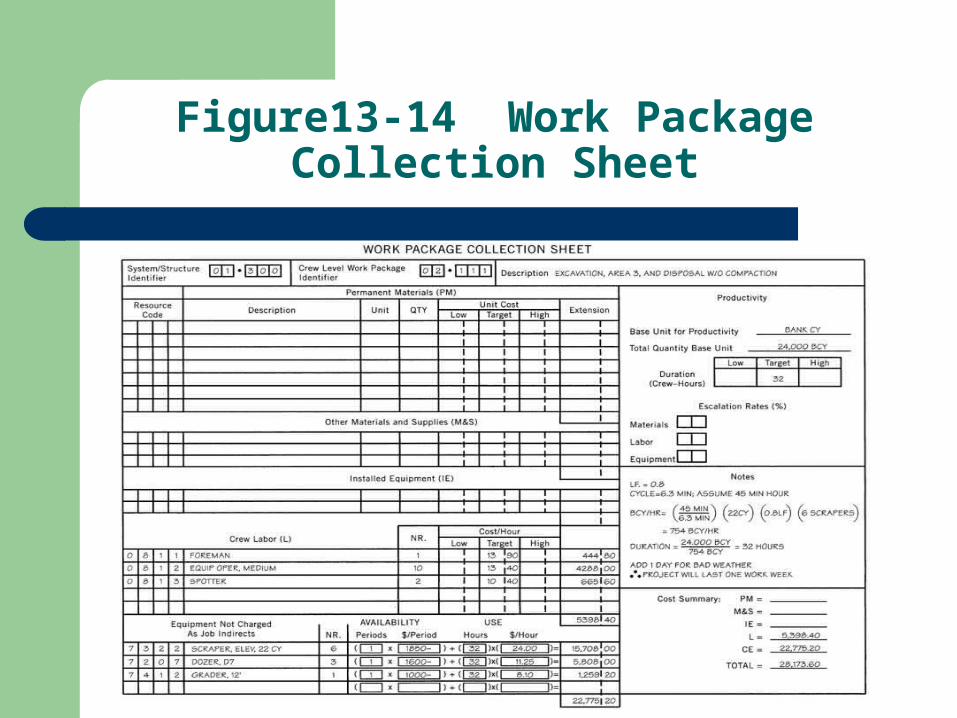
Figure13-14 Work Package Collection Sheet
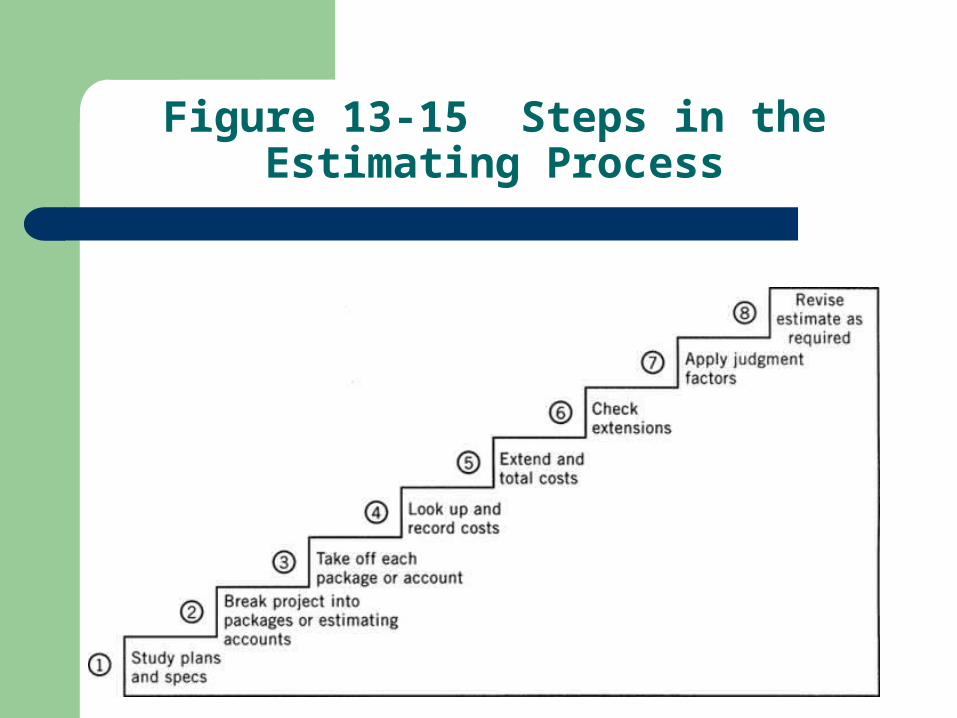
Figure 13-15 Steps in the Estimating Process


