39
Ch 9 • Perfect Competition
| Date post: | 22-Dec-2015 |
| Category: |
Documents |
| View: | 214 times |
| Download: | 0 times |

Ch 9
• Perfect Competition

Characteristics
• Fragmented
• Undifferentiated products
• Perfect information about prices
• equal Access to resources

Implications
• Price taker
• Law of one price
• Zero-profit in the long run

Economic Profit
• Economic profit vs account profit
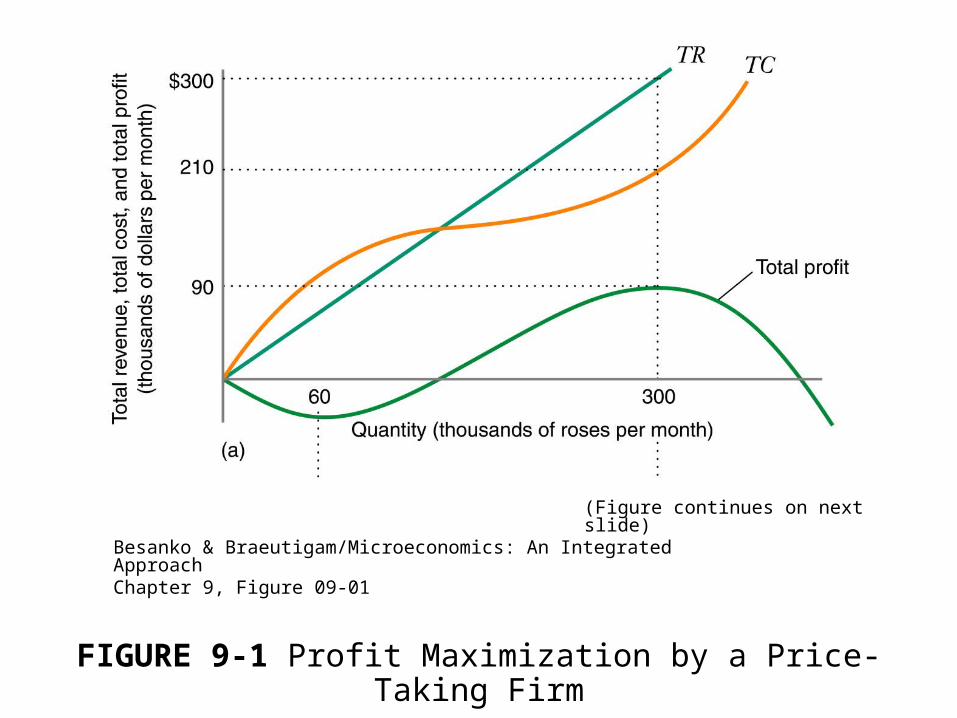
FIGURE 9-1 Profit Maximization by a Price-Taking Firm
Besanko & Braeutigam/Microeconomics: An Integrated ApproachChapter 9, Figure 09-01
(Figure continues on next slide)

FIGURE 9-1 (Continued)
Besanko & Braeutigam/Microeconomics: An Integrated ApproachChapter 9, Figure 09-01 continued

Costs
0,
0),()(
QWHENSFC
QWHENQTVCNSFCSFCQSTC

Supply curve
QNSFCQAVCPQAR
QQTVCNSFCQTRIFQ
QNSFCQAVCANSCPQAR
QTNSCQTVCNSFCQTRIFQ且QMCQMRP
/)()(
0:),()(,0
/)()(
)()()(,0
)()(

When fixed costs are all sunk
)()(
0:),()(,0
)()(
)()()(,0
)()(
QAVCPQAR
QQTVCQTRIFQ
QAVCPQAR
QTVCQTVCNSFCQTRIFQ且QMCQMRP
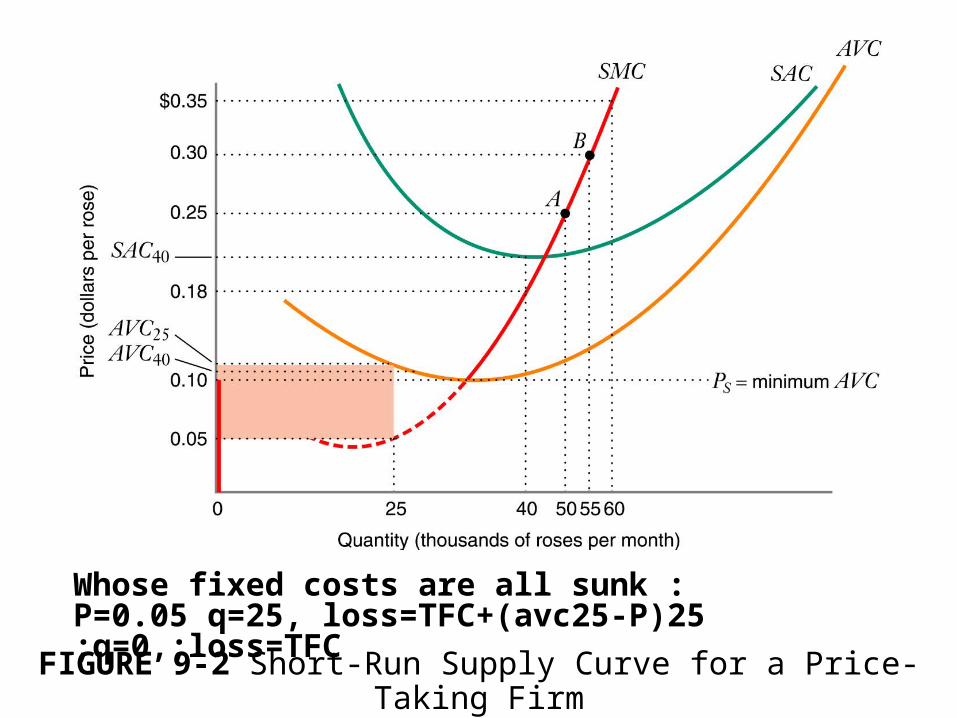
FIGURE 9-2 Short-Run Supply Curve for a Price-Taking Firm
Whose fixed costs are all sunk : P=0.05 q=25, loss=TFC+(avc25-P)25 ;q=0,;loss=TFC

FIGURE 9-3 Short-Run Supply Curve for a Firm withNonsunk Fixed Costs
P=0.15,q=35, 則 loss=TFC+35(ansc35-0.15)q=0,loss=TFC
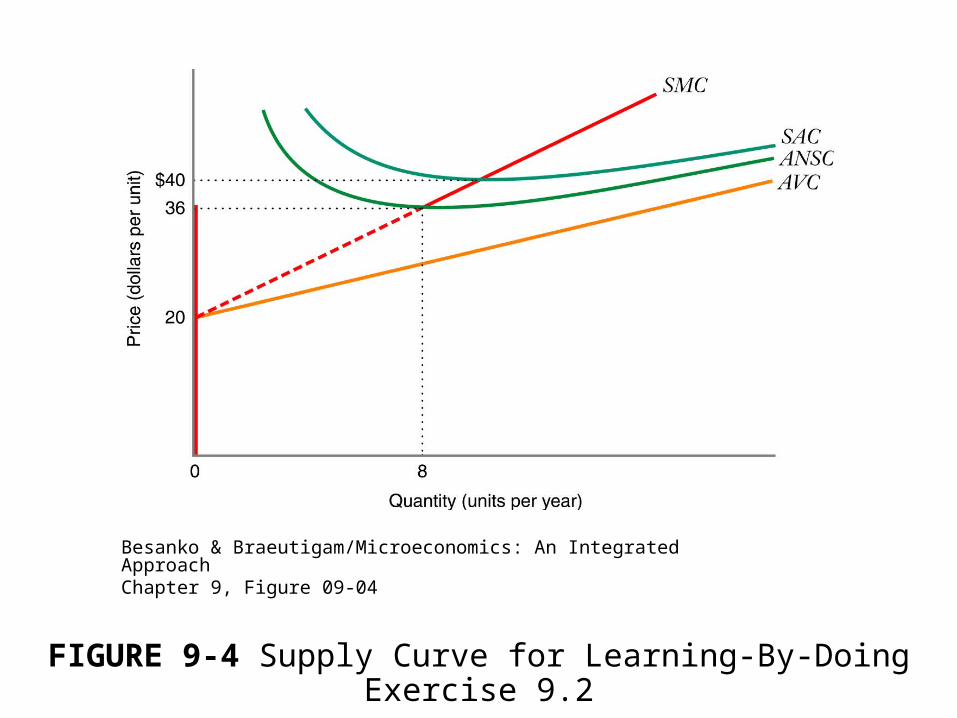
FIGURE 9-4 Supply Curve for Learning-By-Doing Exercise 9.2
Besanko & Braeutigam/Microeconomics: An Integrated ApproachChapter 9, Figure 09-04

FIGURE 9-5 Supply Curve for a U.S. Corn Farmer
Besanko & Braeutigam/Microeconomics: An Integrated ApproachChapter 9, Figure 09-05

SHORT-TUN MARKET SUPPLY CURVE

FIGURE 9-6 Short-Run Market Supply Curve
Besanko & Braeutigam/Microeconomics: An Integrated ApproachChapter 9, Figure 09-06
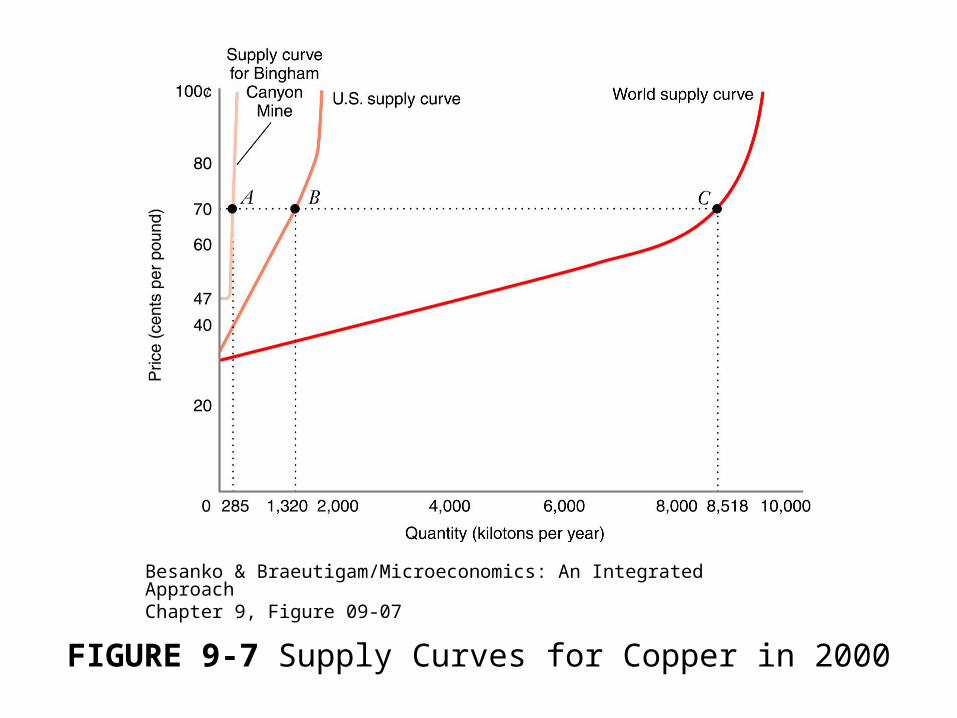
FIGURE 9-7 Supply Curves for Copper in 2000
Besanko & Braeutigam/Microeconomics: An Integrated ApproachChapter 9, Figure 09-07

FIGURE 9-8 Perfectly Inelastic and Perfectly Elastic Supply Curves
Besanko & Braeutigam/Microeconomics: An Integrated ApproachChapter 9, Figure 09-08

FIGURE 9-9 Short-Run Equilibrium
Besanko & Braeutigam/Microeconomics: An Integrated ApproachChapter 9, Figure 09-09
Comparative Static

FIGURE 9-10 Comparative Statics Analysis: Increase in the Number of Firms
Besanko & Braeutigam/Microeconomics: An Integrated ApproachChapter 9, Figure 09-10
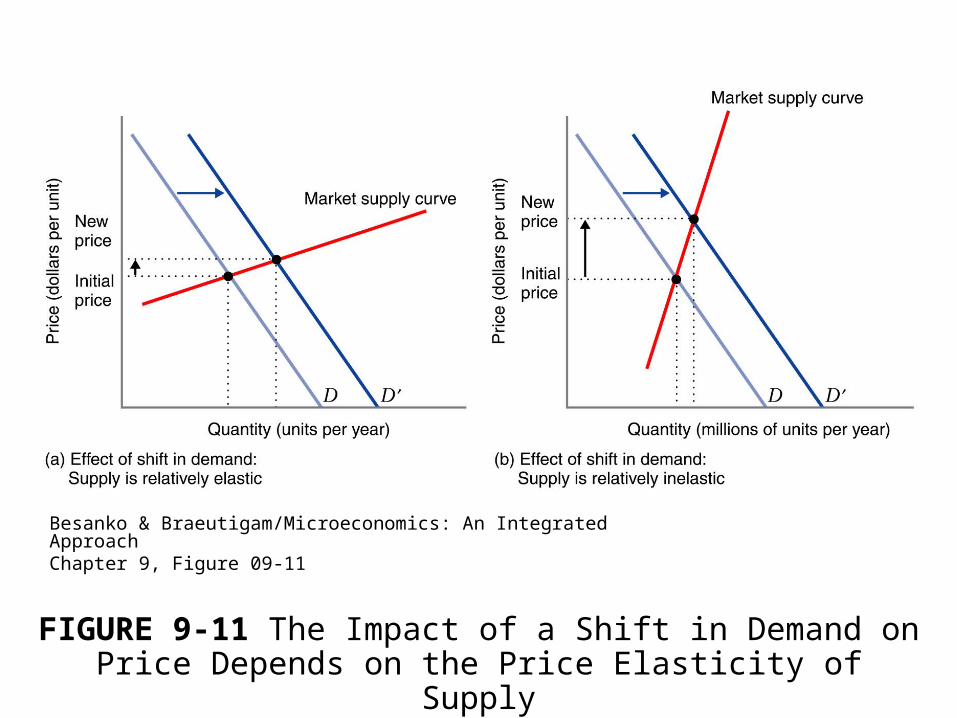
FIGURE 9-11 The Impact of a Shift in Demand on Price Depends on the Price Elasticity of Supply
Besanko & Braeutigam/Microeconomics: An Integrated ApproachChapter 9, Figure 09-11

FIGURE 9-12 The Short-Run Supply Curve for Roses
Besanko & Braeutigam/Microeconomics: An Integrated ApproachChapter 9, Figure 09-12
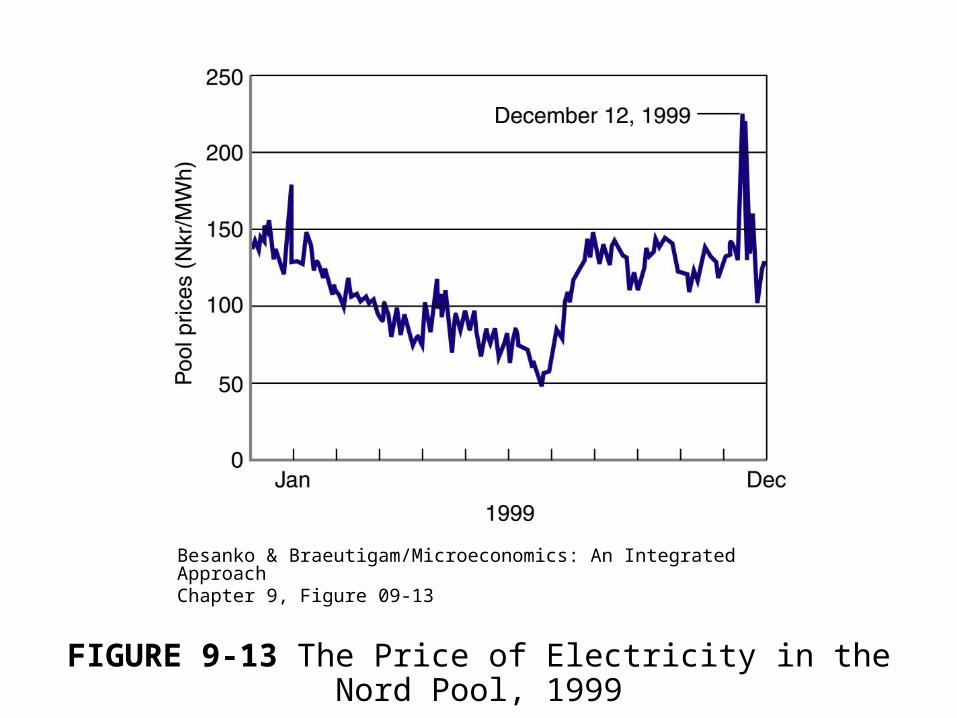
FIGURE 9-13 The Price of Electricity in the Nord Pool, 1999
Besanko & Braeutigam/Microeconomics: An Integrated ApproachChapter 9, Figure 09-13
Long-run output and plant-size adjustments

FIGURE 9-14 Long-Run Output and Plant Size Adjustment by a Price-Taking Firm
Besanko & Braeutigam/Microeconomics: An Integrated ApproachChapter 9, Figure 09-14
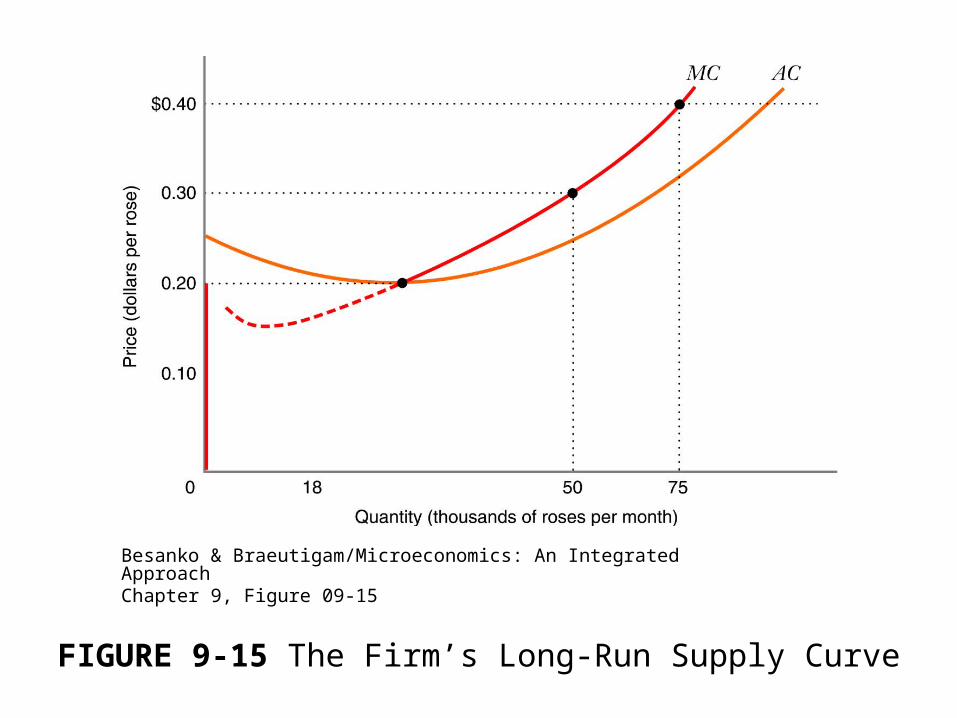
FIGURE 9-15 The Firm’s Long-Run Supply Curve
Besanko & Braeutigam/Microeconomics: An Integrated ApproachChapter 9, Figure 09-15

Free entry and long-run equilibrium

FIGURE 9-16 Long-Run Equilibrium in a PerfectlyCompetitive Market
Besanko & Braeutigam/Microeconomics: An Integrated ApproachChapter 9, Figure 09-16
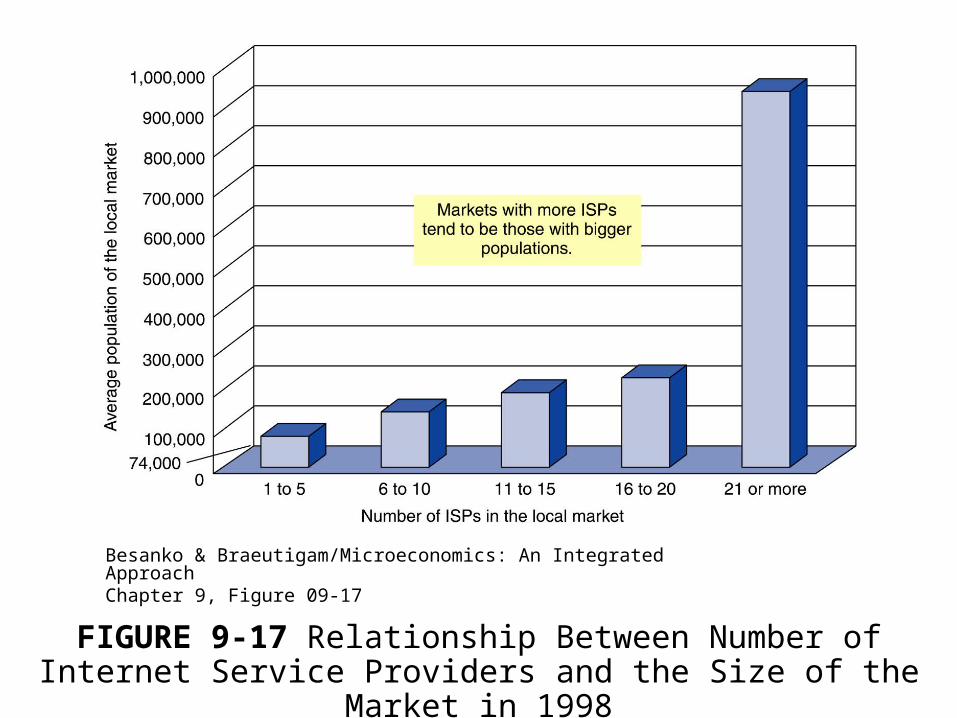
FIGURE 9-17 Relationship Between Number of Internet Service Providers and the Size of the Market in 1998
Besanko & Braeutigam/Microeconomics: An Integrated ApproachChapter 9, Figure 09-17

Long-run market supply curves
• Input prices changes
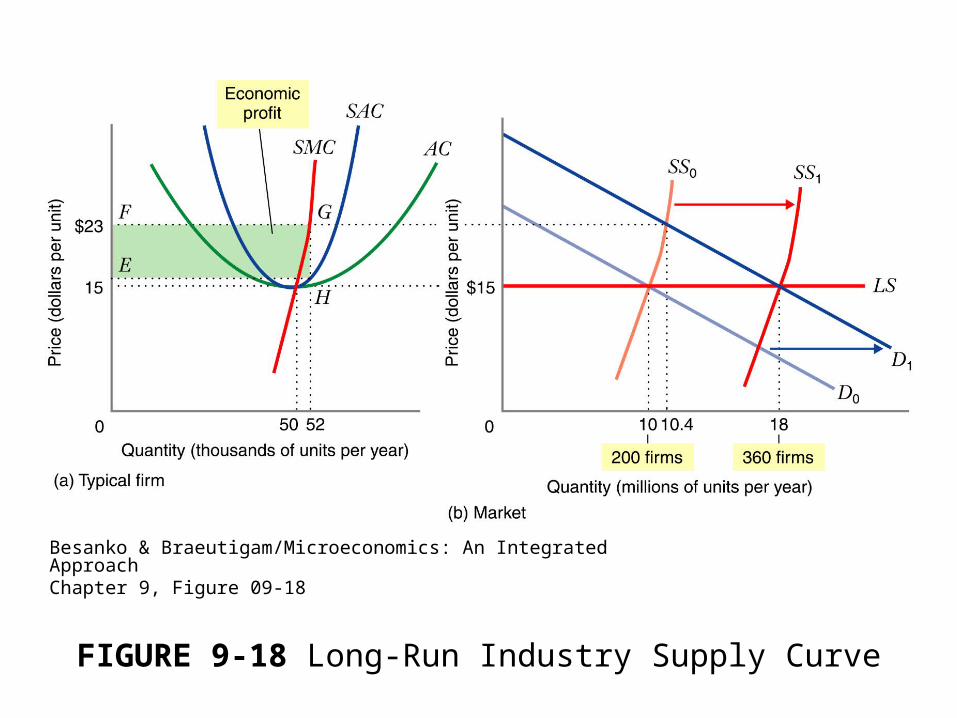
FIGURE 9-18 Long-Run Industry Supply Curve
Besanko & Braeutigam/Microeconomics: An Integrated ApproachChapter 9, Figure 09-18

FIGURE 9-19 Spot Price to Charter a Supertanker, January1973-March 1976
Besanko & Braeutigam/Microeconomics: An Integrated ApproachChapter 9, Figure 09-19

FIGURE 9-20 The Collapse of the Oil Tanker Market, 1973–1975
Besanko & Braeutigam/Microeconomics: An Integrated ApproachChapter 9, Figure 09-20

FIGURE 9-21 Long-Run Industry Supply Curve in anIncreasing-Cost Industry
Besanko & Braeutigam/Microeconomics: An Integrated ApproachChapter 9, Figure 09-21

FIGURE 9-22 Economic Rent
Besanko & Braeutigam/Microeconomics: An Integrated ApproachChapter 9, Figure 09-22
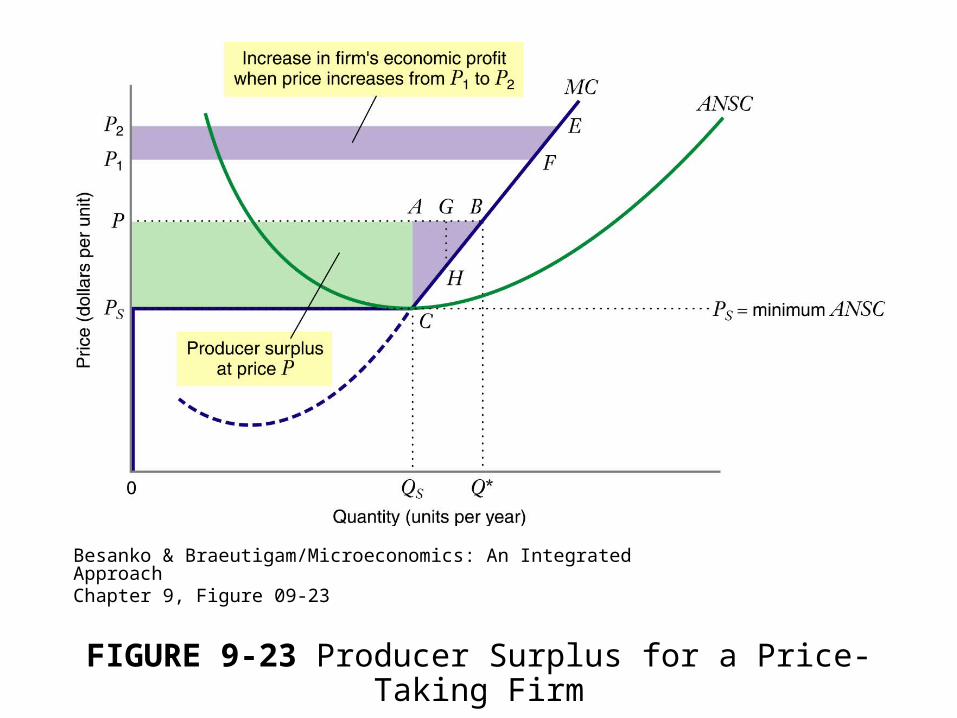
FIGURE 9-23 Producer Surplus for a Price-Taking Firm
Besanko & Braeutigam/Microeconomics: An Integrated ApproachChapter 9, Figure 09-23
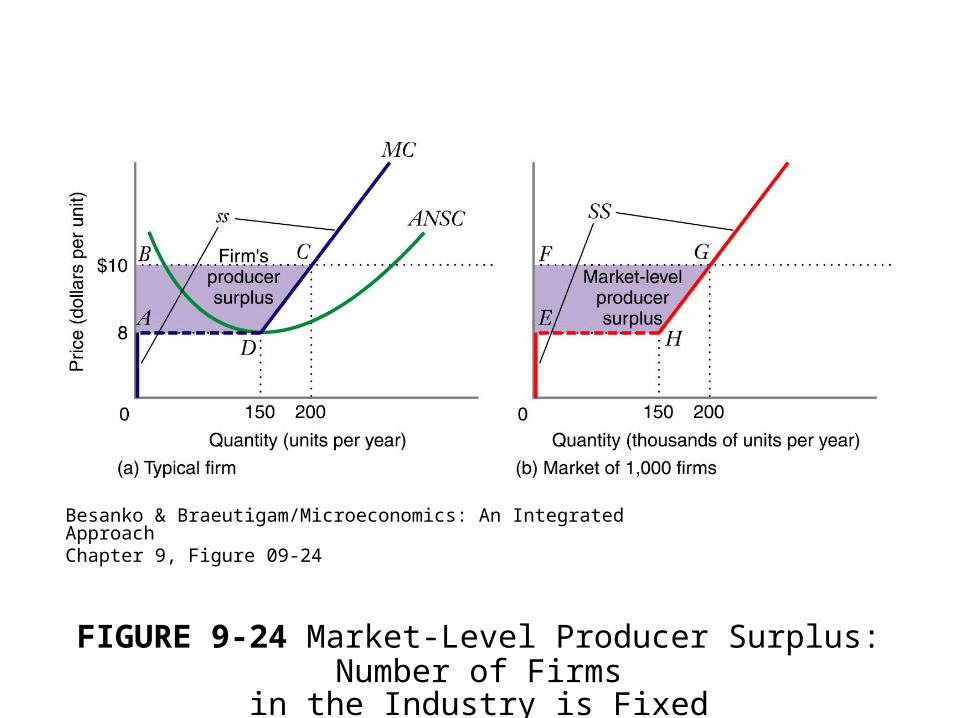
FIGURE 9-24 Market-Level Producer Surplus: Number of Firmsin the Industry is Fixed
Besanko & Braeutigam/Microeconomics: An Integrated ApproachChapter 9, Figure 09-24
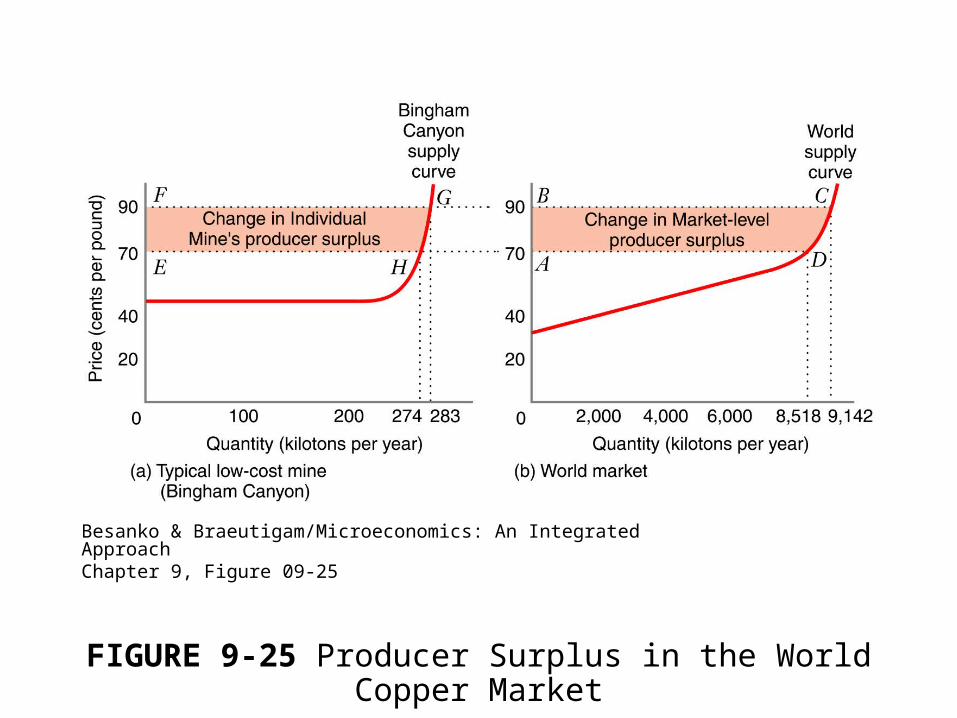
FIGURE 9-25 Producer Surplus in the World Copper Market
Besanko & Braeutigam/Microeconomics: An Integrated ApproachChapter 9, Figure 09-25
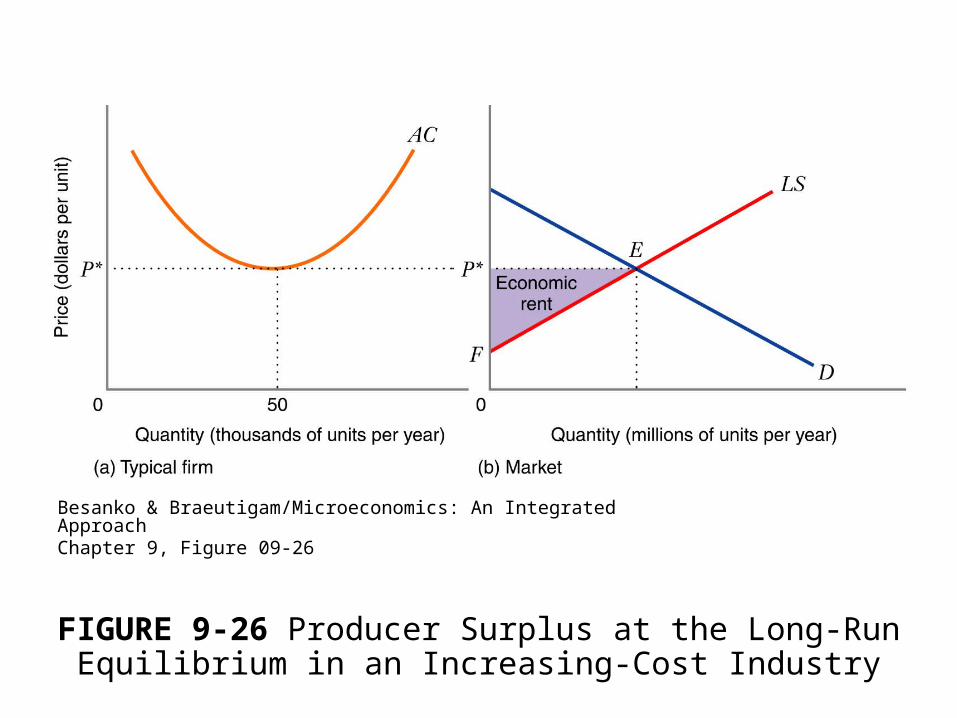
FIGURE 9-26 Producer Surplus at the Long-Run Equilibrium in an Increasing-Cost Industry
Besanko & Braeutigam/Microeconomics: An Integrated ApproachChapter 9, Figure 09-26


![Papillary thyroid carcinoma coexists with undifferentiated ... · Papillary thyroid carcinoma (PTC) is the commonest thyroid carcinoma worldwide [1], while undifferentiated thyroid](https://static.documents.pub/doc/80x56/605714f9a806da25134f71a8/papillary-thyroid-carcinoma-coexists-with-undifferentiated-papillary-thyroid.jpg)


