29
McGraw-Hill/Irwin Copyright © 2008 by The McGraw-Hill Companies, Inc. All rights reserved. Chapter 1 Introduction to Supply Chain Management
McGraw-Hill/Irwin Copyright © 2008 by The McGraw-Hill Companies, Inc. All rights reserved.
Chapter 1
Introduction toSupply Chain Management
1-2
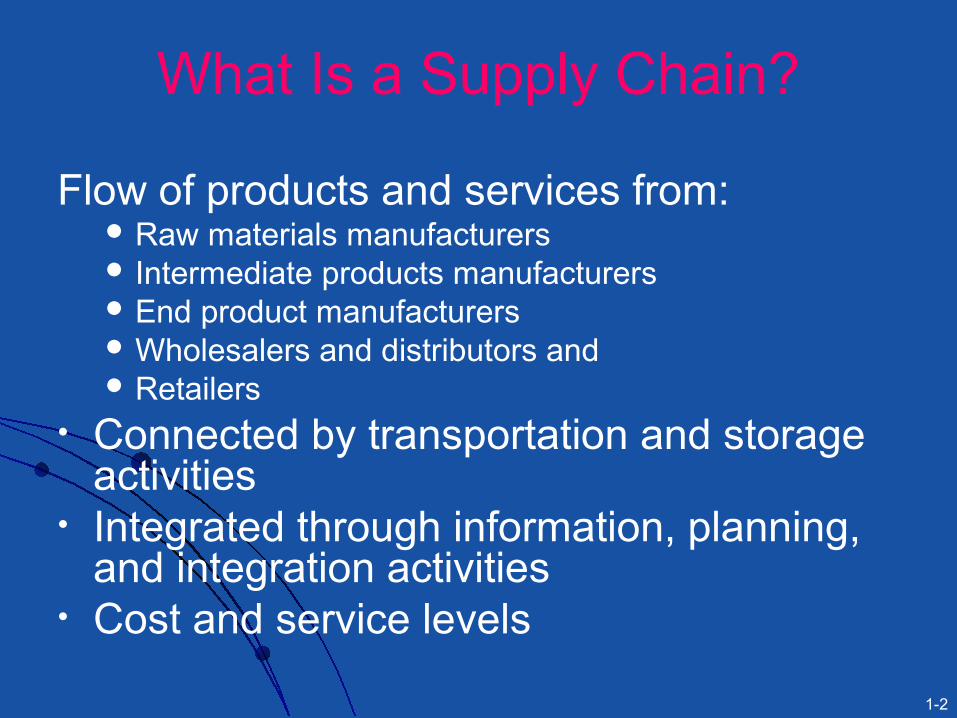
What Is a Supply Chain?
Flow of products and services from: Raw materials manufacturers Intermediate products manufacturers End product manufacturers Wholesalers and distributors and Retailers
• Connected by transportation and storage activities
• Integrated through information, planning, and integration activities
• Cost and service levels
1-3
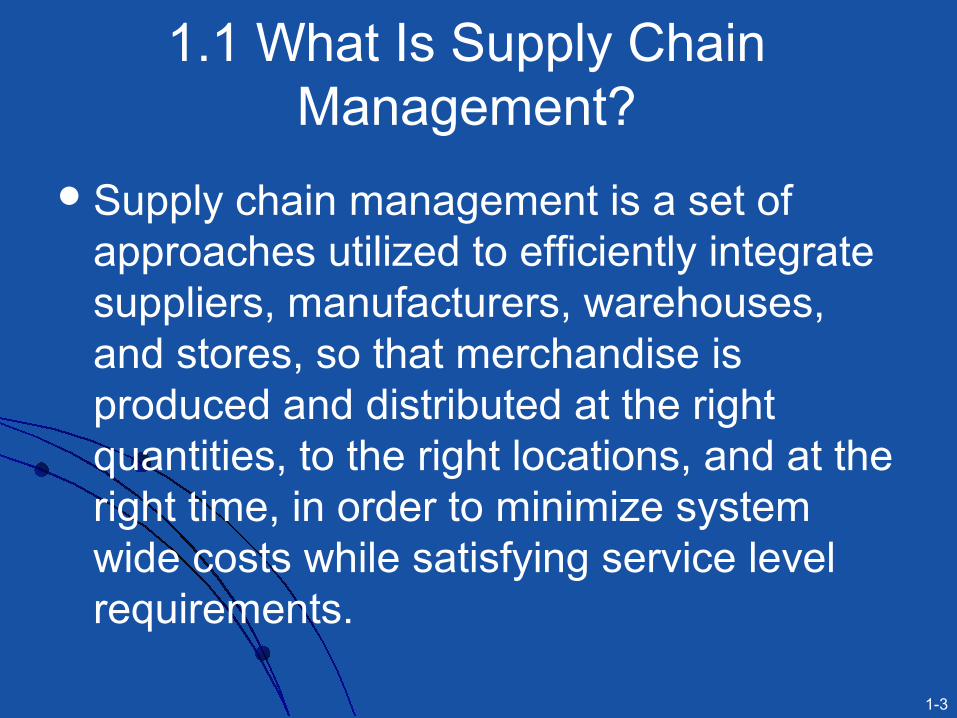
1.1 What Is Supply Chain Management?
Supply chain management is a set of approaches utilized to efficiently integrate suppliers, manufacturers, warehouses, and stores, so that merchandise is produced and distributed at the right quantities, to the right locations, and at the right time, in order to minimize system wide costs while satisfying service level requirements.
1-4
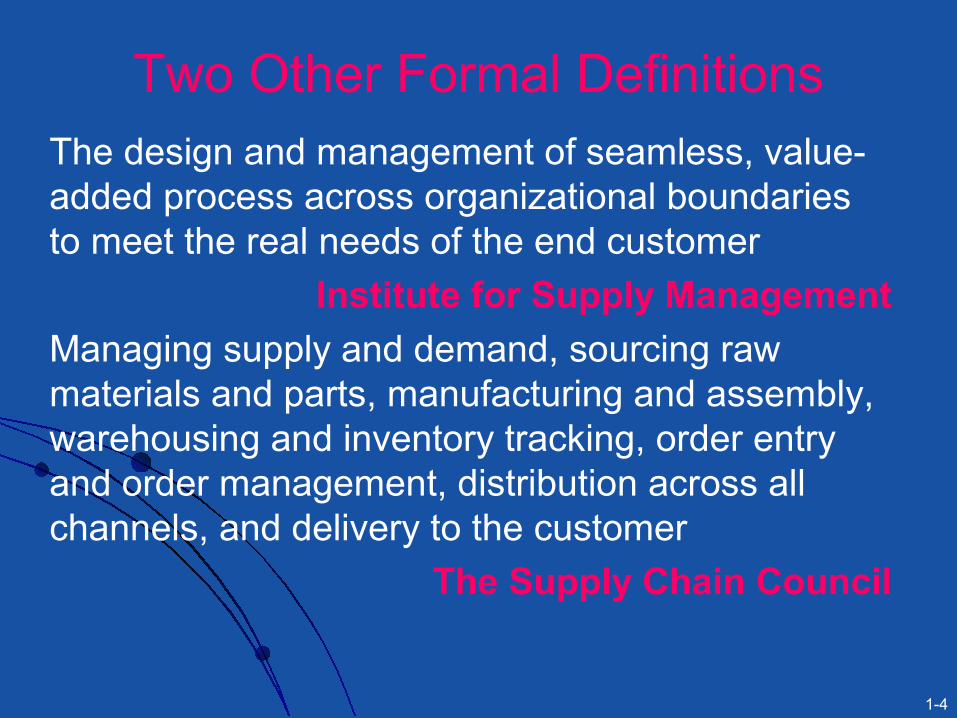
Two Other Formal DefinitionsThe design and management of seamless, value-added process across organizational boundaries to meet the real needs of the end customer
Institute for Supply Management
Managing supply and demand, sourcing raw materials and parts, manufacturing and assembly, warehousing and inventory tracking, order entry and order management, distribution across all channels, and delivery to the customer
The Supply Chain Council
1-5
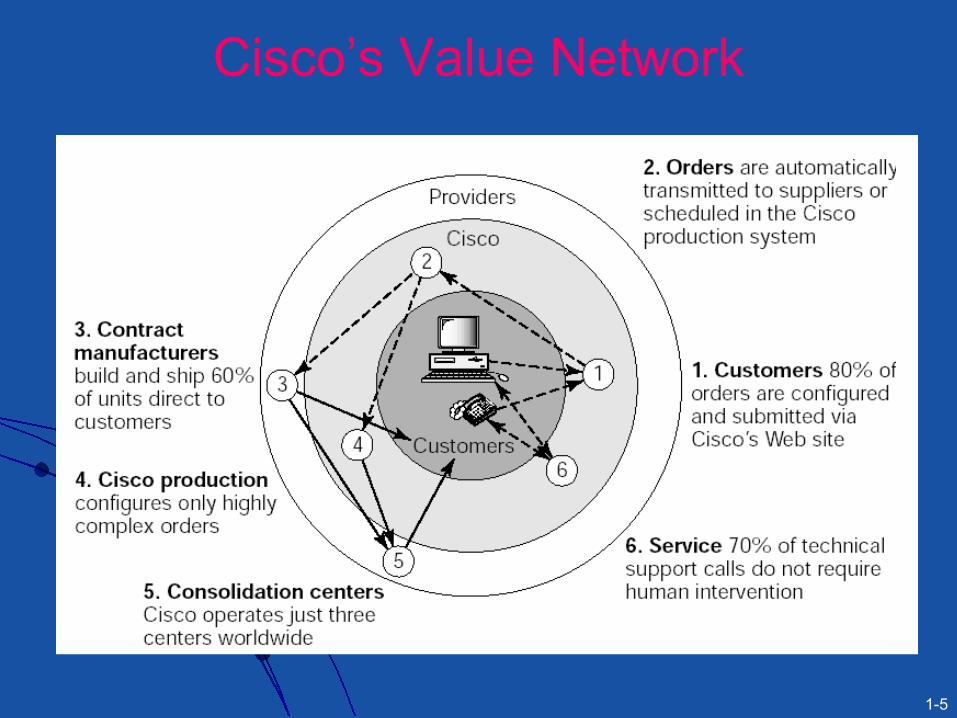
Cisco’s Value Network
1-6
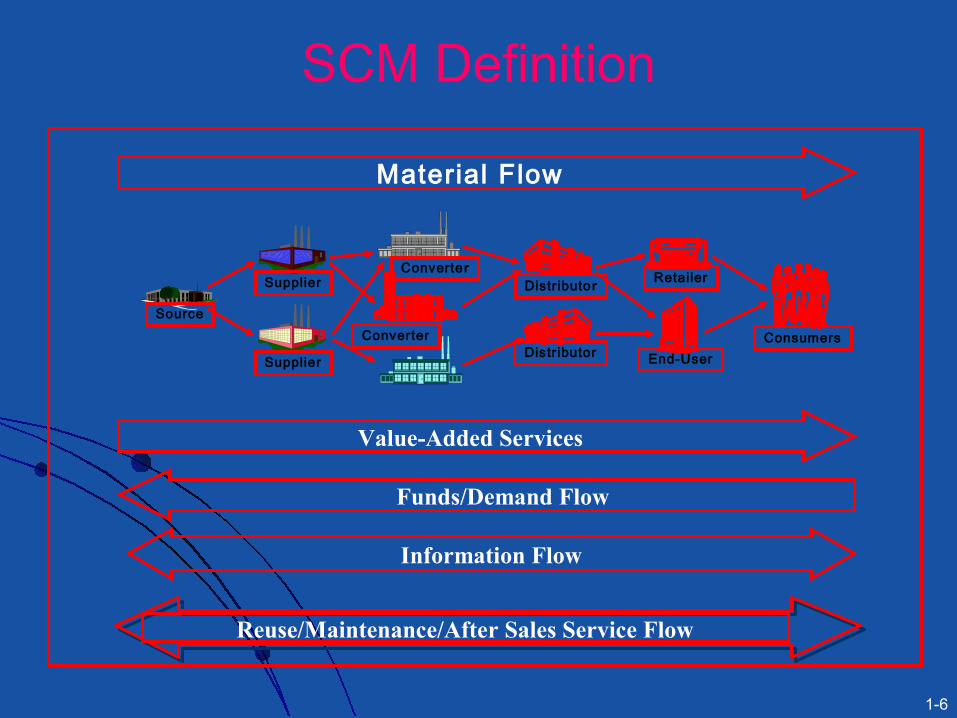
Source
Supplier
Supplier
Distr ibutor
Distributor
Retailer
End-User
Converter
Converter Consumers
Information Flow
Funds/Demand Flow
Value-Added Services
Material Flow
Reuse/Maintenance/After Sales Service Flow
SCM Definition
1-7
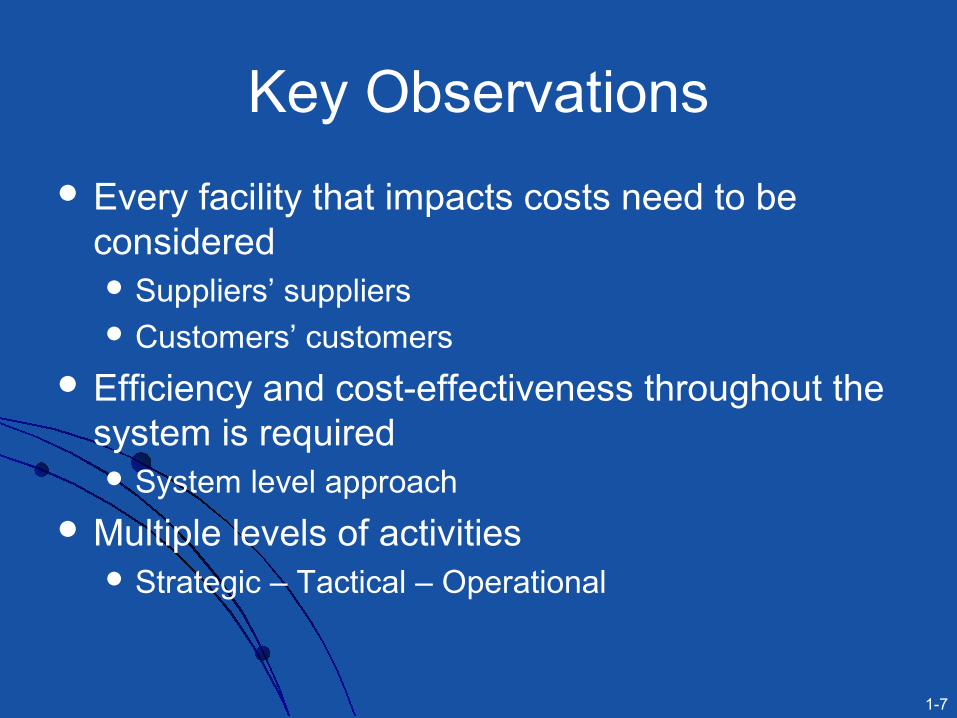
Key Observations
Every facility that impacts costs need to be considered Suppliers’ suppliers Customers’ customers
Efficiency and cost-effectiveness throughout the system is required System level approach
Multiple levels of activities Strategic – Tactical – Operational
1-8
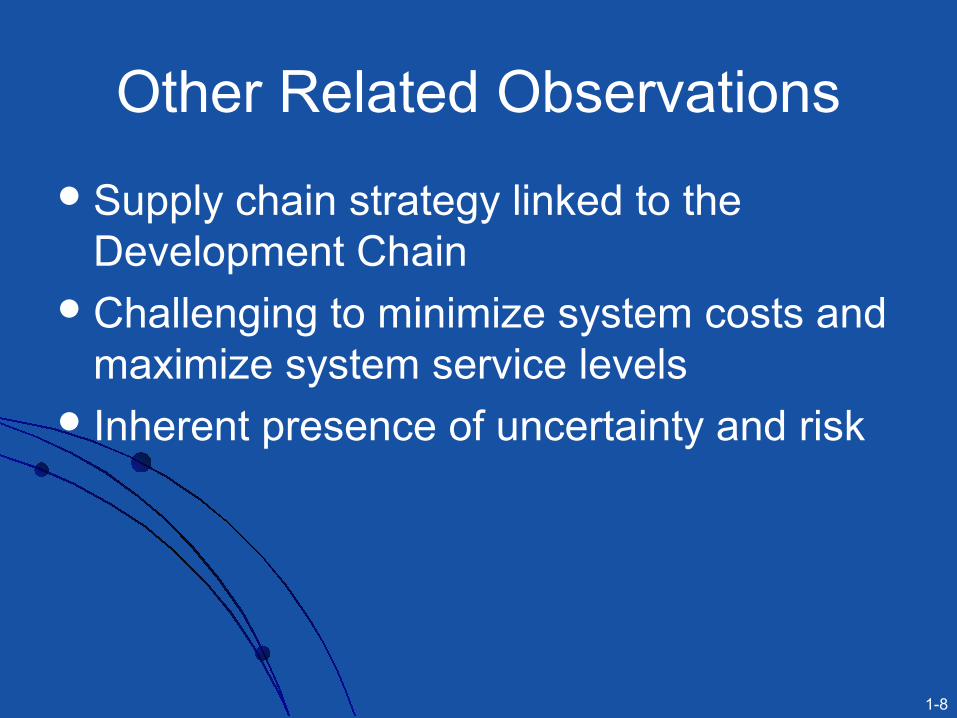
Other Related Observations
Supply chain strategy linked to the Development Chain
Challenging to minimize system costs and maximize system service levels
Inherent presence of uncertainty and risk
1-9
Set of activities and processes associated with new product introduction. Includes:product design phaseassociated capabilities and knowledge sourcing decisionsproduction plans
1.2 The Development Chain
1-10
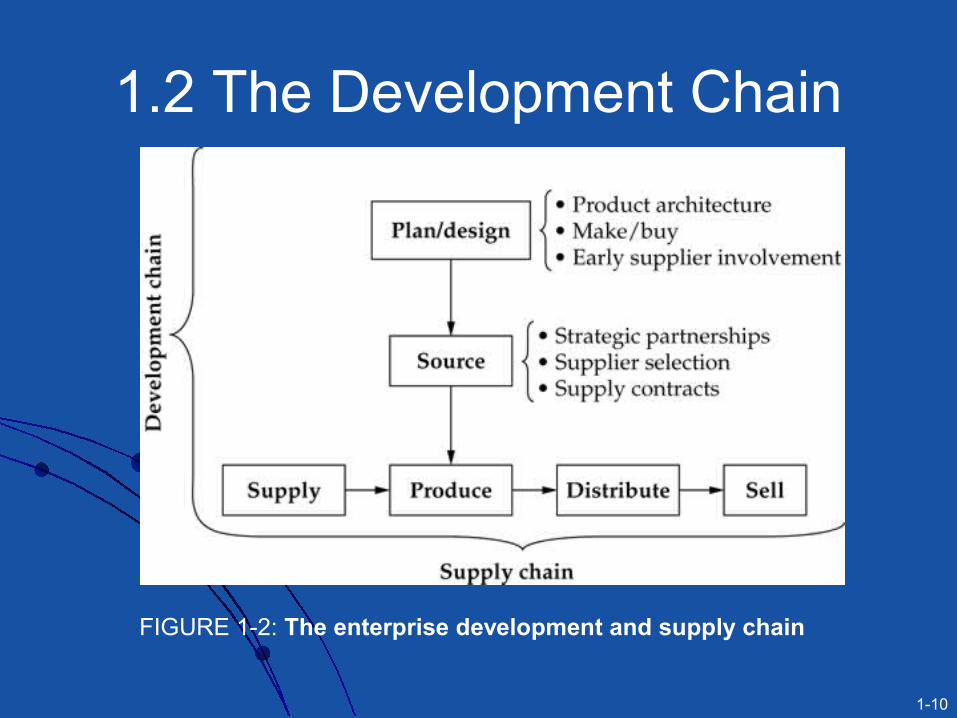
1.2 The Development Chain
FIGURE 1-2: The enterprise development and supply chain
1-11
1.3 Global Optimization
Geographically dispersed complex network
Conflicting objectives of different facilitiesDynamic system
Variations over timeMatching demand-supply difficultDifferent levels of inventory and backorders
Recent developments have increased risksLean production/Off-shoring/Outsourcing
1-12
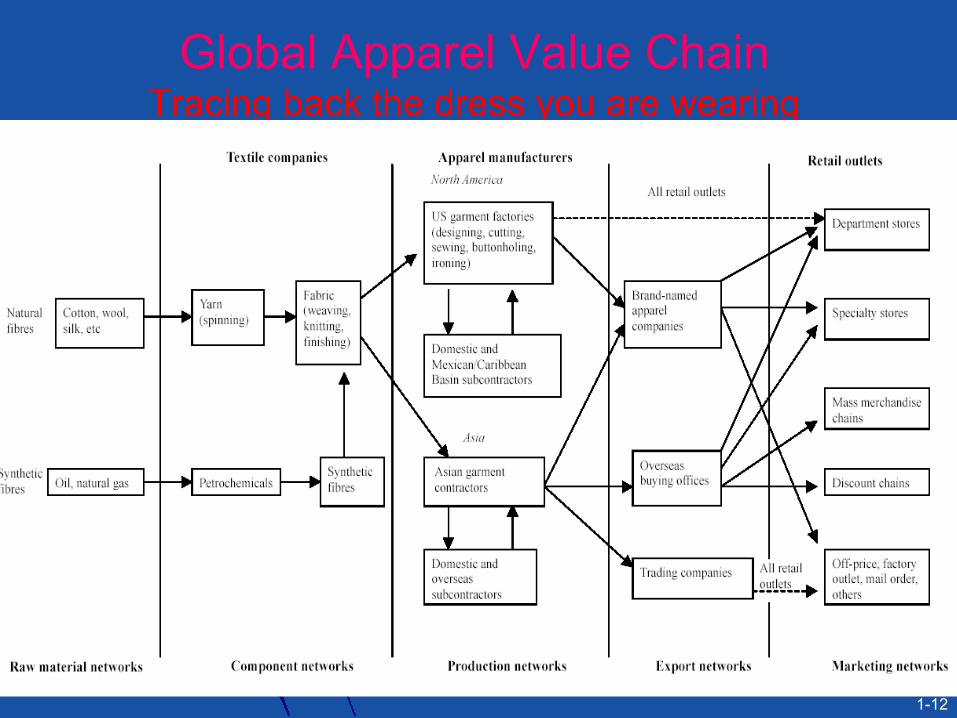
Global Apparel Value ChainTracing back the dress you are wearing
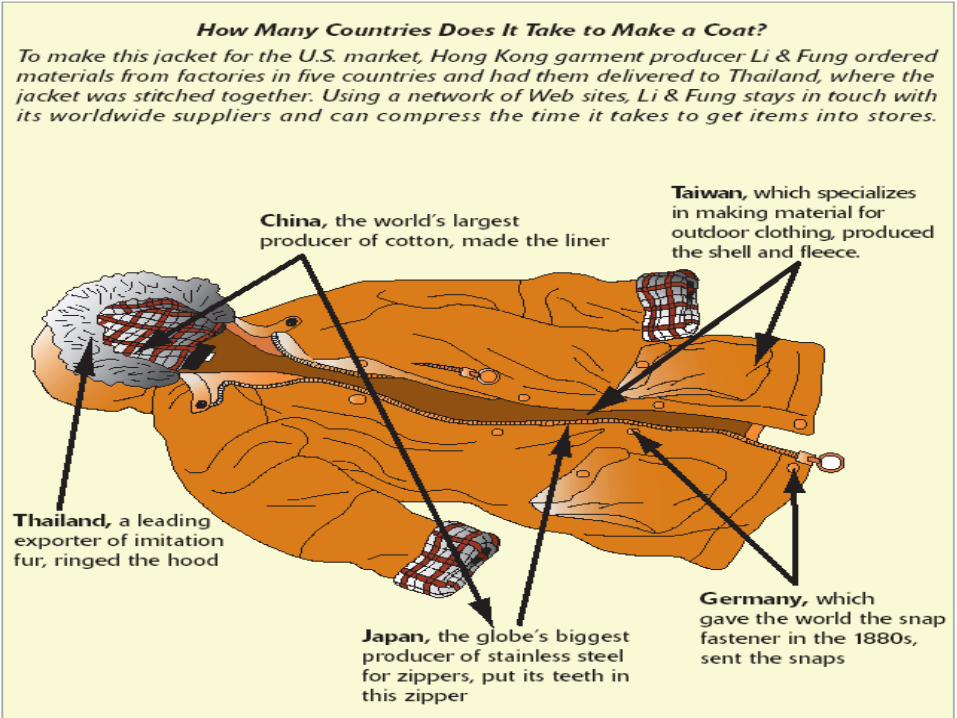
1-13
1-14
QC
& S
hip
pin
g[H
ong K
ong]
QC
& S
hip
pin
g[H
ong K
ong]
Prod
uc t D
esig n[H
ong K
ong]
Prod
uc t D
esig n[H
ong K
ong]
Zip
per s+
…[Jap
an+
…]
Zip
per s+
…[Jap
an+
…]
Sti
tch
ing
[In
don
esia
]
Sti
tch
ing
[In
don
esia
]W
eavi
ng
[Tai
wa n
]
Wea
vin
g[T
aiw
a n]
Yar
n S
pin
nin
g[K
orea
]
Yar
n S
pin
nin
g[K
orea
]
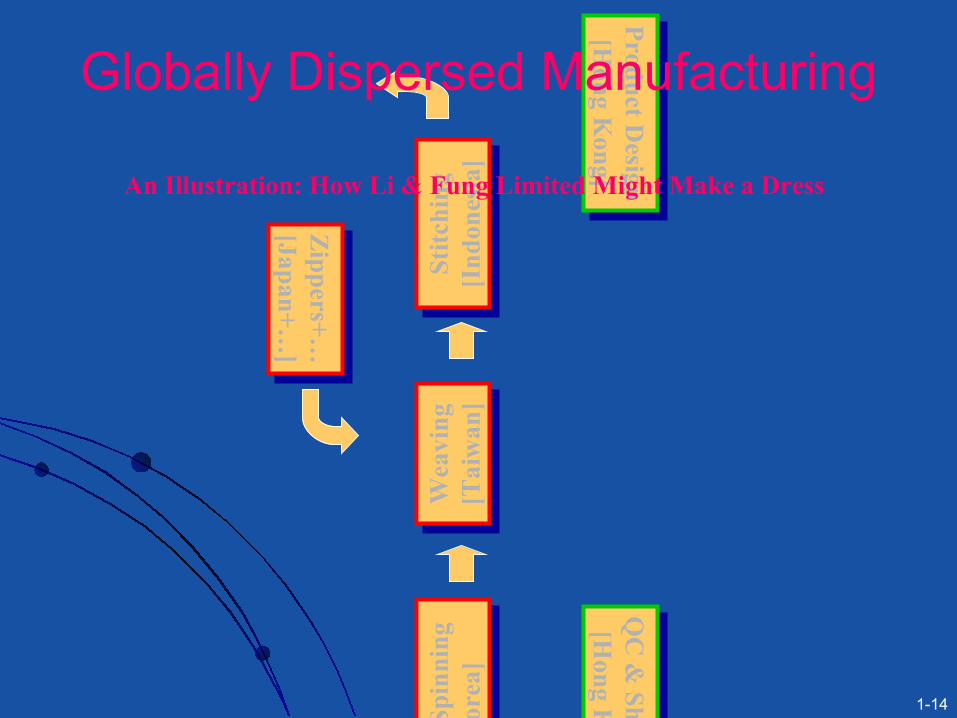
An Illustration: How Li & Fung Limited Might Make a Dress
Globally Dispersed Manufacturing
1-15
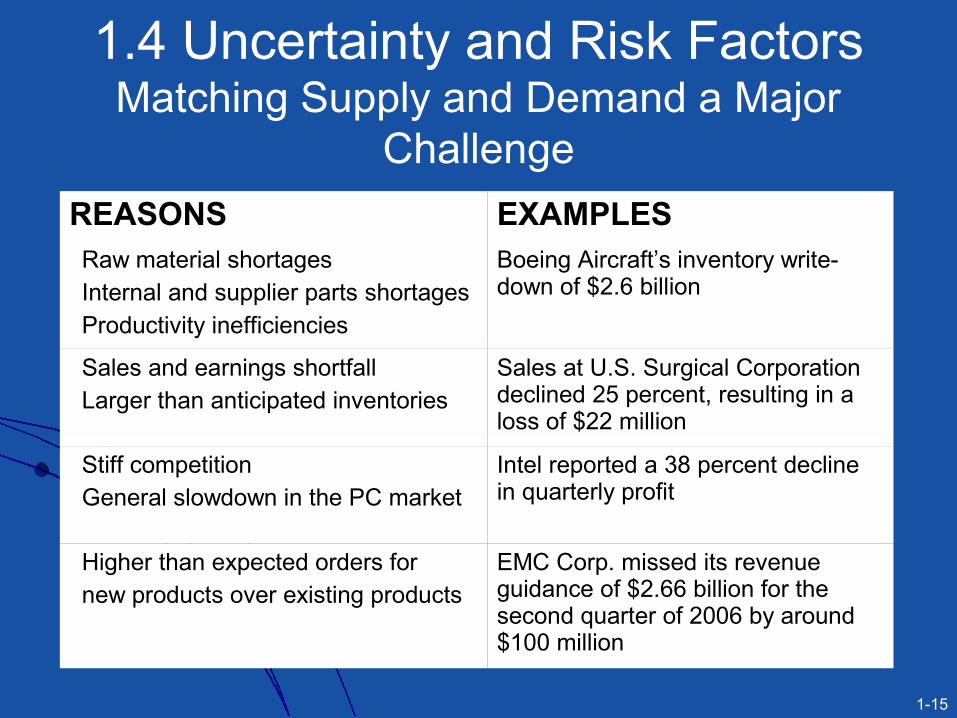
1.4 Uncertainty and Risk FactorsMatching Supply and Demand a Major
Challenge
REASONS EXAMPLES
•Raw material shortages
•Internal and supplier parts shortages
•Productivity inefficiencies
Boeing Aircraft’s inventory write-down of $2.6 billion
•Sales and earnings shortfall
•Larger than anticipated inventories Sales at U.S. Surgical Corporation declined 25 percent, resulting in a loss of $22 million
•Stiff competition
•General slowdown in the PC marketIntel reported a 38 percent decline in quarterly profit
•Higher than expected orders for
•new products over existing productsEMC Corp. missed its revenue guidance of $2.66 billion for the second quarter of 2006 by around $100 million
1-16
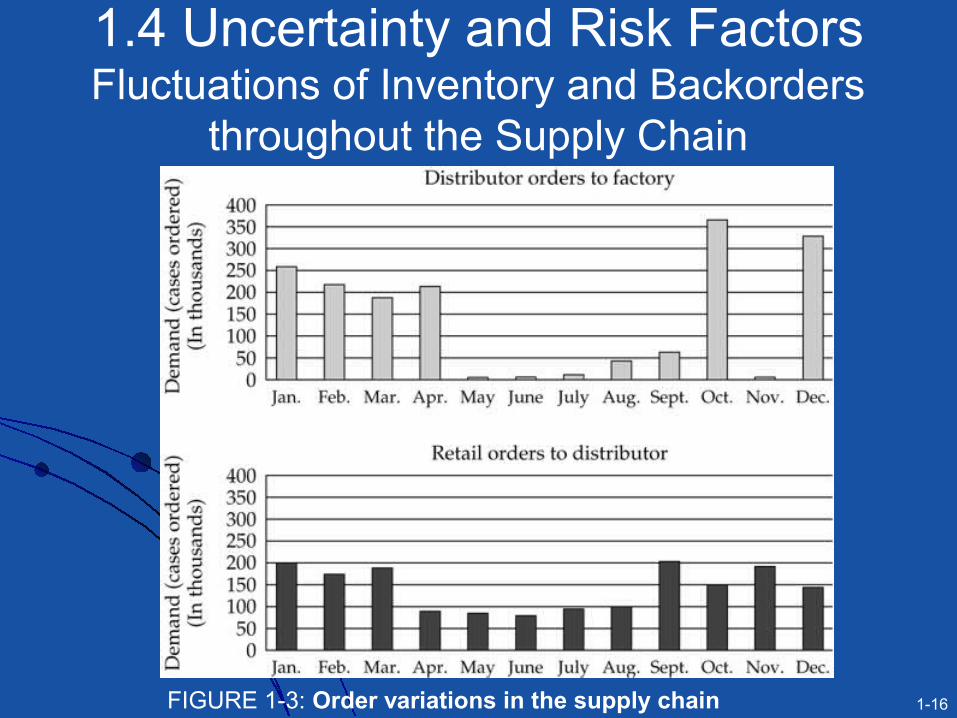
1.4 Uncertainty and Risk FactorsFluctuations of Inventory and Backorders
throughout the Supply Chain
FIGURE 1-3: Order variations in the supply chain
1-17
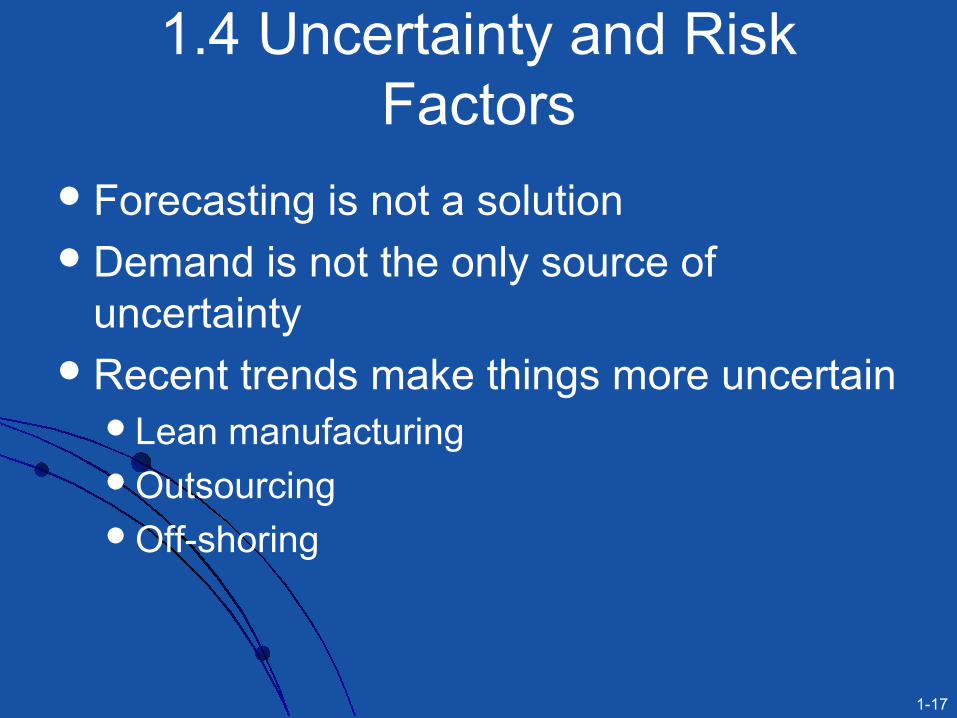
Forecasting is not a solutionDemand is not the only source of
uncertaintyRecent trends make things more uncertain
Lean manufacturingOutsourcingOff-shoring
1.4 Uncertainty and Risk Factors
1-18
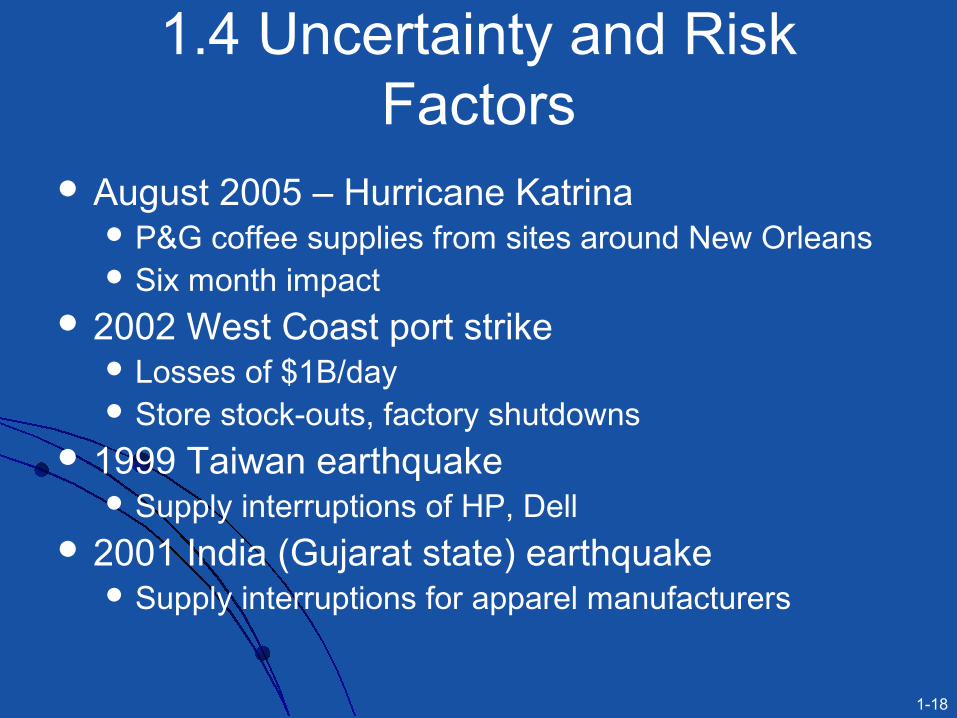
August 2005 – Hurricane Katrina P&G coffee supplies from sites around New Orleans Six month impact
2002 West Coast port strike Losses of $1B/day Store stock-outs, factory shutdowns
1999 Taiwan earthquake Supply interruptions of HP, Dell
2001 India (Gujarat state) earthquake Supply interruptions for apparel manufacturers
1.4 Uncertainty and Risk Factors
1-19
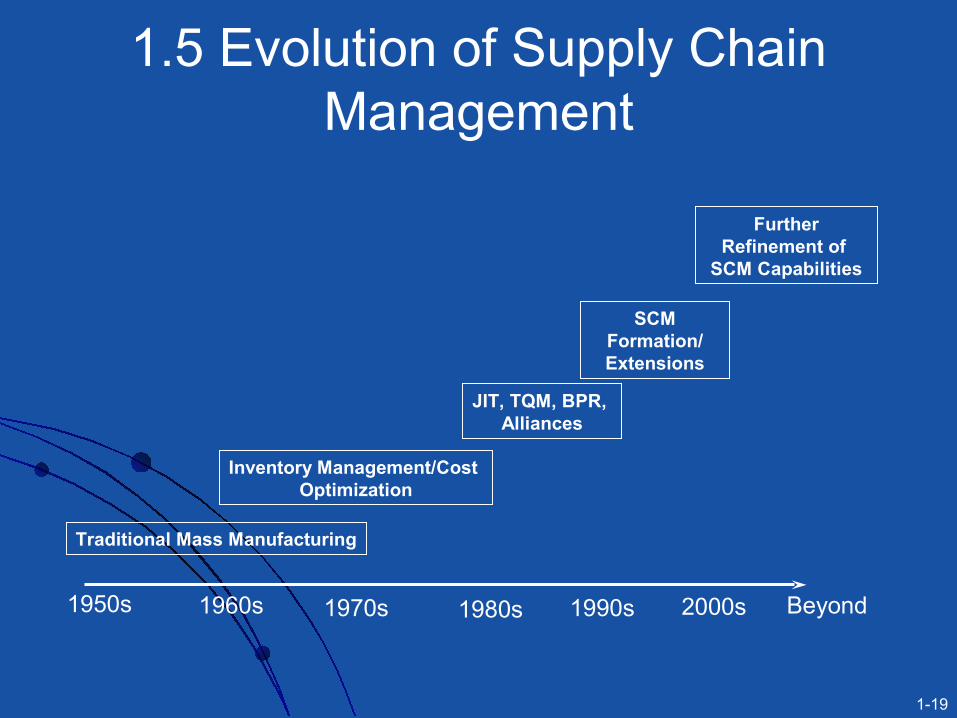
1.5 Evolution of Supply Chain Management
1950s 1960s 1970s 1980s 1990s 2000s Beyond
Traditional Mass Manufacturing
Inventory Management/Cost Optimization
JIT, TQM, BPR, Alliances
SCM Formation/Extensions
Further Refinement of
SCM Capabilities
1-20
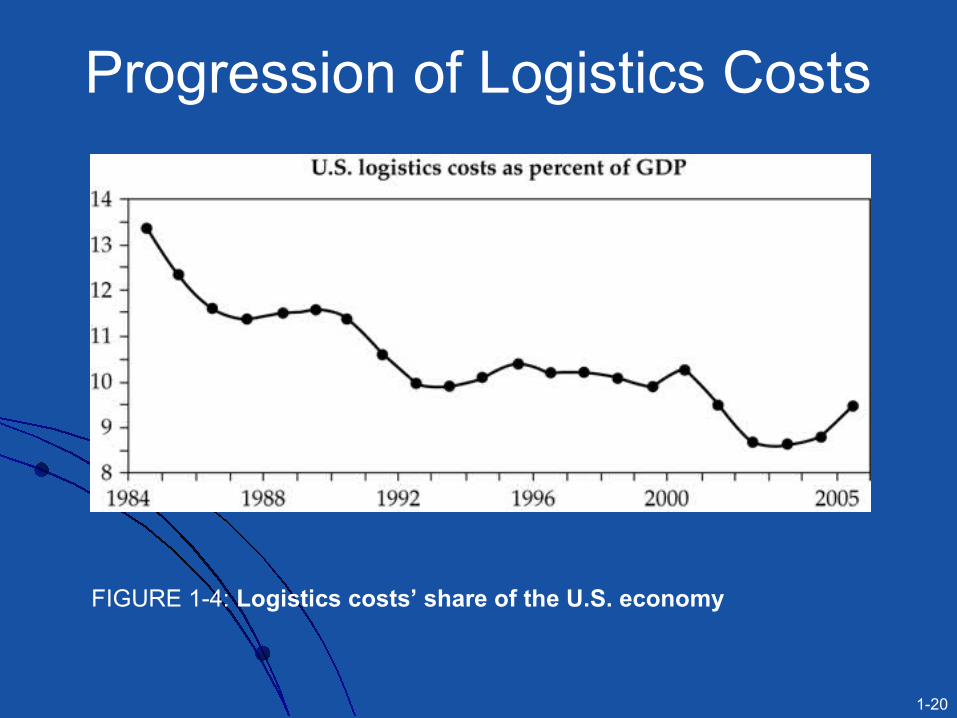
Progression of Logistics Costs
FIGURE 1-4: Logistics costs’ share of the U.S. economy
1-21
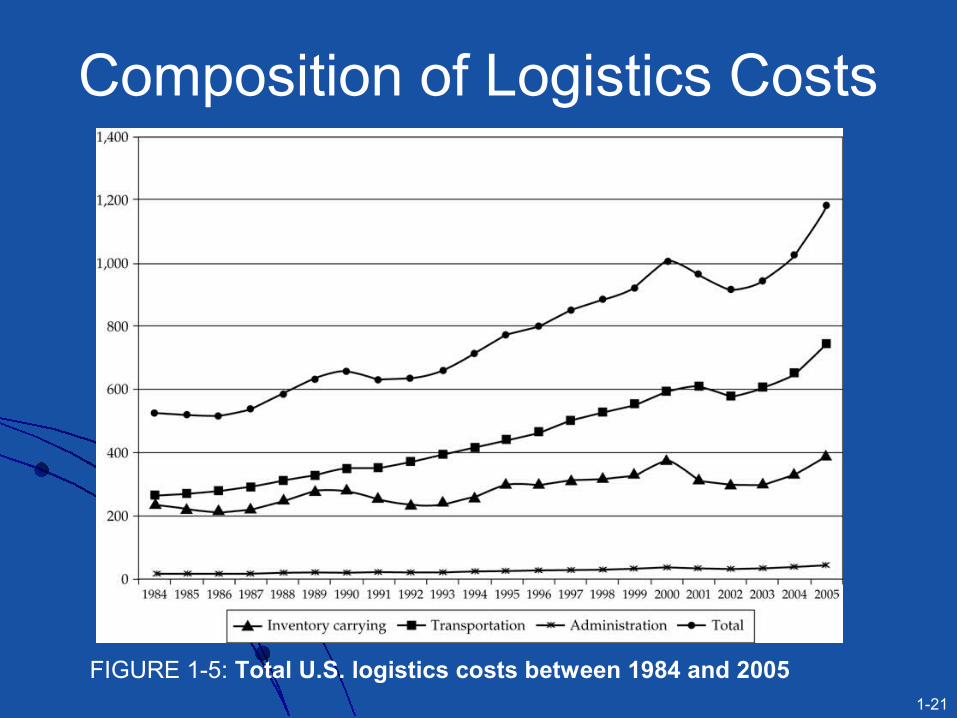
Composition of Logistics Costs
FIGURE 1-5: Total U.S. logistics costs between 1984 and 2005
1-22
1.6 Complexity: The Magnitude
U.S. companies spend more than $1 trillion in supply-related activities (10-15% of Gross Domestic Product) Transportation 58% Inventory 38% Management 4%
The grocery industry could save $30 billion (10% of operating cost) by using effective logistics strategies
A typical box of cereal spends 104 days getting from factory to supermarket.
A typical new car spends 15 days traveling from the factory to the dealership.
1-23
Complexity: The Magnitude Compaq computer’s loss of $500 million to $1 billion in
sales in one year
Laptops and desktops were not available when and where customers were ready to buy them
Boeing’s forced announcement of write-downs of $2.6b Raw material shortages, internal and supplier parts
shortages….
Cisco’s multi-billion ($2.2b) dollar write-off of inventories in 2001-2002 Customers balked on orders due to market meltdown
1-24
Transactional ComplexityNational Semiconductors:
• Production:– Produces chips in six different locations: four in the US, one in
Britain and one in Israel– Chips are shipped to seven assembly locations in Southeast
Asia.• Distribution
– The final product is shipped to hundreds of facilities all over the world
– 20,000 different routes– 12 different airlines are involved– 95% of the products are delivered within 45 days– 5% are delivered within 90 days.
1-25
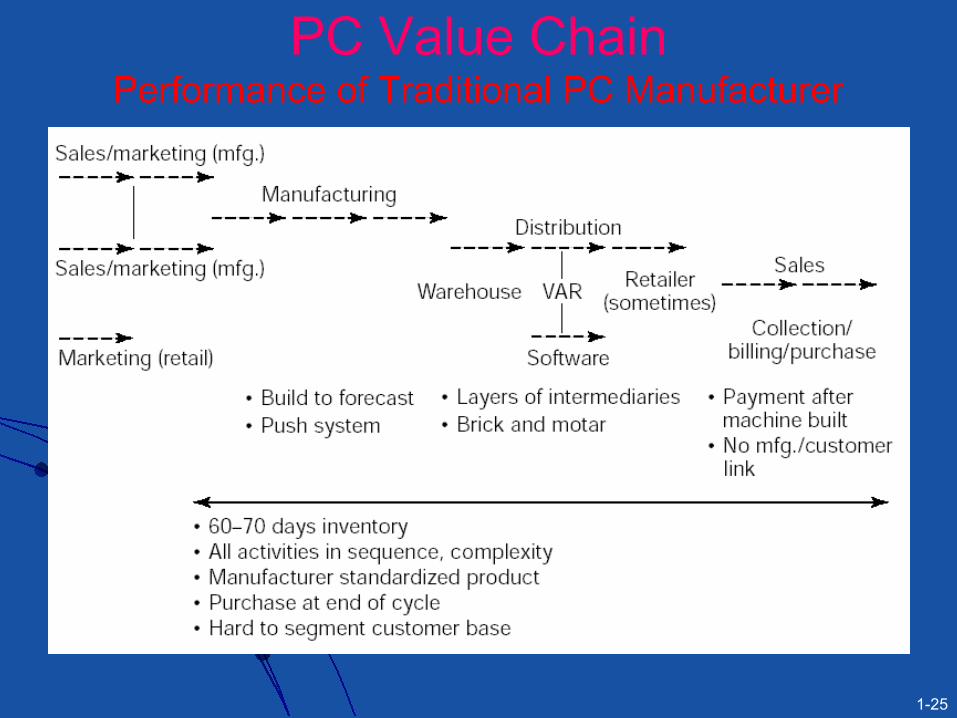
PC Value ChainPerformance of Traditional PC Manufacturer
1-26
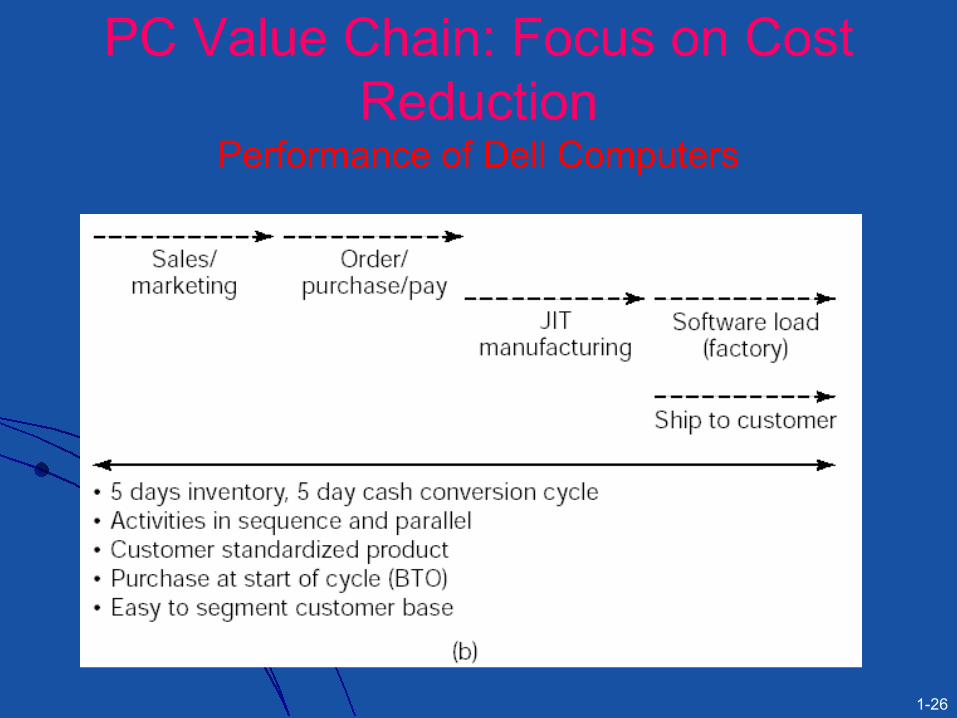
PC Value Chain: Focus on Cost Reduction
Performance of Dell Computers
1-27
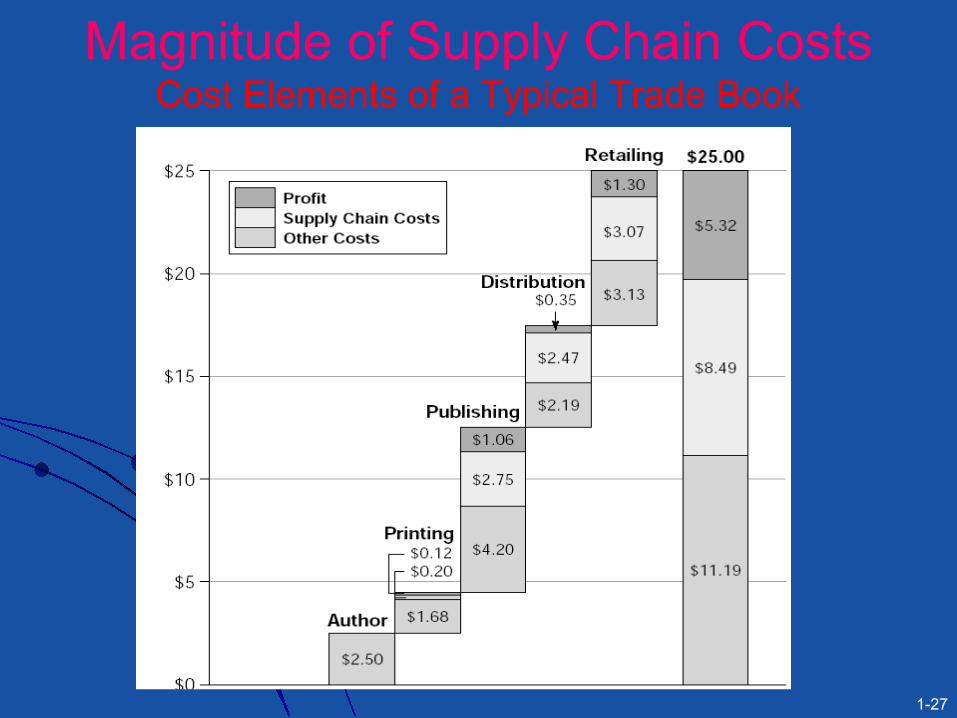
Magnitude of Supply Chain CostsCost Elements of a Typical Trade Book
1-28
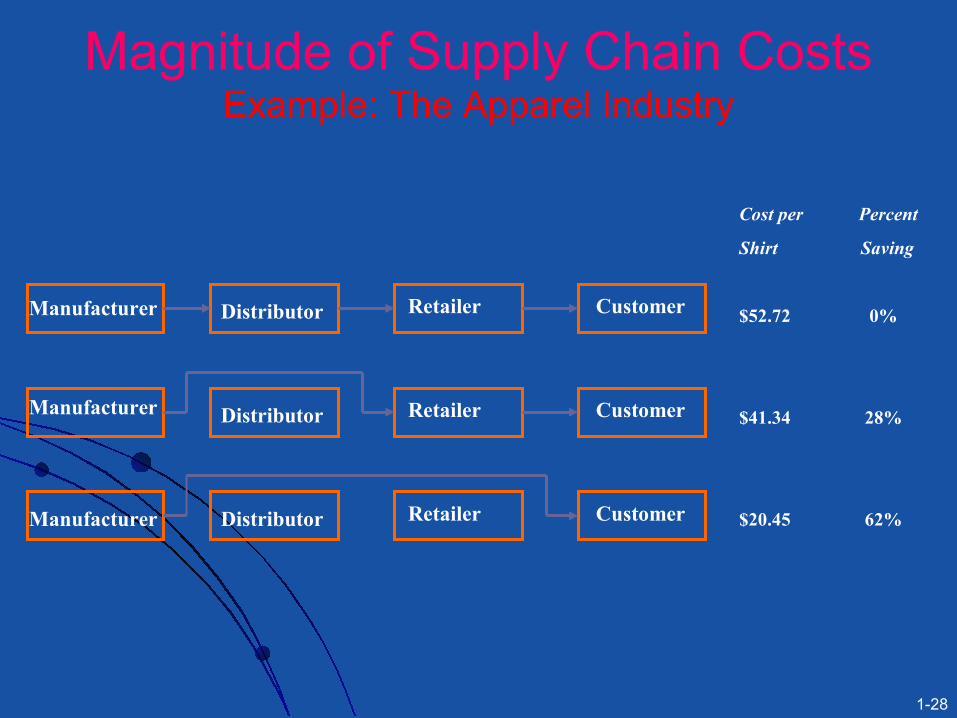
Magnitude of Supply Chain CostsExample: The Apparel Industry
Manufacturer Distributor Retailer Customer
Cost per Percent
Shirt Saving
$52.72 0%
$41.34 28%
$20.45 62%
Manufacturer Distributor Retailer Customer
Manufacturer Distributor Retailer Customer
1-29
Supply Chain: The Potential
P&G’s estimated savings to retail customers of $65 million through logistics gains
Dell Computer’s outperforming of the competition in terms of shareholder value growth over more than two decades by over 3,000% using:
Direct business model
Build-to-order strategy
Wal-Mart transformation into the world’s largest retailer by changing its logistics system:
highest sales per square foot, inventory turnover and operating profit of any discount retailer

![Ch01 [Class Material] (1)](https://static.documents.pub/doc/80x56/577cca1c1a28aba711a5669b/ch01-class-material-1.jpg)


