Page 1
Slide Sets to accompany Blank & Tarquin, Engineering Economy, 6th Edition, 2005
© 2005 by McGraw-Hill, New York, N.Y All Rights Reserved1-1
Developed By:
Dr. Don Smith, P.E.
Department of Industrial Engineering
Texas A&M University
College Station, Texas
Executive Summary Version
Chapter 13
Breakeven Analysis
Page 2
Slide Sets to accompany Blank & Tarquin, Engineering Economy, 6th Edition, 2005
© 2005 by McGraw-Hill, New York, N.Y All Rights Reserved1-2
LEARNING OBJECTIVESLEARNING OBJECTIVES
1. Breakeven point
2. Two-alternative breakeven
3. Spreadsheets
Page 3
Slide Sets to accompany Blank & Tarquin, Engineering Economy, 6th Edition, 2005
© 2005 by McGraw-Hill, New York, N.Y All Rights Reserved1-3
Sct 13.1 Breakeven Analysis for a Single Sct 13.1 Breakeven Analysis for a Single ProjectProject
Given P, F, A, i, n If all of the parameters (variables) shown
above are known except one, then the unknown parameter can be calculated or approximated
A breakeven value can be determined by setting PW, FW, or AW = 0 and solve for or approximate the unknown parameter
Page 4
Slide Sets to accompany Blank & Tarquin, Engineering Economy, 6th Edition, 2005
© 2005 by McGraw-Hill, New York, N.Y All Rights Reserved1-4
Solving for a Breakeven ValueSolving for a Breakeven Value
Three approaches to solve for breakeven for an unknown parameter: 1. Direct solution - manually if only one interest
factor is involved in the setup 2. Trial and error – manually if multiple factors are
present in the formulation; 3. Spreadsheet model - where the Excel functions
PV, FV, RATE, IRR, NPV, PMT, and NPER are part of the solution process (use Excel’s Goal Seek or Solver)
Page 5
Slide Sets to accompany Blank & Tarquin, Engineering Economy, 6th Edition, 2005
© 2005 by McGraw-Hill, New York, N.Y All Rights Reserved1-5
Cost – Revenue Model ApproachCost – Revenue Model Approach
A popular application of Breakeven (BE) is where
cost-revenue-volume relationships are studied
Define cost and revenue functions and assume some
linear or non-linear cost or revenue
relationships
One objective: Find a parameter value -- termed QBE --
that will minimize costs or maximize profits
Page 6
Slide Sets to accompany Blank & Tarquin, Engineering Economy, 6th Edition, 2005
© 2005 by McGraw-Hill, New York, N.Y All Rights Reserved1-6
Fixed CostsFixed Costs
Essentially constant for all values of the variable (parameter) in question;
If no level of activity, fixed costs continue; Must shut down the activity before fixed costs
can be altered downward significantly; To buffer fixed costs one must work on
improved efficiencies of operations.
Page 7
Slide Sets to accompany Blank & Tarquin, Engineering Economy, 6th Edition, 2005
© 2005 by McGraw-Hill, New York, N.Y All Rights Reserved1-7
Fixed Cost ExamplesFixed Cost Examples
Fixed Costs – Cost that do not vary with production or activity levels Costs of buildings; Insurance; Fixed overhead; Equipment capital recovery; etc.
Page 8
Slide Sets to accompany Blank & Tarquin, Engineering Economy, 6th Edition, 2005
© 2005 by McGraw-Hill, New York, N.Y All Rights Reserved1-8
Variable CostsVariable Costs
Variable costs change with the level of activity;
More activity – greater variable costs; Less activity – lover variable costs; Variable costs are impacted by efficiency of
operation, improved designs, quality, safety, and higher sales volume.
Page 9
Slide Sets to accompany Blank & Tarquin, Engineering Economy, 6th Edition, 2005
© 2005 by McGraw-Hill, New York, N.Y All Rights Reserved1-9
Variable Cost ExamplesVariable Cost Examples
Costs that vary with the level of activity; Direct labor such as wages; Materials; Indirect costs; Marketing; Advertising; Warranty; etc.
Page 10
Slide Sets to accompany Blank & Tarquin, Engineering Economy, 6th Edition, 2005
© 2005 by McGraw-Hill, New York, N.Y All Rights Reserved1-10
Total CostsTotal Costs
Total Cost = Fixed Costs + Variable Costs
TC = FC + VC Profit Relationships
Profit = Revenue – Total Cost
P = R – TC
= R – (FC + VC)
Page 11
Slide Sets to accompany Blank & Tarquin, Engineering Economy, 6th Edition, 2005
© 2005 by McGraw-Hill, New York, N.Y All Rights Reserved1-11
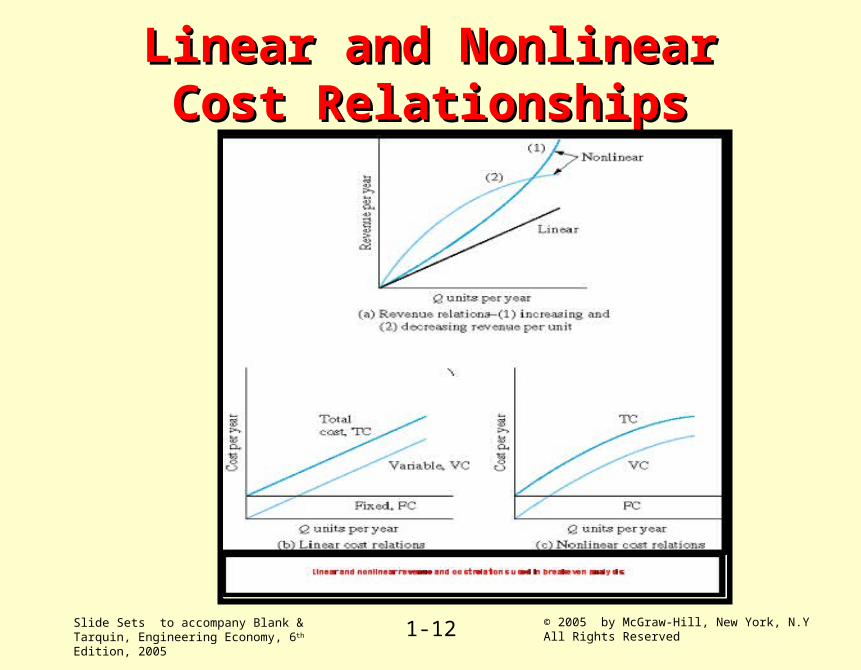
Cost – Revenue RelationshipsCost – Revenue Relationships
Linear Models Non-linear models Linear and non-linear models are used as
approximations to realityTypical cost relationships are shown on
following slides
Page 12
Slide Sets to accompany Blank & Tarquin, Engineering Economy, 6th Edition, 2005
© 2005 by McGraw-Hill, New York, N.Y All Rights Reserved1-12
Linear and Nonlinear Cost Linear and Nonlinear Cost RelationshipsRelationships
Page 13
Slide Sets to accompany Blank & Tarquin, Engineering Economy, 6th Edition, 2005
© 2005 by McGraw-Hill, New York, N.Y All Rights Reserved1-13
Basic Basic LinearLinear Cost Relationship Cost Relationship
Q, Level of activity per time unit
C o s t
Fixed Cost ( level)
Variable Cost
Total Cost
Page 14
Slide Sets to accompany Blank & Tarquin, Engineering Economy, 6th Edition, 2005
© 2005 by McGraw-Hill, New York, N.Y All Rights Reserved1-14
Basic Basic Non-linearNon-linear Cost Relationship Cost Relationship
Q, Level of activity per time unit
Cos t
Fixed Cost ( level)
Variable Cost
Total Cost
Page 15
Slide Sets to accompany Blank & Tarquin, Engineering Economy, 6th Edition, 2005
© 2005 by McGraw-Hill, New York, N.Y All Rights Reserved1-15
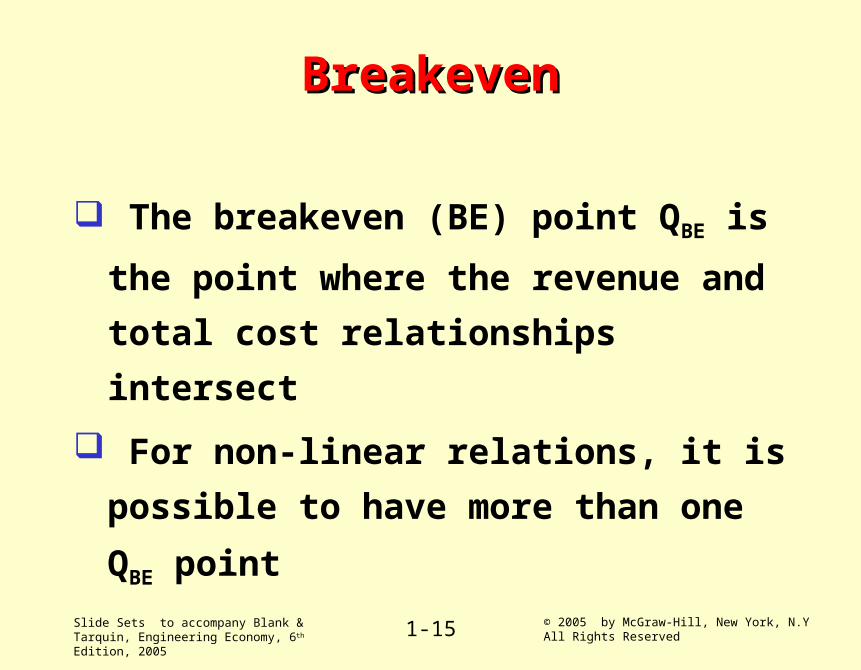
BreakevenBreakeven
The breakeven (BE) point QBE is the point
where the revenue and total cost relationships
intersect
For non-linear relations, it is possible to have
more than one QBE point
Page 16
Slide Sets to accompany Blank & Tarquin, Engineering Economy, 6th Edition, 2005
© 2005 by McGraw-Hill, New York, N.Y All Rights Reserved1-16
Breakeven…Breakeven…
Revenue and total cost relationships tend to
be static in nature
May not truly reflect reality of the dynamic
firm
However, the breakeven point(s) can be
useful for planning purposes
Page 17
Slide Sets to accompany Blank & Tarquin, Engineering Economy, 6th Edition, 2005
© 2005 by McGraw-Hill, New York, N.Y All Rights Reserved1-17
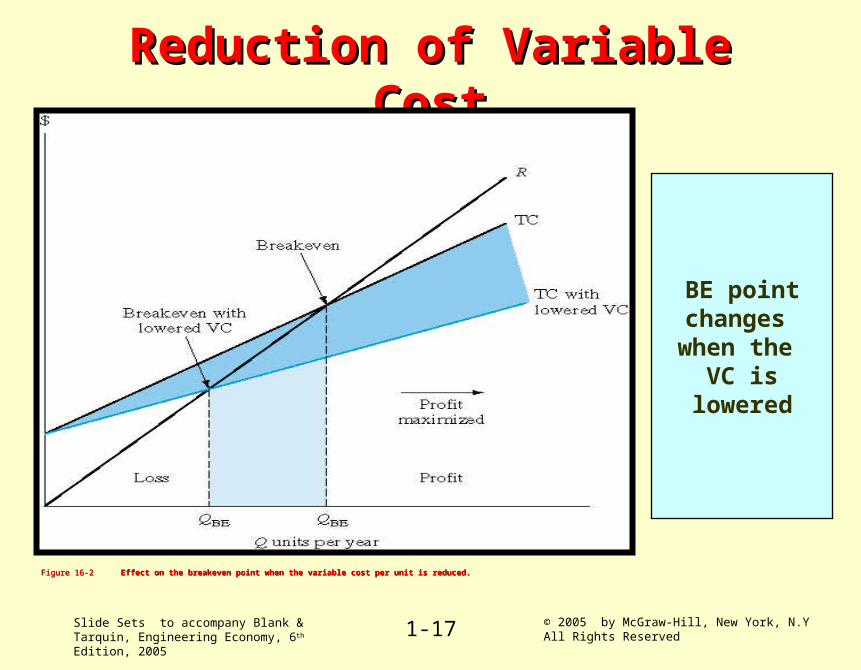
Reduction of Variable CostReduction of Variable Cost
Figure 16-2Figure 16-2 Effect on the breakeven point when the variable cost per unit is reduced.Effect on the breakeven point when the variable cost per unit is reduced.
BE pointchanges when the
VC islowered
Page 18
Slide Sets to accompany Blank & Tarquin, Engineering Economy, 6th Edition, 2005
© 2005 by McGraw-Hill, New York, N.Y All Rights Reserved1-18
Non-linear BE AnalysisNon-linear BE Analysis
For non-linear analysis the point of maximum
profit is of interest
And, multiple BE points may exist
Page 19
Slide Sets to accompany Blank & Tarquin, Engineering Economy, 6th Edition, 2005
© 2005 by McGraw-Hill, New York, N.Y All Rights Reserved1-19
Non-linear AnalysisNon-linear Analysis
Figure 16-3Figure 16-3 Breakeven points and maximum-profit point for a nonlinear analysis.Breakeven points and maximum-profit point for a nonlinear analysis.
Breakeven pointsand profit
maximization fora non-linear model
Page 20
Slide Sets to accompany Blank & Tarquin, Engineering Economy, 6th Edition, 2005
© 2005 by McGraw-Hill, New York, N.Y All Rights Reserved1-20
Sct 13.2 Breakeven Analysis Between Two Sct 13.2 Breakeven Analysis Between Two AlternativesAlternatives
Given two alternatives (assume mutually exclusive) Need to determine a common variable or economic
parameter common to both alternatives Parameter could be:
Interest rate, First cost (investment), Annual operating cost, etc.
Page 21
Slide Sets to accompany Blank & Tarquin, Engineering Economy, 6th Edition, 2005
© 2005 by McGraw-Hill, New York, N.Y All Rights Reserved1-21
Breakeven for two alternativesBreakeven for two alternatives
Total costrelationships for two alternatives.
Note the intersectionof the two TC
plots. Both alternativesare equal at BE point
Page 22
Slide Sets to accompany Blank & Tarquin, Engineering Economy, 6th Edition, 2005
© 2005 by McGraw-Hill, New York, N.Y All Rights Reserved1-22
Three Alternative AnalysisThree Alternative Analysis
If three alternatives are present, compare the alternatives pair-wise, or
Use a spreadsheet model to plot the present worth or annual worth over a specified range of values.
A typical three-alternative BE plot might look like ….
Page 23
Slide Sets to accompany Blank & Tarquin, Engineering Economy, 6th Edition, 2005
© 2005 by McGraw-Hill, New York, N.Y All Rights Reserved1-23
Breakeven for Three AlternativesBreakeven for Three Alternatives
Page 24
Slide Sets to accompany Blank & Tarquin, Engineering Economy, 6th Edition, 2005
© 2005 by McGraw-Hill, New York, N.Y All Rights Reserved1-24
Sct 13.3 Spreadsheet Application: Using Sct 13.3 Spreadsheet Application: Using Excel’s Excel’s SOLVERSOLVER for Breakeven Analysis for Breakeven Analysis
SOLVER is one of many built-in Excel analysis tools; SOLVER has been designed to aid in more complex
forms of “goal seeking” and performing “what-if” evaluations of properly constructed models.
For a properly constructed model SOLVER will require that the analyst: Specify a target cell (the objective); Identify one or more changing cell(s) that will have to change
to achieve the desired target cell value
Page 25
Slide Sets to accompany Blank & Tarquin, Engineering Economy, 6th Edition, 2005
© 2005 by McGraw-Hill, New York, N.Y All Rights Reserved1-25
Target CellTarget Cell The target cell MUST contain a valid Excel
formula or function Options of what can happen to the target cell:
Maximize the target cell value Minimize the cell value Set to some predetermined cell value (e.g., 0 or
$10,000)
The target cell cannot be a cell reference
Page 26
Slide Sets to accompany Blank & Tarquin, Engineering Economy, 6th Edition, 2005
© 2005 by McGraw-Hill, New York, N.Y All Rights Reserved1-26
Changing Cell(s)Changing Cell(s)
SOLVER requires the analyst to identify one or more cells that must change to achieve the desired result in the target cell
Changing cells are, in reality, the decision variables in the model
One or more cells are identified that directly or indirectly impact the target cell.
Page 27
Slide Sets to accompany Blank & Tarquin, Engineering Economy, 6th Edition, 2005
© 2005 by McGraw-Hill, New York, N.Y All Rights Reserved1-27
Achieving the Target Cell ObjectiveAchieving the Target Cell Objective
If the model is properly constructed and the cell formulas/functions are logically linked then: SOLVER will iterate the designated changing cells
until the target cell value is achieved as closely as possible.
SOLVER will generate either exact or closely approximated decision variable values
See Example 13.5. Note application of Excel
financial functions PMT and PV
Page 28
Slide Sets to accompany Blank & Tarquin, Engineering Economy, 6th Edition, 2005
© 2005 by McGraw-Hill, New York, N.Y All Rights Reserved1-28
Chapter SummaryChapter Summary
Breakeven point for a variable X is normally
expressed as: Units per time period;
Hours per month;
etc.
At exactly breakeven (QBE) one is indifferent
regarding a project
Page 29
Slide Sets to accompany Blank & Tarquin, Engineering Economy, 6th Edition, 2005
© 2005 by McGraw-Hill, New York, N.Y All Rights Reserved1-29
Summary - continuedSummary - continuedTypical breakeven models are:
Linear Non-linear
Two or more alternatives can be compared using breakeven analysis
BE analysis can be a form of sensitivity analysis
Complex models can be evaluated using Excel’s SOLVER tool
Page 30
Slide Sets to accompany Blank & Tarquin, Engineering Economy, 6th Edition, 2005
© 2005 by McGraw-Hill, New York, N.Y All Rights Reserved1-30
Chapter 13Chapter 13End of SetEnd of Set