63
Statistical Analysis
| Date post: | 09-Dec-2015 |
| Category: |
Documents |
| Upload: | ahmed-awad |
| View: | 1 times |
| Download: | 0 times |

Statistical Analysis
Definition of Statistics
Descriptive Statistics: numerical facts, figures and information
Goal:1. Describe a set of numbers
2. Make accurate inferences about process/behavior based upon incomplete information

Statistical Steps
Steps1. Gather data2. Organize data3. Analyze data

What is Data

Types of data
Discrete and Continuous DataData can be Discrete or Continuous.Discrete data is counted, Continuous data is measured

Population and Sample
Population: collection of all elements of interest Sample: subset of the population
Population Sample

Population

Sample

Data
Numerical Measures
Measurement of central tendency Mean Median mode
Measurement of variations Range Variance Standard deviation

Arithmetic mean (AM)
The arithmetic mean is the "standard" average, often simply called the "mean".

Mean

Arithmetic mean (AM)
For example, the arithmetic mean of six values: 34, 27, 45, 55, 22, 34 is

Mean
The mean is the average value
x x i
n
x i
N
Sample mean
Population mean

Median
The middle value when the numbers are arranged in ascending or descending order.
12345
medianEx:

Mode
The data value that occurs with greatest frequency
11135
modeEx:

Central Tendency Example
Test scores:
x i
N
(98 96 94 ... 64 44)
168298 83
96 8394 8393 8088 7587 7286 6486 44
Median
(86 83)
284.5
Mode = 83

Range
Difference between the largest and smallest value in the dataset
12345
Ex: Range = 5-1 =4

Dispersion
Deviation just means how far from the normal

Root mean square
RMS is a statistical measure of the magnitude of a varying quantity. It is especially useful when variants are positive and negative

Variance
Measurement of the dispersion of values from the mean
Sample variance
Population variance
s2 x i x 2
n 1
2 x i 2
N
Statistics for Business and Economics,5th ed., pg68.

Standard Deviation Definition:
Standard deviation is a statistical measure of spread or variability. The standard deviation is the root mean square (RMS) deviation of the values from their arithmetic mean.

Standard Deviation

Standard Deviation
The positive square root of the variance
Sample standard deviation
Population standard deviation
s s2
2

Percentile The value such that p% of the total items lie below the value
Lower quartile, middle quartile, upper quartile
Steps1. Arrange data in ascending order2. Compute an index i as follows:
3. If i is not an integer, round up. If i is an integer, the p% is the average between the values in position i and i+1.
i p
100
n

histogram
A Histogram is a graphical display of data using bars of different heights

histogram
It is similar to a Bar Chart, but a histogram groups data into ranges

Frequency & Frequency Distribution
FrequencyFrequency is how often something occurs.
Frequency DistributionBy counting frequencies we can make a Frequency Distribution table.

Probability
P(A) = number of favorable outcomes total number of possible outcomes
Areas of Probability:• simple events• combinations of events

Probability Distribution
• Continuous Distribution: continuous scale
• Discrete Distribution: discrete values

Discrete Vs. Continuous Data
Discrete Examples Yes/No Throws of a die Go / No go Heads/Tails
Continuous Examples segment time degrees of temperature measurements like
inches, miles, feet, etc weight

Continuous Distribution
• Uniform Distribution
• Exponential Distribution
• Normal Distribution

Normal Distribution
Symmetric distribution Highest point occurs at mean Mean, median and mode are at center point
Statistics for Business and Economics,5th ed., pg184.
f (x) 1
2e x 2 / 2 2

Normal Distribution
34.13%
13.06%
2.14%0.13%
34.13%
13.06%
2.14%0.13%
68.26%
99.73%
95.46%
68.26% of the population is within +/- 1 of the
-3

Normal Distribution


Assumed Normality

Z-scores
• A Z score is a data point's position between the mean and another location as measured by the number of standard deviations.
• Z is a universal measurement because it can be applied to any unit of measure.
z x

z 0.000 0.001 0.002 0.003 0.004 0.0050.0 0.5000 0.5040 0.5080 0.5120 0.5160 0.52000.1 0.5398 0.5438 0.5478 0.5518 0.5558 0.55980.2 0.5793 0.5832 0.5871 0.5910 0.5949 0.59880.3 0.6179 0.6217 0.6255 0.6293 0.6331 0.63690.4 0.6554 0.6591 0.6628 0.6665 0.6702 0.67390.5 0.6915 0.6950 0.6985 0.7020 0.7055 0.70900.6 0.7257 0.7291 0.7325 0.7359 0.7393 0.74270.7 0.7580 0.7611 0.7642 0.7673 0.7704 0.77350.8 0.7881 0.7910 0.7939 0.7968 0.7997 0.80260.9 0.8159 0.8186 0.8213 0.8240 0.8267 0.82941.0 0.8413 0.8438 0.8463 0.8488 0.8513 0.8538
Standard Normal Probability Table

Confidence Level

Confidence Level


Standard Normal Distribution

Normal Vs Standard Normal

3210-1-2-3
0.4
0.3
0.2
0.1
0.0
Normal
CDF
Z
Standard Normal Probability Area
0.7393 0.2607
= 0.64
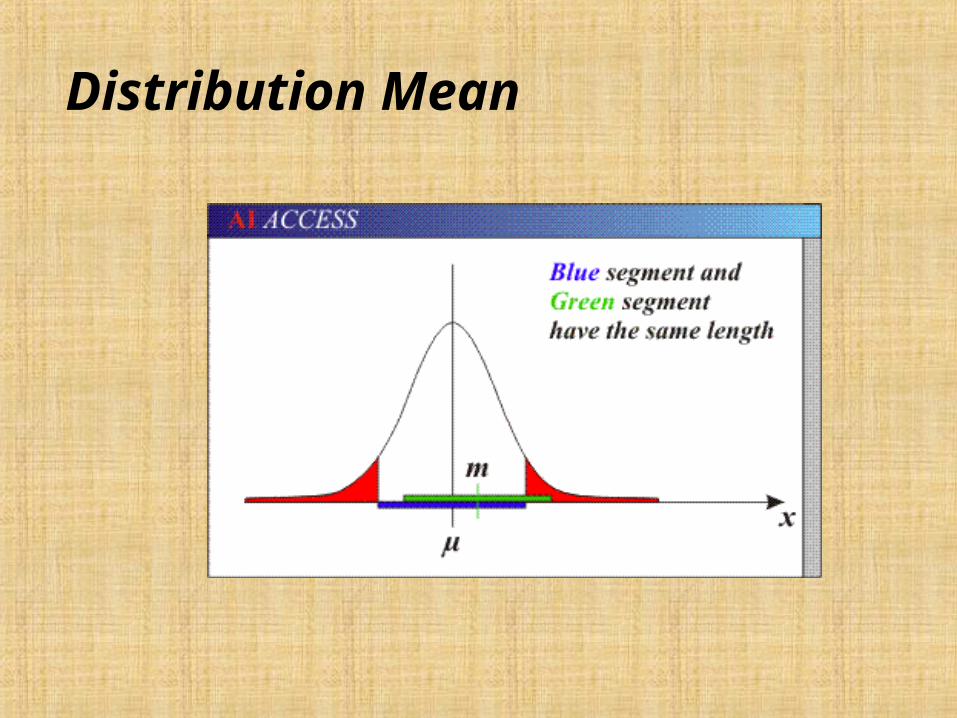
Distribution Mean

Confidence Level and interval
Precision is defined in terms of standard deviation.
= one sigma or 2 or 3 according to the confidence level
Confidence Level and interval

If your instrument measures in "2"s then any value between 7 and 9 is measured as "8"

Confidence Level

Confidence Interval

Confidence level and Interval

Confidence Level


Peak removal according to confidence level

Peak removal according to confidence level

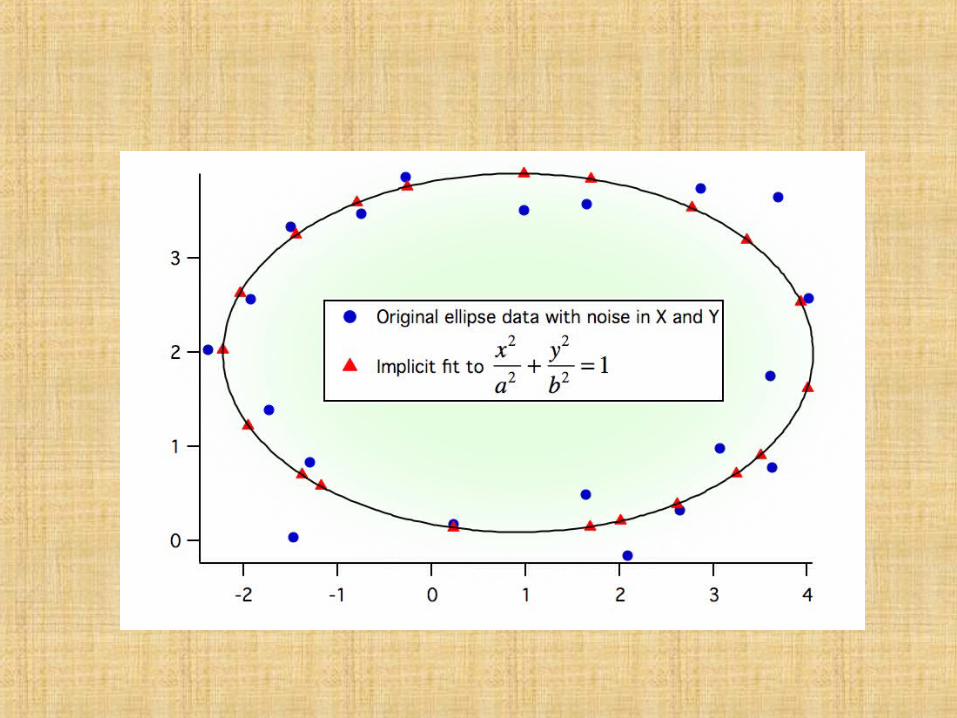
Data Regression

Data Regression

Peak removal

Peak removal


