Chapter 5. Exisng Condions and Environmental Consequences Dra Environmental Impact Statement Page 5-185 5.14 Farmlands What is the history of agricultural production in the study area? Early settlers in this part of colonial South Carolina were granted large tracts of land out of which grew plantations growing rice, indigo, and later cotton. For these types of crops, the plantation system of slave-labor and labor-intensive crop production was used. After the Civil War with the loss of slave-labor and the switch to mechanized agriculture, agri- culture in the area changed to the production of Sea Island cotton using the tenant farm- ing system. Agriculture had to change again in the 1920s when the boll weevil wiped out cotton production. Farmers then turned to truck crops such as cabbage, sweet potatoes, and tomatoes to be shipped via railroad to the north or sold in downtown Charleston. is agricultural focus continues today on a reduced scale scattered throughout the area as the land has primarily been turned over to commercial and residential developments. 5.14.1 What are the existing farmlands in the Charleston County? What types of food and fiber production are found in Charleston County ? e main food and fiber crops produced in South Carolina are soybeans, corn, and hay. e top livestock grown in the state is poultry and turkeys with South Carolina being eighth in the nation for turkeys. e highest value in sales for agricultural commodities is poultry followed distantly by nursery/greenhouse and grains. For Charleston County, the main food and fiber crops produced are hay, vegetables, and tomatoes. In South Carolina, Charleston County ranks sixth in crop inventory for veg- etables and third for tomatoes. Both James and Johns Islands were once well known for tomato production. Cattle and poultry are the top livestock raised in Charleston County, though this area is not known for livestock production. e two commodities highest in value in sales are vegetables and nursery/greenhouse, which are common on both Islands. South Carolina farms produce food and fiber crops valued at over 2.3 billion dollars an- nually. Charleston County produced food and fiber crops valued at approximately 24 million dollars in 2007, which was a 33 percent increase from 2002. e County total represents nearly 10 percent of South Carolina’s overall crop value. e 2000 U.S. Census listed only 0.5 percent (662 individuals) of the workforce’s pri- mary occupation in Charleston County as farming, fishing, and forestry. e 2007 U.S. Census of Agriculture listed 332 individuals as principal operators of farms with 152 list- ing farming as their primary occupation. As shown in Table 5.52, approximately 25 percent of South Carolina’s total land area is in farms. For Charleston County, 7.1 percent of land area is in farms, well below the average Farmlands
Transcript
Chapter 5. Exis� ng Condi� ons and Environmental Consequences Dra� Environmental Impact Statement
Page 5-185
5.14 Farmlands
What is the history of agricultural production in the study area?
Early settlers in this part of colonial South Carolina were granted large tracts of land out of which grew plantations growing rice, indigo, and later cotton. For these types of crops, the plantation system of slave-labor and labor-intensive crop production was used. After the Civil War with the loss of slave-labor and the switch to mechanized agriculture, agri-culture in the area changed to the production of Sea Island cotton using the tenant farm-ing system. Agriculture had to change again in the 1920s when the boll weevil wiped out cotton production. Farmers then turned to truck crops such as cabbage, sweet potatoes, and tomatoes to be shipped via railroad to the north or sold in downtown Charleston. Th is agricultural focus continues today on a reduced scale scattered throughout the area as the land has primarily been turned over to commercial and residential developments.
5.14.1 What are the existing farmlands in the Charleston County? What types of food and fi ber production are found in Charleston County ?
Th e main food and fi ber crops produced in South Carolina are soybeans, corn, and hay. Th e top livestock grown in the state is poultry and turkeys with South Carolina being eighth in the nation for turkeys. Th e highest value in sales for agricultural commodities is poultry followed distantly by nursery/greenhouse and grains.
For Charleston County, the main food and fi ber crops produced are hay, vegetables, and tomatoes. In South Carolina, Charleston County ranks sixth in crop inventory for veg-etables and third for tomatoes. Both James and Johns Islands were once well known for tomato production. Cattle and poultry are the top livestock raised in Charleston County, though this area is not known for livestock production. Th e two commodities highest in value in sales are vegetables and nursery/greenhouse, which are common on both Islands.
South Carolina farms produce food and fi ber crops valued at over 2.3 billion dollars an-nually. Charleston County produced food and fi ber crops valued at approximately 24 million dollars in 2007, which was a 33 percent increase from 2002. Th e County total represents nearly 10 percent of South Carolina’s overall crop value.
Th e 2000 U.S. Census listed only 0.5 percent (662 individuals) of the workforce’s pri-mary occupation in Charleston County as farming, fi shing, and forestry. Th e 2007 U.S. Census of Agriculture listed 332 individuals as principal operators of farms with 152 list-ing farming as their primary occupation.
As shown in Table 5.52, approximately 25 percent of South Carolina’s total land area is in farms. For Charleston County, 7.1 percent of land area is in farms, well below the average
Farmlands
Page 5-186
Chapter 5. Exis� ng Condi� ons and Environmental Consequences Dra� Environmental Impact Statement
for South Carolina. Th e number of farms in the county decreased by 20 percent between 2002 and 2007 and the average farm size rose slightly to 126 acres. Th e trend for number of farms rose by 5 percent for South Carolina but farm size decreased.
Table 5.52Agricultural Land Use in Charleston County and South Carolina
Charleston County
2002
Charleston County
2007
South Carolina 2002
South Carolina2007
Approximate Land Area (acres)
587,718 587,71819.27
million19.27
million
Land in Farms (acres)
47,515(8.1%)
41,702(7.1%)
4.85 million (24%)
4.89 million (25%)
Number of Farms
417 332 24,541 25,867
Average Size of Farm (acres)
114 126 197 189
Source: USDA. 2007 U.S. Census of Agriculture, State Pro� le, South Carolina.
5.14.1. How is farmland protected?
Th e Farmland Protection Policy Act in 1981 is intended to reduce and minimize impacts that federal programs may have on area farmlands and protect farmlands from conversion to non-agricultural uses. Prior to farmlands being used for a federal project, an assessment must be completed to determine if prime, unique, statewide or locally important farmlands would be converted to non-agricultural uses. If the assessment determines the use of farmland for the project is in excess of the parameters defi ned by the Natural Resources Conservation Service (NRCS), an agency of the U.S. Department of Agriculture (USDA), then the federal agency must take measures to minimize the impacts of the project to these farmlands.
5.14.1.2 What are the different types of protected farmland soils?
Th e NRCS is the lead agency that determines the suitability of farmlands. NRCS characterizes eligible farmland as being “prime,” “unique,” or of “statewide or local importance.” Th e designations are based on NRCS soil types and are protected by federal and state legislation.
Prime farmland is land that has the best combination of physical and chemical characteristics for producing food, feed, fi ber, forage, or oil-seed and other agricultural crops with minimum inputs of fuel, fertilizer, pesticides and labor without intolerable soil erosion (7 U.S.C. 4201(c)(1)(A)). Prime farmland includes land that possesses the above characteristics and may include land currently used as cropland, pastureland, rangeland, or forestland. Prime farmland does not include land already in or committed to urban development or water storage.
Page 5-187
Chapter 5. Exis� ng Condi� ons and Environmental Consequences Dra� Environmental Impact Statement
Unique farmland is land other than prime farmland that is used for production of specifi c high-value food and fi ber crops (7 U.S.C. 4201(c)(1)(B)). It has the special combination of soil quality, location, growing season, and moisture supply needed to economically produce high quality or high yields of specifi c crops when treated and managed ac-cording to acceptable farming methods. Examples of such crops include lentils, nuts, annually cropped white wheat, cranberries, citrus and other fruits, olives and vegetables.
Statewide or locally important farmland is land that has been designated of state or local importance for the produc-tion of food, feed, fi ber, forage, or oil-seed crops as determined by state or local government agencies, but is not of national signifi cance (7 U.S.C. 4201(c)(1)(C)).
5.14.1.3 What are the types and the amounts of protected farmland soils in the re� ned study area?
Th e refi ned study area is comprised of 9,026 acres of land within Charleston County. Of these acres, 471 acres are prime farmland soils and 3,417 acres are farmland soils of statewide importance. Together they account for 43 percent of the land within the refi ned study area. However, except for a few larger parcels of land on Johns Island, either the land with these soils within the refi ned study area is occupied by development or the parcels are too small to accom-modate agricultural production. No unique farmland soil types exist in the refi ned study area.
Table 5.53 lists the soil types and amount of acreages for prime and statewide important farmland soils in the refi ned study area. Th e refi ned study area has a total of two soil types that have been designated as prime farmland and seven soil types designated as farmland of statewide importance by the NRCS.
Table 5.53Summary of Prime and Statewide Important Farmland Soils
in the Project Study AreaSoil Type Acreage in Re� ned Study Area
Prime FarmlandCharleston loamy � ne sand 266
Hockley loamy � ne sand 205
Total 471
Statewide Important Farmland
Edisto loamy � ne sand 737
Kiawah loamy � ne sand 572
Santee loam 73
Stono � ne sandy loam 872
Wadmalaw � ne sandy loam 482
Wagram loamy � ne sand 32
Yonges loamy � ne sand 649
Total 3,417
Source: GIS data from NRCS, 2008
Page 5-188
Chapter 5. Exis� ng Condi� ons and Environmental Consequences Dra� Environmental Impact Statement
5.14.2 How would the No-build Alternative impact farmland and food and fi ber production?
Th e No-build Alternative would have no eff ect on farming operations since existing conditions would remain un-changed.
5.14.3 How would the Reasonable Alternatives impact farmlands and food and fi ber production?
Formal consultation with the NRCS for compliance with the Farmland Protection Act was completed. An evaluation utilizing the Farmland Impact Conversion Rating form for Corridor Type Projects (NRCS-CPA-106) was performed for the seven new location alternatives (Refer to Appendix D). Th e purpose of the farmland conversion impact rating form is to help identify and approximate the amount of farmland conversion that would be associated with each of the proposed alternatives.
Potential impacts to farmland have been quantitatively assessed for each of the alternatives based on Charleston County’s prime and statewide importance farmland. For each alternative, two values, the relative value and the cor-ridor assessment value, were determined. Th e relative value category was completed by the NRCS, on a scale of 0-100, the relative value of farmland to be converted by the alternatives ranged from 78 to 89 points. Th e corridor assess-ment value pertains to the use of land, the availability of farm support services, investments in existing farms, and the amount of land that could be rendered non-farmable due to construction of the project. Th e corridor assessment value had a scale of 0-160 points, the alternatives ranged from 32 to 33.
Further evaluation of existing conditions and impacts to the refi ned study area led to the creation of Alternative G later in project development. Th is alternative was not coordinated directly with NRCS; however, this alternative follows the path of Alternative F on West Ashley and Johns Island and is in close proximity to Alternatives D and E on James Island. Th erefore, the relative value for Alternative G was assumed to be 84.5, the same as Alternative F, in evaluating the total points.
By totaling the relative value and the corridor assessment value, it was determined that the total threshold as set by NRCS, 160 points overall, was not exceeded by the proposed new location alternatives. Th e high-est total value was 122 for Alternative B. Th e lowest value was 111 for Alternative E (refer to Table 5.54). Since the 160 points threshold was not exceeded for any of the alternatives, mitigation actions that could reduce adverse impacts associated with the proposed alternatives would not be required.
Construction of any of the new location alternatives would result in the direct conversion of farmland to a transpor-tation facility. No farmlands, besides those acquired for right of way, should be rendered un-farmable. Access issues
Table 5.54NRCS Farmland Conversion
Evalua� on Point Total by Alterna� ve
Alterna� ve Point Total
A 118
B 122
C 117.5
D 120
E 111
F 117.5
G 117.5
Chapter 5. Exis� ng Condi� ons and Environmental Consequences Dra� Environmental Impact Statement
Page 5-189
to divided parcels will be addressed during the right of way acquisition process. Th e conversion of farmland to right of way due to the construction of the project should not cause a signifi cant disruption of agricultural activities in the area.
Indirect impacts on farmlands from induced development would be minimal. West Ashley and James Island are already developed and the area on Johns Island that would be aff ected by the project falls within the Urban Growth Boundary (UGB) which was previously established to guide infi ll and development in that area adjacent to the refi ned study area.
5.15 Water Resources
5.15.1 What are the sources of information and types of existing water resources in the refi ned study area?
Information on water quality in the refi ned study area has been obtained from sources that include SCDHEC, EPA, and the United States Geological Survey (USGS). Th ese sources of information were used to determine the existing water quality within the refi ned study area. Th e establishment of a baseline condition for water quality can then be used to evaluate the potential impacts to water quality that may result from the proposed project.
Water quality within the refi ned study area is described below based on the best usage clas-sifi cation, water quality monitoring and section 303(d) streams, point source pollution and non-point source pollution. No water qual-ity sampling was performed during the fi eld reviews.
Th e water resources within the refi ned study area include both groundwater and surface waters. Surface waters include the Stono River, Elliot Cut, James Island Creek and Pennys Creek (Figure 5-60).
Th ere are fi ve groundwater aquifers that are lo-cated in the vicinity of the refi ned study area for Mark Clark Expressway DEIS. As identifi ed from the shallowest to the deepest, these aquifers are the Surfi cial aquifer system, the Santee/Black Mingo aquifer, the Black Creek aquifer, the Middendorf aquifer and the Cape Fear aquifer.74
74 A Preliminary Assessment of the Groundwater Condi� ons in Charleston, Berkeley and Dorches-ter Coun� es, South Carolina, h� p://www.scdhec.net/environment/water/docs/tridentrpt.pdf, 07/09
Water Resources
Pennys Creek and Low Salt MarshPennys Creek and Low Salt Marsh
Draft Environmental Impact Statement
FIGURE 5-60SURFACE WATERS MAP
RIVE
RLANDDR
MAYBANK HWY
US 17
RIVERRD
§̈¦526
Stono River (AIWW)Johns Island
West Ashley
James Island
FOLLY
RD
JAMESISLAND
CONN
Ashley River
Pennys Creek
Wappoo Creek
Elliott Cut
JamesIsland
Creek
Refined Study Area
Page 5-190Chapter 5
Existing Conditons and Environmental Consequences
Legend
0 0.6 1.20.3Miles µ
Page 5-191
Chapter 5. Exis� ng Condi� ons and Environmental Consequences Dra� Environmental Impact Statement
5.15.1.1 Groundwater
Water can be found underneath the Earth’s surface almost everywhere - beneath hills, mountains, plains and deserts. In locations such as these it is not always accessible, or fresh enough for use without treatment, and it’s sometimes dif-fi cult to locate or to measure and describe. Th is water may occur close to the land surface, as in a marsh, or it may be many hundreds of feet below the surface. Groundwater is stored in, and moves slowly through, moderately to highly permeable rocks called aquifers. An aquifer is a geologic formation, group of formations, or part of a formation that contains suffi cient saturated, permeable material to yield signifi cant quantities of water to wells and springs.
What existing groundwater resources are located in the refi ned study area?
Th ere are fi ve aquifers that are located in the confi nes of the refi ned study area for the proposed project. As identifi ed from the shallowest to the deepest, these aquifers are the Surfi cial aquifer system, the Santee/Black Mingo aquifer, the Black Creek aquifer, the Middendorf aquifer and the Cape Fear aquifer. Th ese aquifers are separated from each other by a confi ning formation of either clay and silt sediments or a low permeability limestone. Th e exceptions are the Surfi cial aquifer system and the Cape Fear aquifer. Th e Surfi cial aquifer system is considered to be unconfi ned since it is exposed at the surface with a confi ning formation below. Th e Cape Fear aquifer is underlain by pre-cretaceous rock that provides the confi ning formation.75
What is the existing quality of the groundwater in the refi ned study area?
SCDHEC has been requested to designate the Trident Area, consisting of Berkeley, Charleston and Dorchester Coun-ties, as a Capacity Use Area. Th e request was made by the Commissioners of Public Works for the Town of Mount Pleasant, commonly known as Mount Pleasant Waterworks (MPWW). In a designated Capacity Use Area, any person withdrawing groundwater in excess of three million gallons during any one month from a single well or from mul-tiple wells under common ownership within a one-mile radius from any one existing or proposed well must obtain a permit from SCDHEC. Th e Groundwater Use and Reporting Act states, in part, that... “In the State where excessive groundwater withdrawal presents potential adverse eff ects to the natural resources or poses a threat to public health, safety, or economic welfare or where conditions pose a signifi cant threat to the long-term integrity of a groundwater source, including salt water intrusion, the board, after notice and public hearing, in accordance with the Administra-tive Procedures Act, shall designate a Capacity Use Area.” A Capacity Use Area must be designated based on scientifi c studies and evaluation of groundwater resources and may or may not conform to political boundaries. Comprehensive groundwater investigations in the Trident area have documented progressive water-level declines, saltwater intrusion, and an increasing demand on groundwater resources as a result of rapid industrial and commercial growth, particularly along U.S. 52 and 17-A between Charleston and Moncks Corner.
Th e most widely used source of water for individual residential use is the Surfi cial aquifer system. Th is aquifer system attains a thickness of 40 to 60 feet in Charleston County. Another use of the Surfi cial aquifer system is for irrigation of agricultural fi elds. Th e Surfi cial aquifer system is generally shallow and thin, so it is heavily impacted by surface water conditions, precipitation, point source and non-point source discharges. Th e Surfi cial aquifer system is also prone to saltwater intrusion. Th e shallow well fi eld for the Town of Folly Beach became brackish when overpumping resulted in the intrusion of salt water from nearby surface water bodies. Th e Surfi cial aquifer system water quality can vary due to
75 Ground Water Atlas of the United States Alabama, Florida, Georgia, South Carolina h� p://pubs.usgs.gov/ha/ha730/ch_g/G-text7.html, 07/09
Page 5-192
Chapter 5. Exis� ng Condi� ons and Environmental Consequences Dra� Environmental Impact Statement
pollution from surface discharges. Agriculture, development, industry, drought and mining may all contribute to deg-radation of the water quality within this aquifer.76 Leaking underground storage tanks have been identifi ed as a major cause of groundwater contamination within the Surfi cial aquifer system.77
Th e Santee/Black Mingo aquifer is also used as a source of groundwater for individual residential use. With this aquifer being fairly shallow, brackish water due to saltwater intrusion is known to exist near the coast. Declining water levels are also aggravating the situation. In some instances, water levels within the aquifer have declined to the point that residential homeowners have had to set their pump intakes lower or have their wells deepened. In other instances, the uncontrolled withdrawal of groundwater has resulted in sinkhole development and land surface collapse. Th e nature and composition of the aquifer diff ers dramatically from one area to the next. In the Charleston area, the aquifer is composed of permeable sand and limestone, while within the Upper Coastal Plain the Santee/Black Mingo is often a poorly producing aquifer composed of fi ne silt and clay and therefore, is unused in favor of the Middendorf or Surfi -cial aquifer systems.
Th e Black Creek aquifer is regularly used as a private and municipal drinking water source. Th ough present through-out much of the Coastal Plain, use of the Black Creek aquifer has been primarily in the mid-to-northern portions of the Coastal Plain. Th e Black Creek aquifer is not as productive as the underlying Middendorf aquifer and contains objectionable amounts/levels of fl uoride. Th erefore, most of the water in the Charleston, Berkeley and Dorchester Counties Capacity Use Area is obtained from the Middendorf aquifer and the Surfi cial aquifer system.78
Th e Middendorf aquifer is a prolifi c source of water throughout the majority of the coastal plain. Th is aquifer consists of coarse-grained fl uvial sands near the Fall Line that grade to fi ne-grained marine sands and clay in the northern and eastern Lower Coastal Plain. In the past decade, use of the Middendorf has increased along the southern coastal areas of Charleston County.
Water levels in the Middendorf aquifer have declined substantially from predevelopment levels as a result of the con-centrated demand for public supply and industrial usage. Prior to development, water levels in the Middendorf aquifer in Charleston were 126 feet above mean sea level (msl). In 1989, they were ten feet below msl, a total decline of 136 feet. When measured in March 2000, the water level in Charleston was about 56 feet below msl, a total decline of over 180 feet.
In Charleston, the fi rst Middendorf aquifer well was drilled in 1879. When completed, the well initially fl owed at 465 gallons per minute (gpm). Th e well freely fl owed under artesian conditions until late in 1989 when continued pump-ing in the area had lowered water levels to a point below land surface. Charleston completed four more wells in the Middendorf aquifer, but these wells produced progressively less water and eventually the city was forced to a surface water source to meet the potable demand.
Groundwater withdrawals from the Middendorf aquifer near Charleston have caused the development of a regional cone of depression in the potentiometric surface, i.e., a lowering of the groundwater surface. With water levels be-
76 A Preliminary Assessment of the Groundwater Condi� ons in Charleston, Berkeley and Dorchester Coun� es, South Carolina, h� p://www.scdhec.net/environment/water/docs/tridentrpt.pdf, 07/09 77 Charleston County Groundwater Contamina� on Inventory South Carolina 2008, h� p://www.scdhec.gov/environment/water/gwci/charleston.pdf , 07/09 78 (A Preliminary Assessment of the Groundwater Condi� ons in Charleston, Berkeley and Dorchester Coun� es, South Carolina, h� p://www.scdhec.net/environment/water/docs/tridentrpt.pdf, 07/09)
Page 5-193
Chapter 5. Exis� ng Condi� ons and Environmental Consequences Dra� Environmental Impact Statement
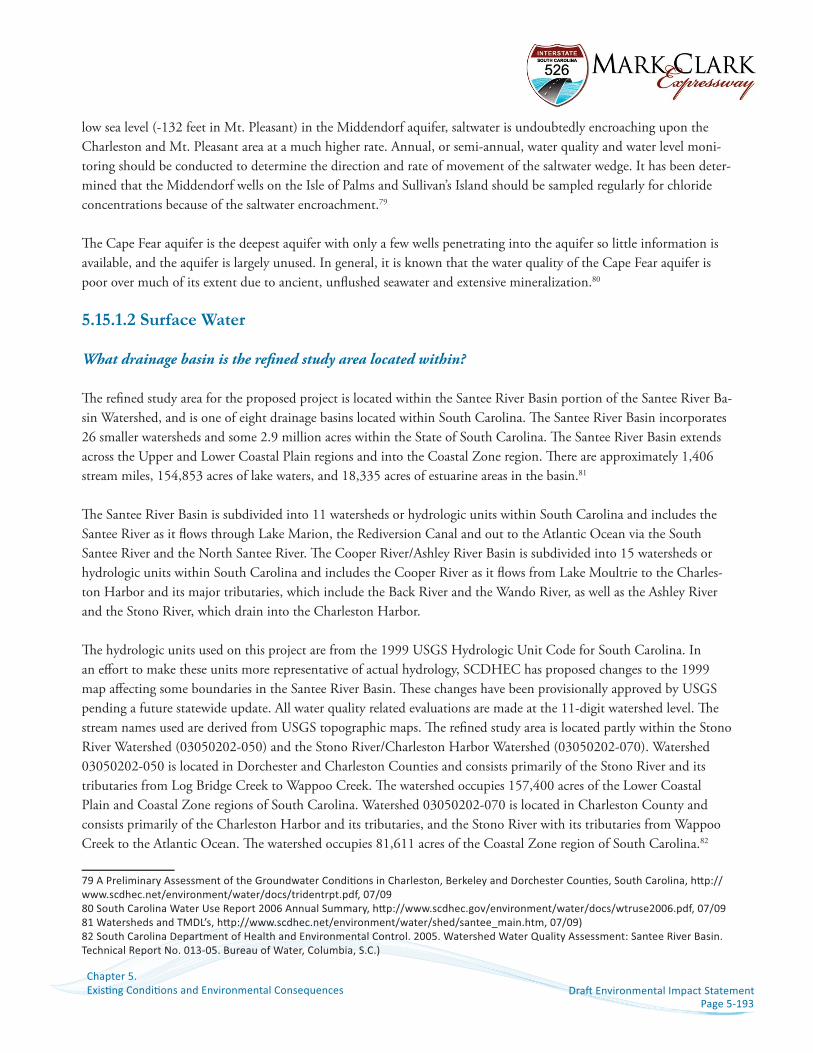
low sea level (-132 feet in Mt. Pleasant) in the Middendorf aquifer, saltwater is undoubtedly encroaching upon the Charleston and Mt. Pleasant area at a much higher rate. Annual, or semi-annual, water quality and water level moni-toring should be conducted to determine the direction and rate of movement of the saltwater wedge. It has been deter-mined that the Middendorf wells on the Isle of Palms and Sullivan’s Island should be sampled regularly for chloride concentrations because of the saltwater encroachment.79
Th e Cape Fear aquifer is the deepest aquifer with only a few wells penetrating into the aquifer so little information is available, and the aquifer is largely unused. In general, it is known that the water quality of the Cape Fear aquifer is poor over much of its extent due to ancient, unfl ushed seawater and extensive mineralization.80
5.15.1.2 Surface Water
What drainage basin is the refi ned study area located within?
Th e refi ned study area for the proposed project is located within the Santee River Basin portion of the Santee River Ba-sin Watershed, and is one of eight drainage basins located within South Carolina. Th e Santee River Basin incorporates 26 smaller watersheds and some 2.9 million acres within the State of South Carolina. Th e Santee River Basin extends across the Upper and Lower Coastal Plain regions and into the Coastal Zone region. Th ere are approximately 1,406 stream miles, 154,853 acres of lake waters, and 18,335 acres of estuarine areas in the basin.81
Th e Santee River Basin is subdivided into 11 watersheds or hydrologic units within South Carolina and includes the Santee River as it fl ows through Lake Marion, the Rediversion Canal and out to the Atlantic Ocean via the South Santee River and the North Santee River. Th e Cooper River/Ashley River Basin is subdivided into 15 watersheds or hydrologic units within South Carolina and includes the Cooper River as it fl ows from Lake Moultrie to the Charles-ton Harbor and its major tributaries, which include the Back River and the Wando River, as well as the Ashley River and the Stono River, which drain into the Charleston Harbor.
Th e hydrologic units used on this project are from the 1999 USGS Hydrologic Unit Code for South Carolina. In an eff ort to make these units more representative of actual hydrology, SCDHEC has proposed changes to the 1999 map aff ecting some boundaries in the Santee River Basin. Th ese changes have been provisionally approved by USGS pending a future statewide update. All water quality related evaluations are made at the 11-digit watershed level. Th e stream names used are derived from USGS topographic maps. Th e refi ned study area is located partly within the Stono River Watershed (03050202-050) and the Stono River/Charleston Harbor Watershed (03050202-070). Watershed 03050202-050 is located in Dorchester and Charleston Counties and consists primarily of the Stono River and its tributaries from Log Bridge Creek to Wappoo Creek. Th e watershed occupies 157,400 acres of the Lower Coastal Plain and Coastal Zone regions of South Carolina. Watershed 03050202-070 is located in Charleston County and consists primarily of the Charleston Harbor and its tributaries, and the Stono River with its tributaries from Wappoo Creek to the Atlantic Ocean. Th e watershed occupies 81,611 acres of the Coastal Zone region of South Carolina.82
79 A Preliminary Assessment of the Groundwater Condi� ons in Charleston, Berkeley and Dorchester Coun� es, South Carolina, h� p://www.scdhec.net/environment/water/docs/tridentrpt.pdf, 07/0980 South Carolina Water Use Report 2006 Annual Summary, h� p://www.scdhec.gov/environment/water/docs/wtruse2006.pdf, 07/09 81 Watersheds and TMDL’s, h� p://www.scdhec.net/environment/water/shed/santee_main.htm, 07/09) 82 South Carolina Department of Health and Environmental Control. 2005. Watershed Water Quality Assessment: Santee River Basin. Technical Report No. 013-05. Bureau of Water, Columbia, S.C.)
Page 5-194
Chapter 5. Exis� ng Condi� ons and Environmental Consequences Dra� Environmental Impact Statement
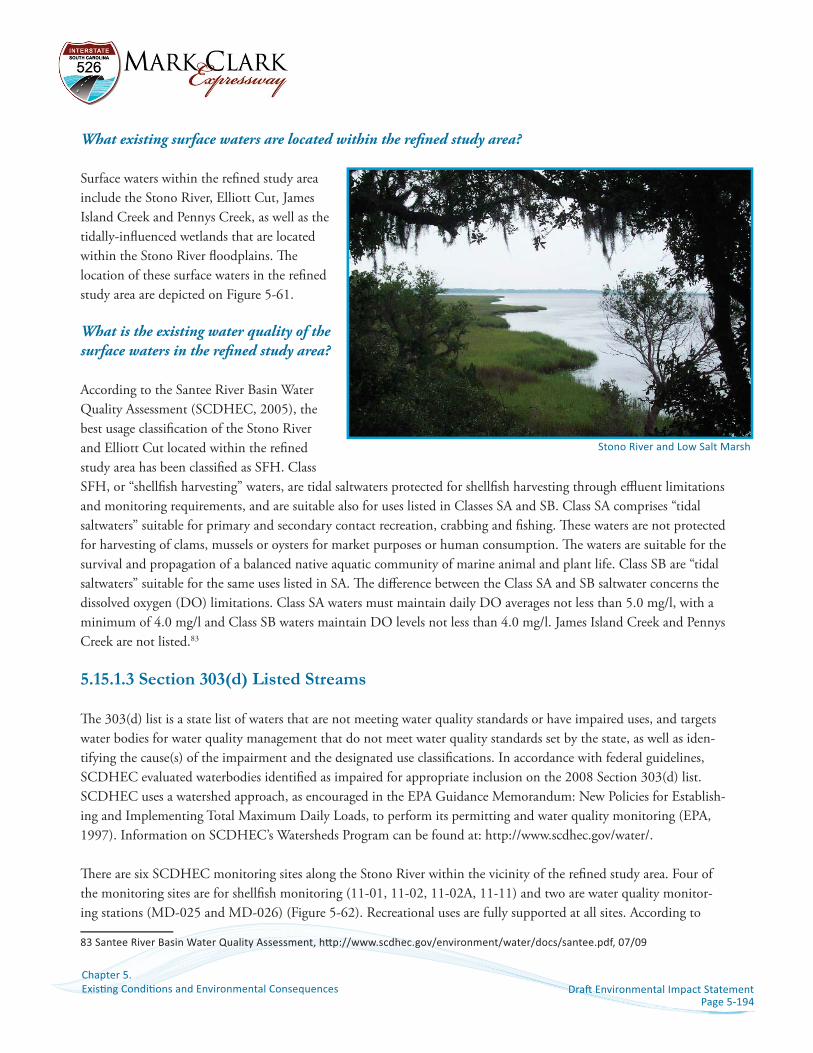
What existing surface waters are located within the refi ned study area?
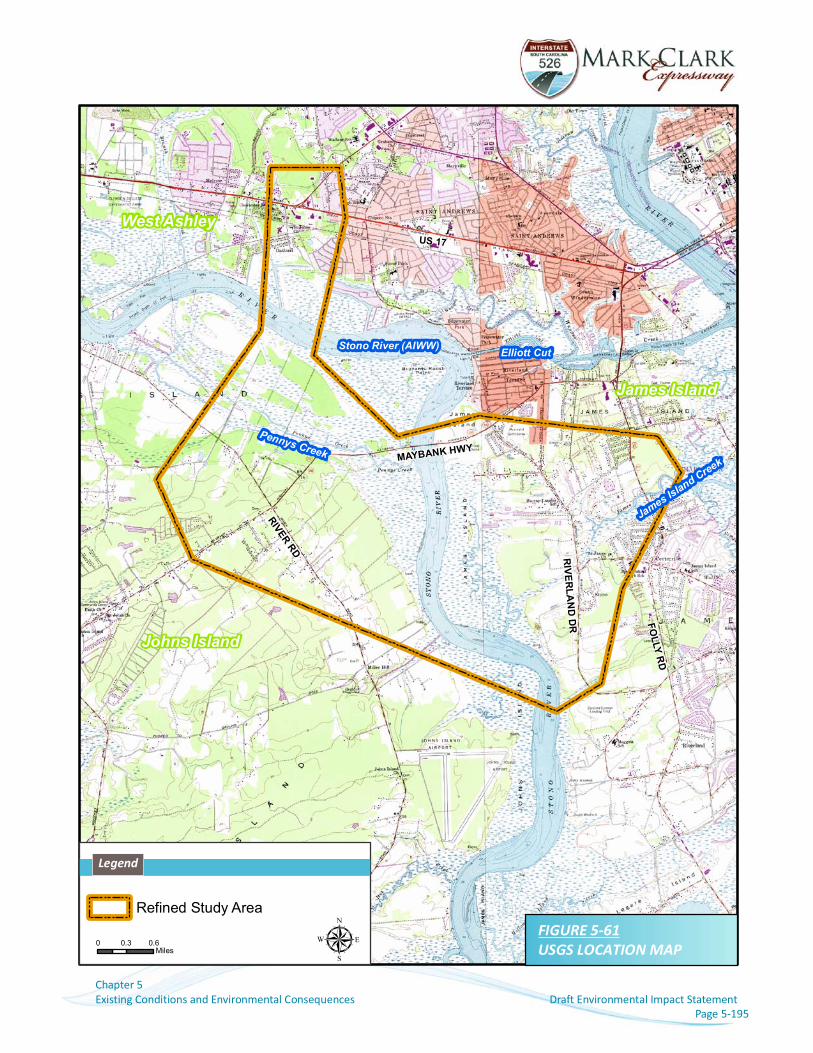
Surface waters within the refi ned study area include the Stono River, Elliott Cut, James Island Creek and Pennys Creek, as well as the tidally-infl uenced wetlands that are located within the Stono River fl oodplains. Th e location of these surface waters in the refi ned study area are depicted on Figure 5-61.
What is the existing water quality of the surface waters in the refi ned study area?
According to the Santee River Basin Water Quality Assessment (SCDHEC, 2005), the best usage classifi cation of the Stono River and Elliott Cut located within the refi ned study area has been classifi ed as SFH. Class SFH, or “shellfi sh harvesting” waters, are tidal saltwaters protected for shellfi sh harvesting through effl uent limitations and monitoring requirements, and are suitable also for uses listed in Classes SA and SB. Class SA comprises “tidal saltwaters” suitable for primary and secondary contact recreation, crabbing and fi shing. Th ese waters are not protected for harvesting of clams, mussels or oysters for market purposes or human consumption. Th e waters are suitable for the survival and propagation of a balanced native aquatic community of marine animal and plant life. Class SB are “tidal saltwaters” suitable for the same uses listed in SA. Th e diff erence between the Class SA and SB saltwater concerns the dissolved oxygen (DO) limitations. Class SA waters must maintain daily DO averages not less than 5.0 mg/l, with a minimum of 4.0 mg/l and Class SB waters maintain DO levels not less than 4.0 mg/l. James Island Creek and Pennys Creek are not listed.83
5.15.1.3 Section 303(d) Listed Streams
Th e 303(d) list is a state list of waters that are not meeting water quality standards or have impaired uses, and targets water bodies for water quality management that do not meet water quality standards set by the state, as well as iden-tifying the cause(s) of the impairment and the designated use classifi cations. In accordance with federal guidelines, SCDHEC evaluated waterbodies identifi ed as impaired for appropriate inclusion on the 2008 Section 303(d) list. SCDHEC uses a watershed approach, as encouraged in the EPA Guidance Memorandum: New Policies for Establish-ing and Implementing Total Maximum Daily Loads, to perform its permitting and water quality monitoring (EPA, 1997). Information on SCDHEC’s Watersheds Program can be found at: http://www.scdhec.gov/water/.
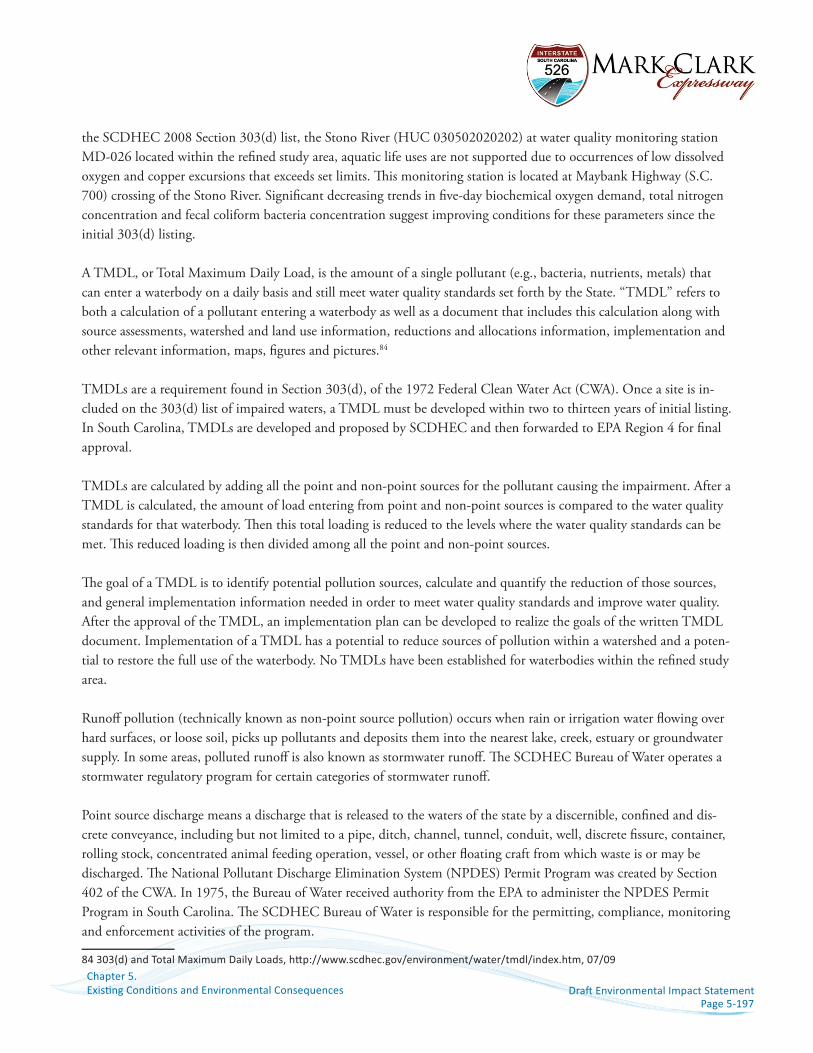
Th ere are six SCDHEC monitoring sites along the Stono River within the vicinity of the refi ned study area. Four of the monitoring sites are for shellfi sh monitoring (11-01, 11-02, 11-02A, 11-11) and two are water quality monitor-ing stations (MD-025 and MD-026) (Figure 5-62). Recreational uses are fully supported at all sites. According to
83 Santee River Basin Water Quality Assessment, h� p://www.scdhec.gov/environment/water/docs/santee.pdf, 07/09
Stono River and Low Salt Marsh
Existing Conditions and Environmental Consequences Draft Environmental Impact StatementChapter 5
0 0.3 0.6Miles µ FIGURE 5-61
USGS LOCATION MAP
James Island
West Ashley
Johns Island
MAYBANKHWY
RIVERRD R
IVERLANDDR FOLLY
RD
US 17
Stono River (AIWW)
Refined Study Area
Page 5-195
Pennys Creek
JamesIslandCreek
Elliott Cut
Legend
Existing Conditions and Environmental Consequences Draft Environmental Impact StatementChapter 5
0 0.5 1Miles µ
Legend
FIGURE 5-62WATER QUALITY AND SHELLFISHMONITORING STATIONS MAP
11-11
MD-052
11-20
MD-020
MD-02511-01
11-02MD-026
11-02A
11-03
10B-08
Refined Study Area
Water Quality Monitoring Stations
Shellfish Monitoring Stations
West Ashley
Johns Island
James Island
Stono River (AIWW)
MAYBANK HWY
RIVER RD
JAMES ISLAND
CONN
US 17
RIVER
LANDRD
§̈¦526FOLLY
RD
Page 5-196
Page 5-197
Chapter 5. Exis� ng Condi� ons and Environmental Consequences Dra� Environmental Impact Statement
the SCDHEC 2008 Section 303(d) list, the Stono River (HUC 030502020202) at water quality monitoring station MD-026 located within the refi ned study area, aquatic life uses are not supported due to occurrences of low dissolved oxygen and copper excursions that exceeds set limits. Th is monitoring station is located at Maybank Highway (S.C. 700) crossing of the Stono River. Signifi cant decreasing trends in fi ve-day biochemical oxygen demand, total nitrogen concentration and fecal coliform bacteria concentration suggest improving conditions for these parameters since the initial 303(d) listing.
A TMDL, or Total Maximum Daily Load, is the amount of a single pollutant (e.g., bacteria, nutrients, metals) that can enter a waterbody on a daily basis and still meet water quality standards set forth by the State. “TMDL” refers to both a calculation of a pollutant entering a waterbody as well as a document that includes this calculation along with source assessments, watershed and land use information, reductions and allocations information, implementation and other relevant information, maps, fi gures and pictures.84
TMDLs are a requirement found in Section 303(d), of the 1972 Federal Clean Water Act (CWA). Once a site is in-cluded on the 303(d) list of impaired waters, a TMDL must be developed within two to thirteen years of initial listing. In South Carolina, TMDLs are developed and proposed by SCDHEC and then forwarded to EPA Region 4 for fi nal approval.
TMDLs are calculated by adding all the point and non-point sources for the pollutant causing the impairment. After a TMDL is calculated, the amount of load entering from point and non-point sources is compared to the water quality standards for that waterbody. Th en this total loading is reduced to the levels where the water quality standards can be met. Th is reduced loading is then divided among all the point and non-point sources.
Th e goal of a TMDL is to identify potential pollution sources, calculate and quantify the reduction of those sources, and general implementation information needed in order to meet water quality standards and improve water quality. After the approval of the TMDL, an implementation plan can be developed to realize the goals of the written TMDL document. Implementation of a TMDL has a potential to reduce sources of pollution within a watershed and a poten-tial to restore the full use of the waterbody. No TMDLs have been established for waterbodies within the refi ned study area.
Runoff pollution (technically known as non-point source pollution) occurs when rain or irrigation water fl owing over hard surfaces, or loose soil, picks up pollutants and deposits them into the nearest lake, creek, estuary or groundwater supply. In some areas, polluted runoff is also known as stormwater runoff . Th e SCDHEC Bureau of Water operates a stormwater regulatory program for certain categories of stormwater runoff .
Point source discharge means a discharge that is released to the waters of the state by a discernible, confi ned and dis-crete conveyance, including but not limited to a pipe, ditch, channel, tunnel, conduit, well, discrete fi ssure, container, rolling stock, concentrated animal feeding operation, vessel, or other fl oating craft from which waste is or may be discharged. Th e National Pollutant Discharge Elimination System (NPDES) Permit Program was created by Section 402 of the CWA. In 1975, the Bureau of Water received authority from the EPA to administer the NPDES Permit Program in South Carolina. Th e SCDHEC Bureau of Water is responsible for the permitting, compliance, monitoring and enforcement activities of the program.
84 303(d) and Total Maximum Daily Loads, h� p://www.scdhec.gov/environment/water/tmdl/index.htm, 07/09
Page 5-198
Chapter 5. Exis� ng Condi� ons and Environmental Consequences Dra� Environmental Impact Statement
Persons with point source discharges to surface waters are required to have NPDES permits. Typical regulated point source discharges are:
• discharges from wastewater treatment systems owned by municipalities, industries, • private utilities, State and Federal government, etc.; • discharges such as cooling water, boiler blow down, etc.; • stormwater discharges from municipal separate storm sewer systems (MS4s); • stormwater discharges associated with industrial activity; and • stormwater dischargers from construction sites.
One NPDES facility has been identifi ed within the Stono River watershed. A minor industrial discharge NPDES permit for the Ravenel Mine has been granted for a discharge to Middle Branch according to the SCDHEC Bureau of Water. Th is discharge is located approximately 14 miles upstream of the refi ned study area.
5.15.1.4 Drinking Water
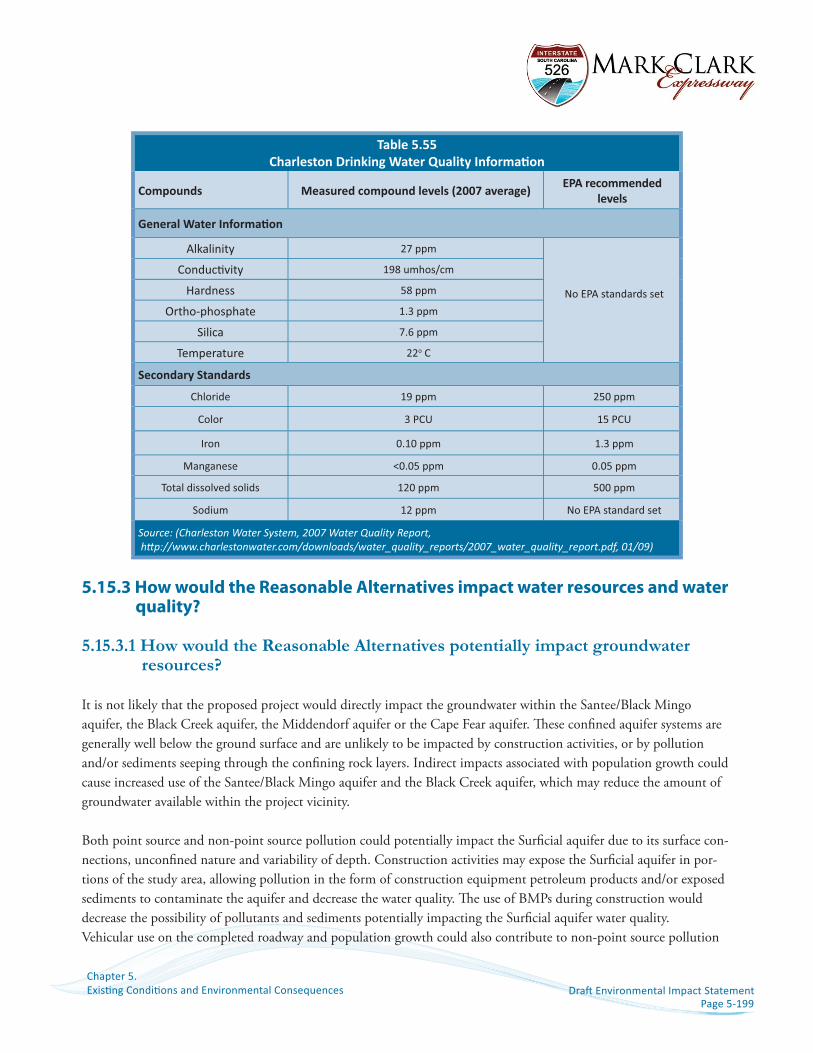
Surface waters are the source of drinking water for the study area. Surface waters from the Edisto River and Bushy Park Reservoir are treated at the Hanahan Water Treatment Plant in Charleston. Treated water is disinfected with chlora-mines and chlorine dioxide and fl uoride is added as recommended by the American Dental Association. Table 5.55 presents the water quality information prepared by Charleston Water System.
5.15.2 How would the No-build Alternative impact water resources and water quality?
Th e No-build Alternative would not complete the Mark Clark Expressway project nor improve existing roads beyond what is currently planned for the region. Th e No-build Alternative would not add additional roadway but could force traffi c to use other existing roadways in the study area. Higher pollutant loadings could result by increased traffi c vol-umes over time. A larger amount of pollutants could result at the stream crossings along these existing routes.
Page 5-199
Chapter 5. Exis� ng Condi� ons and Environmental Consequences Dra� Environmental Impact Statement
Table 5.55Charleston Drinking Water Quality Informa� on
Source: (Charleston Water System, 2007 Water Quality Report, h� p://www.charlestonwater.com/downloads/water_quality_reports/2007_water_quality_report.pdf, 01/09)
5.15.3 How would the Reasonable Alternatives impact water resources and water quality?
5.15.3.1 How would the Reasonable Alternatives potentially impact groundwater resources?
It is not likely that the proposed project would directly impact the groundwater within the Santee/Black Mingo aquifer, the Black Creek aquifer, the Middendorf aquifer or the Cape Fear aquifer. Th ese confi ned aquifer systems are generally well below the ground surface and are unlikely to be impacted by construction activities, or by pollution and/or sediments seeping through the confi ning rock layers. Indirect impacts associated with population growth could cause increased use of the Santee/Black Mingo aquifer and the Black Creek aquifer, which may reduce the amount of groundwater available within the project vicinity.
Both point source and non-point source pollution could potentially impact the Surfi cial aquifer due to its surface con-nections, unconfi ned nature and variability of depth. Construction activities may expose the Surfi cial aquifer in por-tions of the study area, allowing pollution in the form of construction equipment petroleum products and/or exposed sediments to contaminate the aquifer and decrease the water quality. Th e use of BMPs during construction would decrease the possibility of pollutants and sediments potentially impacting the Surfi cial aquifer water quality.Vehicular use on the completed roadway and population growth could also contribute to non-point source pollution
Page 5-200
Chapter 5. Exis� ng Condi� ons and Environmental Consequences Dra� Environmental Impact Statement
impacts to the Surfi cial aquifer. Th e implementation of a stormwater management plan for the collection and treat-ment of roadway stormwater runoff would decrease the potential of pollutants and sediments to impact the Surfi cial aquifer water quality.
5.15.3.2 How would the Reasonable Alternatives potentially impact surface water resources?
No outstanding resource waters are located within the refi ned study area. Th e tidal saltwaters of the refi ned study area are classifi ed as SFH and are protected for shellfi sh harvesting. Two locations along the Stono River have been listed on the 303(d) list of impaired waters and are subject to TMDL development. Each of the build alternatives crosses the Stono River two times.
Both point source and non-point source pollution could potentially impact the surface water resources within the study area as a result of the clearing of vegetation, land grading, and other road construction activities. Increased ero-sion and sedimentation, altered drainage patterns, increased surface water temperatures and decreased clarity could re-sult from these construction activities. Post-construction impacts in the area of the proposed new roadway could result from the increased opportunity for petroleum discharges, the use of herbicides/pesticides along the roadside, mowing and maintaining the roadsides and roadway striping and resurfacing.
Stream crossings have been evaluated for the build alternatives to determine potential impacts to streams within the project corridor. Placement of piers and abutments would be evaluated during the design stage to determine potential surface water impacts and eff orts would be made to minimize these stream impacts to the greatest extent practicable.
5.15.3.3 How would the Reasonable Alternatives result in waterbody and stream modi� cation?
Th e type and amount of impacts to the streams would depend on the build alternative that is ultimately selected, the location of the stream crossings, the width of the roadway at the crossing and the type of structure. Bridge crossings could impact streams by the placement of piers within the channel or on the banks, the placement of bridge abut-ments on the banks and the type of abutment protection. Stream impacts may be completely avoided by spanning the entire waterway to be crossed, i.e., from upland to upland.
All stream crossings would attempt to maintain a perpendicular crossing in order to minimize potential impacts to the greatest extent practicable. Th e use of culverts or bridges at the stream crossings would be determined, in part, by the results of hydraulic and hydrologic studies that would be conducted. A Federal Emergency Management Agency (FEMA) “No-Rise” certifi cation will be required to ensure that area fl ood elevations are not increased by the placement of a structure within the stream. Pursuant to the FEMA certifi cation, the project will be designed to allow for no more than a one-foot rise in fl ood elevations.
It is likely that the smaller stream crossings would utilize a pipe or box culvert type structure to convey the stream fl ow under the roadway. Culvert crossings could have associated fi ll impacts, alter the channel bottom substrate and migra-tion pathways of aquatic organisms, and could alter fl ow patterns, fl ooding elevations and velocities within the stream
Page 5-201
Chapter 5. Exis� ng Condi� ons and Environmental Consequences Dra� Environmental Impact Statement
channel. Proper design and placement of the culvert at the crossings would minimize these impacts.
Th e use of bridges at the larger stream crossings would help to minimize fi ll impacts, as well as minimize changes to the stream fl ow and fl ooding. Bridges would be designed, when practicable, to span the entire stream channel to be crossed, and completely avoid impacts to the stream bottom. Data regarding potential stream crossings and water body modifi cation are summarized in Table 5.56. Total linear feet of stream crossings were estimated by an overlay of the proposed build alternative alignments and the GPS-surveyed USACE fi eld confi rmed boundaries of waters of the U.S. Each of the build alternatives would cross the Stono River twice. Th e build alternatives would be along the same right of way north of the Stono River, and another bridge crossing common to all of the alternatives would include Tributary A. Each of the build alternatives (except for Alternatives F and G) would likely require improvements to the existing bridge crossing of James Island Creek at Folly Road. Total linear feet of unbridged stream impacts takes into account the potential avoidance of the preliminary bridge construction locations and lengths.
Table 5.56Poten� al Es� mated Stream Crossings by the Build Alterna� ves
Alterna� ve
Loca� on A B C D E F G
Stono River (# of Crossings) 2 2 2 2 2 2 2
Stream (# of total crossings) 10 10 10 19 15 11 17
Total Linear Feet of Impacts (lf)* 4,712 lf 2, 970 lf 5,507 lf 5,300 lf 5,298 lf 3,806 lf 5,427 lf
Total Area of Stream Crossings (acres)
22.18 20.43 21.97 22.3 22.3 16.58 16.92
Stream (# of Unbridged Crossings) 3 6 3 7 6 2 5
Total Linear Feet of Unbridged Stream Impacts (lf)*
*Total linear feet of stream impacts does not take into account the possible avoidance of impacts by the use of bridges.Source: Poten� al es� mated stream crossing impacts calculated by overlaying the US Census Water layer onto the preliminary bridge construc� on loca� on/lengths for each proposed build alterna� ve.
Alternative A would cross an estimated 12 streams and all but three of these crossings would be bridged. Major stream crossings to be bridged for this proposed alignment would include two areas of the Stono River, as well as James Island Creek, Pennys Creek and Tributaries A and B. Th e crossing of James Island Creek would be located at the exist-ing Folly Road bridge crossing that would likely be improved as part of this alternative. Multiple crossings of Pennys Creek are also anticipated as part of the planned interchange at Maybank Highway. Th e area of river, canals, streams and other tributary waters to be crossed is estimated to be approximately 4,712 linear feet and 22.18 acres. Th e total
Page 5-202
Chapter 5. Exis� ng Condi� ons and Environmental Consequences Dra� Environmental Impact Statement
alignment area for Alternative A is 349.53 acres so approximately 6.3 percent of the alignment would be crossings (Figures 5-63 to 5-66). Based on the preliminary bridge construction location/lengths, Alternative A would result in three unbridged stream crossings. Th ese three unbridged crossings would result in potential fi ll impacts of approxi-mately 574 linear feet (0.74 acre) of stream.
Alternative B would cross an estimated 12 streams with six of these crossings being bridged. Major stream crossings to be bridged for this proposed alignment would include two areas of the Stono River, as well as James Island Creek, Pennys Creek and Tributaries A and B. Th e crossing of James Island Creek would be located at the existing Folly Road bridge crossing that would likely be improved as part of this alternative. Th e area of river, canals, streams and other tributary waters to be crossed is estimated to be approximately 2,970 linear feet 20.43 acres. Th e total alignment area for Alternative B is 370.55 acres so approximately 5.5 percent of the alignment would be crossings (Figures 5-63 to 5-66). Based on the preliminary bridge construction location/lengths, Alternative B would result in six unbridged stream crossings. Th ese six unbridged crossings would result in potential fi ll impacts of approximately 1,095 linear feet (1.06 acres) of stream.
Alternative C would cross an estimated 12 streams and all but three of these crossings would be bridged. Major stream crossings to be bridged for this proposed alignment would include two areas of the Stono River, as well as James Island Creek, Pennys Creek and Tributaries A and B. Th e crossing of James Island Creek would be located at the exist-ing Folly Road bridge crossing that would likely be improved as part of this alternative. Multiple crossings of Pennys Creek are also anticipated as part of the planned interchange at Maybank Highway. Th e area of river, canals, streams and other tributary waters to be crossed is estimated to be approximately 5,507 linear feet and 21.97 acres. Th e total alignment area for Alternative C is 315.64 acres so approximately 7.0 percent of the a)lignment would be crossings (Figures 5-63 to 5-66). Based on the preliminary bridge construction location/lengths, Alternative C would result in three unbridged stream crossings. Th ese three unbridged crossings would result in potential fi ll impacts of approxi-mately 874 linear feet (0.68 acre) of stream.
Alternative D would cross an estimated 21 streams and all but seven of these crossings would be bridged. Major stream crossings to be bridged for this proposed alignment would include two areas of the Stono River, as well as James Island Creek, Pennys Creek and Tributaries A and B. Th e crossing of James Island Creek would be located at the existing Folly Road bridge crossing that would likely be improved as part of this alternative. Two crossings of Pennys Creek are also anticipated due to the roadway spur planned for this alternative. Th e area of river, canals, streams and other tributary waters to be crossed is estimated to be approximately 5,300 linear feet and 22.3 acres. Th e total align-ment area for Alternative D is 408.38 acres so approximately 5.5 percent of the alignment would be crossings (Figures 5-63 to 5-66). Based on the preliminary bridge construction location/lengths, Alternative D would result in seven unbridged stream crossings. Th ese seven unbridged crossings would result in potential fi ll impacts of approximately 1,601 linear feet (0.91 acre) of stream.
Alternative E would cross an estimated 17 streams and all but six of these crossings would be bridged. Major stream crossings to be bridged for this proposed alignment would include two areas of the Stono River, as well as James Island Creek, Pennys Creek and Tributaries A and B. Th e crossing of James Island Creek would be located at the existing Folly Road bridge crossing that would likely be improved as part of this alternative. Two crossings of Pennys Creek are also anticipated due to the roadway spur planned for this alternative. Th e area of river, canals, streams and other tribu-
Page 5-203
Chapter 5. Exis� ng Condi� ons and Environmental Consequences Dra� Environmental Impact Statement
tary waters to be crossed is estimated to be approximately 5,298 linear feet and 22.3 acres. Th e total alignment area for Alternative E is 367.55 acres so approximately 6.1 percent of the alignment would be crossings (Figures 5-63 to 5-66). Based on the preliminary bridge construction location/lengths, Alternative E would result in six unbridged stream crossings. Th ese six unbridged crossings would result in potential fi ll impacts of approximately 1,600 linear feet (0.89 acre) of stream.
Alternative F would cross an estimated 13 streams and all but two of these crossings would be bridged. Major stream crossings to be bridged for this proposed alignment would include two areas of the Stono River, as well as Pennys Creek and Tributaries A and B. Two crossings of Pennys Creek are anticipated due to the roadway connector planned for this alternative. Th e area of river, canals, streams and other tributary waters to be crossed is estimated to be approxi-mately 3,806 linear feet and 16.58 acres. Th e total alignment area for Alternative F is 257.59 acres so approximately 6.4 percent of the alignment would be a crossing (Figures 5-63 to 5-66). Based on the preliminary bridge construc-tion location/lengths, Alternative F would result in two unbridged stream crossings. Th ese two unbridged crossings would result in potential fi ll impacts of approximately 409 linear feet (0.41 acre) of stream.
Alternative G would cross an estimated 19 streams and all but fi ve of these crossings would be bridged. Major stream crossings to be bridged for this proposed alignment would include two areas of the Stono River, as well as Pennys Creek and Tributaries A and B. Two crossings of Pennys Creek are anticipated due to the roadway connector planned for this alternative. Th e area of river, canals, streams and other tributary waters to be crossed is estimated to be approxi-mately 5,427 linear feet and 16.91 acres. Th e total alignment area for Alternative G is 274.59 acres so approximately 6.2 percent of the alignment would be crossings (Figures 5-63 to 5-66). Based on the preliminary bridge construction location/lengths, Alternative G would result in fi ve unbridged stream crossings. Th ese fi ve unbridged crossings would result in potential fi ll impacts of approximately 939 linear feet (0.55 acre) of stream.
5.15.3.4 How would the Reasonable Alternatives result in pollutant runoff into streams?
Traffi c volumes on the new roadway could result in an increase of pollutants being discharged into the receiving waters along the project corridor. Potential water quality impacts from the petroleum compounds, brake dust, tire rubber and exhaust particulates that can accumulate on active roadways and get washed into receiving waters during stormwater events could occur. Additional pollutants in stormwater runoff resulting from roadway maintenance activities and roadway shoulder vegetative controls that may use herbicides could also contribute to decreased water quality.
BMPs would be implemented as engineering controls on the roadway for stormwater runoff collection and treatment. BMPs that are installed correctly along the roadway would help to minimize water quality impacts resulting from pol-lutants carried by roadway stormwater runoff . Continued maintenance of these stormwater BMPs would ensure that these controls are functioning properly for the protection of area waters.
Indirect impacts could occur to waters in the refi ned study area resulting from stormwater runoff from the new imper-vious roadway surfaces. Increased development could result from the new roadway, and the construction of the new development could also contribute to indirect and cumulative impacts.