Page 1
Author: Pokhrel Bhattarai, Poonam Title: Techniques for Reduction of Non-technical Losses in Electrical Power Utilities
The accompanying research report is submitted to the University of Wisconsin-Stout, Graduate School in partial
completion of the requirements for the
Graduate Degree/ Major: MS Technology Management
Research Adviser: John Dzissah, Ph.D.
Submission TermN ear: Spring/ 2012
Number of Pages: 65
Style Manual Used: American Psychological Association, 6th edition
~ I understand that this research report must be officially approved by the Graduate School and that an electronic copy of the approved version will be made available through the University Library website ~ I attest that the research report is my original work (that any copyrightable materials have been used with the permission of the original authors), and as such, it is automatically protected by the laws, rules, and regulations of the U.S. Copyright Office.
STUDENT'S NAME: Poonam Pokhrel Bhattarai
STUDENT'S SIGNATURE: ~ ?~
1
ADVISER'S NAME (Committee Cha~~ or EdS, Thesis or Field Project/Problem): John Dzissah
ADVISER'S SIGNATURE: //Jr ~ DATE: .~.t_{~?/12...
This section for MS Plan A Thesis or EdS Thesis/Field Project papers only Committee members (other than your adviser who is listed in the section above)
1. CMTE MEMBER'S NAME:
SIGNATURE: DATE: .......... .
2. CMTE MEMBER'S NAME:
SIGNATURE: DATE: ......... ..
3. CMTE MEMBER'S NAME:
SIGNATURE: DATE: ........ ..
This section to be completed by the Graduate School This final research repmt has been approved by the Graduate School.
(Director, Office of Graduate Studies) (Date)
Page 2
2
Pokhrel Bhattarai Poonam. Techniques for Reduction of Non-technical Losses in Electrical
Power Utilities
Abstract
The majority of the citizens of Nepal do not have electricity and the rest get intermittent
supply. The electricity generated is not sufficient for the total demand and the available energy
is not being used efficiently. On top of the technical losses inherent to the power system, there
are non technical losses like electricity theft and billing inefficiencies, which has contributed to
the ongoing load shedding. This paper has explored different non-technical losses and suggested
strategies, tools and techniques that can help to reduce such losses.
The losses are highly dependent on geographical structure, socio-economical factors and
political conditions. Although Nepal Electricity Authority (NEA) service area is not very large,
there are varieties within it. Therefore the loss reduction requires detailed research and different
innovative techniques. On the rural areas, where poor residents steal electricity by illegal
hooking, a community based approach is proposed. For the larger customers like industries and
hotels, who are involved in metering alteration, the advancement in metering infrastructure is
effective. For the customers who have not paid bills, a collection strategy is proposed and
prepaid metering is suggested. These custom designed innovative approaches will help to reduce
the electricity loss and contribute in the reduction of the ongoing power shortage in Nepal.
Page 3
3
Acknowledgments
The author would like to gratefully acknowledge the inspiration, encouragement, and
guidance of her advisor, Dr. John Dzissah, the Program Director, Dr. James Keyes and Sally
Dresdow for the research and development of this project. A special note of appreciation is
extended to the Nepal Electricity Authority IT department and its employees for providing the
data and information required for this research and guiding towards the source of information.
Finally, the author would like to thank her husband, parents, sisters and friends for their
technical support and encouragement.
Page 4
4
Table of Contents
Abstract ........................................................................................................................................... 2
List of Figures ................................................................................................................................. 6
Chapter I: Introduction .................................................................................................................... 7
Statement of the Problem ............................................................................................................... 9
Purpose of the Study........................................................................................................................ 9
Definition of Terms .......................................................................................................................... 9
Limitations of the Study ................................................................................................................. 10
Chapter II: Literature Review ....................................................................................................... 11
Electricity Loss ................................................................................................................................ 11
Technical Losses ............................................................................................................................. 12
Non-Technical Losses (NTLs) .......................................................................................................... 12
NTLs in Different Countries ............................................................................................................ 15
Present Research and Solutions .................................................................................................... 17
Summary ........................................................................................................................................ 24
Chapter III: Methodology ............................................................................................................. 25
Data Sources Identification and Data Collection ........................................................................... 27
Data Identification ......................................................................................................................... 28
Data Processing .............................................................................................................................. 28
Determination of High Loss Areas ................................................................................................. 29
Determination of Types of Electricity Theft by Large Customers .................................................. 29
Determination of Customers with High Unpaid Bills ..................................................................... 30
Solution Development and Recommendation .............................................................................. 30
Chapter IV: Results ....................................................................................................................... 31
Data Analysis .................................................................................................................................. 31
Solution Recommendation ............................................................................................................ 34
Solution 1: Community Based Approach ....................................................................................... 34
Solution 2: Automatic Metering Infrastructure (AMI) ................................................................... 37
Solution 3: Pre-paid Metering System ........................................................................................... 44
Summary ........................................................................................................................................ 47
Chapter V: Discussion .................................................................................................................. 48
Page 5
5
Conclusion ...................................................................................................................................... 48
Future Works ................................................................................................................................. 50
References ..................................................................................................................................... 51
Appendix A: Collected Data ......................................................................................................... 55
Appendix B: Survey Questionnaire .............................................................................................. 63
Appendix C: Power System Map of Nepal ................................................................................... 65
Page 6
6
List of Figures
Figure 1. Flowchart of the research methodology ..................................................................................... 26
Figure 2. Priority index with the average losses in different feeders of Nepal .......................................... 31
Figure 3. The community based solution flowchart................................................................................... 35
Figure 4. A typical KWh meter and its construction ................................................................................. 38
Figure 5. A typical 1-phase meter connection circuit ................................................................................ 38
Figure 6. A typical 3-phase meter connection circuit ................................................................................ 39
Figure 7. Proposed overview of AMI for NEA system ............................................................................. 41
Figure 8. Mechanical to optical signal conversion..................................................................................... 42
Figure 9. Unpaid bills collection procedure ............................................................................................... 44
Figure 10. Pre paid metering application flowchart ................................................................................... 46
Figure 11. Block diagram of pre paid system ............................................................................................ 47
Page 7
7
Chapter I: Introduction
An electrical utility company engages in producing and providing electricity to its
customers. A typical utility contains a large interconnected power system consisting of
generation plants, substations, transmission lines, distribution systems and the load. The
generation plants can be hydro, solar, gas, wind, etc. The load for the system includes
residential, industrial and recreational areas. The generation plants and load are normally located
geographically far from each other and they are connected by transmission lines which may go
through desert, jungles or even mountains. From generating plants to load, voltage quality and
reliability are challenging issues in electrical utility industry.
Although the energy is surplus in most of the developed countries, it is still not available
to everyone on the planet. The third world countries have not been able to provide electricity to
all their citizens. The power sector in Nepal is struggling to fulfill the customer demand as it
does not have enough generation capacity and transmission grid is not properly planned (GIZ,
2011). Although Nepal has approximately 40,000 MW of economically feasible hydropower
potential, it has only generated about 600 MW of electricity (IPPAN, 2006). Only about forty
percent of the population in Nepal has access to electricity and the Nepalese experience up to
fourteen hours of scheduled load shedding each day. The residences are out of power when
people need them most, the businesses and industries cannot run full time and business and
service sectors need to be closed due to the shortage of electricity. Due to the increase in
population and industrialization, the electricity demand is increasing by about seven to nine
percent per year (IPPAN, 2006). As the load shedding time is directly proportional to the
increase in demand, the conditions will be worse.
Page 8
8
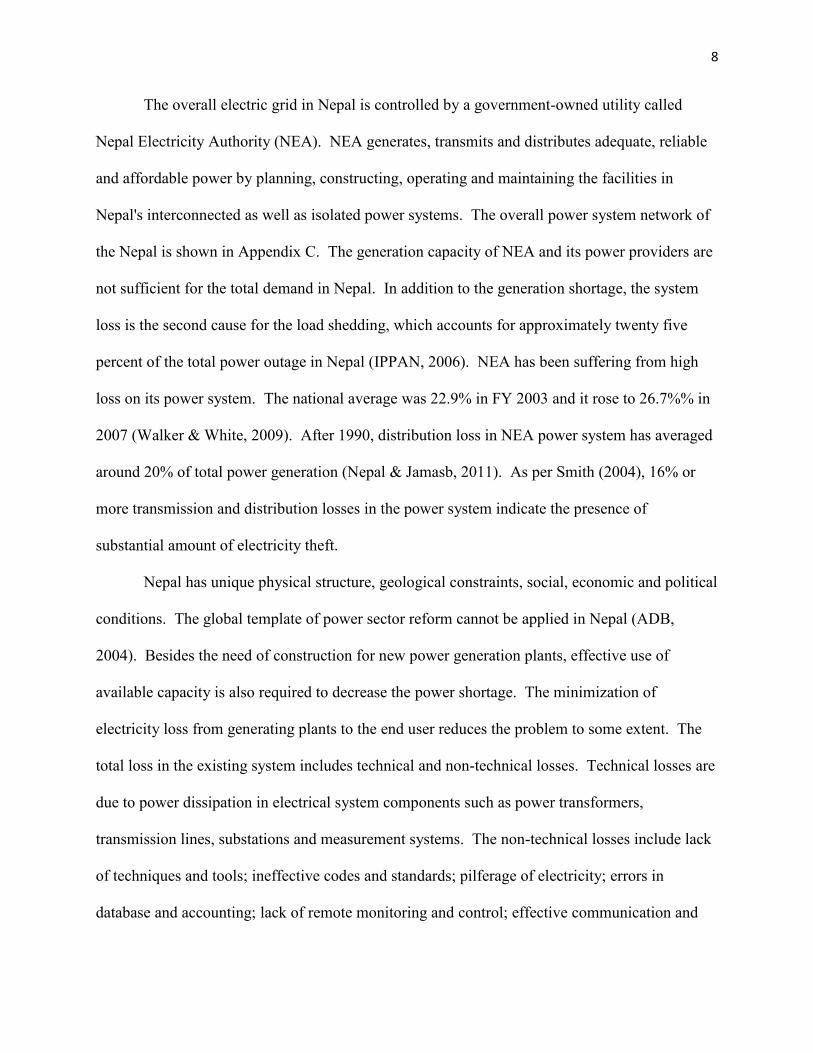
The overall electric grid in Nepal is controlled by a government-owned utility called
Nepal Electricity Authority (NEA). NEA generates, transmits and distributes adequate, reliable
and affordable power by planning, constructing, operating and maintaining the facilities in
Nepal's interconnected as well as isolated power systems. The overall power system network of
the Nepal is shown in Appendix C. The generation capacity of NEA and its power providers are
not sufficient for the total demand in Nepal. In addition to the generation shortage, the system
loss is the second cause for the load shedding, which accounts for approximately twenty five
percent of the total power outage in Nepal (IPPAN, 2006). NEA has been suffering from high
loss on its power system. The national average was 22.9% in FY 2003 and it rose to 26.7%% in
2007 (Walker & White, 2009). After 1990, distribution loss in NEA power system has averaged
around 20% of total power generation (Nepal & Jamasb, 2011). As per Smith (2004), 16% or
more transmission and distribution losses in the power system indicate the presence of
substantial amount of electricity theft.
Nepal has unique physical structure, geological constraints, social, economic and political
conditions. The global template of power sector reform cannot be applied in Nepal (ADB,
2004). Besides the need of construction for new power generation plants, effective use of
available capacity is also required to decrease the power shortage. The minimization of
electricity loss from generating plants to the end user reduces the problem to some extent. The
total loss in the existing system includes technical and non-technical losses. Technical losses are
due to power dissipation in electrical system components such as power transformers,
transmission lines, substations and measurement systems. The non-technical losses include lack
of techniques and tools; ineffective codes and standards; pilferage of electricity; errors in
database and accounting; lack of remote monitoring and control; effective communication and
Page 9
9
data integration. The technical losses are inherent to the power system and its equipment. This
research is primarily focused on minimizing non-technical losses within existing power system.
Statement of the Problem
The electrical power loss in the utility power system, due to non-technical losses like
electricity theft; metering and billing inefficiencies; administrative inefficiencies; etc, is one of
the major issues to be addressed to reduce the ongoing load shedding in the country of Nepal.
Purpose of the Study
The purpose of this study is to explore different non technical losses; suggest strategies,
tools and techniques that can help to reduce the non-technical power losses and increase the
quality and reliability of electricity supply. The research covers a typical electric power utility
focusing on a power system in the country of Nepal.
Definition of Terms
Distribution. A process of distributing electric energy from the dispatch center to
household, industries, businesses and recreational areas
Generation. A process of producing electric energy from hydro, coal, nuclear, wind, and
gas or bio fuel
GIS. Geographical information system, a system for storing and manipulating
geographical information on computer
Load. The electric power consumed by users connected to the distribution system
Load-shedding. A deliberate shutdown of electric power in a part of power distribution
system, to prevent the failure of the entire system by reducing power system load to match the
power generation supply (Gjukaj, Kabashi, Pula, Avdiu & Prebreza, 2011)
Page 10
10
Meter. A device that measures and adds up the power consumed by a load and adds it to
provide total Kilowatt-hour (KWh)
Outage. The loss of power supply resulting either from electricity shortage or equipment
failure
Per Capita. Income per person is a measure of mean income within an economic
aggregate, such as a country or city.
Purchasing Power Parity (PPP). In economics, PPP is a condition between countries
where an amount of money has the same purchasing power in different countries.
Reliability. The ability of a person or system to perform its functions in routine
circumstances as well as unexpected conditions
Substation. The node of the electric grid where voltage conversion, switching, metering,
control, protection and regulation functions are performed
Transformer. An electro-magnetic device that converts electric voltage from one level
to another
Transmission. A process of transmitting electric energy from generation plants to
dispatch or distribution centers
Limitations of the Study
The study is focused on reducing the outage and load shedding by providing the
techniques for minimizing power loss on the existing system, but it does not involve the study on
an installment of additional power generation plants. Investment on new power plants is a very
big project as compared to the investment on improving system loss. Additionally, the technical
power loss which is inherent to components of power system is not analyzed on this paper.
Page 11
11
Chapter II: Literature Review
This chapter presents a literature review starting with the background and theoretical
concepts relating to power system losses in the electrical utility industry. Electricity load loss
studies conducted in various countries and their means of implementation are presented. Some
background issues concerning fraud detection techniques used in electricity businesses are
reviewed. The fundamental objectives of power utilities are to maximize profit and minimize
operational costs and it requires dealing with the common problems of losses. Research on the
reduction of losses has been an active topic, and it has proven that the solutions to these
problems are unique for different countries and utilities.
Electricity Loss
Electricity losses can be defined as the difference between quantities of electricity
produced and the amount recorded as sold to customers. According to Thomas and Johnson,
“Data from the United States Department of Agriculture’s (USDA) Rural Utilities Service (RUS)
show that cooperative distribution system line losses were consistently around 6 % from 1994 to
2000 and 4.96 % during 2001” (n.d., p. 2). Total loss in the US economy due to electricity losses
in 2005 was estimated to be about $19.5 billion (ABB Inc, 2007).
Electricity losses that affect electrical utilities can be classified into two categories,
technical losses and non-technical losses. The research focuses on non-technical losses, but
often times both the losses may need to be analyzed together because the non-technical losses
can be obtained or estimated by subtracting technical losses from the total distribution network
losses. All estimates of non-technical losses are based on the accuracy of the calculation of
technical losses (World Bank Group, 2009; Smith, 2004; Nagi, 2009).
Page 12
12
Technical Losses
According to Piercy & Cress (2007), the technical losses in power systems are inherent to
the power system. It is caused by heat dissipation resulting from the current passing through
conductors and from magnetic losses in transformers, generator and turbine efficiency in
generation and transmission line loss. The power losses on these devices are due to internal
resistance. These losses can be well accounted, controlled and minimized but cannot be
eliminated completely. Optimization of technical losses in power systems is an engineering
issue involving classic tools of power system planning and modeling (World Bank Group, 2009).
Suriyamongkol (2002) stated the fact that the technical losses are calculated based on voltage,
current resistance, reactance and capacitance and power factor of the equipment. The tools for
calculating these losses are available in utility industry. Information technology and data
acquisition techniques have made the calculation and verification easier. With the technical
information of the electricity generators and the loads, expected technical losses in the power
system can be determined using load-flow analysis software(s).
Non-Technical Losses (NTLs)
NTLs refer to the electrical losses due to undetected load. The discrepancy between the
calculated loss and actual loss yields the extent of non-technical power loss. The cost of NTLs
adds up on the utility account and the costs will be passed along to the customers thereby
increasing their electricity bill (Suriyamongkal, 2002). NTLs in the electricity supply are
problems that have long been known to utilities. The factors contributing to NTLs, as indicated
by (Nagi, 2009; Nizar, Dong, Jalaluddin & Raffles, 2006; Smith, 2004; Suriyamongkol, 2002;
Thomas and Johnson, n.d.; Millard & Emmertson, 2009 & World Bank Group, 2009) can be
categorized to the following:
Page 13
13
Electricity theft
Component breakdowns
Metering inaccuracies
Billing inaccuracies and irregularities
Interchange Inaccuracies
Timing differences
Uncollectible accounts
Inaccurate estimation of unmetered loads
Inefficiency of business and technology management systems
Electricity theft is an attempt to reduce or eliminate the amount of money the customers
owe to the utility, and it includes unauthorized line tapping and meter tampering. In some cases,
where the excise duty, sales tax, etc. are determined based on the actual energy consumption, the
customers steal electricity for reducing expenses for them. An Indonesian utility, Perusahaan
Listrik Negara (PLN), reported the thefts accomplished by slowing down the meter rotation or
placing a metal strip in the meter to prevent the power usage recording (Millard & Emmertson,
2009). The consistency of the methods indicated that these methods were promoted by the party
with specific knowledge of meter tampering. The staffs were suspected to be paid by the large
customers for doing such illegal act. In developing countries there are concerns regarding
corrupt behavior of the utility employees, especially meter readers. Such fraud can never be
eliminated, but they can be prevented and reduced.
The equipment breakdown includes maintenance issues, equipment damage by lightning
age, etc. Most power companies maintain some form of maintenance policies and thus this issue
is not a critical part of total NTLs (Suriyamongkal, 2002).
Page 14
14
Metering inaccuracy losses are defined as the difference between the amount of energy
actually delivered through the meters and the amount registered by the meters (Navani, Sharma
& Sapra, 2004). Metering inaccuracies can either be at power plant meters or at customer billing
meters with the second one being more of an issue. All energy meters have some level of errors,
which is directly proportional to the total NTLs (World Bank Group, 2009). Such errors can be
either due to engineering or human errors. Billing irregularities are mostly done with the help of
corrupt internal employees (Millard & Emmertson, 2009).
The administrative losses by substations, utility offices, warehouses and workshops are
also considered as part of non-technical losses. Unmetered losses occur where the electricity
usage is estimated instead of metering, for example, in street lights, public parks and temporary
construction areas (Piercy & Cress, 2007). Non-payment of bills is mainly dependent on
countries economy and it is less common in developed countries (Millard & Emmertson, 2009).
Some portion of NTLs is being consumed by users that do not get billed for the electricity they
are using or they do not pay the bill. If measures are strong enough to make them pay bills, the
consumption reduces to their ability to pay. The amount of unpaid bill will reduce and so does
the NTLs.
Timing differences between power transmission and meter readings can be the source of
error especially on the power system that connects between places with different time zones.
According to BluTrend (2008), allowance for losses during utility-to-utility transactions and
power transmission across neighboring power systems generate some unaccountable losses. The
alteration of the account holder is also a point of error. A recent study on total of 30,367
apartments in Texas found 230 instances of meter disconnects that occurred when tenants moved
into an apartment and failed to enroll for electricity service under their name.
Page 15
15
NTLs in Different Countries
The problem of NTLs is not only faced by underdeveloped countries but also by
developed countries. The non-technical losses from utilities across North America, United
Kingdom and Australia, averages about 1.2% (Piercy & Cress, 2007). The United States NTLs
have been estimated to account in between 0.5% to 3.5% of the total annual revenue (Smith,
2004). In an article published in Electrical World T&D, Nesbit (2000) estimated that electricity
theft in the United States costs billions of dollars per year. The loss was estimated to be one
billion after eight years (BluTrend, 2008). American Electric Power annual report (2001) lists
109 million under “allowance for uncollectible accounts”.
High rates of NTL activities have been reported in developing countries like Bangladesh,
India, Pakistan and Lebanon , where an average of between 20 to 30 percent of NTLs have been
observed (Nagi, 2009 & World Bank Group, 2009). In 2004, Malaysia had revenue losses of
229 million a year as a result of electricity theft, faulty metering, and billing errors (Nagi, Yap,
Tiong, 2010). High losses in electricity distribution continue to be an issue jeopardizing
sustainability of the utility in several Latin American and Caribbean countries such as
Dominican Republic, Haiti, Nicaragua, Honduras, Venezuela and Ecuador (World Bank Group,
2009).
According to World Bank Group (2009), in sub-saharan Africa, only 50 percent of
electricity generated is paid for, due to low billing and collection rate. The condition in Nigeria
is worst with just 25 percent collection of the revenues owed. The exceptions are the state-
owned utilities of Botswana and South Africa with about 15 percent of total losses.
The amount of non-technical losses generally varies according to the economic
conditions of the country as shown in the Table 1 below (Millard & Emmertson, 2009). In
Page 16
16
countries with low PPP per capita income it is common to have higher levels of pilferage. High
cost of electricity compared to household income is the main cause of the customer’s idea of
stealing it. Exceptions are the countries like Indonesia and Thailand, who have remarkably low
non-technical loss although the GDP per capita is low. The reason behind this is the poor
customers receiving subsidized electricity that is affordable in the form of a social tariff. In
Venezuela, after implementing social tariff in 2001 electricity became affordable to poor
communities and non-technical losses reduced significantly.
Table 1
NTLs (2007) Compared to Economic Prosperity
Country NTLs (%) PPP Per Capita Income (Int $)
India 20 – 40 2700
Philippines 3.5 3300
Indonesia <5 3400
Jordan 3 to 5 4700
Jamaica 13.2 4800
China 10 5300
Thailand 0.32 8000
S Africa 10 10600
Venezuela 12.74 12800
UK,US, AUS 0.2-1 >30000
Electricity pilfering in developed countries is relatively low because the cost of
electricity, compared to household income, is relatively low. Energy Australia reported non-
Page 17
17
technical loss figure of 0.03% in 2005 and 0.19% in 2006. In New Zealand, non-technical losses
are reported to be between 0.3% and 1% and in UK the figure is from 0.2% to 1% (Millard &
Emmertson, 2009).
Present Research and Solutions
Suriyamongkal (2002) believes that NTLs are nearly impossible to quantify using power
system analysis techniques and tools. This is due to the lack of information and insufficient
inputs for any meaningful loss calculations. The information gathering is very difficult and
surveys conducted may not be accurate. The people who are involved on the theft are not likely
to fairly participate on the surveys when their own illegal actions would come to light. NTLs are
highly dependent on the nature of customers and laws and regulations of the country. So there is
no single formula or software to calculate it by easy means.
The government of Nepal has implemented Electricity Theft Control Act 2058 and the
Electricity Theft Control Regulations 2059. These acts treat electricity theft as a crime and
provide NEA more power to deal with the problem (Walker & White, 2009). Additionally, a
scheme of selling electricity to local cooperatives at discounted rates has been practiced. They
own and operate the local distribution networks and sell the electricity to the individual
customers (Walker & White, 2009). Experience in few areas of Nepal shows that the
involvement of local cooperatives helps to reduce the electricity theft and collect unpaid bills
faster (Yadoo & Cruickshank, 2010). Several methods have been proposed or implemented in
different part of the world in the past to overcome and minimize the NTL problems in power
systems. The common methods in use are as follows:
Watchdog Effect
Carrot and Stick Strategy
Page 18
18
Advertisement and Community Programs
Hardware Improvement
Advanced Metering Infrastructure (AMI)
Load Profile Monitoring
Communal Metering
Estimation Modeling with Statistical Approach
Artificial Intelligence Based Techniques
Reengineering of Business Operations
Watchdog Effect. According to World Bank Group (2009), a watchdog is a system that
can be used to protect things from any harmful actions. Onsite technical inspection of customers
to see if they are hooking with the line illegally or bypassing the meters has been a common
practice. Inspections can be made on random but frequent basis, in order to create perception in
the minds of users that there is a high risk of being caught. Off-cycle meter reading should be
undertaken on random basis to catch temporary meter tampering users. Suspected high loss
circuits should be identified and targeted for inspections. Large users should be focused more
than the smaller ones. The apprehension of customers who pilfer electricity can be generated by
involving police to conduct raids in customer’s premises. Where billing exceptions suggest
possibility of pilferage, the utility contacts the customer to inform that the utility is vigilant.
Preventions such as secure lock, seals, etc and detections such as observation, camera,
sensors, etc are commonly used conventional methods. Energy Australia has installed compact
recording instruments (theft monitors) in the streets of the suspected areas (Millard &
Emmertson, 2009). Detection of any abnormal consumption can be performed with the use of
Page 19
19
AMI (World Bank Group, 2009). It results consumer discipline because users become aware
that the utility can monitor such illegal acts any time.
Carrot and Stick Strategy. Encouraging consumers to report electricity theft and
offering financial rewards for information leading to conviction of anyone stealing electricity is
common practice (BluTrend, 2008). Some utilities provide motivations to the employees by the
KWh recovered or by the number of cases detected by them. PLN offers rewards for reporting
theft, which is in the form of cash equal to 3% of the total amount collected from the party
charged with theft (Millard & Emmertson, 2009). Amount to be recovered from the customers
can be estimated based on the customer’s load profile and historical billing pattern.
In USA, the law provides strong penalties for electricity or gas theft. The laws in some
countries are not rigid enough regarding the action the police can take and the routing to the
court where the fines or jail terms can be determined.
Advertisements and Community Programs. Pilferage tends to occur in communities
where illegal behavior becomes established as a cultural norm. Law enforcement and
punishment attempts tend to draw the community closer together and form a group to violate the
system (Millard and Emmertson (2009). Such problems cannot be tackled by law enforcement
alone and it can be reduced through community awareness.
According to Millard and Emmertson (2009), Meralco, a utility in Philippines, uses
television and radio advertising to promote customer awareness. It has established a text
messaging and an email facility and an anonymous reporting hotline program for curbing
electricity pilferage. In India, a communication program conducts advertisement in the air,
posters, and videos and a public outreach program conducts meetings and visits by trained utility
officials. Similarly, Jamaica Public Service Company (JPS) also introduced media campaign
Page 20
20
highlighting the legal consequences of electricity theft and safety issues of the illegal
connections. Publicity of theft is also an effective way of reducing it because most of the
consumers have much to lose if their fraudulent behavior is exposed. Recent experience in
countries such as the Dominican Republic and Honduras shows that consumers stop stealing if
they face the risk of social condemnation (World Bank Group, 2009).
Hardware Improvement. Thomas and Johnson (n.d.) indicated the importance of utility
data point equipment survey to see if they can deliver the accuracy and precisions required or
not. Mike Cleveland, Technical Services for Texas Meter and Device Company, finds that the
accuracy of current transformers (CTs) has a direct impact on metering data. Some utilities have
used low class relaying CTs as they are available in the market at low price. Replacing the
relaying CTs with metering class CTs increases the accuracy in metering and reduces NTLs.
Just like any other measurement devices, Kilowatt-hour meters installed at each residential and
commercial sector, have some level of accuracy and precision. Hardware improvement helps to
collect more accurate data thereby reducing the NTLs generated by them.
Advanced Metering Infrastructure (AMI). AMI consists of remote metering, data
acquisition and monitoring of electricity consumption. Rao and Miller (1999) claimed intelligent
electronic meters are the most effective method to reduce the fraud. According to Doorduin,
Mouton, Herman & Beukes (2004), the infrastructure is expensive and they are not feasible to be
used in residential and commercial loads. But drastic reductions in prices of metering and
telecommunication equipment are making their adoption economically feasible, starting with
large consumers and gradually to medium and small ones. Instances of theft by large consumers
usually involve collusion with meter readers. With the installation of AMI, an intelligent loss
management program can be implemented (Piercy & Cress, 2007). Implementation of AMI
Page 21
21
helps to prevent, detect and minimize the field corruption. In the last quarter of 2007, JPS
introduced AMI program for commercial customers. This program significantly improved the
company‘s ability to monitor customer consumption and losses on the system on a real time
basis (Millard & Emmertson, 2009).
The intelligence of AMI can be increased with the support of GIS. EDL, Lebanon has
developed GIS systems in ESRI platform and used it to track collections and losses. The system
contains an energy map that supports capturing real time data and monitor energy in and out.
The meter reading database, at different levels of the distribution network, is used to generate
reports for each billing cycle (Millard & Emmertson, 2009).
According to King (2004) Idaho Power started to apply AMI in 2004. Florida Power and
Light installed AMI in 1987 and it has been serving 710,000 customers as of 2004. ENEL
Power Co. in Italy has installed 30 million smart meters. In Sweden, 2003 legislature has
mandated AMI deployment to all power consumers. In Australia a decision was made in 2004 to
install AMI on large businesses by 2008, small businesses and large residents by 2011 and small
residents by 2013. In Canada, July 2004 Ontario ministry of Energy has directed to install
800,000 AMI meters by the end of 2007 and all Ontario customers by 2010. A low cost smart
meter concept, with some addition on existing analog meters, was proposed by Ahmed, Miah,
Islam and Uddin, 2011 in Bangladesh.
Load Profile Monitoring. Load profiling, i.e. the pattern of electricity consumption of a
customer(s) over a period of time, is one of the most widely used approaches (Gerbec, Gasperic,
Smon & Gubina, 2005). Data resolution can be significantly improved by implementing load
profiling of larger industrial and commercial accounts. The peak KW load can be determined at
time of the customer survey.
Page 22
22
Nagi, Yap &Tiong (2010) presented a framework to detect NTLs in electric utilities and
it was achieved by detecting customers with irregular consumption patterns. An automatic
feature extraction method using load profiles, with the combination of Support Vector Machine
(SVM), was used. The fraud detection model (FDM) developed in this research study preselects
suspected customers to be inspected on site based on irregularities in consumption behavior.
This research was based on a case study of different towns in Malaysia and uses historical
customer consumption data. Their future work was listed as “fuzzy logic”, a backbone for
intelligent decision making in selecting suspicious customers with high possibilities of fraud.
Communal Metering. According to Millard & Emmertson (2009), utility companies in
Russia and Eastern Europe practice “communal” metering where master meters are installed at
the entrance of the feeder to the community and customers are allocated a share of the total bill
according to individual meter reading. If an individual steals electricity the remaining customers
of the community will have to pay more than their fair share. The customers can also see
whether the allocation is equitable and how much extra money they are paying for others illegal
act. The utility company will not lose revenue if theft occurs beyond the point of the communal
metering. The responsibility falls with community leaders and support groups. This system
creates direct community pressure and acts to discourage offenders to perform illegal hooking.
For the poorest consumers who could not afford an individual connection, Electricity de
Caracas, Venezuela installed collective meters, for which groups of people were made
responsible collectively (Millard & Emmertson, 2009). Some residents assume responsibility for
each collective meter and coordinate the bill payments and disconnect those who do not pay. It
also allowed some room to delay payment for the poor customers with irregular income before
disconnection.
Page 23
23
Estimation Modeling with Statistical Approach. The future work section of the thesis
by Suriyamongkal (2002) listed use of statistical analysis methods for detecting electricity theft
by analyzing utility billing information. Conventional statistical methods have been proposed by
Fourie & Calmeyer (2004). Statistical analysis with data mining and decision trees have been
performed by Filho, Gontijo, Delaiba, Mazina, Cabral & Pinto (2004) and Nizar, Dong, Zhao &
Zhang, (2007). Leon, Biscarri, Monedero, Guerrero, Biscarri & Millan (2011) used Integrated
Expert System (IES) for a significant power distribution company in Spain called Endesa. The
IES includes several modules such as text mining module for extraction of customer information,
data mining module to estimate the load, and the expert system module to analyze each
customer. This is still in the testing phase in Endesa.
Artificial Intelligence Based Techniques. Jiang, Tagaris, Lachsz, & Jeffrey (2002)
proposed an intelligent analysis based on the assumption that meter-reading data contains
abnormalities when fraud occurs. The characteristics extraction was carried out and the
combination of multiple classifiers were used. Simulation results proved the method to be
effective in electricity fraud identification with 70% to 78% accuracy. Leal, Jardini, Magrini,
Ahn, Schmidt & Casolari (2006) has proposed a methodology based on artificial neural network
to evaluate losses in distribution system. This is performed by using the network’s data, the
consumer’s monthly energy consumption data and the typical load curves by consumer class and
activity classification.
Reengineering of Business Operations. World Bank Group (2009) identified that
implementation of pre-paid consumption is generally a very good commercial option for low-
income consumers. Installation and maintenance of pre-paid meters is being practiced in
Electricity de Caracas, Venezuela (Millard & Emmertson, 2009). Implementation of AMI,
Page 24
24
together with a commercial management system (CMS), makes pre-paid consumption of
electricity possible. AMI pre-paid consumption has recently been implemented in Brazil by the
company AMPLA.
Ownership through participation is a good policy and reduces the NTLs to some extent
because people think they are stealing their own money (PA Consulting Group, 2005). PLN
does not connect rural customers until there is sufficient economic strength to ensure that
customers can meet the social tariff obligations (Millard & Emmertson, 2009).
Millard & Emmertson (2009) identified the requirement of market segmentation for
improving business operations of utility industry. When total losses are high i.e. about 25
percent, large consumers account for a large fraction of the losses and they should be targeted
first for any action plan. In Turkey, after energy sector liberalization, the distribution network
was divided into 21 regions based on energy demand, geographical locations, management
structure, technical factors and economic conditions. Non-technical losses are generally low in
urban areas. Some regions have been privatized and the losses on those regions are lower.
Summary
The estimation and reduction of NTLs on electrical utilities are not straightforward.
There are several methods proposed and applied in different utilities around the world. Using the
combination of these methods is common practice. As the NTLs are highly dependent on the
sociological factors, geographical factors and laws and regulations of the country and utility,
there is no universal solution or procedure. Most of the methods utilized currently are specific to
the utility. A utility needs to perform some research within itself before planning on
implementing any of the NTL reduction tools and techniques. The reduction of non-technical
losses requires iteration, innovation and persistence.
Page 25
25
Chapter III: Methodology
The main objective of this study was to explore the electrical power losses in the utility
power system due to the NTLs such as electricity theft, uncollectible accounts, the metering and
billing errors. The cost of NTLs adds up on the utility account and it passes along to the
customer’s bill. If the NTLs are out of control, they tend to be the main factor to decrease the
quality and reliability of the power supply. The research was focused on identifying different
types of losses, and understanding the challenges and difficulties presently faced due to the
NTLs. The research briefly covered a general electric power system but was focused on an
electrical utility in the country of Nepal. By exploring and analyzing the electrical power losses
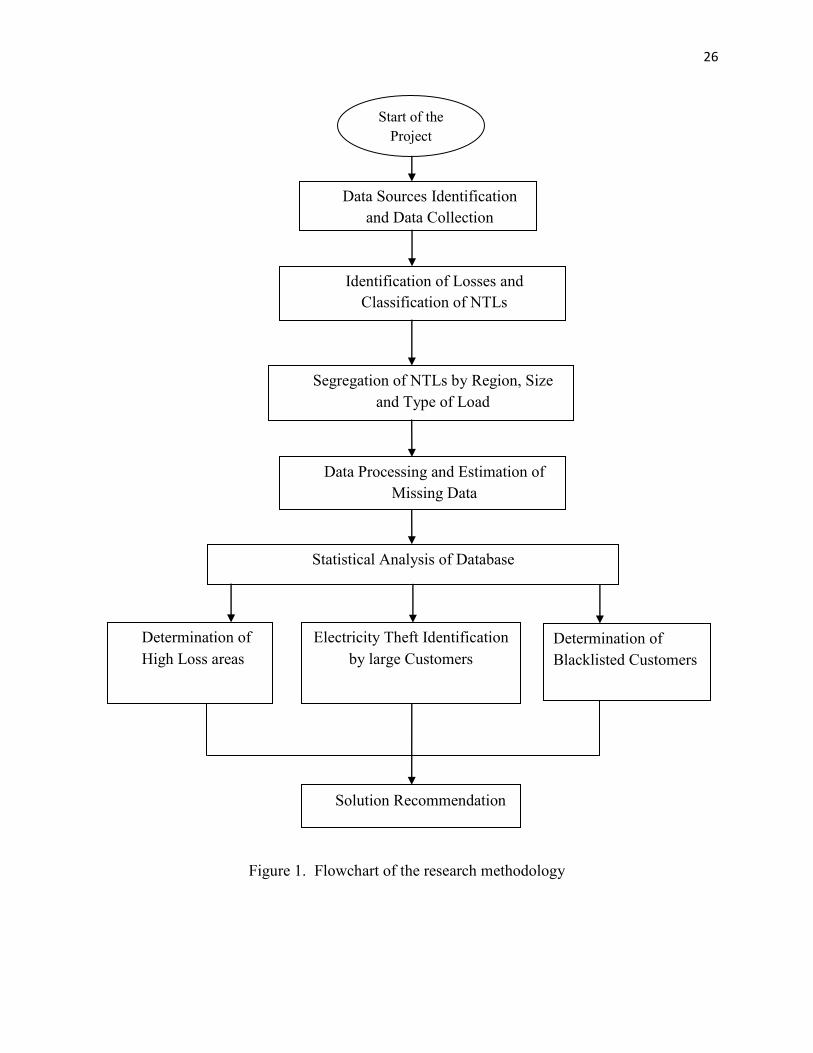
in Nepal, the possible ways of minimizing NTLs were identified. The flowchart of activities
performed in this research is presented in figure 1.
Page 26
26
Figure 1. Flowchart of the research methodology
Start of the Project
Data Sources Identification and Data Collection
Identification of Losses and Classification of NTLs
Segregation of NTLs by Region, Size and Type of Load
Data Processing and Estimation of Missing Data
Statistical Analysis of Database
Determination of High Loss areas
Electricity Theft Identification by large Customers
Solution Recommendation
Determination of Blacklisted Customers
Page 27
27
Data Sources Identification and Data Collection
The principal data required for this research was the amount and type of losses in the
existing NEA power system. The data collection was focused on collecting and identifying the
total loss, and separating the non-technical part from the total loss. Data and information for the
research were collected from literatures, reports and studies published in the past by NEA. NEA
has an IT department, which maintains a website (www.nea.org.np) with the annual reports, site
visit reports and other literatures. The available information on the NEA website was reviewed
and any applicable information and data were extracted. NEA related literatures published by
Asian Development Bank (ADB), NEA Consultants and other organizations were also reviewed.
Additional data, that were not available on the websites, were collected through emails
and phone calls with employees of NEA IT department. They were also requested to share their
experiences and opinions about the nature of NTLs, problems caused by them and methods being
applied to minimize them. The questionnaires and checklists designed to incorporate the data
related to technical and financial issues are attached in the Appendix B of the report. The
questionnaires includes information about electricity losses, financial losses to NEA due to such
losses, electricity acts, metering methods, amount of technical losses and NTLs, etc. The
questionnaires were not survey type and were not intended to be sent to customers. They were
designed as a checklist for collecting data and helping NEA IT department and employees to
provide any information that they may have. With the help of the questionnaires, some
employees provided data that they had and some directed to the websites, where relevant data
and information were available. Some data required interpretation and English translation.
Page 28
28
Data Identification
After the collection of data, different types of power losses in NEA power system were
identified. The non-technical portions of the losses, such as electricity theft, uncollectable
accounts, metering and billing errors, etc were classified and quantified. Non-technical losses,
by nature, are different for different part of the country, nature of the consumer loads and
economic conditions of consumers. To understand the variety within the NTLs, the available
data were segregated by:
Regions (eastern, central and western part of Nepal)
Size and type of load (Industrial, Business and Residential load)
Rural vs. Urban areas
Data Processing
After the extraction of useful and relevant information, the raw data were transformed
into a required format. Some of the data collected were documented in the form of Kilo-watt
hour (KWH), the unit of electrical energy. Such data were converted into the percentage of total
electricity generated. Some data of NTLs, for example uncollectable bills, were available in
terms of money being lost. Appropriate correlation of money and energy rate was made to
obtain the corresponding number of percentage of total electricity generation. An average annual
rate of Nepalese rupees (NRS) per KWH was used to convert money to energy and the
appropriate exchange rate of NRS with USD was used whenever a comparison with US dollar
was required. The collected as well as the processed data were reviewed for any possible errors.
As some of the data were missing, some estimation was performed. Interpolation, extrapolation
and other applicable estimation techniques were used to estimate the missing data. Future data
were forecasted on the basis of available present and past data.
Page 29
29
Determination of High Loss Areas
The data was collected from almost all the feeders of Nepal and the data was used to
obtain more realistic estimates of total loss in different feeders of Nepal. The NTLs were than
segregated from the total losses. The information from NEA website and repost of the
consultants indicated that an average of 12.5% of total losses can be considered as the technical
losses. By subtracting the average technical losses from the total losses, the average non-
technical losses were obtained. The collected information was used to determine a Pareto
Priority Index (PPI). PPI states that if we can reduce the loss in top 20 percent of the customers,
we can reduce almost 80 percent of the total loss. Thus the priority index was used to prioritize
the sectors that needed the immediate actions.
Determination of Types of Electricity Theft by Large Customers
Market segmentation strategy was required to reduce the losses in some part of the NEA
network. Pareto effect indicates that large consumers usually account for a large fraction of the
losses. Only a few customers account for excessively high fraction of the total loss. The
industries and big hotels consume more electricity than residential customers. They are
generally connected with three phase system. Their monthly electric bill is generally high and
they can save big amount of money by metering connection alteration. Meter related theft is not
common among poor residential areas because it is technically sophisticated and requires
knowledge of power flow and electrical wiring. As the local people don’t know which part of
the circuit is insulated and which part is dangerous, they are normally afraid of risk. But the
industries and big hotels normally have engineers or technicians or can hire technical manpower
with some electrical wiring knowledge to alter the meter reading to save money. Therefore a
Page 30
30
team of technical manpower needed to be formed to understand all possible metering alteration
cases.
Determination of Customers with High Unpaid Bills
The data of unpaid bills in NEA power system by government organizations, different
businesses, industries, residences and others were obtained from NEA IT department and NEA
websites. The questionnaires and checklists designed to incorporate the data related to technical
and financial issues are attached in the Appendix B of the report. The collected information was
used to determine a PPI and thus prioritize the sectors to begin the application of the solution.
Solution Development and Recommendation
The data was analyzed to determine which type of NTLs has the highest impact in a
particular case. Different bundled solution models were developed for different combination of
non-technical losses. Some solutions were suggested for the imaginary or possible future input
to the solution models.
Page 31
31
Chapter IV: Results
During the research, all the collected data and information were analyzed to identify
Nepalese Electricity Market and understand the system within the Nepal electricity system.
Although Nepal is a small country and NEA service area is not very large, there are varieties
within it. The hydro power plants are located in hilly areas; most of the populated cities and
industries are located in the plain areas; there are poor residential customers in rural areas; the
billing and collection system is different for governmental and nongovernmental costumers;
industries and big hotels are considered as the large costumers compared to residential areas.
Therefore the collected data were segregated differently for different type of non technical losses
and mainly three main procedures and solutions were suggested.
Data Analysis
The electricity loss data, collected from almost all feeders of Nepal, was obtained from
NEA IT department. The different feeders with their average NTL percentage were arranged
from high to low and shown in the figure 2 below.
Figure 2. Priority index with the average losses in different feeders of Nepal
0.00%
10.00%
20.00%
30.00%
40.00%
50.00%
60.00%
70.00%
80.00%
0 5 10 15 20 25 30 35 40 45
Aver
age
Non
-Tec
hn
ical
Loss
es
Number of Feeders
Red (>= 60%) Orange (<60% & >40%) Yellow (<=40%)
Page 32
32
As shown in the figure 2, the data were segmented as: above 60% NTLs as Red or
highest theft prone zone, from 40% to 60% as Orange or medium theft prone zone and less than
40% as Yellow or low theft prone zone. Any system with greater than 16-20% losses are
considered to be overwhelmed by electricity theft (Smith, 2004). The above data acknowledged
the fact that the major portion of the losses were due to theft and pilferage. Losses in different
feeders of different districts of Nepal are shown in the Appendix A of the report. Above 60
percent NTLs were found mainly in six districts of Nepal, including Bara, Rautahat, Mahottari,
Saptari, Sarlahi and Bhaktapur. Besides, the area of concern were feeders of Siraha,
Sindhupalchowk, Dadeldhura, Dhanusha, Bardiya, and Chitwan district, were the NTLs were
found to be between 40 to 60 percent. The name of the districts, feeders and name of the places
in the data obtained from the NEA power system indicated the fact that the problem of theft and
pilferage were more serious in rural areas of Nepal.
The industries and big hotels generally have three phase supply and consume large
amount of electricity compared to residential customers. They have variety of ways of altering
the meter connection compared to the residential customer who can only steal electricity by
hooking the distribution line. The cases recorded on inspections of hotels and industries on 2068
BS are shown in Appendix A. There were cases of one CT disconnection on 3-phase systems (3
cases), CT reverse connection (37 cases), wrong CT ratio on multi ratio CTs (2 cases), PT
disconnection (10 cases), wrong and missing multipliers (17 cases). There were cases where the
customer bypassed the CT (1 case), used wrong CT core (1 case), wrong meters (4 cases) or
meters without seal (8 cases).
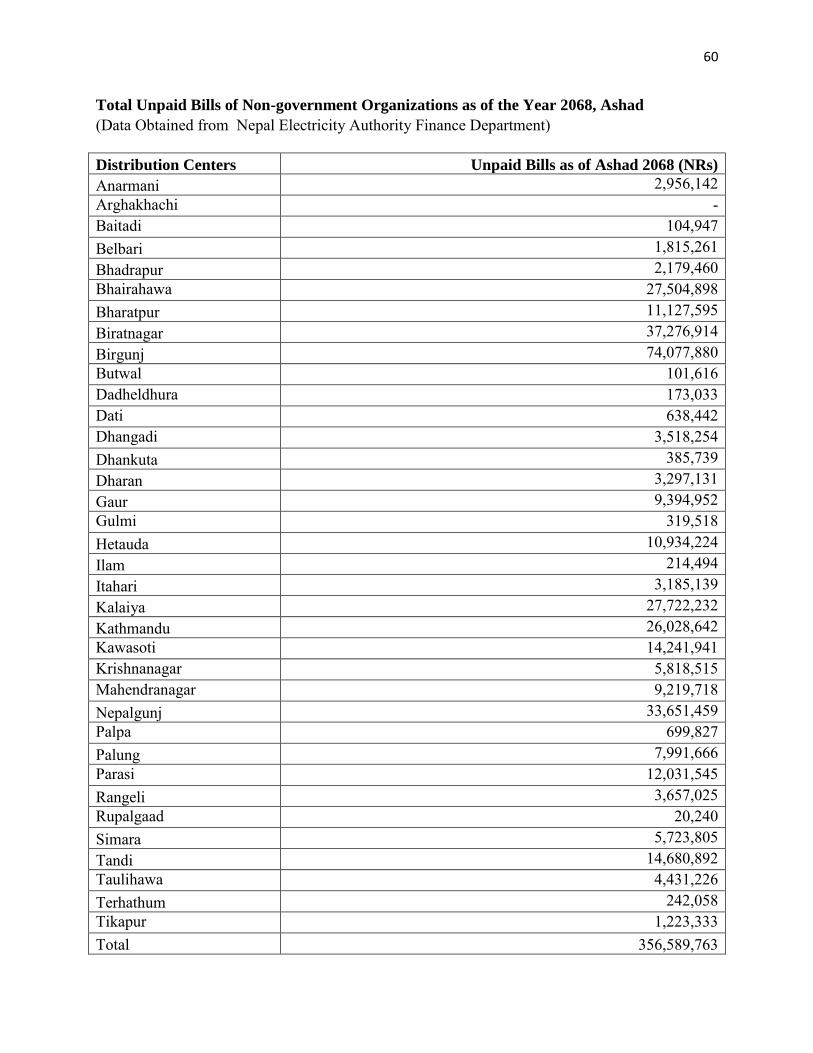
The collection of all unpaid bills as of Ashad, 2068 (2068-06-02)and analysis of the
collected data and information showed the total of 329,696,000 NRs to be collected from
Page 33
33
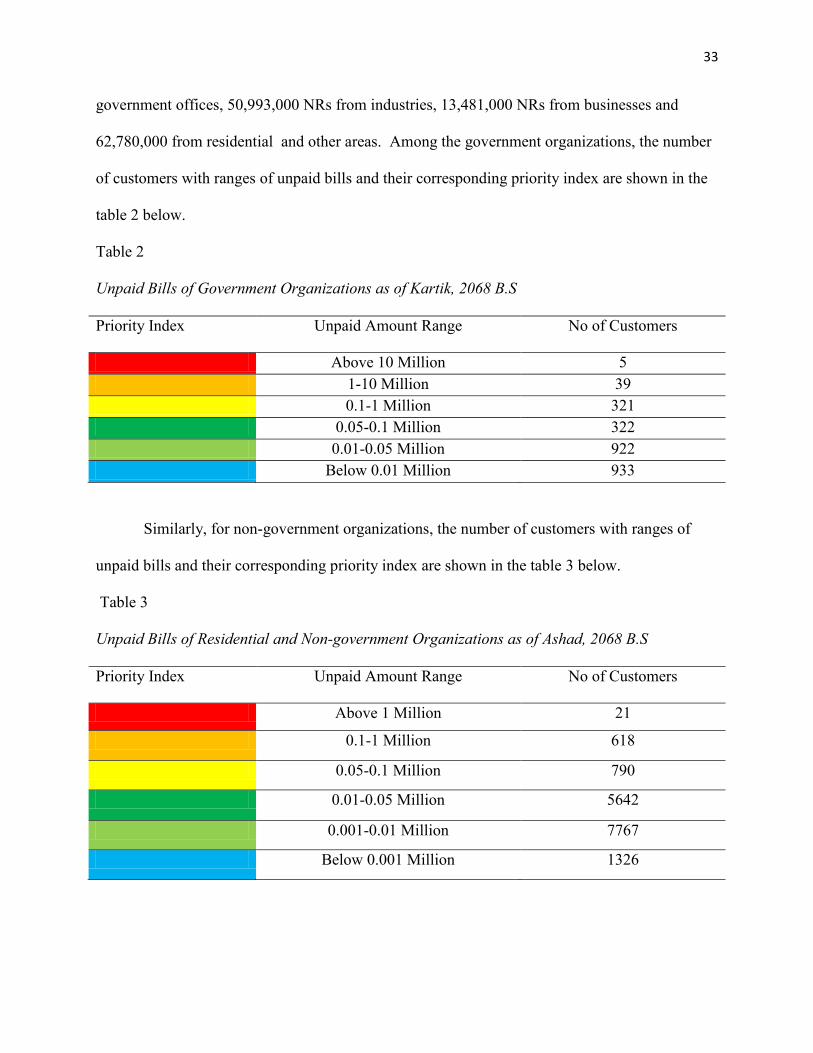
government offices, 50,993,000 NRs from industries, 13,481,000 NRs from businesses and
62,780,000 from residential and other areas. Among the government organizations, the number
of customers with ranges of unpaid bills and their corresponding priority index are shown in the
table 2 below.
Table 2
Unpaid Bills of Government Organizations as of Kartik, 2068 B.S
Priority Index Unpaid Amount Range No of Customers
Above 10 Million 5 1-10 Million 39 0.1-1 Million 321 0.05-0.1 Million 322 0.01-0.05 Million 922 Below 0.01 Million 933
Similarly, for non-government organizations, the number of customers with ranges of
unpaid bills and their corresponding priority index are shown in the table 3 below.
Table 3
Unpaid Bills of Residential and Non-government Organizations as of Ashad, 2068 B.S
Priority Index Unpaid Amount Range No of Customers
Above 1 Million 21
0.1-1 Million 618
0.05-0.1 Million 790
0.01-0.05 Million 5642
0.001-0.01 Million 7767
Below 0.001 Million 1326
Page 34
34
Solution Recommendation
The analysis of the results showed that Electricity theft was the most common non-
technical losses in Nepal. Illegal hooking of electricity from the main distribution line was
dominant in the rural part of the country. The industries and hotels were stealing electricity theft
with alteration on the meter connections. Therefore, the two different solutions were suggested
for the above two types of theft. The proposed solutions will be more effective as NEA has more
power to implement rules.
NEA directly sells electricity to customers on majority of the power system areas. There
were billing inefficiencies and considerable numbers of government offices, private businesses
and residences were not paying their electricity bill. For such cases, an innovative strategy was
proposed for collecting dues and encouraging or forcing the customers to pay their bill in the
future.
Solution 1: Community Based Approach
The solution for the electricity theft in rural areas is to design and implement the most
suitable and effective community based programs. The strategy and the procedure are explained
in figure 3.
Page 35
35
StartStart
Formation of TaskforceFormation of Taskforce
Community Awareness and Advertisement
Community Awareness and Advertisement
Loss Decreased by 10%Loss Decreased by 10%
Carrot and Stick StrategyCarrot and Stick Strategy
Loss Decreased by 10%Loss Decreased by 10%
Additional Community ApproachAdditional Community Approach
Analysis of Community by Research Taskforce
Analysis of Community by Research Taskforce
Is Formation of Load Group Possible?
Is Formation of Load Group Possible?
Application of Communal MeteringApplication of Communal Metering
Yes
No
No
No
Yes
Yes
Figure 3. The community based solution flowchart
Page 36
36
In the initial phase, the community program will be focused in the red zone areas i.e. the
highest theft prone districts. If the strategy is successful, the same approach will be applied in
the orange and yellow zones respectively. The first step of the program will be to form a
taskforce. The taskforce will include NEA technical and non-technical group with most reliable
employees in terms of honesty and technical abilities, government employees, police force,
advocate officer, village representative and a support from political leaders in that area. This
will set a direct and open contact of communities with their leaders and authorities who are
involved in improving power systems. Then the communication programs will be launched
through advertisement, posters, videos and public outreach programs through visits and
meetings. With the help of the communication programs, people will be informed about the new
rules, penalties for electricity theft and effect of the theft on their costs and tariffs.
If creating awareness of electricity theft among community reduced the NTLs, the same
approach will be continued to further reduce the losses. Otherwise, the team will proceed to
implement “Carrot and Stick” strategy. In this strategy, the community will be encouraged to
report theft that they are aware of. People who report such thefts will be offered financial
rewards and strong penalties will be charged to those who are involved in the theft. If this
strategy helps to bring a better result, this approach will be continued. Otherwise, some
additional community approach will be implemented.
On this stage of the program, some community research and analysis will be performed.
The analysis of the economic condition, religion, literacy level, ethnicity and the unity among the
community will help to find out how the people will react under different circumstances and how
they can be handled under such situations. If it is possible to form a load group of customers,
communal metering system will be implemented. In this approach, if an individual steals
Page 37
37
electricity, the remaining customers of the community will have to share the cost of energy
stolen. The infrastructure will require the installation of the master meters at the nodes or
entrance of the feeders in addition to the meters at individual households. The customers will be
allocated to share the difference between the reading of the master meter and the addition of all
residential meters. This amount will be added to their individual reading and they will be able to
know if any theft has occurred in the community and how much they are paying for it. This will
create a direct pressure on customers to stop any kind of electricity theft.
Solution 2: Automatic Metering Infrastructure (AMI)
Advancement in metering technology has been proposed for the big loads like industries
and hotels. Although the inspection of meter can be an effective way in one-phase systems, it is
almost impossible to detect all the cases on three phase system by inspection only. The
intelligent meter is the most effective method to reduce such fraud. Before presenting the
procedure for making the metering system smart, a brief introduction of meter is provided below
to understand different types of possible thefts.
Electric meters record the amount of energy consumed by the loads (household,
commercial and industrial sectors) and provide the means of calculating the bill for the amount
of electricity used. A typical Kilowatt-hour (KWh) consists of two separate coils for measuring
current and voltage. These coil provide information for calculating power (Power= Voltage *
Current). An electromechanical KWh meter has a motor whose revolution is proportional to the
power passing through it. The mechanical counting system counts the revolutions of the disk
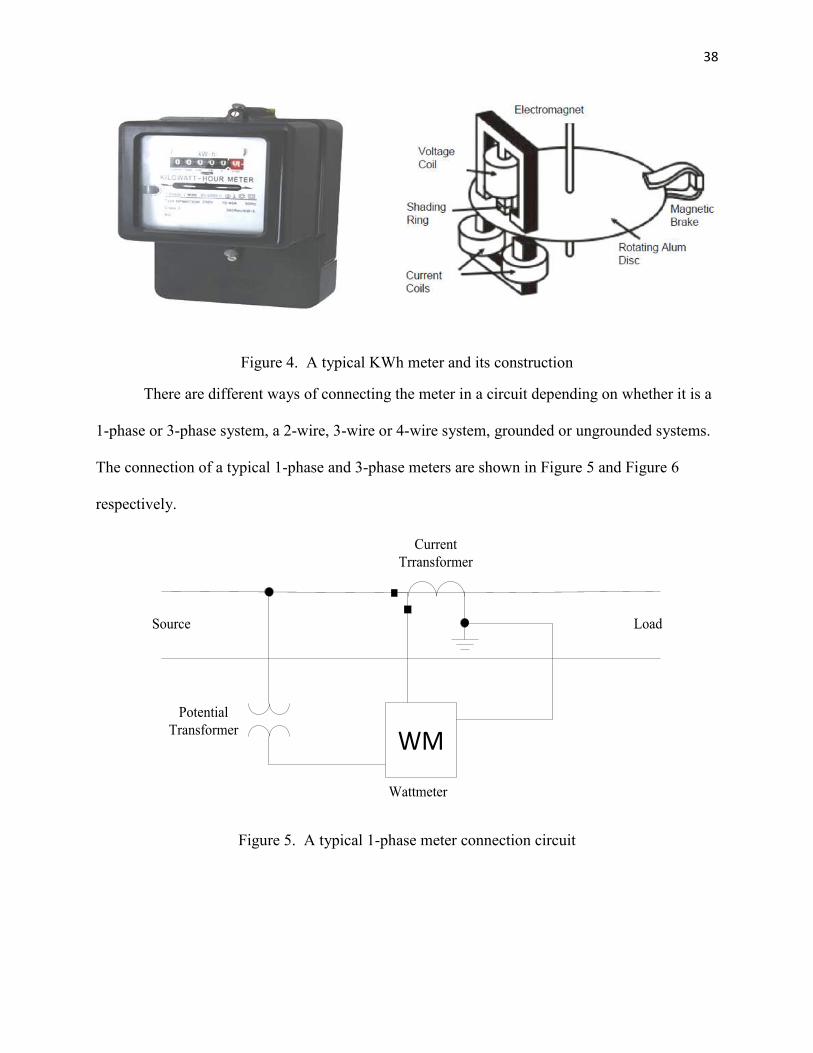
connected to the motor shaft and displays the energy used. The figure 4 shows the outline and
construction of a conventional electromechanical meter.
Page 38
38
Figure 4. A typical KWh meter and its construction
There are different ways of connecting the meter in a circuit depending on whether it is a
1-phase or 3-phase system, a 2-wire, 3-wire or 4-wire system, grounded or ungrounded systems.
The connection of a typical 1-phase and 3-phase meters are shown in Figure 5 and Figure 6
respectively.
Source
Wattmeter
Load
Current Trransformer
Potential Transformer
WM
Figure 5. A typical 1-phase meter connection circuit
Page 39
39
Source Load
Current Transformer
Potential Transformer WM
Wattmeter
A Ph
B Ph
C Ph
N
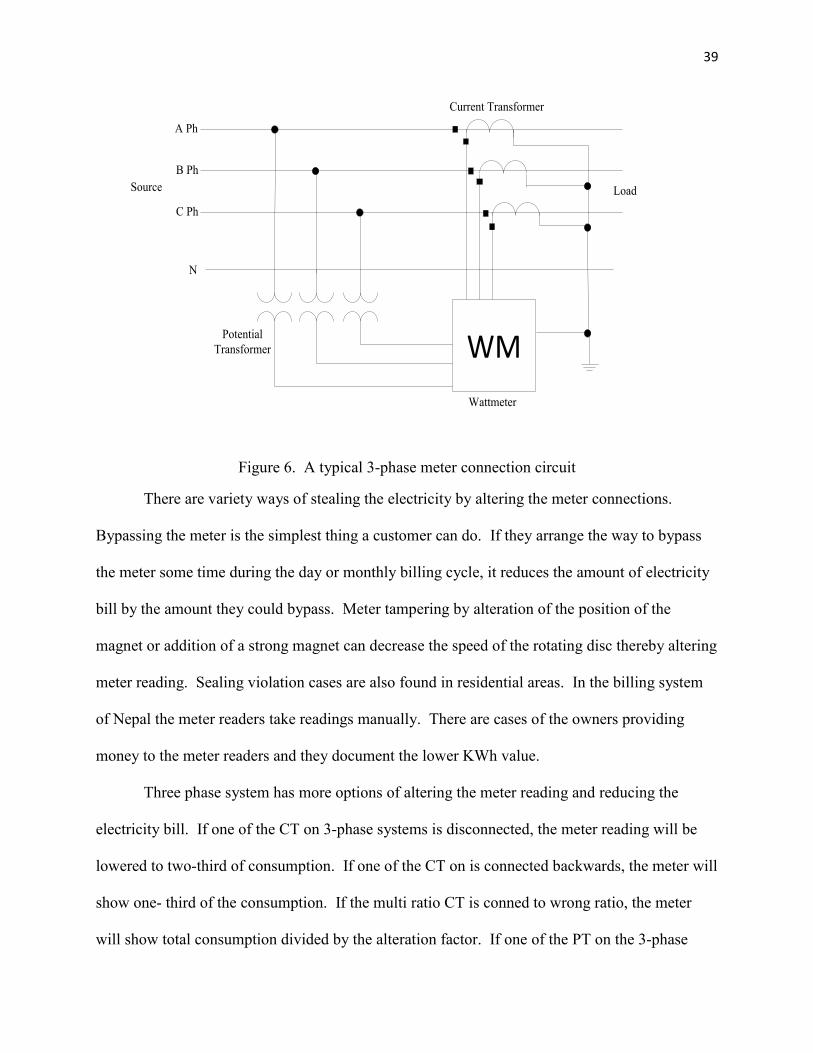
Figure 6. A typical 3-phase meter connection circuit
There are variety ways of stealing the electricity by altering the meter connections.
Bypassing the meter is the simplest thing a customer can do. If they arrange the way to bypass
the meter some time during the day or monthly billing cycle, it reduces the amount of electricity
bill by the amount they could bypass. Meter tampering by alteration of the position of the
magnet or addition of a strong magnet can decrease the speed of the rotating disc thereby altering
meter reading. Sealing violation cases are also found in residential areas. In the billing system
of Nepal the meter readers take readings manually. There are cases of the owners providing
money to the meter readers and they document the lower KWh value.
Three phase system has more options of altering the meter reading and reducing the
electricity bill. If one of the CT on 3-phase systems is disconnected, the meter reading will be
lowered to two-third of consumption. If one of the CT on is connected backwards, the meter will
show one- third of the consumption. If the multi ratio CT is conned to wrong ratio, the meter
will show total consumption divided by the alteration factor. If one of the PT on the 3-phase
Page 40
40
systems is disconnected, the meter will show two-third of the consumption. If the multiplier of
the meter reading is missing, the meter will show total consumption divided by the multiplier.
In such a complicated system with varieties of ways of altering the connection, the
intelligent meters will be the most effective method to reduce fraud. Addition of communication
system and utility control center will make the systems more intelligent and automatic. Such a
system is called Automatic Metering Infrastructure (AMI). Although there are varieties within
AMI system they consist of following major components.
Smart Meters. Smart meters are solid state programmable devices with more intelligence
than the conventional electromagnetic meters.
Integrated Communications. The communications systems support continuous interaction
between the utility, the consumer and utility control center. It can either be telephone lines,
Power Line Carrier (PLC), optical fiber or wireless waves.
Utility Control Infrastructure. A control center is required to monitor the consumption
pattern and the theft. It includes receivers, modems, controllers and computers.
AMI will provide the utility and consumers the information they need to make intelligent
decisions. In addition to tamper and energy theft detection, AMI can perform time-based pricing,
remote switching operations, load limiting, energy prepayment, and power quality monitoring.
The large amount of loss due to fraud and additional advantages of AMI justify the cost of the
infrastructure. The drastic reductions in prices of metering and communication equipment in
Nepal are making their implementation economically feasible. The load is classified within the
hotels and industries and the application is suggested to start with large consumers and gradually
to medium and small ones. An overview of AMI, that is applicable in the contest of Nepal, is
shown in Figure 7.
Page 41
41
AnalogTransducer
AnalogTransducer
CounterCounter
A/D Converter
A/D Converter
MicrocontrollerMicrocontroller
TransceiverTransceiverTT
RR
Customer LAN
Customer LAN
Load Controller
LoadController
TransceiverTransceiverTT RR
Microcontroller
Microcontroller
Data Processor
Data Processor
Metering & BillingMetering & Billing
Computer ApplicationComputer
Application
DatabaseDatabase
AntiTempering
AntiTempering
Load Profile MonitoringLoad Profile Monitoring
Transient AnalysisTransient Analysis
Outage DetectionOutage Detection
Estimation ModelingEstimation Modeling
Artificial IntelligenceArtificial Intelligence
Load Forecast, Demand Reduction, Load Shedding
Customer Service Layer
Utility Control Room
Communication Layer
Metering Layer
Theft Control Layer
Communication Media
Smart Meter
Figure 7. Proposed overview of AMI for NEA system
Page 42
42
The smart meters can be installed at customer’s location or some additional functionality
can be added on existing meters to make them more intelligent to. Most of the meters installed
at customer’s location in the NEA power system are analog. Instead of installing new digital
meters, a miniature module can be developed to take reading from the existing analog meter and
convert the data into digital form. An optical system that is applicable on this configuration is
proposed as shown in Figure 8.
DigitalSignal
Transmitted Light
Reflected LightOptical SensorAnalog Meter
Rotating Disk
Reflector
Figure 8. Mechanical to optical signal conversion
NEA has recently installed about 4000 time-of-day (TOD) meters in loads from 25 KVA
to 7500 KVA in 56 distribution centers of 8 cities to reduce the peak load demand. They solely
perform time-based pricing. These meters are programmable and they charge customers on the
basis of electricity used by the rate specified at a time frame. Features can be added on these
meters to detect electricity theft instead of installing completely new meters. The meter will
record the flow of energy in each phase, at certain time and changes the data in a format that the
communication media can transmit.
There are two communication options that are applicable and economically feasible in
Nepal. For the system that has High Transformer (HT) meters installed on high side of the
transformer, power line carrier is very good technology. The power line is either Aluminum or
Copper conductor and can also transmit high frequency communication signals along with the
Page 43
43
low frequency power signals. Wave traps need to be installed at both ends of the power lines.
Another feasible option in Nepal is the telephone line leased from Nepal Telecommunication
Corporation (NTC). Most of the industry and hotels have landline and it is not difficult to get
one even if they don’t have it. With the increase in cellular phone technology, the land lines
have become less expensive and easily accessible during the last decade.
The existing NEA control centers can be used for control center of the AMI with some
additional equipment or new control centers can be added where cost justifies. The control
center can be built with the equipments on different functional layer as shown in Figure 7. The
communication layer will be required to transmit and receive the signals from customer’s
location. Microcontrollers and data processors are required for metering and billing system. The
theft control layer includes computers which maintain the database. It also consists of a system
which takes the data from the database and monitors the load profile of customers in a regular
basis. The peak load, the normal load and transient can be analyzed. Any outages and
disconnection of the system other than the regular load shedding schedule as well as scheduled
and forced outages can be compared. Correlation of time and consumption can help to determine
the theft control strategies. Anti tempering measures can be generated with the intelligence of
the system and manpower and they can be transmitted to the customers via the communication
layer. Additional layers can be added as required. Remote switching operations can be added to
save resource transportation cost. Load limiting, demand reduction and load shedding are the
things that can be easily added on the system. Increase in customer service and online payment
system can also be added next.
Page 44
44
Solution 3: Pre-paid Metering System
A different approach is suggested for the customers who have not paid the electricity
bills. The procedure is as shown in Figure 9.
StartStart
Select Customer (from high priority index to low)
Select Customer (from high priority index to low)
Notify Customers (amount, due date, payment options, penalties, interest rate)
Notify Customers (amount, due date, payment options, penalties, interest rate)
Is the Customer Willing to Pay bills?
Is the Customer Willing to Pay bills?
Disconnect Service Disconnect Service
Court ActionCourt Action
Yes
No
Create Database of Blacklisted Customers
Create Database of Blacklisted Customers
Special OffersUpto 6 months: 0% APR & 5% reduction in billsFrom 6 months to 1 year: 5% APR From 1to 2 years: 10% APRAfter 2 years: 20% APR
Special OffersUpto 6 months: 0% APR & 5% reduction in billsFrom 6 months to 1 year: 5% APR From 1to 2 years: 10% APRAfter 2 years: 20% APR
Continue Service
Continue Service
Figure 9. Unpaid bills collection procedure
The government offices, whose unpaid bills are above 10 million NRs, are marked as red,
i.e. highest priority zone. Similarly, the customers with unpaid bills between 1 to 10 million NRs
Page 45
45
are marked as orange, i.e. second priority zone and those between 0.1 to 1 million NRs are
marked as yellow, i.e. third priority zone, and so on. The non government organization have
similar priority index but the amount of money allocated in the priority zone will be different.
The concept of priority index is to determine who need to be targeted first. After choosing the
target customers, the next step will be to notify the customers through a legal notice. In the
notice, the customers will be notified about the amount they owe, the due dates, the payment
options, possible penalties, and the interest rates. In order to encourage the customers to pay
their bills, some special offers will be given for a limited time. For example, If the customers are
willing to pay all of their bills within six months, they will be offered 0% Annual Percentage
Rate (APR) as well as 5% cash back bonus. After six months, the APR will increase to 5% and
after one year, it will be 10% until the end of the second year. If the customer pays 50% of the
total amount due the APR continues to be 10%, otherwise it will increase to 20%. Such strategy
will encourage the customers to pay their bills sooner if they can. But if any of the customers are
not willing to pay their bills, their service will be disconnected. They will be listed as blacklisted
costumer and required court actions will be taken against them.
In the future, if any of the blacklisted costumers want their electricity connection back,
they will have to pay all of their bills first, and then go through the NEA reconnection process.
Once, the customers are blacklisted their only choice will be to have a pre-paid metering system.
The costumers will have to pay for the infrastructure of the pre-paid metering system. The pre
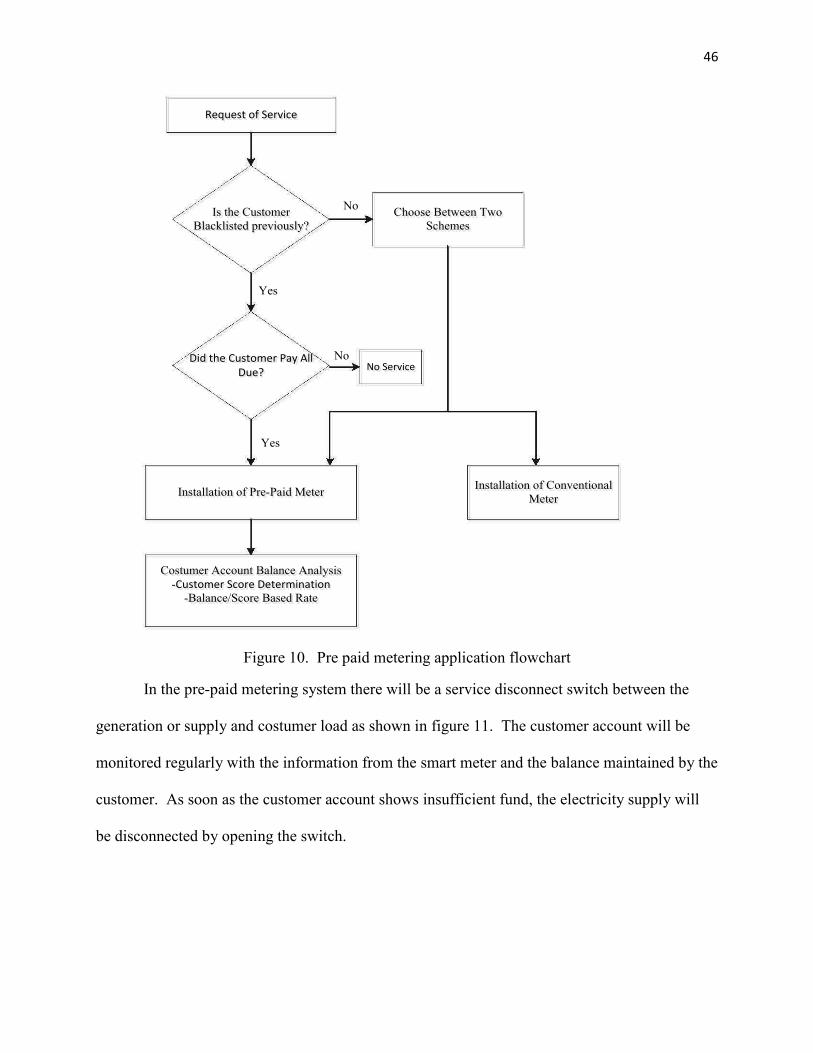
paid metering system application is shown in figure 10.
Page 46
46
Is the Customer Blacklisted previously?
Is the Customer Blacklisted previously?
Installation of Pre-Paid MeterInstallation of Pre-Paid Meter
Did the Customer Pay All Due?
Did the Customer Pay All Due?
Choose Between Two Schemes
Choose Between Two Schemes
Costumer Account Balance Analysis-Customer Score Determination
-Balance/Score Based Rate
Costumer Account Balance Analysis-Customer Score Determination
-Balance/Score Based Rate
No
Yes
Request of ServiceRequest of Service
Installation of Conventional Meter
Installation of Conventional Meter
Yes
No ServiceNo ServiceNo
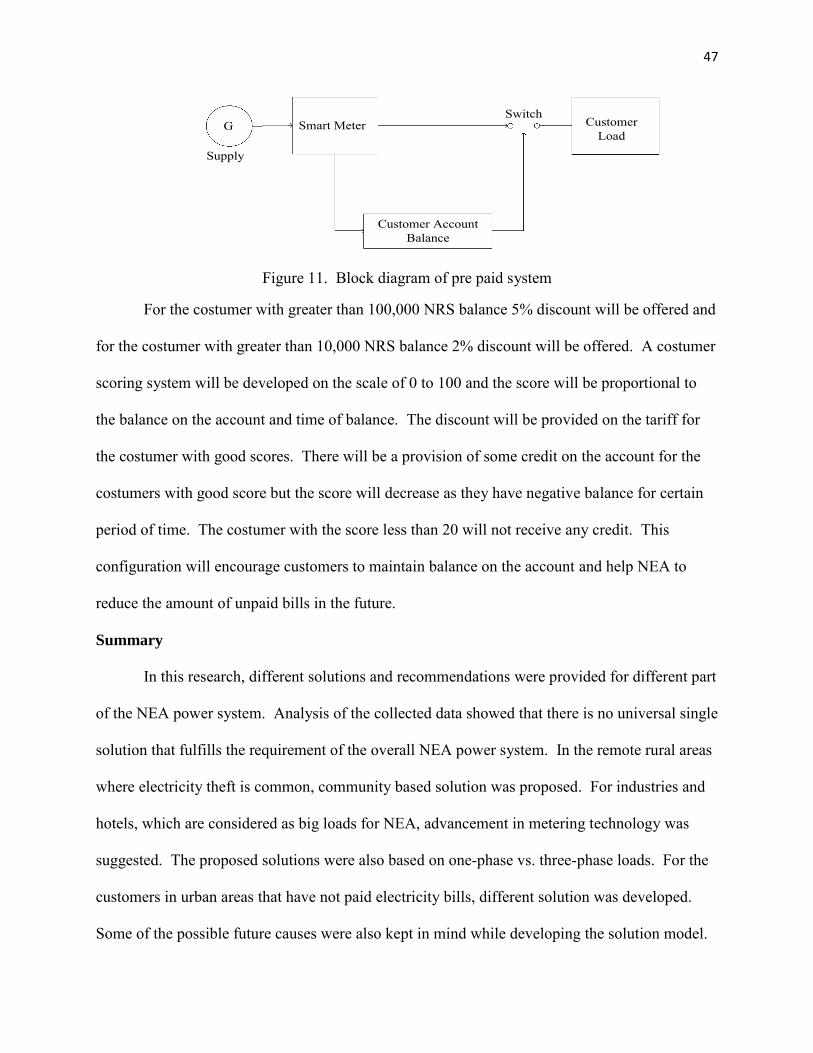
Figure 10. Pre paid metering application flowchart
In the pre-paid metering system there will be a service disconnect switch between the
generation or supply and costumer load as shown in figure 11. The customer account will be
monitored regularly with the information from the smart meter and the balance maintained by the
customer. As soon as the customer account shows insufficient fund, the electricity supply will
be disconnected by opening the switch.
Page 47
47
Customer Account Balance
G Smart Meter Customer Load
Switch
Supply
Figure 11. Block diagram of pre paid system
For the costumer with greater than 100,000 NRS balance 5% discount will be offered and
for the costumer with greater than 10,000 NRS balance 2% discount will be offered. A costumer
scoring system will be developed on the scale of 0 to 100 and the score will be proportional to
the balance on the account and time of balance. The discount will be provided on the tariff for
the costumer with good scores. There will be a provision of some credit on the account for the
costumers with good score but the score will decrease as they have negative balance for certain
period of time. The costumer with the score less than 20 will not receive any credit. This
configuration will encourage customers to maintain balance on the account and help NEA to
reduce the amount of unpaid bills in the future.
Summary
In this research, different solutions and recommendations were provided for different part
of the NEA power system. Analysis of the collected data showed that there is no universal single
solution that fulfills the requirement of the overall NEA power system. In the remote rural areas
where electricity theft is common, community based solution was proposed. For industries and
hotels, which are considered as big loads for NEA, advancement in metering technology was
suggested. The proposed solutions were also based on one-phase vs. three-phase loads. For the
customers in urban areas that have not paid electricity bills, different solution was developed.
Some of the possible future causes were also kept in mind while developing the solution model.
Page 48
48
Chapter V: Discussion
No utility system can be loss free. Like water and gas utilities, the electrical utility
system also has loss while transmitting electricity from generation to the customers. The
electrical utility loss has two main components, technical and non technical losses. Technical
losses are inherent to the power system equipments but the non technical losses are external to
the system. The non technical losses are more common in poor and developing countries. The
non technical power loss is one of the major causes of ongoing power shortage in the country of
Nepal. Electricity theft is the most common non-technical loss. Illegal hooking of electricity
from the main distribution line is another major issue in the rural part of the country. The
industries and hotels are also involved on the electricity theft with alteration on the meter
connections. There are billing inefficiencies within NEA power system and considerable amount
of government offices, private businesses and residences have not paid the electricity bill. The
equipment breakdown due to age, maintenance issues, and lightning is not the significant part of
the non technical loss as NEA has its maintenance policies. Billing inaccuracies were also not
considered having significant part on the total loss. As NEA produces and sells most of the
electricity to its customers, minor interchange inaccuracies with a few private power producers
are negligible. As Nepal is geographically small and has only one time zone, effect of timing
differences has not been considered. Based on the amount and nature of loss, three different
strategies are required to reduce the losses with the power system in Nepal.
Conclusion
The analysis of data obtained from the NEA power system indicates the fact that the
problem of theft and pilferage are more serious in rural areas of Nepal. In six districts of Nepal,
including Bara, Rautahat, Mahottari, Saptari, Sarlahi and Bhaktapur, non technical losses were
Page 49
49
more than 60 percent. Additional areas of concerns are feeders of Siraha, Sindhupalchowk,
Dadeldhura, Dhanusha, Bardiya, and Chitwan district, where the NTLs are found to be between
40 to 60 percent. A community based program should be implemented on these areas starting
with the highest loss areas determined by the priority index. It starts with the community
awareness and implementation of the carrot and stick strategy. If loss does not reduce to certain
level within certain period of time, further community approach is suggested. The economic
condition, religion, literacy, ethnicity of the community will be analyzed and the likelihood of
forming a load group of customers will be analyzed to implement communal metering. It creates
direct pressure on each costumer because they have to pay if somebody else in their community
is stealing electricity. They will be willing to report whoever is hooking the distribution line or
solve the problem internally. NEA will charge for the energy shown in the communal meter
established at the entrance of the feeder and does not need to worry about the individual
households.
Meter related theft is not common among poor residential areas. As the normal people
are not familiar with the sophisticated technology within the meter, they are not able to alter the
wiring and power flow. They are normally afraid of hazardous electrical shocks. But bigger
loads like industries and hotels might have technical manpower or can hire them to alter the
meter connections. As the industries and hotels can save big amount of money by reducing their
electricity bill, the loss that NEA suffers from these activities are higher. Therefore some more
investment on advancement of metering infrastructure is economically justifiable. The
intelligent meters are the most effective method to reduce the fraud. Addition of infrastructure
for data acquisition and monitoring of electricity consumption and the communication system
Page 50
50
will make the solution smarter. The drastic reductions in prices of metering and
telecommunication equipment are making their adoption economically feasible.
In addition to the above two cases of theft, there are customers who do not like to pay
their electricity bill. There are numerous government offices that have not paid their dues to
NEA. There are no strict rules, regulation and timeframe to collect the electricity bill from the
government offices. Political instability and frauds are encouraging these activities. On the
other hand there are innumerable private organizations, industries and residential customers that
cannot or do not like to pay for the electricity that they have consumed. A procedure need to be
developed to collect the amount, take action against them, disconnect the supply and install
prepaid metering system if they want to reconnect.
Future Works
The research paper can be presented to NEA and the implementation of solution
techniques for reduction of non-technical losses can be proposed. The arrangement of on-site
primary data collection and verification is a possible future work if the funding is available. This
helps to get accurate data, increases the value of the database and effectiveness of future
estimation. The feasibility of the solutions will be tested and analyzed and the solutions will be
applied as required. The performance of these solutions proposed on this research will need to
be tested time to time to improve the effectiveness of strategies.
Page 51
51
References
ABB Inc (2007). Energy efficiency in the power grid. Retrieved from www.abb.us
Ahmed, T., Miah, S., Uddin, R. (2011). Automatic electric meter reading system: a cost-feasible
alternative approach in meter reading for Bangladesh perspective using low-cost digital
wattmeter and WIMAX Technology. International Journal of Eng. Tech. 8(3), 800-807.
Asian Development Bank (ADB) (2004). Technical assistance consultant’s report. International
Resources Group, Power Sector Reforms in Nepal, Washington D.C., USA.
BluTrend (2008). How to identify electricity theft in apartments without hardware or software
investments. White paper, retrieved from www.csasecure.com.
Cabral, J. E., Pinto, J. O. P., Gontijo, V. & Filho, J. R. (2004). Fraud detection in electrical
energy consumers using rough sets. Proceedings of IEEE International Conference
Systems, Man and Cybernetics.
Doorduin, W. A., Mouton H. T., Herman R. & Beukes, H. J. (2004). Feasibility study of
electricity theft detection using mobile remote check meters. Proceedings of the 7th
AFRICON Conference in Africa.
Filho, J. R., Gontijo, E. M., Delaiba, A. C., Mazina, E., Cabral, J. E., & Pinto, J. O. P. (2004).
Fraud identification in electricity company customers using decision trees. Proceedings
of IEEE International Conference Systems, Man and Cybernetics.
Fourie, J. W. & Calmeyer, J. E. (2004). A statistical method to minimize electrical energy losses
in a local electricity distribution network. Proceedings of 7th IEEE AFRICON
Conference, 2, 667-673.
Page 52
52
Gerbec, D., Gasperic, S., Smon, I., & Gubina, F. (2005). Allocation of the load profiles to
consumers using probabilistic neural networks. Proceedings of IEEE Transaction on
Power Systems, 20(2), 548-555.
GIZ Energizing Development (2011). Grid extension in countries of Power Shortages. Retrieved
from www.energypedia.info.
Gjukaj, A., Kabashi, G., Pula, G., Avdiu, N. & Prebreza, B. (2011). Re-design of load shedding
schemes of the kosovo power system. World Academy of Science, Engineering and
Technology, 74(47), 262-266.
Independent Power Producers’ Association Nepal (IPPAN) (2006). Nepal India corporation on
hydropower (NICOH). Final Report, Confederation of Indian Industry.
Jiang, R., Tagaris, H., Lachsz, A. & Jeffrey, M. (2002). Wavelet based feature extraction and
multiple classifiers for electricity fraud detection. Proceedings of IEEE/Power
Engineering Society, Transmission and Distribution Conference Exhibit, 3(4), 2251-
2256.
King, C. (2004). Advanced metering infrastructure overview of systems features and capabilities.
Retrieved from http://sites.energetics.com
Leal, A. G., Jardini, J. A., Magrini, L. C., Ahn, S. U., Schmidt, H. P. & Casolari, R. P. (2006)
Distribution system losses evaluation by ANN approach. IEEE, Proceedings of Power
System Conference and Exposition, 1658-1662.
Leon, C., Biscarri, F., Monedero, I., Guerrero, J. I., Biscarri, J. & Millan, R. (2011). Integrated
expert system applied to the analysis of non-technical losses in power utilities. Expert
Systems with Applications, 38(8), 10274-10285.
Page 53
53
Millard R. & Emmertson M. (2009) Non-technical losses-How do other countries tackle the
problem? Proceedings of 22nd AMEU Technical Convention, retrieved from
www.eepublishers.co.za
Nagi, J., Yap, K. S. & Tiong, S. K. (2010). Non-technical loss detection for metered customers in
power utility using support vector machines. IEEE Transactions on Power Delivery,
25(2), 1162-1170.
Navani, J.P., Sharma, N.K., Sapra, S. (2004). Technical and non-technical losses in power
system and its economic consequence in Indian economy. International Journal of
Electronics and Computer Science Engineering, 1(2), 757-761. Retrieved from
www.ijecse.org.
Nepal, R. & Jamasb, T. (2011). Reforming small power systems under political volatility: The
case of Nepal. University of Cambridge, Electricity Policy Research Group.
NERC Board of Trustees (2008). Glossary of terms used in reliability standards. Retrieved from
www.nerc.com
Nesbit, B. (2000). Thieves lurk - the sizable problem of stolen electricity. Electric World, 214(5),
31-35.
Nizar, A. H., Dong, Z. Y., Jalaluddin, M. & Raffles, M. J. (2006). Load profiling non-technical
loss activities in a power utility. Proceedings of International Power and Energy
Conference, Malaysia.
Nizar, A. H., Dong, Z. Y., Zhao, J. H. & Zhang, P. (2007). A data mining based NTL analysis
method. Proceeding of IEEE Power Engineering Society General Meeting, Tampa, FL.
PA Government Services Inc. (2005). Improving power distribution company operations to
accelerate power sector reform. Handbook for USAID
Page 54
54
Piercy, R. & Cress, S. L. (2007). Recalculation of distribution system energy losses at hydro one.
Kinectrics Inc., Toronto, Canada.
Rao, M. V. K., & Miller, S. H. (1999). Revenue improvement from intelligent metering system.
Proceedings of 9th International Conference Metering and Tariffs for Energy Supply,
United Kingdom.
Smith, T. B. (2004). Electricity theft: a comparative analysis. Energy Policy, 32(18), 2067-2076.
Suriyamongkal, D. (2002). Non-technical Losses in electrical power system. Master’s
Dissertation, College of Engineering and Technology, Ohio University.
Thapaliya, B. (n.d). Dire electricity crisis in Nepal: darkness grows beneath the verest. Retrieved
from www.globalpoliticians.com
Thomas, E. & Johnson, K. (n.d.). Distribution line loss management offers significant savings for
electric cooperatives. White paper, Market Development Group, retrieved from
www.marketdevelop.com.
Walker, I., & White, P. (2009). Preparing electricity connectivity and energy efficiency project I.
Asian Development Bank, Technical Assistance Consultant’s Report.
World Bank Group (2009). Reducing technical and non‐technical losses in the power sector.
Background Paper for the World Bank Group Energy Sector Strategy, retrieved from
http://siteresources.worldbank.org.
Yadoo, A. & Cruickshank, H. (2010). The value of cooperatives in rural electrification. Energy
Policy, 38(6), 2941-2947.
Page 55
55
Appendix A: Collected Data
High Loss Feeders of Nepal
(Data obtained from www.nea.org.np)
District: Morang, Distribution Center: Biratnagar
S.N Substation
Name Feeder Name
Loss %
(2068
Jestha)
Loss %
(2068
Shrawan)
Loss %
(2068
Bhadra)
Loss %
(2068
Aswin)
Loss %
(2068
Kartik)
1 Biratnagar Hatkhola 46.00% 26.88% 34.07% 12.11% 14.23% 2 Tanki Jhorahat 40.00% 32.62% 37.76% 16.57% 15.24% 3 Tanki Duhawi 41.00% 29.80% 32.41% 13.36% 14.07% 4 Tanki Buddhanagar 45.00% 27.51% 42.06% 19.95% 19.94%
District: Sunsari, Distribution Center: Itahari 5 Duhawi Inaruwa 40.00% 34.27% 36.43% 34.88%
6 Inaruwa Jhumka 53.00% 38.90% 36.57% 38.85% 7 Inaruwa Lauki 41.00% 43.74% 41.67% 39.06%
District: Saptari, Distribution Center: Rajbiraj 8 Rajbiraj Bajar Feeder – 1 41.00% 45.82%
9 Rajbiraj Bajar Feeder – 2 44.00% 48.32% 10 Rajbiraj Gramin Feeder - 1 62.00% 72.81% 11 Rajbiraj Gramin Feeder - 2 61.00% 73.76% 12 Rajbiraj Kalyanpur 66.00% 68.08% 13 Rajbiraj South Rural 66.00% 71.31% 14 Rajbiraj Kanchanpur – 1 55.00% 66.81% 15 Rajbiraj Kanchanpur – 2 75.00% 74.03% 16 Rajbiraj Hanuman Nagar 77.00% 74.48%
District: Siraha, Distribution Center: Lahan 17 Lahan Bastipur 58.00% 42.14%
18 Lahan Jahadi 59.00% 75.58% 19 Lahan Mirchaiya 40.00% 53.24%
District: Siraha, Distribution Center: Siraha 20 Siraha Siraha 56.00% 42.88%
District: Dhanusa, Distribution Center: Janakpur 21 Janakpur Ring 55.00% 39.52%
22 Janakpur Pidadi 60.00% 40.82% 23 Janakpur Yadukuwa 68.00% 48.93%
Page 56
56
District: Mahottari, Distribution Center: Jaleshwor 24 Jaleshwor Manara 75.00% 83.41%
25 Jaleshwor Matihani 73.00% 82.69% 26 Jaleshwor Balawa 72.00% 82.96% 27 Jaleshwor Janakpur 72.00% 79.98% 28 Majeliya Pidari 72.00% 29 Dhalkewar Bardiwas 60.00% 30 Aaurohi Aaurohi 77.00% 51.45% 31 Aaurohi Sonamahi 73.00% 39.63% 32 Aaurohi Bhanah 80.00% 51.23%
District: Sarlahi, Distribution Center: Malangawa 33 Malangawa Malangawa 75.00%
34 Malangawa Kodena 68.00% 35 Haripur Gramin 62.00% 36 Haripur Lalbandi 75.00% 37 Haripur Panchgachiya 72.00% 38 Haripur Barahathawa 65.00%
District: Bara, Distribution Center: Kalaiya 39 Kalaya Bariyapur 70.00% 70.24% 70.50% 63.13%
40 Parwanipur Agricultural 70.00% 74.51% 74.59% 73.22% 41 Kalaya Sitalpur 85.00% 83.89% 85.00% 82.34% 42 Kalaya Manarwa 55.00% 65.45% 62.31% 62.45% 43 Kalaya Ganjbhawanipur 77.00% 73.12% 69.59% 69.71% 44 Kalaya Simraungad 76.00% 72.31% 65.13% 63.49%
District: Rautahat, Distribution Center: Gaur 45 Gaur Gaur 75.00%
46 Gaur Bairiya 82.00% 47 Gaur Beharawa 80.00% 48 Gaur Harsa 62.00% 49 Gaur Chandranigahapur 55.00%
50 Chandranigahapur
Chandranigahapur North 60.00%
51 Chandranigahapur
Chandranigahapur South 62.00%
District: Parsa, Distribution Center: Birgunj
Page 57
57
52 Birgunj Pokhariya – 1 48.00% 39.81% 53 Birgunj Pokhariya – 2 52.00% 38.14% 54 Birgunj Pokhariya – 3 63.00% 39.17%
District: Chitwan, Distribution Center: Tadi 55 Tadi Tadi 44.00% 47.17% 38.17% 38.64% 32.20%
56 Tadi Parsa 45.00% 47.34% 41.19% 34.71% 28.77% 57 Tadi Khaireni 52.00% 46.01% 37.37% 31.24% 28.08% 58 Tadi Chainpur 45.00% 50.18% 62.50% 59.44% 52.17%
District: Chitwan, Distribution Center: Bharatpur 59 Chanauli Gitanagar 54.00% 51.02% 45.70% 48.38%
District: Bhaktapur, Distribution Center: Bhaktapur 60 Bhaktapur Brick 65.00% 56.42% 54.89%
61 Bhaktapur Byasi 48.00% 41.95% 38.29% 62 Bhaktapur Nalingchowk 74.00% 78.86% 39.57% 63 Bhaktapur Sanga 85.00% 78.61%
District: Lalitpur, Distribution Center: Lagankhel 64 Patan Patan 41.00% 45.13% 35.64% 34.03%
65 Patan Lubhu 42.00% 46.23% 38.41% 32.10% 66 Minbhawan Godawari 41.53% 38.54% 33.57%
District: Sindhupalchowk, Distribution Center: Sindhu 67 Sunkoshi Pakhar 54.00%
68 Sunkoshi Chautara 56.00% 69 Sunkoshi Barahbise 63.00% 70 Panchkhal Melamchi 60.00% 71 Panchkhal Bhotechaur 65.00%
District: Kapilbastu, Distribution Center: Taulihawa 72 Taulihawa Lumbini 40-50 %
73 Taulihawa Krishna Nagar 40-50 %
District: Nawalparasi, Distribution Center: Parasi 74 Surajpura Surajpura 40-50 %
District: Rupandehi, Distribution Center: Bhairahawa
Page 58
58
75 Bhairahawa Bhairahawa 3, 6 40-50 % 76 Bhairahawa Bhairahawa 5 40-50 % 77 Bharauliya Bharauliya 1 40-50 % 78 Aamuwa Tikuligad 40-50 % 79 Aamuwa Farsatigad > 50 % 80 Aamuwa Suryapura > 50 % 81 Bhairahawa Bhairahawa 4 > 50 % 82 Lumbini Lumbini 1 > 50 % 83 Lumbini Lumbini 3 > 50 % 84 Lumbini Lumbini 4 > 50 %
District: Dadeldhura, Distribution Center: Dadeldhura 85 Dadeldhura Chamada 40.62%
86 Dadeldhura Bajar Feeder 60.21%
87 Boarder Boarder, Gaura, Jogbuda 46.15%
District: Bardiya, Distribution Center: Gulariya 88 Gulariya Maunapokhar 54.00%
89 Gulariya Tarataal 52.00%
Page 59
59
Total Unpaid Bills of Government Organizations, as of the Year 2068, Kartik
(Data obtained from Nepal Electricity Authority Finance Department)
Ministry
Code
Name of Ministry Total Unpaid Bills
(NRs)
101 Ministry of Home Affairs 46,694,702.67 102 Ministry of Forest and Soil Conservation 4,976,636.45 103 Ministry of Local Development 25,606,831.91 104 Ministry of Agriculture and Coorperatives 3,272,827.75 105 Ministry of Law and Justice 110,442.93 106 Ministry of Health and Population 65,070,027.08 107 Ministry of Land, Reform and Management 894,501.38 108 Ministry of Information and Communication 16,242,372.59 109 Ministry of Labor and Transport Management 60,604.66 110 Ministry of Tourism and Civil Aviation 216,082.71 111 Ministry of Defence 32,130,241.38 112 Ministry of Finance 4,540,482.59 113 Ministry of Physical Planning and Works 16,861,252.74 114 Ministry of Education 529,400.14 115 Ministry of Industry 462,477.20 116 Ministry of Science and Technology 1,303,078.93 117 Ministry of Commers and Supplies - 118 Supreme Court 2,861,743.41 119 Ministry of Peace and Reconstruction 35,834,568.64 120 Ministry of Women, Children and Social Welfare 518,276.35 121 Ministry of Irrigation 39,621,728.05 122 Ministry of Youth and Sports 1,218,897.89 123 Ministry of Foreign Affairs - 124 Ministry of General Administration - 125 Ministry of Environment - 126 Ministry of Federal Affairs, Constituent Assembly,
Parliamentary Affairs and Culture 84,686,178.51
Total 383,713,355.93
Page 60
60
Total Unpaid Bills of Non-government Organizations as of the Year 2068, Ashad
(Data Obtained from Nepal Electricity Authority Finance Department)
Distribution Centers Unpaid Bills as of Ashad 2068 (NRs)
Anarmani 2,956,142 Arghakhachi - Baitadi 104,947 Belbari 1,815,261 Bhadrapur 2,179,460 Bhairahawa 27,504,898 Bharatpur 11,127,595 Biratnagar 37,276,914 Birgunj 74,077,880 Butwal 101,616 Dadheldhura 173,033 Dati 638,442 Dhangadi 3,518,254 Dhankuta 385,739 Dharan 3,297,131 Gaur 9,394,952 Gulmi 319,518 Hetauda 10,934,224 Ilam 214,494 Itahari 3,185,139 Kalaiya 27,722,232 Kathmandu 26,028,642 Kawasoti 14,241,941 Krishnanagar 5,818,515 Mahendranagar 9,219,718 Nepalgunj 33,651,459 Palpa 699,827 Palung 7,991,666 Parasi 12,031,545 Rangeli 3,657,025 Rupalgaad 20,240 Simara 5,723,805 Tandi 14,680,892 Taulihawa 4,431,226 Terhathum 242,058 Tikapur 1,223,333 Total 356,589,763
Page 61
61
National Average of Yearly Leakage Data
(From NEA Whitepaper, 2008, http://www.nea.org.np)
Fiscal Year Total Loss %
1985-1986 29
1986-1987 28.4
1987-1988 24.9
1988-1989 25
1989-1990 28
1990-1991 25
1991-1992 23.7
1992-1993 25.2
1993-1994 24.9
1994-1995 25.06
1995-1996 24.61
1996-1997 24.92
1997-1998 23.4
1998-1999 22.9
1999-2000 23.9
2000-2001 23.6
2001-2002 24.56
2002-2003 23.66
2003-2004 23.01
2004-2005 24.83
2005-2006 24.7
2006-2007 22.97
Loss Forecasted by NEA
Fiscal Year Total Loss %
2008-2009 23
2009-2010 22
2010-2011 21
2011-2012 20
2012-2013 19.5
2013-2014 19
2014-2015 18.5
Page 62
62
Inspection results of Industries and Hotels
(Data Obtained form www.nea.org.np) NEA formed a 5-member team of inspectors to inspect different types of leakage. The results of a weeklong inspection from 2068-05-28 to 2068-06-06 at some hotels and industries connected to distribution centers of Dhading, Gorkha, Kawasoti, Bharatpur, Tadi, Simara and Birgunj are as follows. Case Types No of Cases CT reverse connection 4 PT Disconnection 4 1 CT Disconnection (3-phase) 2 Multiplier Missing 7 Wrong CT ratio 1 Excessive Load Connection 0 Sealing Violations 4
The same team of inspectors continued to check hotels and industries connected to distribution centers of Bhairawaha, Butwal, Taulihawa, Krishnanagar, Pokhara, Parwat, Baglung, Magdi and Nuwakot 2068-06-25 to 2068-08-29. The results of the inspection are: Case Types No of Cases CT reverse connection 33 PT Disconnection 6 1 CT Disconnection (3-phase) 1 Multiplier Missing 10 Wrong CT ratio 1 CT Bypass (2-phase) 1 Use of Wrong CT Core 1 Use of Wrong Meters
Use of different meter than licensed for the customer Use of LT meter instead of HT meter Use of Meters Not provided by NEA
1 2 1
Excessive Load Connection 0 Sealing Violations 4
On the basis of above inspection, the team reported estimated loss of 17437160.54 KWh which is equivalent to 83868381.12 NRs.
Page 63
63
Appendix B: Survey Questionnaire
Research Title: Techniques for Reduction of Non-technical Losses in Electrical Power Utilities
The electrical power loss in the utility power system, due to non-technical losses like
electricity theft; metering and billing inefficiencies; administrative inefficiencies; etc, is one of
the major issues to be addressed to reduce the ongoing power shortage in developing countries.
This research will propose different approach, techniques and tools that can help to reduce the
non-technical power losses. It covers a typical electric power utility focusing on a power system
in the country of Nepal.
The following questionnaires are for collecting the information and data related to non
technical losses within Nepal Electricity Authority power system. These questionnaires are not
designed to go out to the customers because the data required for this research cannot be
obtained from customers. Additionally, it is a long and expensive process to manage a field
resource to collect different losses. Most of the data needed on this research will be based on the
information collected by Nepal Electricity Authority and its consultants. These questions are
prepared for requesting data from NEA Information Technology department and some other
NEA employees.
Human subjects are not involved on this research.
1. What types of non-technical losses are common in Nepal?
2. What percentage of total energy is being lost due to non-technical reasons?
3. Is the loss pattern different for different zones of NEA system?
4. How the poor residents steal electricity in rural part of Nepal?
5. What types of losses are more common in urban areas?
6. How the industries and big hotels steal electricity?
7. How the government offices and businesses steal energy?
Page 64
64
8. How much energy or money is being lost due to electricity theft?
9. Are there areas with more than 50% electricity loss?
10. Which areas have less than 10% electricity loss?
11. What kinds of meters (manufacturer and part number) are in practice for 1-phase and 3-
phase system?
12. At what points is the electricity flow measured? At dispatch centers/ substations/ feeders/
each community/ each household/ any other points?
13. Are there cases of NEA technicians and meter readers being involved in altering the
meter readings?
14. Is the nature of theft or loss dependent on type of load? 1-phase vs. 3-phase; small KW
loads vs. bigger KW load; urban vs. rural?
15. What are the current acts and measures being taken to control the non-technical losses?
16. Which areas need to be focused first to reduce the overall loss?
17. How much amount or percentage of energy sold is uncollected?
18. What are the deficiencies of the NEA billing and collection systems?
19. What measures are being taken to collect the unpaid bills?
20. Do you have any other information or data related to the research title?
THANK YOU.
Page 65
65
Ap
pen
dix
C: P
ow
er Syste
m M
ap
of N
epal
(O
btained from N
epal Electricity Authority A
nnual Report 2009)
..........
t-EOEN08
• • • • • • ..
POWER DEVELOPMENT MAP OF NEPAL
"-"D•"~""IollfEPilOPOGEQ
Wit. 'I Tii.NI =-IlGS.OI~ ll'(£
134v 1f«.~~l!l;:t.,,IMI
~llMt~<AYIQN
K'l'i.l~<E.'\ !ITA'OON
~I"((I'I"..ASWt:lti
MAJOR POWER STATIONS TRANSMISSION tiNES & SUBSTATIONS ~tO~'J
CHINA
INDIA
N
CD