+ All Categories
Home > Documents > Challenges Ahead – China’s Automotive Industry at a Crossroads · Challenges Ahead –...

Challenges Ahead – China’s Automotive Industry at a Crossroads · Challenges Ahead –...

Date post: 28-Jul-2018
Category:
Upload: vuongdien
View: 220 times
Download: 0 times
Share this document with a friend
28
16 NOVEMBER 2007 SHANGHAI AUTOMOBILE EXHIBITION CENTRE ANTING GLOBAL AUTOMOTIVE SEMINAR Challenges Ahead – China’s Automotive Industry at a Crossroads John Zeng Senior Market Analyst, Asia
Transcript

16 NOVEMBER 2007 • SHANGHAI AUTOMOBILE EXHIBITION CENTRE • ANTING

GLOBAL AUTOMOTIVE SEMINAR

Challenges Ahead –China’s Automotive Industry at a Crossroads

John ZengSenior Market Analyst, Asia

Copyright © 2007 Global Insight, Inc. 2

• Macroeconomic Outlook

• Challenges Faced by the Industry

• Market Outlook

Presentation Outline

Copyright © 2007 Global Insight, Inc. 3

(Source: China National Statistics Bureau)

53408 59622 6433273762

86911103618

119555

141051

161587

0

20,000

40,000

60,000

80,000

100,000

120,000

140,000

160,000

180,000

1998 1999 2000 2001 2002 2003 2004 2005 20060%

5%

10%

15%

20%

25%

Urban/Rural Household RMB Saving Deposit (100 Mil Yuan)

Per Capita Disposable Income Of Urban Households (Yuan)

5425 5845 62806860

77038472

942210493

11759

0

2,000

4,000

6,000

8,000

10,000

12,000

14,000

1998 1999 2000 2001 2002 2003 2004 2005 20060%

2%

4%

6%

8%

10%

12%

14%

16%

Key Highlights and Assumptions (1)

• Real GDP growth of 10.6% in 2006, the fourth consecutive year that exceeded 10%

• Saving rate is very high… overall saving rate is an amazing 43% of GDP

• Number of households that can afford cars increases significantly with diverse needs…Market and consumer dynamics entering first stage of maturity

0

2

4

6

8

10

12

1999

2001

2003

2005

2007

2009

2011

2013

Real GDP Growth (Percent)

Copyright © 2007 Global Insight, Inc. 4

1402 16582251 2436

2952

4128

5612

9691

7620

5933

4382

32562662

249219491838

6600

7916

0

1000

2000

3000

4000

5000

6000

7000

8000

9000

10000

1998 1999 2000 2001 2002 2003 2004 2005 2006-5%

0%

5%

10%

15%

20%

25%

30%

35%

40%EXPORTIMPORTGROWTH RATE

(Source: China National Statistics Bureau)

28547 29876 32619 3689843500

55567

70477

88774

109870

0

20,000

40,000

60,000

80,000

100,000

120,000

1998 1999 2000 2001 2002 2003 2004 2005 20060%

5%

10%

15%

20%

25%

30%

1998-2006 China Retail Sales (100 Mil RMB)

1998-2006 Fixed Asset Investment (100 Mil RMB)

• Investment and export led boom… more modest growth in consumption

• Foreign trade enjoying strong surplus… 6.5% of GDP in 2006. Exports crucial element of the boom and strong growth in first half of 2007 ahead of removal of export rebates

• Retail sales growth of 15.4% in first half of 2007…highest increase since 1997

1998-2006 China Foreign Trade (100 Mil US$)

29153 3113534153

37595

4813652516

59501

67177

76410

0

10,000

20,000

30,000

40,000

50,000

60,000

70,000

80,000

1998 1999 2000 2001 2002 2003 2004 2005 20060%

2%

4%

6%

8%

10%

12%

14%

16%

Key Highlights and Assumptions (2)

Copyright © 2007 Global Insight, Inc. 5

• Overtook the United Kingdom and France to become the fourth mostsignificant vehicle market in 2002

• Overtook Germany to become the third-largest vehicle market in 2003

• Overtook Japan by a very narrow margin to become the second-largest market in 2005

• Passenger car sales rose five-fold between 2001 and 2006

• Segmentation profile has only changed very gradually

Fastest-growing Market in the World… But Only Gradual Changes in the Segmentation Profile

OTHER0.5%

MPV4.1%

D17.1%

C41.1%

B6.4%

A16.3%

E9.8%

SUV4.7% MPV

4.6%

OTHER0.4%

D13.8%

C42.0%

B10.9%

A13.3%

E8.2%

SUV6.8%

2001 2006

Copyright © 2007 Global Insight, Inc. 6

Almost All the Global OEMs Present in China Domestic OEMs Manage to Hold Their Own

CHN JPN EUR US KOR

Market is becoming more fragmented: Hyundai lost market share while Chery raised its ranking

Pricing war fired up in 2007: Major price cuts from FAW VW, SVW, DF Nissan, SGM, PSA, Chery

Chery won the most market share to 8.2%. A 48% increase in sales, raised ranking to #3

Toyota and Mazda market share gained 0.9pp to 7.5% and 3.9% respectively

By brand, VW remains #1 with 16.2% market share.FIAT sales dropped 21%.

GM still remains #1 as OEM, market share dropped to 9%

Hyundai was the largest market share loser. Market share dropped to 5.1% from 6.8% in 2006.

Copyright © 2007 Global Insight, Inc. 7

Major JVs/OEM Affiliations

Dongfeng Motor

Note: This figure shows only major OEMs, even though there are more than 100 automotive assemblers in China.

Shanghai Automotive(SAIC)Roewe

Foreign Company

LocalCompany

Joint Venture

Tianjin

FAW Group

FHC(Changchun)

(Hainan)

FCCJMC

FAW-VWShanghai-VW Tianjin

ToyotaTianjin-Toyota

Engine

GuangzhouToyota

ChanganFord Mazda

ChanganSuzuki

GZ ToyotaEngine

HondaExport JV

DongfengHonda

DongfengHonda Engine

DongfengMotor

Fengshen

DPCA

ShanghaiGM

SiChuanToyota

GuangzhouHonda

FAW-VWEngine

SH-VWEngine

BJ-HyundaiSH-GMengine BBDC

DongfengYueda KiaChangfeng

Motor

JianglingIsuzu

SoutheastMotor

CFMEngine

Qingling

FAW Daihatsu

Brilliance BMW

NanjingFiat

33.4%25%

50%50%50%

50%

50%

40% 50%

35%3%

No Equity

50%

50%

50%

65%50%

50%

25%

10%

No Equity

10%

50.9%14.9%

30%

50%

51%

40%

60%

40%

50%

50%

51.16%

35%

70%

30%50%40%

60%

60%

50%

50%

50%

50%

50%

50%

50% 50%

50%

50%

50%

50%

50%50%

50%

25%

25%

50%36%

50%25%

16.07%

50.14%

75%

12.5%

15%25%

JMCG (41%) & Public (26%)

20%

50%

20%

51%

50%

50%

No Equity 50% 50%

50%

50%GM DCX

VW TOYOTA HONDA

FORD

Daihatsu

PSA

MitsubishiSuzuki

Mazda

Nissan

Yulon-Nissan

Daewoo

SsangyongKia

Isuzu

BMW

FIAT

Hyundai

BIG3 in China

Changan

Guangzhou

BAICChangfeng Fujian Auto

Chery

ChinaBrilliance

NACMG

Copyright © 2007 Global Insight, Inc. 8

The Most Promising Domestic OEMs

13.5%

15.3%

18.4%

22.6%

23.3%

31.9%

47.8%

0% 10% 20% 30% 40% 50%

h

FAW CAR

CHERY

SAIC

BRILLIANCE

FAW TIANJIN

HAIMA

CHANGAN

6.6%

6.7%

7.4%

9.3%

9.6%

10.3%

14.6%

17.2%

26.4%

43.7%

44.8%

0%10%20%30%40%50%

SH-VW

FAW-VW

GZ-HONDA

SH-GM

BJ-HYUNDAI

GZ-TOYOTA

FAW-MAZDA

BJ-BENZ

BR-BMW

DF-HONDA

CA-FORD

Chery is widely trusted by consumers due to its good performance in recent years

The Most Trusted JVs of Global OEMs

Known as the earliest JVs, SH-VW and FAW-VW are well recognized by consumers

Source: Car Consumer Survey 2007 by Tsinghua University

Consumer Recognition of Domestic OEMs and JVs

Copyright © 2007 Global Insight, Inc. 9

• Targeting reduction in energy use by 4% this year: appears quite unrealistic• Gradually move to market based pricing

– Cutting subsidies– Gasoline prices have risen by 56% between Jan 2003 and May 2006, 18% in 2006

• Current price of 93 Octane gasoline is 5.34 yuan (US$ 0.71 cents) per litre , around 1/3 of U.K. price• Will track international oil prices in the future• Further increases needed to support conservation measures• Assuming fuel tax introduction in early 2009…will initially result in 30% increase in fuel price• Currently consumption tax accounts for 6% of retail gasoline and 3% of the price of diesel at the pump
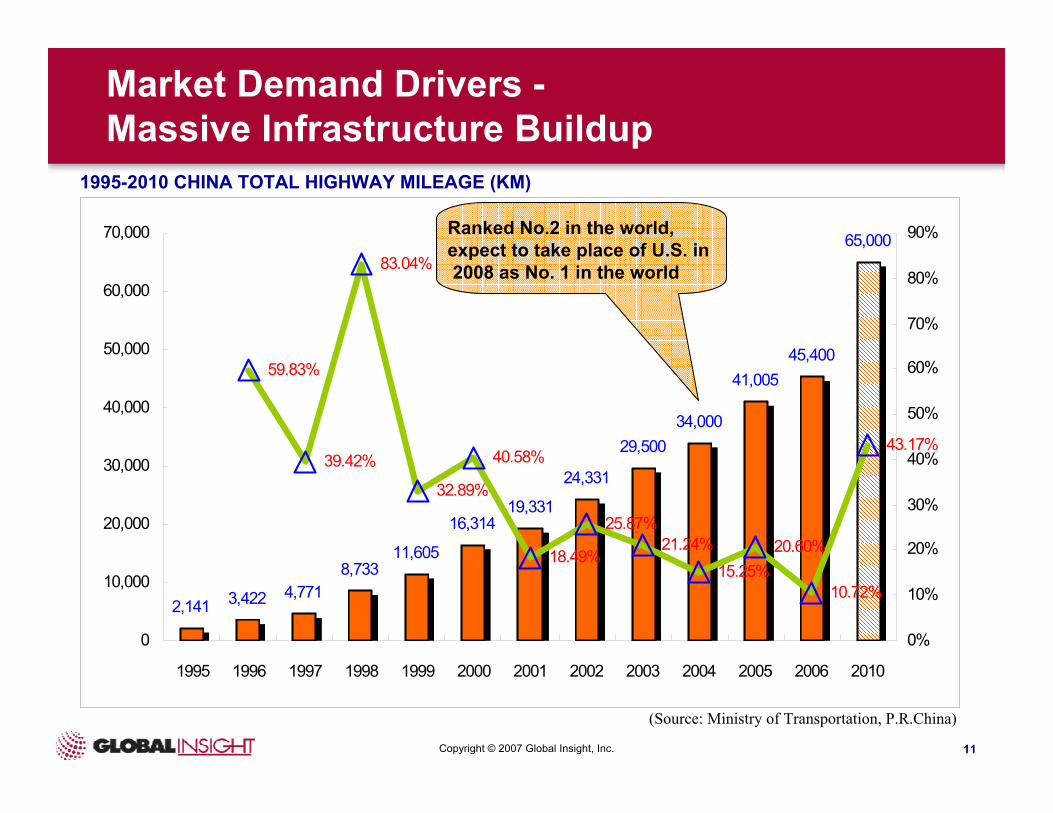
0123456789

1011

2004

2004

2004

2005

2005

2005

2006

2006

2007

2007

2008

Price of 93# Gasoline (RMB/Litre)

Mar Aug Dec Jan June Dec Mar May Jan

Fuel Prices Are Still Low…But Will Follow International Oil Prices in the Future

Scenario 3: 100% increaseScenario 2: 50% increaseScenario 1: 30% increase

Fuel Tax

Nov

Copyright © 2007 Global Insight, Inc. 10

Market Demand Drivers -Frequent New Product Launches

Q1 Q2 Q3 Q42007

CHERY A18

WEIZHI C1

ROEWE750REFINE IV

FREEMA

RIO

SPACE WAGON

EPICA

S-MAX

LANDY

FAMILY

HAIMA 3 CV11

CR-V

LIVINA

COROLLA

MAGOTAN

OCTAVIA

PARK AVENUE

BINGYUE

CHERY A1

CHERY V2

XENIA

MG 7

VOYAGER

M1A

C-Class

MONDEO

CV 7

OTING SUV

B11 MPV

SPORTAGE

MG TF

M3

CD-1

F6

B21

M11

ZINGER

MAZDA 5

SERENA MPV

MAZDA 2

CH011

QISHI

WINGLE

Copyright © 2007 Global Insight, Inc. 11

��������(��)�����������(��)

1995-2010 CHINA TOTAL HIGHWAY MILEAGE (KM)

(Source: Ministry of Transportation, P.R.China)

2,141 3,422 4,7718,733

11,605

16,31419,331

24,331

29,50034,000

41,00545,400

65,000

59.83%

39.42%

83.04%

32.89%

40.58%

18.49%

25.87%21.24%

15.25%20.60%

10.72%

43.17%

0

10,000

20,000

30,000

40,000

50,000

60,000

70,000

1995 1996 1997 1998 1999 2000 2001 2002 2003 2004 2005 2006 2010

0%

10%

20%

30%

40%

50%

60%

70%

80%

90%Ranked No.2 in the world,expect to take place of U.S. in2008 as No. 1 in the world

Market Demand Drivers -Massive Infrastructure Buildup

Copyright © 2007 Global Insight, Inc. 12

Market Demand Drivers -Increased Affordability Due to the Price War

7074788286909498

102

Jan/

2004

Apr

/200

4

Jul/2

004

Oct

/200

4

Jan/

2005

Apr

/200

5

Jul/2

005

Oct

/200

5

Jan/

2006

Apr

/200

6

Jul/2

006

Oct

/200

6

Jan/

2007

Apr

/200

7

Jul/2

007

Luxury Standard Compact Small Micro

Copyright © 2007 Global Insight, Inc. 13

Prices Already Below U.S. Levels for Many Models in Segment A/B…But Prices Remain High in C and D

Civic and Corolla base version prices 21% and 20% higher than in U.S.

Accord and Camry base version prices 29% and 39% higher than in U.S.

Prices of Chevrolet models considerably lower in China

Price of Fit 25% lower than in U.S.

$24,900 $18,470 $35,137 $25,760 CamryToyota

$23,445 $17,345 $29,146 $21,592 SonataHyundai$27,400 $18,625 $39,044 $24,093 AccordHonda

$16,895 $13,395 $18,232 $13,000 ElantraHyundai$18,710 $15,010 $23,442 $18,232 CivicHonda$15,615 $14,405 $26,020 $17,295 CorollaToyota$14,015 $10,415 $14,820 $9,116 AccentHyundai$15,170 $13,850 $13,258 $10,262 FitHonda$13,525 $11,150 $10,392 $8,699 YarisToyota$15,102 $10,560 $11,905 $8,670 AveoChevrolet

HIGHLOWHIGHLOWUSChina

Retail Price in China vs. US (in US$)Model NameBrand

Copyright © 2007 Global Insight, Inc. 14

Used Car Transactions Rising Rapidly …Greater Focus by OEMs and Franchised Dealers

Trend• Cars purchased at the

beginning of boom period (2002-2003) now entering used car market– Number of transactions in

Beijing have quadrupled since 2002

• Ministry of Commence taking steps to regulate this market

• Gradual improvement in the status of used cars

• Direct Auto-finance still difficult to obtain for used cars

Assumed ImpactConsumer choice will extend to better quality used vehiclesFor a given budget, consumer will be able to choose between a larger used car and a smaller new carDevelopment of used car market will raise role of residual values in the new car buying processWill encourage more long term approach on pricingBetter balance in dealer activities between New Car, Used Car and Parts/Service activities

Copyright © 2007 Global Insight, Inc. 15

Car, SUV, MPV Sales Growth of 36% in 2006 (Domestic Produced Models Only)

0

50

100

150

200

250

300

350

400

450

500

Jan.

Feb.

Mar

.

Apr

.

May

Jun.

Jul.

Aug

.

Sep.

Oct

.

Nov

.

Dec

.

Car

Sal

es (T

hous

and

units

)

2005

2003

2004

2006

2007

2004 Car Sales: 2.54 million units (Domestic Built Vehicles Only)2005 Car Sales: 3.17 million units (Domestic Built Vehicle Only)2006 Car Sales: 4.2 million units (Domestic Built Vehicle Only)2007 Car Sales: 5.24 million units (Forecast growth 24.8%)2008 Car Sales: 6.15 million units (Forecast growth 17.3%)

Copyright © 2007 Global Insight, Inc. 16

Car Ownership Per 1000 Population Still Low

549 546

492468

439 432

253 238

3613.1 7.8

0

100

200

300

400

500

600

AU

S

GER

FRA

US

UK

JPN

MY

S.KO

R

TH CH

N

IN

Car Per 1,000 Population 2006

Copyright © 2007 Global Insight, Inc. 17

Vehicle Production - Incremental Year-over-Year Growth…2007 an Exceptional Year

0

200

400

600

800

1000

1200

1400

1600

180020

00

2001

2002

2003

2004

2005

2006

2007

2008

2009

2010

2011

Gro

wth

in V

ehic

le P

rodu

ctio

n

Copyright © 2007 Global Insight, Inc. 18

Total Vehicle Sales…Over 13 Million Units in 2012

Cars: 6.28 million LCVs: 2.89 millionHCVs: 879,000

2008 Sales

0

2,000

4,000

6,000

8,000

10,000

12,000

1992

1994

1996

1998

2000

2002

2004

2006

2008

2010

2012

Sale

s (T

hous

and

Uni

ts)

Car

LCV

Truck and Bus

Copyright © 2007 Global Insight, Inc. 19

0

50

100

150

200

250

A B C D E

SUV

MPV

OTH

ER

Sale

s In

crea

se (2

008

vs 2

007)

2008 – Segments B and C Lead Growth Limited Growth Potential for Segment A

Sales Growth Forecast 2008 vs 2007 (Thousand units)

Expected to account for 48% all growth in 2008

Copyright © 2007 Global Insight, Inc. 20

Sales Growth Diffusing Away from Mega-Cities

25.0%

8.1%

20.6%

27.6%

33.4%33.7% 34.4%

36.0%

Tier 1 Tier 2 Tier 3 Tier 4

2005 2006

Xinjiang

Gansu

Heilongjiang

Jilin

Liaoning

Taiwan

Tibet

Sichuan

YunnanGuan

gxiGuangdong

Fujian

Shandong

Hubei

Hunan Jiangxi

Hainan

Inner Mongolia

NingxiaQinghai

Hebei

Shanxi

Henan

Anhui

Zhejiang

JiangsuShaanxi)

Guizhou

Tianjin

Shanghai

Beijing

Per Capita GDP in US$

Car Ownership Per ‘000 people

Tier 1

Tier 2

Tier 3

Tier 4

50>5000

3000 - 5000

1000 - 3000

<1000

18

5

<5

More opportunities for local brands

Copyright © 2007 Global Insight, Inc. 21

MSRPMSRP

CHINA

MSRPMSRP

DEVELOPED COUNTRIES

PURCHASE TAXCONSUMPTION TAX

HIGH REGISTRATION FEES

PURCHASE TAXCONSUMPTION TAX

HIGH REGISTRATION FEES

Generally 30-35% of MSRP

CONSUMPTION TAXCONSUMPTION TAX Generally 5-25%

High Cost of Ownership, Environment, and Infrastructure Hold Back Car Consumption in Mega Cities

The extra costs Chinese consumers have to bear hold back car consumption

FUEL TAX??FUEL TAX??

TOLL CHARGEROAD MAINTANACE FEE

TOLL CHARGEROAD MAINTANACE FEE

ROAD TAXFUELTAX

ROAD TAXFUELTAX

OTHER FEES/CAR TAX

OTHER FEES/CAR TAX

OTHER FEESOTHER FEES

Copyright © 2007 Global Insight, Inc. 22

• Aims to control the total fuel consumption growth within 50% when PARC reaches 55 million units– Reduce average vehicle fuel consumption by 15%– Encourage use of small displacement vehicles– Government funding hybrid/fuel cell vehicle program in “863” project to

develop alternative fuel and powertrain technology• Focus on promoting purely Chinese car manufacturers

– Aim to increase market share of local brands to at least 50% in the passenger car market

• Strong support of independent R&D activities– Direct finance support and indirect tax incentives

• Aims to consolidate State-owned Enterprises

Government Policy - 11th Five-Year Plan Emphasis on Independent Technical Development

• Traditional Big 3 (FAW, Dongfeng, and SAIC) are facing increasing pressure to build up independent passenger car brands and a high local R&D capability

• New emerging local Chinese companies will be able to obtain more government funding to accelerate independent technical development

Copyright © 2007 Global Insight, Inc. 23

Technical Road Map of Chinese R&D Build-up

Increasing R&D capabilities and technology tra

nsfer, stronger lo

cal supplier base

Low

end

Over 60 Local OEMs

Step 1: Imitation, reverse engineering of foreign OEM models. R&D complete outsourcing

Low

–to

-Med

ium

Full

Prod

uct L

ine-

up

Shakeout, Market Reshuffling

Step 2: Improve collaboration with international suppliers, joint development with overseas R&D institutes

Around 10 major local

OEMs

Step 3: Synchronize the supply chain, independent development, increasing R&D capabilities and technology transfer

Pre 2000 2000-2015 Post 2015

Step 4: Be able to compete with global OEMs

Further consolidation?

Copyright © 2007 Global Insight, Inc. 24

Local OEMs’ Product Line-ups Shift Up…More Direct Competition with Global OEMs

THO

USA

ND

RM

B

0

50

100

150

200

250

300

FAW

-XIA

LICHERYGEELY

BRILLIA

NCE

HAFEI

BYDCHANGAN

HAIMA

LIFAN

FAW

CAR

SAIC

NAG

V5

QQ

Vision

Merrie Flyer

F3

CV11

CV6

Zunchi

JunjieFamilia II

Freema

520Lubao

Saibao VVela

Xiali

Besturn

Roewe 750

MG75

BJ212

1996-2006 2006

More higher priced models expected after 2006, including

Chery F11, Geely GH-1 and FAW HQE etc

Copyright © 2007 Global Insight, Inc. 25

0%

10%

20%

30%

40%

50%

60%

70%

1996

1998

2000

2002

2004

2006

2008

2010

2012

2014

2016

Market Share Trends by OEM Country of Origin

CHN

JPN

EUR

US

KOR

Copyright © 2007 Global Insight, Inc. 26

Profitability Under Pressure

Downward Pressure on Prices

• Price war continues• Greater consumer choice and

intense competition• Looming over-capacity in the

medium and long term

Upward Pressure on Costs

• Faster pace of new model launch– Higher tooling and product costs

• Rising commodity and oil prices• Higher sales and marketing

costs– Greater competition

Cost Reduction Measures

• Greater scale economies and efficiencies• Higher local content levels• Fresh investments in “lower cost” cities in interior• Greater use of domestic suppliers

Copyright © 2007 Global Insight, Inc. 27

Conclusions

• The Chinese Government will continue to offer favourable policies to support domestic OEMs, as auto sector is regarded as pillar industry

• The relationship between global OEMs and domestic OEMs becomes strained due to more direct competition and violation of IP rights

• Tight relationships are also likely to appear within JVs over the coming years as increasing technology transfer and a stronger local component supplier base enable domestic OEMs to seek independence

• The domestic OEMs are expected to continue to grow despite the production ramp up by global OEMs

• Energy consumption becomes a constraint. Market competition willgradually shift from price war to energy efficiency

16 NOVEMBER 2007 • SHANGHAI AUTOMOBILE EXHIBITION CENTRE • ANTING

GLOBAL AUTOMOTIVE SEMINAR

Thank You

John ZengSenior Market Analyst, Asia

E-mail: [email protected]


Recommended