40
CHALLENGES AND OPPORTUNITIES IN THE TANKER MARKETS MARK WILLIAMS, MANAGING PARTNER, AFFINITY RESEARCH 20/10/2017
CHALLENGES AND OPPORTUNITIES IN THE TANKER MARKETS
MARK WILL IAMS,
MANAGING PARTNER, AFF IN ITY RESEARCH
2 0 / 1 0 / 2 0 1 7

SYNOPSIS
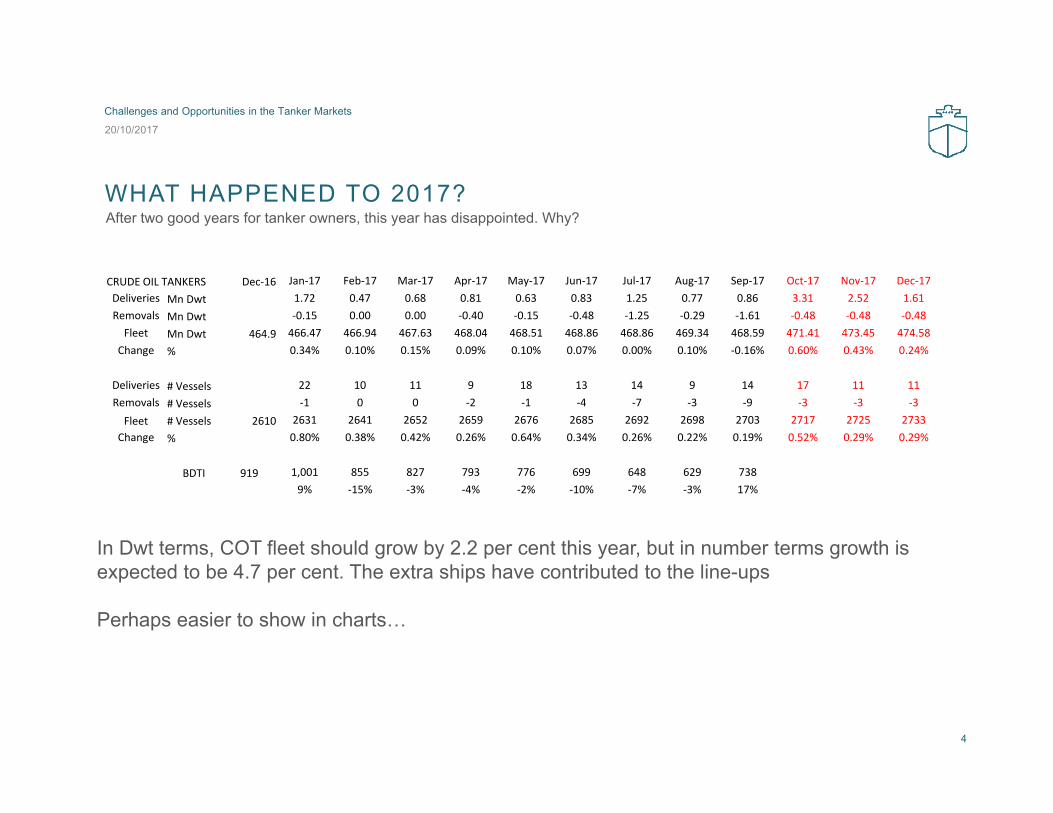
WHAT HAPPENED TO 2017?
MACRO ECONOMIC and GEOPOLITICAL ISSUES
OIL AND TANKER DEMAND TRENDS
TANKER SUPPLY
FREIGHT MARKET OUTLOOK
TECH TRENDS AND TANKER SHIPPING
CONCLUSIONS…AND UNANSWERABLE QUESTIONS
LPG COMMENTS
LNG COMMENTS
20/10/2017
Challenges and Opportunities in the Tanker Markets
2
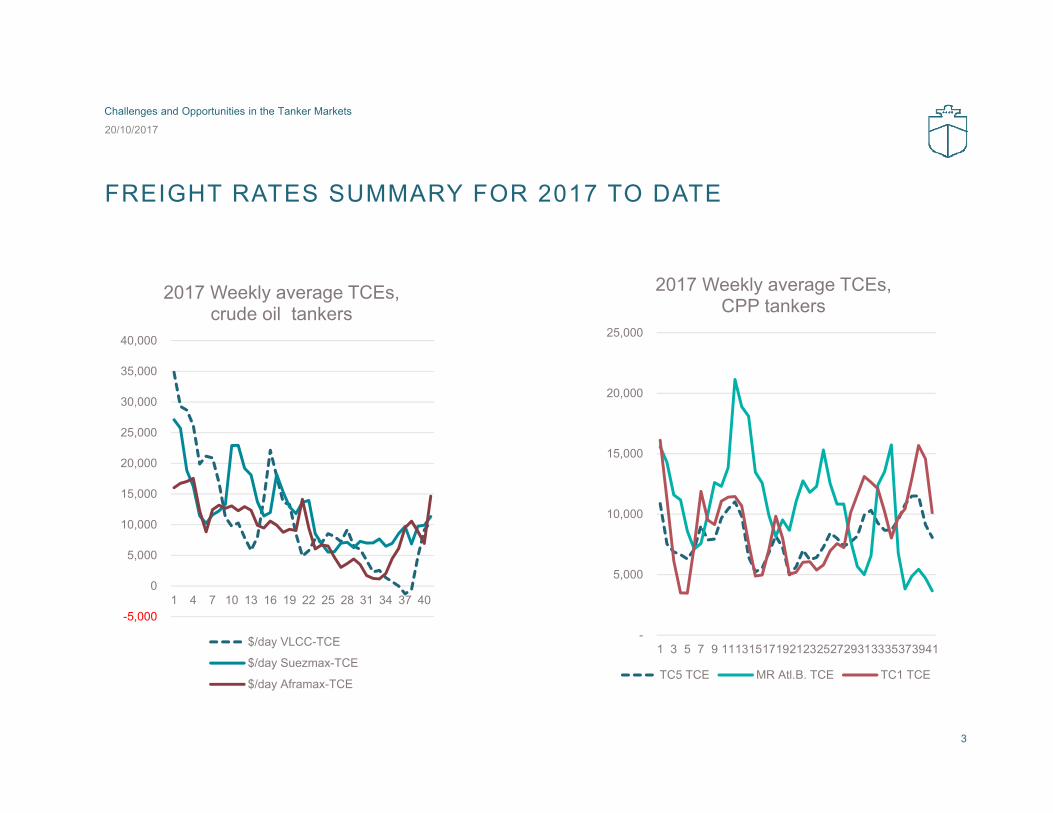
FREIGHT RATES SUMMARY FOR 2017 TO DATE
20/10/2017
Challenges and Opportunities in the Tanker Markets
3
-5,000
0
5,000
10,000
15,000
20,000
25,000
30,000
35,000
40,000
1 4 7 10 13 16 19 22 25 28 31 34 37 40
2017 Weekly average TCEs, crude oil tankers
$/day VLCC-TCE
$/day Suezmax-TCE
$/day Aframax-TCE
-
5,000
10,000
15,000
20,000
25,000
1 3 5 7 9 11131517192123252729313335373941
2017 Weekly average TCEs, CPP tankers
TC5 TCE MR Atl.B. TCE TC1 TCE
WHAT HAPPENED TO 2017?
CRUDE OIL TANKERS Dec‐16 Jan‐17 Feb‐17 Mar‐17 Apr‐17 May‐17 Jun‐17 Jul‐17 Aug‐17 Sep‐17 Oct‐17 Nov‐17 Dec‐17Deliveries Mn Dwt 1.72 0.47 0.68 0.81 0.63 0.83 1.25 0.77 0.86 3.31 2.52 1.61Removals Mn Dwt ‐0.15 0.00 0.00 ‐0.40 ‐0.15 ‐0.48 ‐1.25 ‐0.29 ‐1.61 ‐0.48 ‐0.48 ‐0.48Fleet Mn Dwt 464.9 466.47 466.94 467.63 468.04 468.51 468.86 468.86 469.34 468.59 471.41 473.45 474.58
Change % 0.34% 0.10% 0.15% 0.09% 0.10% 0.07% 0.00% 0.10% ‐0.16% 0.60% 0.43% 0.24%
Deliveries # Vessels 22 10 11 9 18 13 14 9 14 17 11 11Removals # Vessels ‐1 0 0 ‐2 ‐1 ‐4 ‐7 ‐3 ‐9 ‐3 ‐3 ‐3Fleet # Vessels 2610 2631 2641 2652 2659 2676 2685 2692 2698 2703 2717 2725 2733
Change % 0.80% 0.38% 0.42% 0.26% 0.64% 0.34% 0.26% 0.22% 0.19% 0.52% 0.29% 0.29%
BDTI 919 1,001 855 827 793 776 699 648 629 7389% ‐15% ‐3% ‐4% ‐2% ‐10% ‐7% ‐3% 17%
After two good years for tanker owners, this year has disappointed. Why?
20/10/2017
Challenges and Opportunities in the Tanker Markets
4
In Dwt terms, COT fleet should grow by 2.2 per cent this year, but in number terms growth is expected to be 4.7 per cent. The extra ships have contributed to the line-ups
Perhaps easier to show in charts…
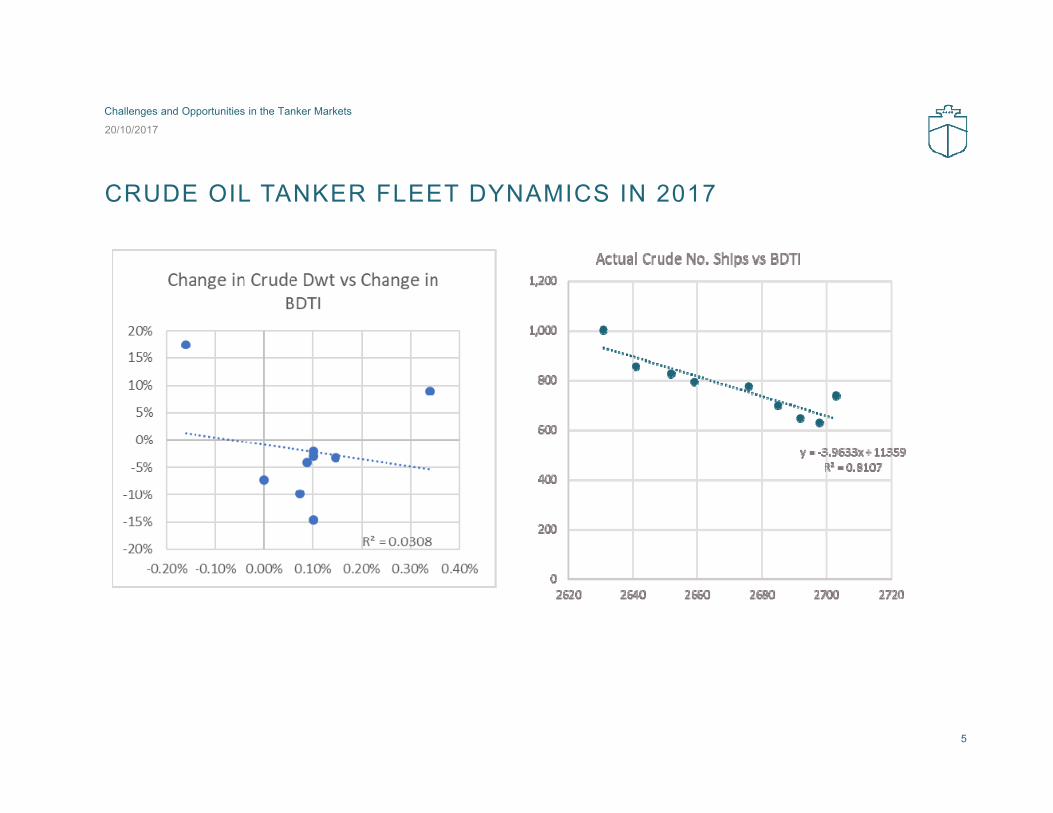
CRUDE OIL TANKER FLEET DYNAMICS IN 2017
20/10/2017
Challenges and Opportunities in the Tanker Markets
5
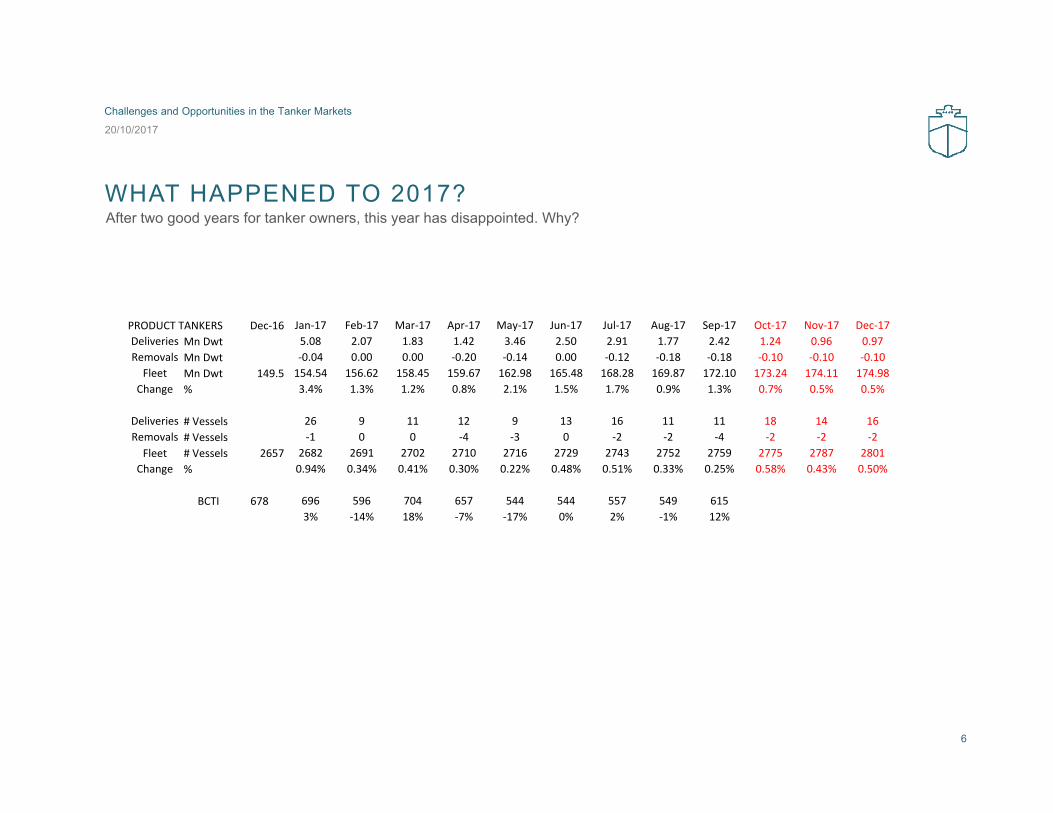
WHAT HAPPENED TO 2017?After two good years for tanker owners, this year has disappointed. Why?
20/10/2017
Challenges and Opportunities in the Tanker Markets
6
PRODUCT TANKERS Dec‐16 Jan‐17 Feb‐17 Mar‐17 Apr‐17 May‐17 Jun‐17 Jul‐17 Aug‐17 Sep‐17 Oct‐17 Nov‐17 Dec‐17Deliveries Mn Dwt 5.08 2.07 1.83 1.42 3.46 2.50 2.91 1.77 2.42 1.24 0.96 0.97Removals Mn Dwt ‐0.04 0.00 0.00 ‐0.20 ‐0.14 0.00 ‐0.12 ‐0.18 ‐0.18 ‐0.10 ‐0.10 ‐0.10Fleet Mn Dwt 149.5 154.54 156.62 158.45 159.67 162.98 165.48 168.28 169.87 172.10 173.24 174.11 174.98
Change % 3.4% 1.3% 1.2% 0.8% 2.1% 1.5% 1.7% 0.9% 1.3% 0.7% 0.5% 0.5%
Deliveries # Vessels 26 9 11 12 9 13 16 11 11 18 14 16Removals # Vessels ‐1 0 0 ‐4 ‐3 0 ‐2 ‐2 ‐4 ‐2 ‐2 ‐2Fleet # Vessels 2657 2682 2691 2702 2710 2716 2729 2743 2752 2759 2775 2787 2801
Change % 0.94% 0.34% 0.41% 0.30% 0.22% 0.48% 0.51% 0.33% 0.25% 0.58% 0.43% 0.50%
BCTI 678 696 596 704 657 544 544 557 549 6153% ‐14% 18% ‐7% ‐17% 0% 2% ‐1% 12%
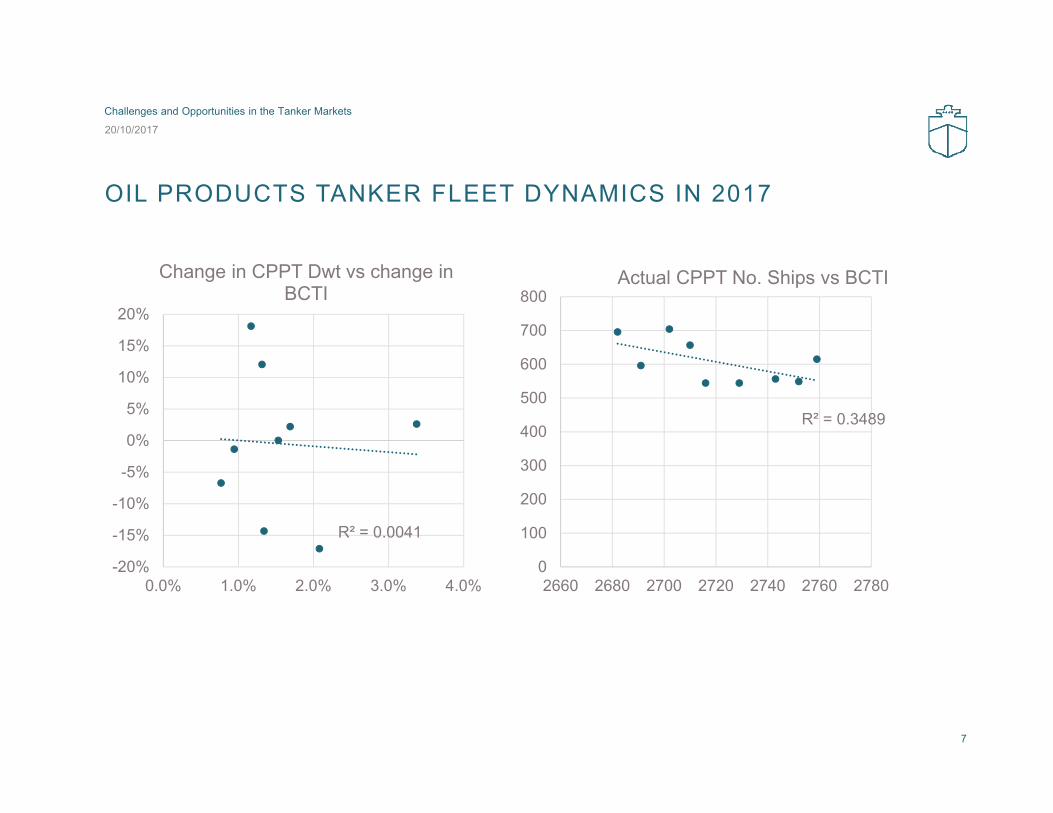
OIL PRODUCTS TANKER FLEET DYNAMICS IN 2017
20/10/2017
Challenges and Opportunities in the Tanker Markets
7
R² = 0.0041
-20%
-15%
-10%
-5%
0%
5%
10%
15%
20%
0.0% 1.0% 2.0% 3.0% 4.0%
Change in CPPT Dwt vs change in BCTI
R² = 0.3489
0
100
200
300
400
500
600
700
800
2660 2680 2700 2720 2740 2760 2780
Actual CPPT No. Ships vs BCTI
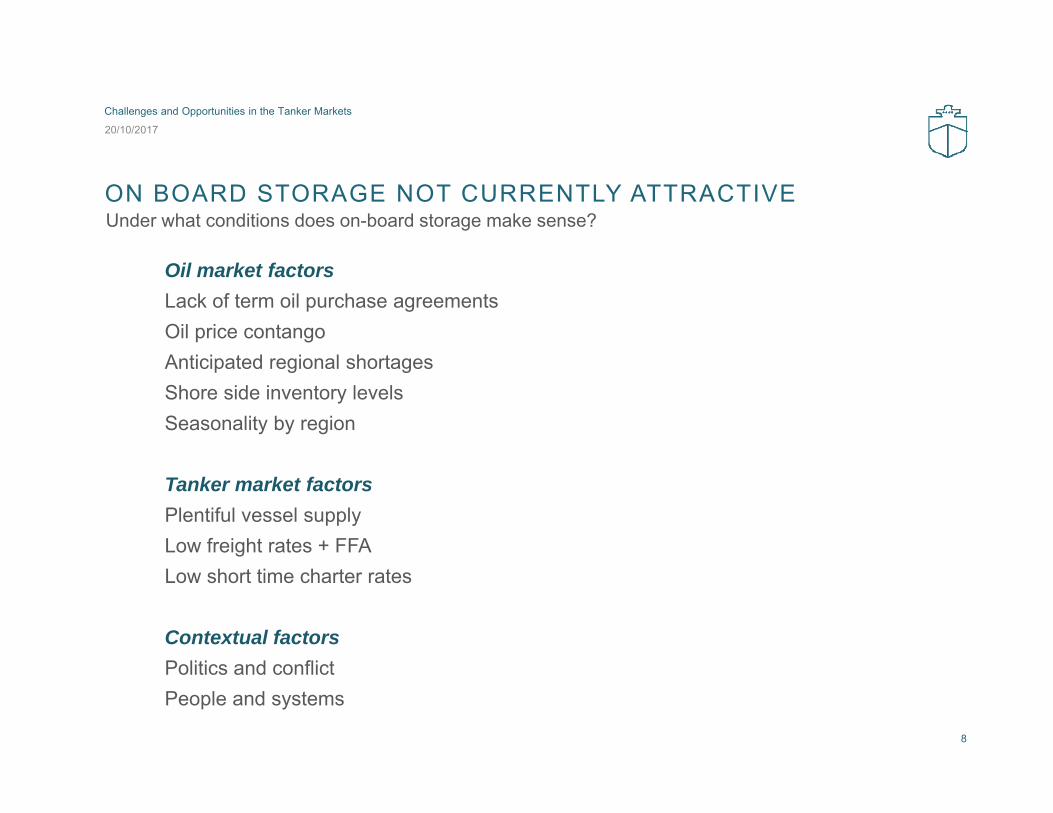
ON BOARD STORAGE NOT CURRENTLY ATTRACTIVE
Oil market factorsLack of term oil purchase agreementsOil price contangoAnticipated regional shortagesShore side inventory levelsSeasonality by region
Tanker market factorsPlentiful vessel supplyLow freight rates + FFALow short time charter rates
Contextual factorsPolitics and conflictPeople and systems
Under what conditions does on-board storage make sense?
20/10/2017
Challenges and Opportunities in the Tanker Markets
8
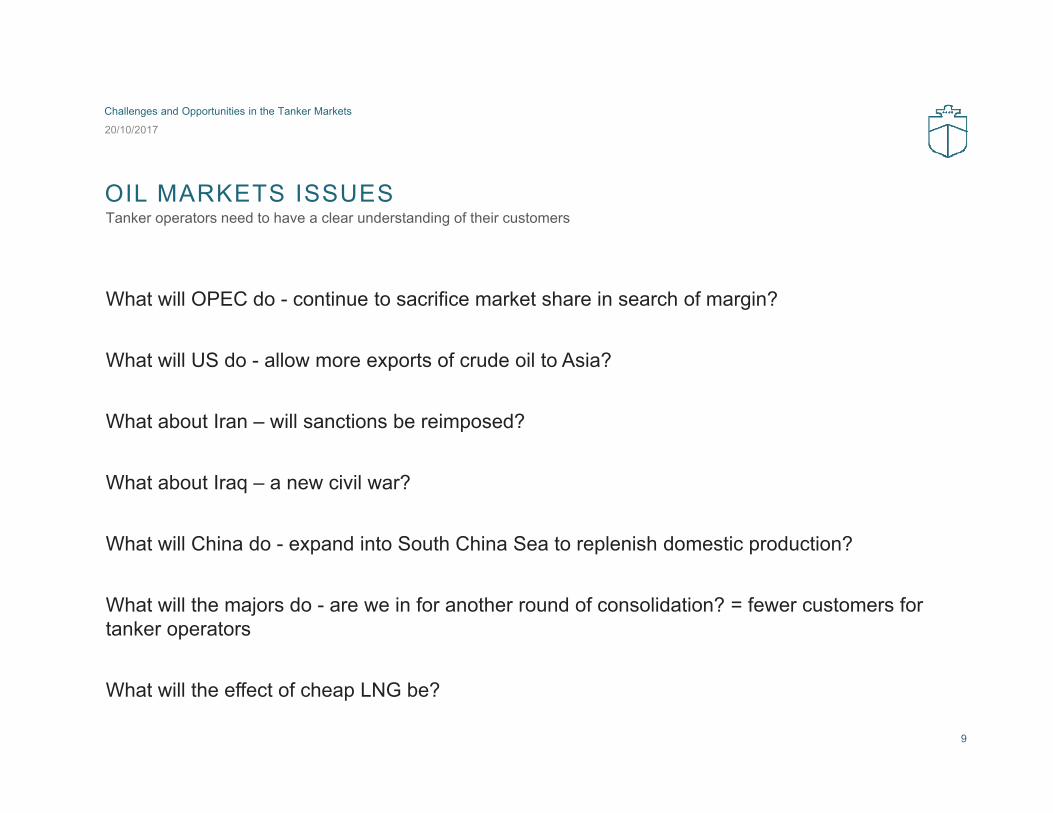
OIL MARKETS ISSUESTanker operators need to have a clear understanding of their customers
20/10/2017
Challenges and Opportunities in the Tanker Markets
9
What will OPEC do - continue to sacrifice market share in search of margin?
What will US do - allow more exports of crude oil to Asia?
What about Iran – will sanctions be reimposed?
What about Iraq – a new civil war?
What will China do - expand into South China Sea to replenish domestic production?
What will the majors do - are we in for another round of consolidation? = fewer customers for tanker operators
What will the effect of cheap LNG be?
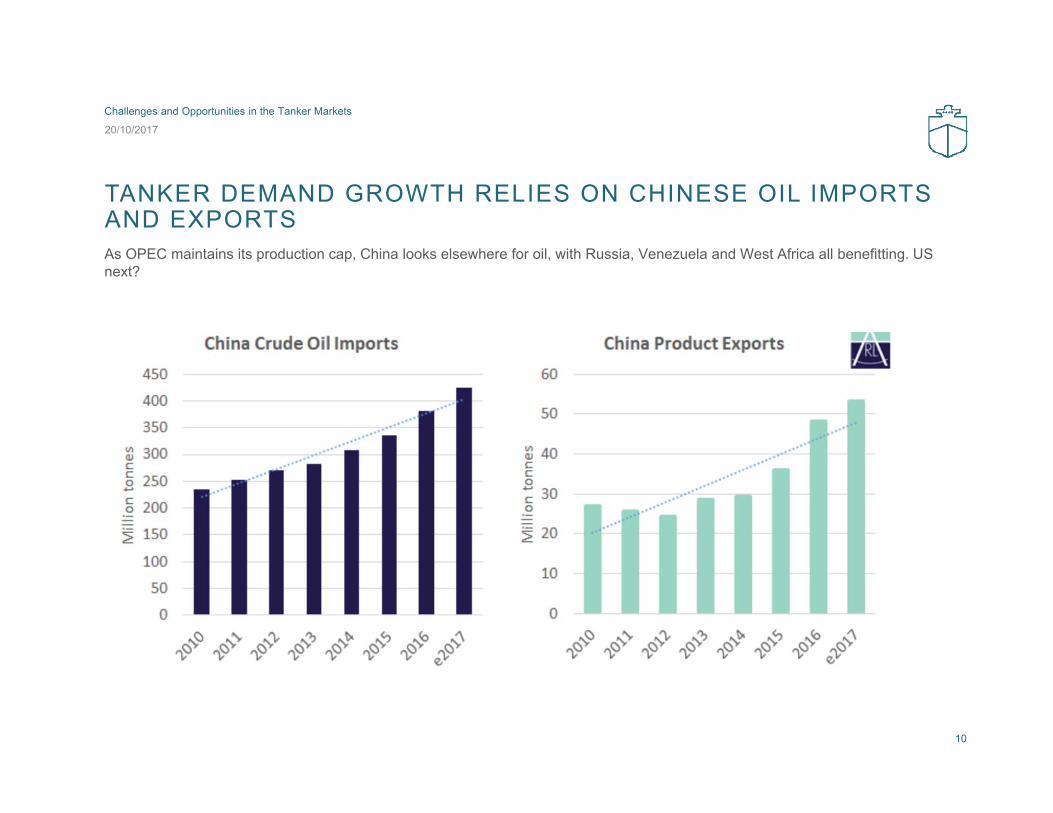
TANKER DEMAND GROWTH RELIES ON CHINESE OIL IMPORTS AND EXPORTSAs OPEC maintains its production cap, China looks elsewhere for oil, with Russia, Venezuela and West Africa all benefitting. US next?
20/10/2017
Challenges and Opportunities in the Tanker Markets
10
MACRO AND GEOPOLITICAL ISSUES
Long Term Climate Change & Policy Response- effects on oil demand
Real Time Pollution control and Ballast Water- ship designs, regulatory push on newbuilding demand
Global Trade - baton passed to China as the guarantor of globalisation
WTO now a dead duck - are we back to an era of bilateralism or is that just for the Trump presidency?
Your 25 year asset faces a number of challenges
20/10/2017
Challenges and Opportunities in the Tanker Markets
11

EMERGING MARKETS TO DRIVE ENERGY DEMANDShell World Energy Model suggests that global oil demand will continue to grow with energy demand
20/10/2017
Challenges and Opportunities in the Tanker Markets
12
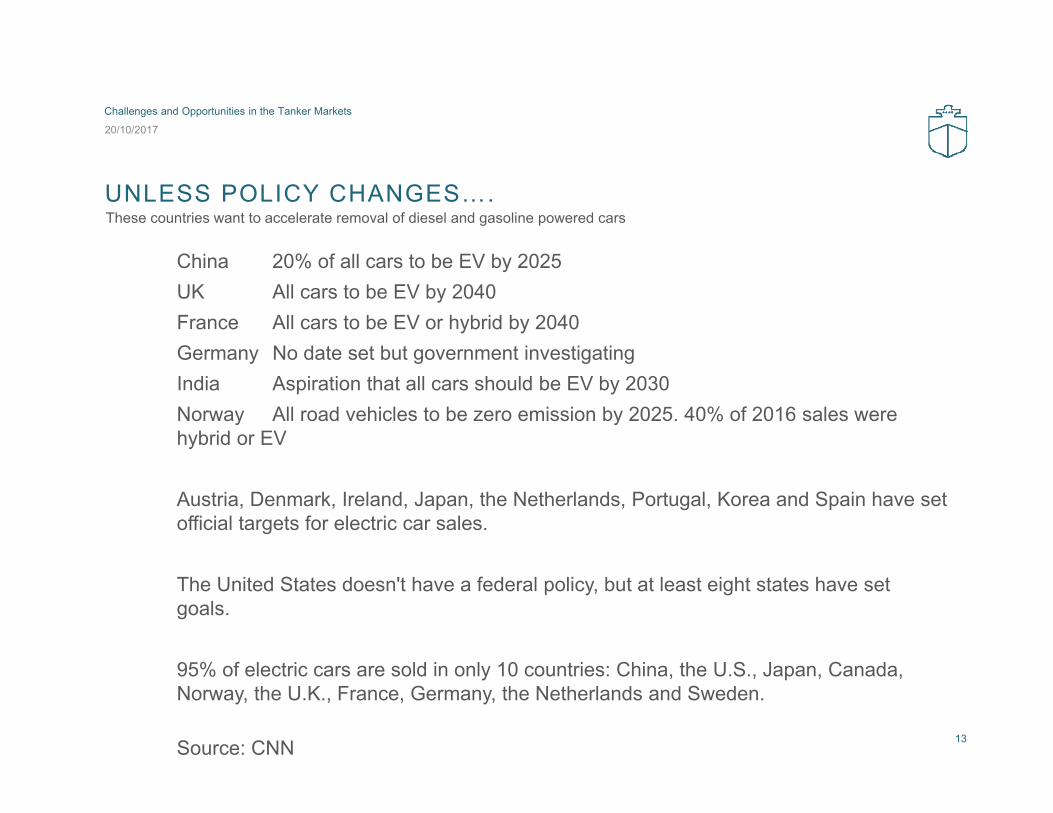
UNLESS POLICY CHANGES….
China 20% of all cars to be EV by 2025UK All cars to be EV by 2040France All cars to be EV or hybrid by 2040Germany No date set but government investigatingIndia Aspiration that all cars should be EV by 2030Norway All road vehicles to be zero emission by 2025. 40% of 2016 sales were hybrid or EV
Austria, Denmark, Ireland, Japan, the Netherlands, Portugal, Korea and Spain have set official targets for electric car sales.
The United States doesn't have a federal policy, but at least eight states have set goals.
95% of electric cars are sold in only 10 countries: China, the U.S., Japan, Canada, Norway, the U.K., France, Germany, the Netherlands and Sweden.
Source: CNN
These countries want to accelerate removal of diesel and gasoline powered cars
20/10/2017
Challenges and Opportunities in the Tanker Markets
13

TANKER FLEET AND ORDERBOOK AT 1ST OCTOBER 2017Supply Side Discipline Anyone?
20/10/2017
Challenges and Opportunities in the Tanker Markets
14
2017 YTD 2017 2018 2019 2020 2021
(Mn Dwt) (Mn Dwt) (No. of Ships) On Order as % of exist. fleet
Handysize 21.9 1.3 36 6.0% 13 9 17 7 3 0Medium Range 75.6 7.5 152 9.9% 57 21 68 49 13 1Panamax / LR1 32.3 2.7 36 8.3% 19 7 19 7 1 2
of which LR1: 27.2 2.4 32 8.7% 16 6 18 5 1 2
Aframax / LR2 109.6 15.5 137 14.2% 58 21 64 33 11 8of which LR2: 38.3 6.2 55 16.3% 32 12 20 12 7 4
Suezmax 86.5 10.4 67 12.0% 50 17 38 10 2 0VLCC 218.4 30.0 97 13.8% 41 12 48 36 1 0
Grand Total 544.2 67.5 525 12.4% 238 87 254 142 31 11
Apr-17 May-17 Jun-17 Jul-17 Aug-17 Sep-17 2016 Ytd 2017 Ytd 2016 Ytd 2017 YtdHandysize 0 0 0 0 0 0 5 4 7 2Medium Range 15 3 10 7 3 3 19 48 8 9Panamax / LR1 0 2 0 0 1 0 3 3 1 3
of which LR1: 0 1 0 0 1 0 3 2 1 3
Aframax / LR2 6 6 4 8 0 6 14 43 7 15of which LR2: 4 4 4 8 0 4 3 36 1 2
Suezmax 0 2 10 0 6 0 11 18 0 8VLCC 13 13 0 4 0 7 14 46 0 6Grand Total 34 26 24 19 10 16 66 162 23 43
Y-O-Y% change 145% Y-O-Y%
change 87%
Demolition
(No. of Ships)
5981590446
1015
5557134,917
18
New Contracts
52
22
60
2
Fleet Orderbook
Sold for Scrap
372
355
(No. of Vessels)
1
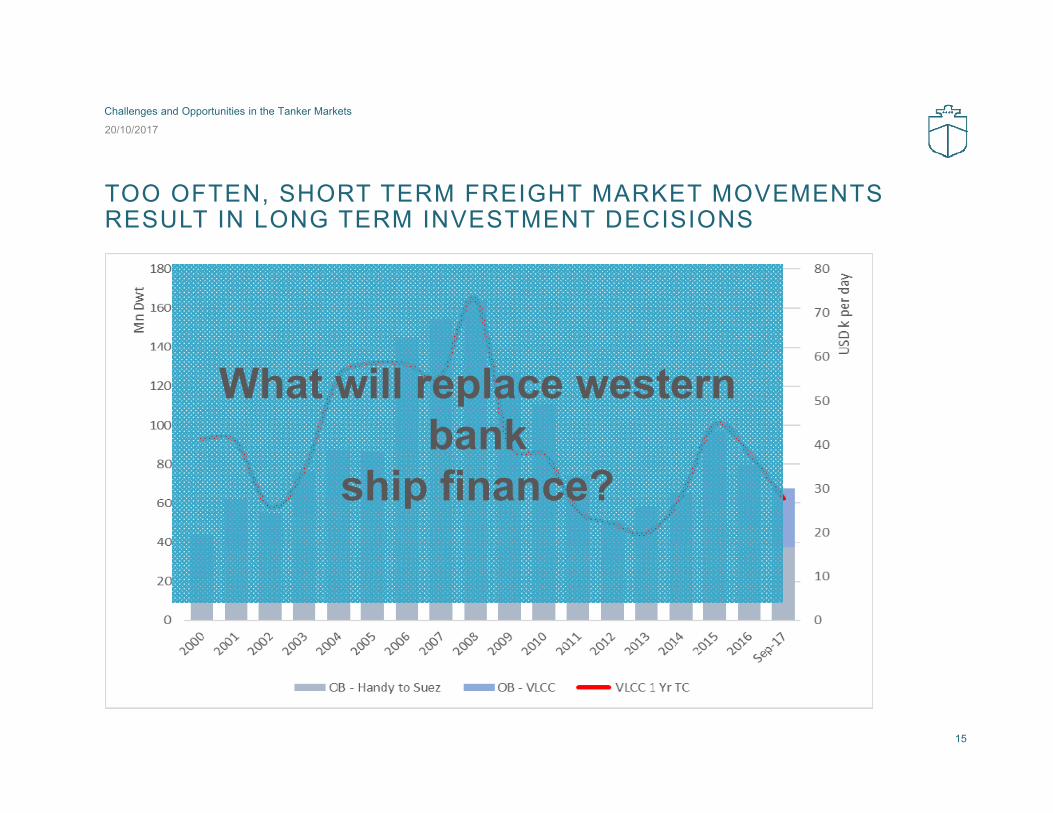
TOO OFTEN, SHORT TERM FREIGHT MARKET MOVEMENTS RESULT IN LONG TERM INVESTMENT DECISIONS
20/10/2017
Challenges and Opportunities in the Tanker Markets
15
What will replace western bank
ship finance?
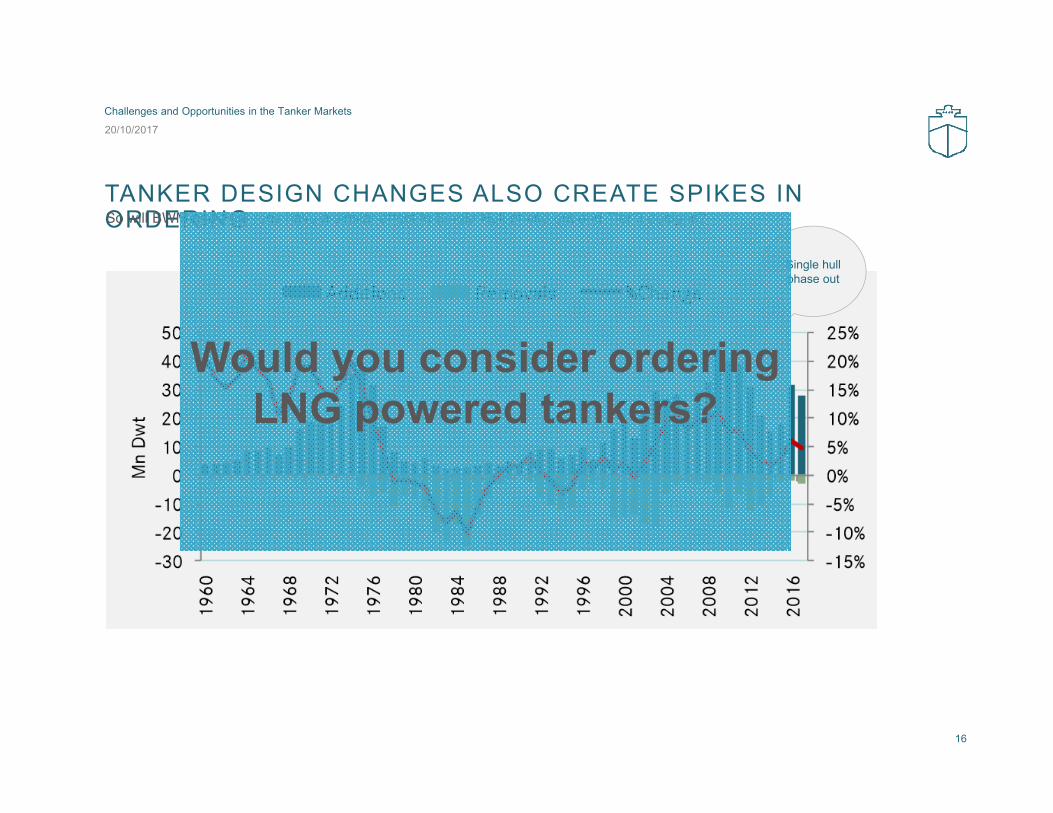
TANKER DESIGN CHANGES ALSO CREATE SPIKES IN ORDERINGSo will BWM and Fuel regs have a similar effect to Single Hull phase out and Tier 3 designs?
20/10/2017
Challenges and Opportunities in the Tanker Markets
16
Single hull phase out
Would you consider ordering LNG powered tankers?
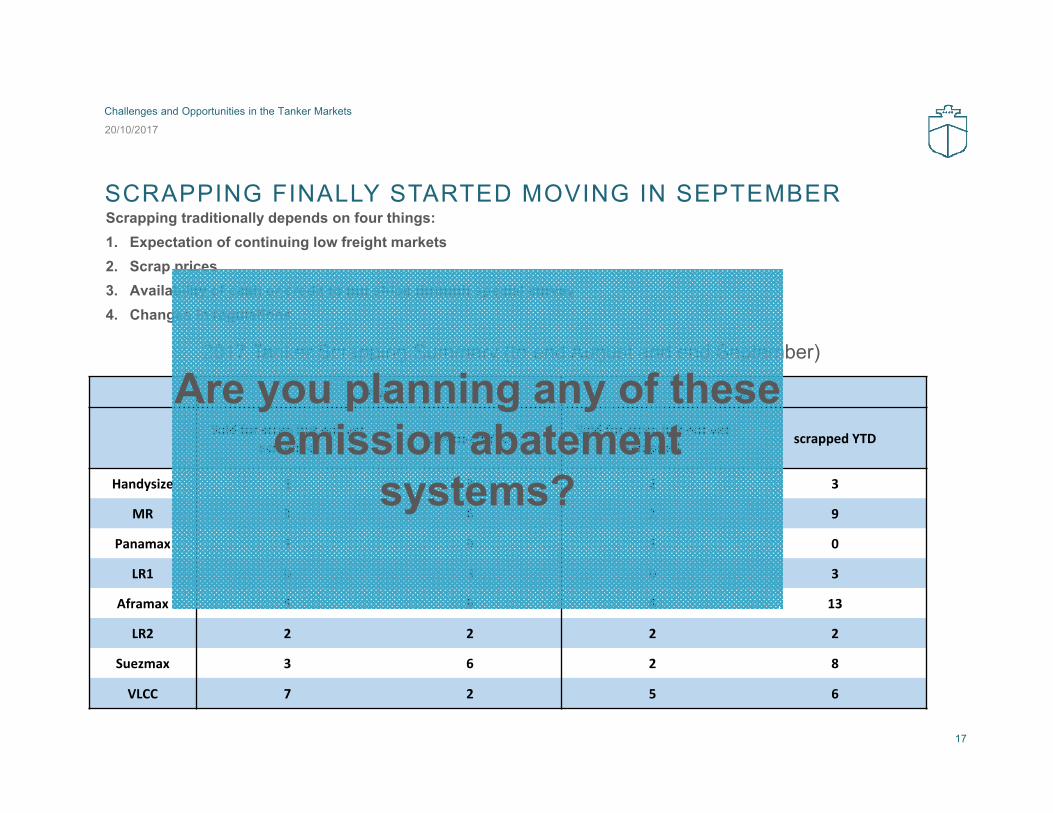
SCRAPPING FINALLY STARTED MOVING IN SEPTEMBERScrapping traditionally depends on four things:1. Expectation of continuing low freight markets2. Scrap prices3. Availability of cash or credit to put ships through special survey4. Changes in regulations
20/10/2017
Challenges and Opportunities in the Tanker Markets
17
2017 Tanker Scrapping Summary (to end August and end September)
Aug Sep
Sold for scrap but not yet scrapped scrapped YTD Sold for scrap but not yet
scrapped scrapped YTD
Handysize 1 3 2 3
MR 3 6 2 9
Panamax 1 0 1 0
LR1 0 3 0 3
Aframax 5 9 4 13
LR2 2 2 2 2
Suezmax 3 6 2 8
VLCC 7 2 5 6
Are you planning any of these emission abatement
systems?

BALTIC EXCHANGE DEMOLITION ASSESSMENTS
20/10/2017
Challenges and Opportunities in the Tanker Markets
18
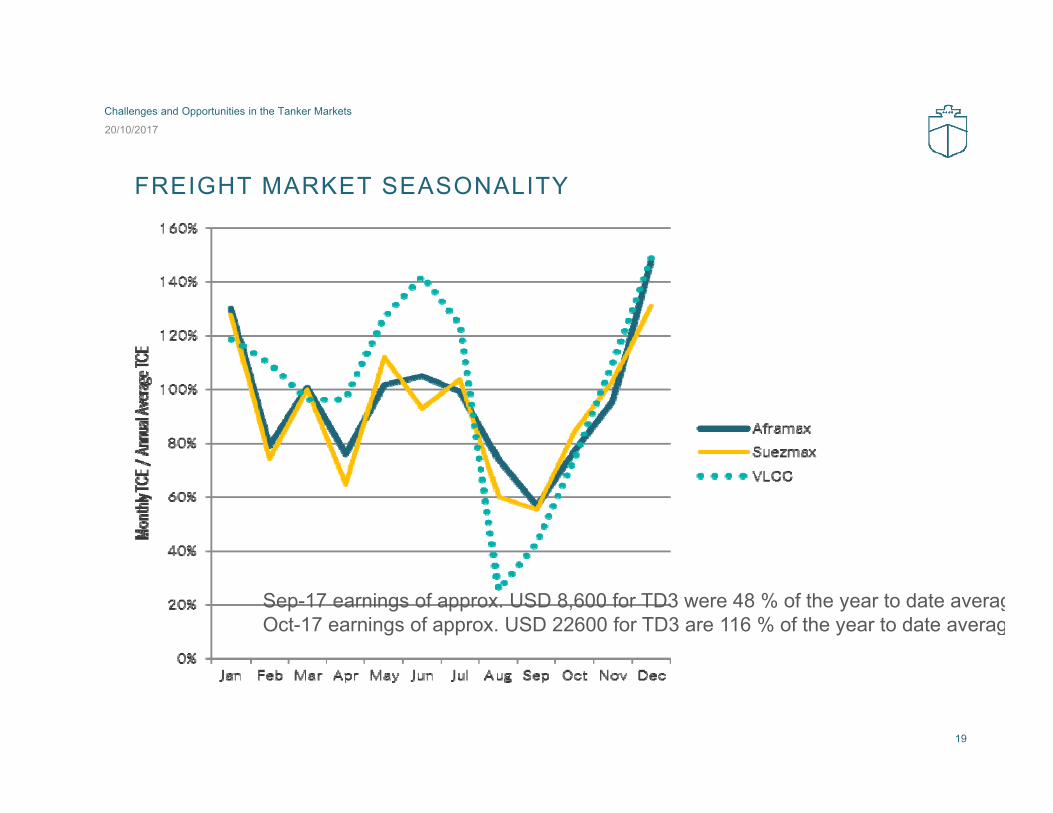
FREIGHT MARKET SEASONALITY
19
20/10/2017
Challenges and Opportunities in the Tanker Markets
Sep-17 earnings of approx. USD 8,600 for TD3 were 48 % of the year to date averagOct-17 earnings of approx. USD 22600 for TD3 are 116 % of the year to date averag
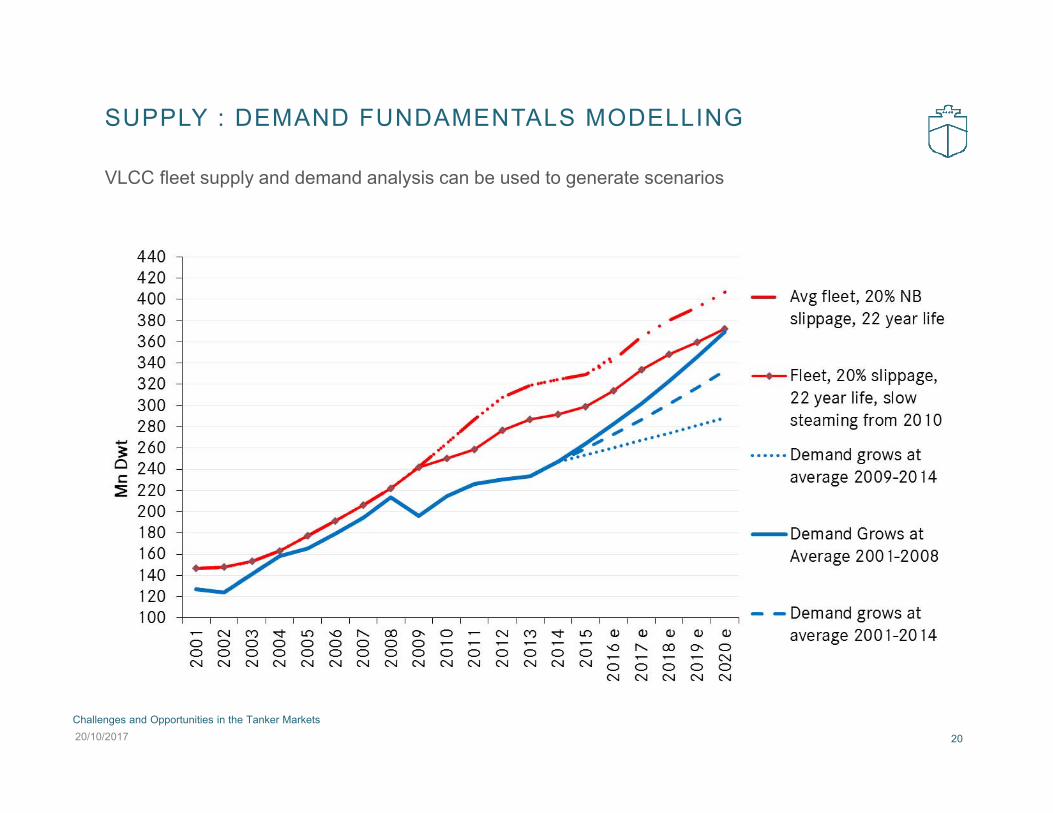
SUPPLY : DEMAND FUNDAMENTALS MODELLING
VLCC fleet supply and demand analysis can be used to generate scenarios
Challenges and Opportunities in the Tanker Markets
2020/10/2017
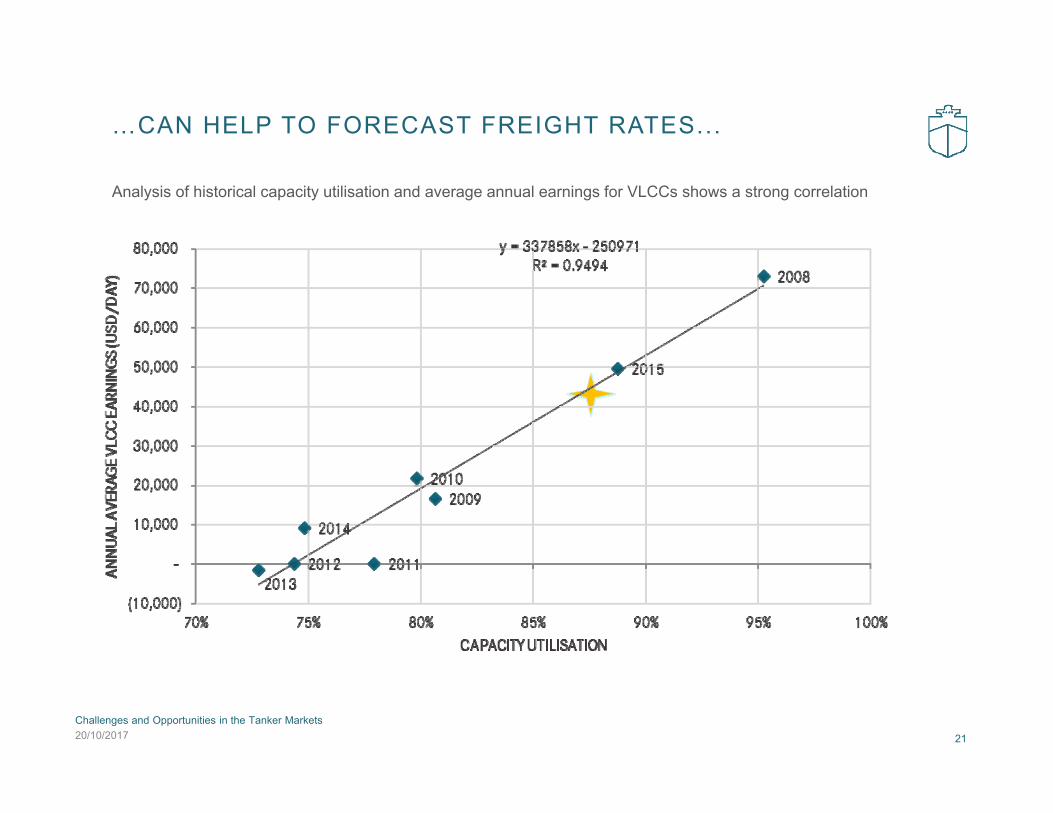
…CAN HELP TO FORECAST FREIGHT RATES...
Analysis of historical capacity utilisation and average annual earnings for VLCCs shows a strong correlation
Challenges and Opportunities in the Tanker Markets
2120/10/2017
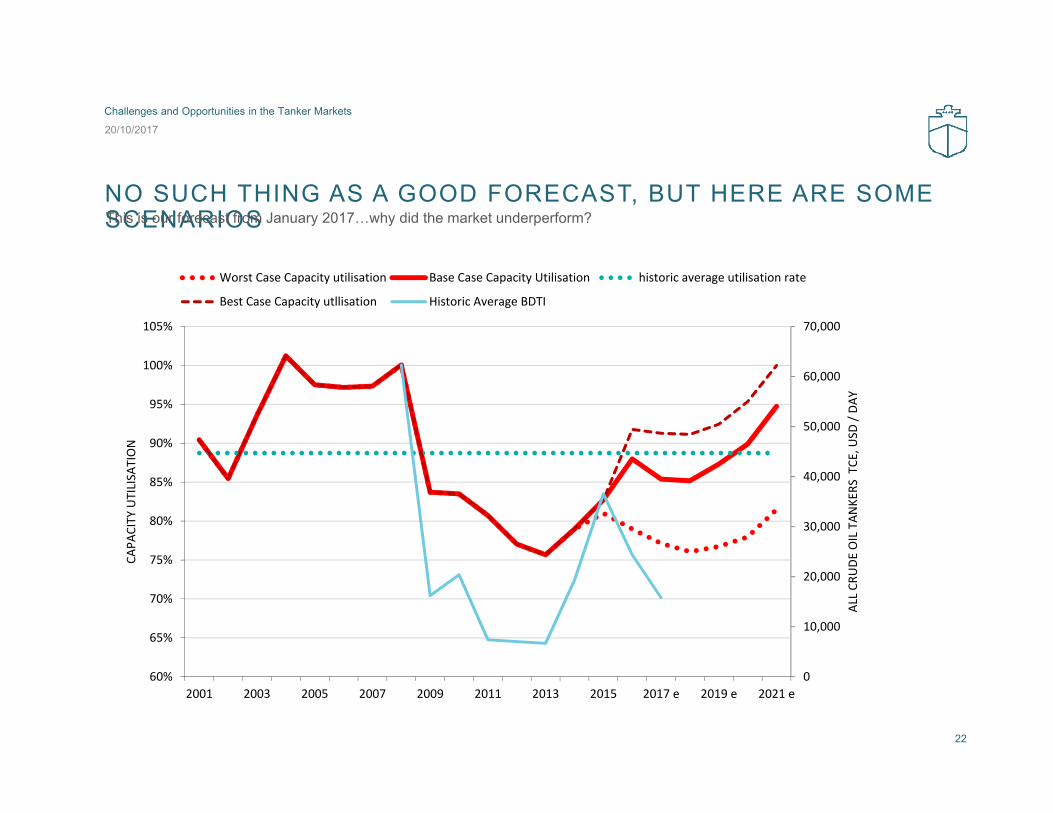
NO SUCH THING AS A GOOD FORECAST, BUT HERE ARE SOME SCENARIOSThis is our forecast from January 2017…why did the market underperform?
20/10/2017
Challenges and Opportunities in the Tanker Markets
22
0
10,000
20,000
30,000
40,000
50,000
60,000
70,000
60%
65%
70%
75%
80%
85%
90%
95%
100%
105%
2001 2003 2005 2007 2009 2011 2013 2015 2017 e 2019 e 2021 e
ALL CR
UDE
OIL TAN
KERS
TCE
, USD
/ DA
Y
CAPA
CITY UTILISA
TION
Worst Case Capacity utilisation Base Case Capacity Utilisation historic average utilisation rate
Best Case Capacity utllisation Historic Average BDTI
20/10/2017
Challenges and Opportunities in the Tanker Markets
23
How will 2018 be compared to 2017?
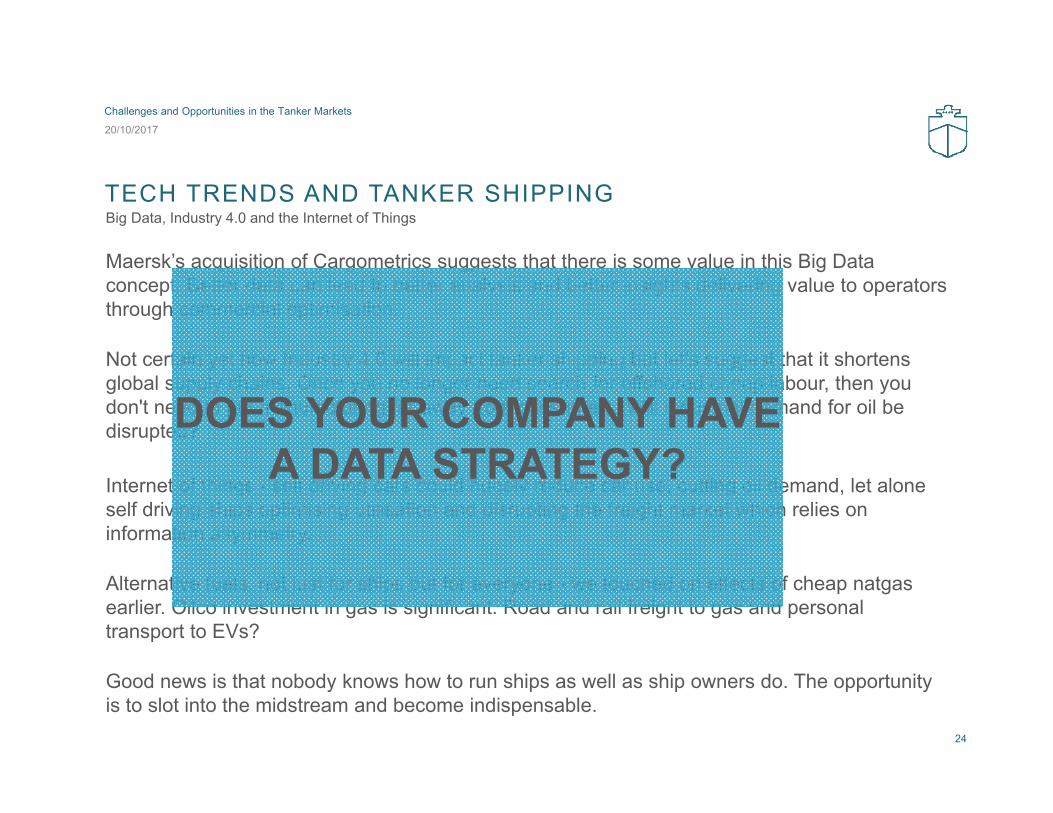
TECH TRENDS AND TANKER SHIPPING
Maersk’s acquisition of Cargometrics suggests that there is some value in this Big Data concept. Better data can lead to better analysis and better insights delivering value to operators through commercial optimisation.
Not certain yet how Industry 4.0 will impact tanker shipping but let's suggest that it shortens global supply chains. Once you no longer need search for offshored cheap labour, then you don't need to put manufacturing far away from consumers. Will industrial demand for oil be disrupted?
Internet of things - self driving cars could hugely reduce car use, cutting oil demand, let alone self driving ships optimising utilisation and disrupting the freight market which relies on information asymmetry.
Alternative fuels, not just for ships but for everyone - we touched on effects of cheap natgasearlier. Oilco investment in gas is significant. Road and rail freight to gas and personal transport to EVs?
Good news is that nobody knows how to run ships as well as ship owners do. The opportunity is to slot into the midstream and become indispensable.
Big Data, Industry 4.0 and the Internet of Things
20/10/2017
Challenges and Opportunities in the Tanker Markets
24
DOES YOUR COMPANY HAVE A DATA STRATEGY?
CONCLUSIONS…UNANSWERABLE QUESTIONS…
What will replace petroleum products for transport, if they can be replaced at all?
Is the unmanned vessel viable? Is it desirable?
How will the rise of renewables and recycling industries affect oil shipping?
Is there any advantage to being the first mover or an early adopter of new shipping technology?
If manufacturing automation negates the need for offshored manufacturing labour, what happens to globalized supply chains?
Can better data mean better supply side discipline?
Who will pay for the next generation of tanker ships, if banks are exiting ship finance?
20/10/2017
Challenges and Opportunities in the Tanker Markets
25
LPG COMMENTS

LPG MARKET OUTLOOK
Global population and incomegrowth are key drivers to thegrowing demand for energy.
Increasing levels of carbonemissions have accelerated theneed for cleaner energy.
LPG is a clean energy sourceused by millions of consumersworldwide.
The boom in shale gas extractionhas increased the supply of LPGwhich is used in a range ofapplications in business, industry,transportation, farming, powergeneration, cooking, heating andfor recreational purposes.
With the world’s populationestimated to increase byapproximately 1.5 Bn people by2035, energy consumption isestimated to increase by 34%between 2014 and 2035.
Growth in the world’s population drives higher consumption of energy
20/10/2017
Challenges and Opportunities in the Tanker Markets
27
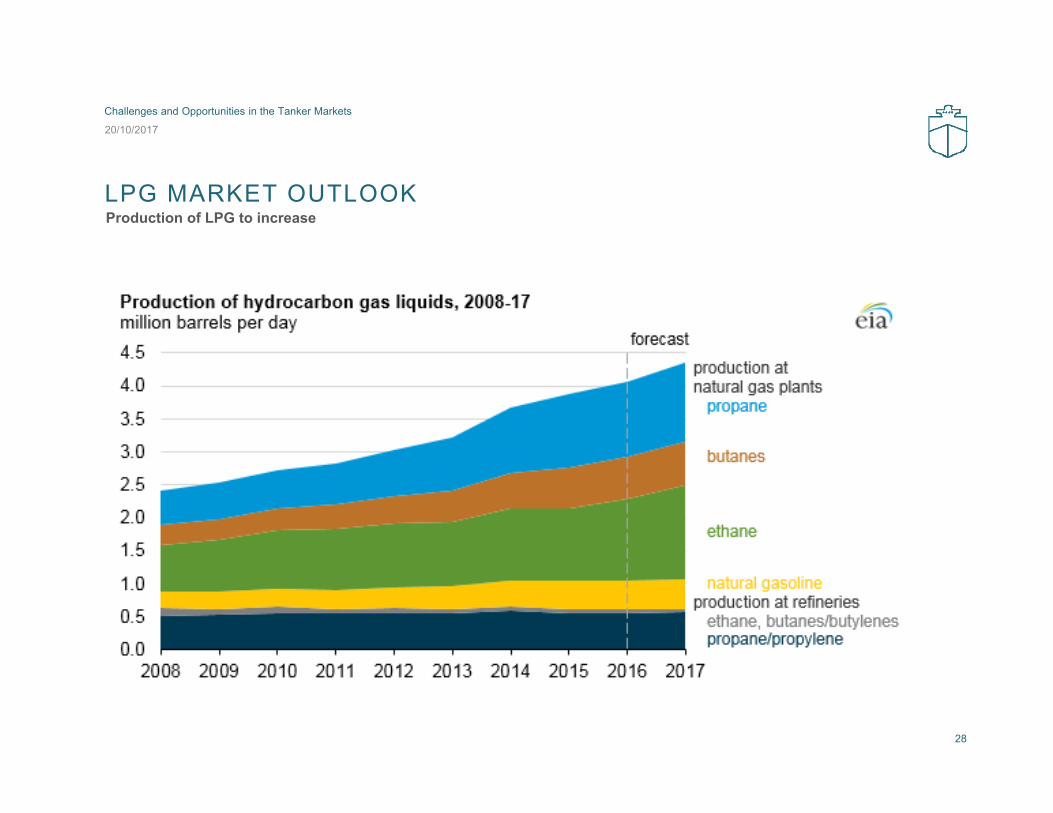
LPG MARKET OUTLOOKProduction of LPG to increase
20/10/2017
Challenges and Opportunities in the Tanker Markets
28

LPG MARKET OUTLOOK
Propane export capacityhas exceeded supplygrowth over the pastseveral years As supply has grown
exports have increased to45 per cent of total supplyin 2016 Propane Exports will
exceed 50 per cent ofsupply by 2019
Growth in the world’s population drives higher consumption of energy
20/10/2017
Challenges and Opportunities in the Tanker Markets
29

LPG IS COST EFFECTIVE AND ABUNDANT
US Propane is cheaper than Brentcrude oil, making it a cost effectivesolution
With the continued stream ofshale gas resources, anestablished supply chain andmarket structures, global LPGconsumption increased by 4% in2016 to 293 million metric tonnes,31% of which is seaborne.
Growth in the world’s population drives higher consumption of energy
20/10/2017
Challenges and Opportunities in the Tanker Markets
30
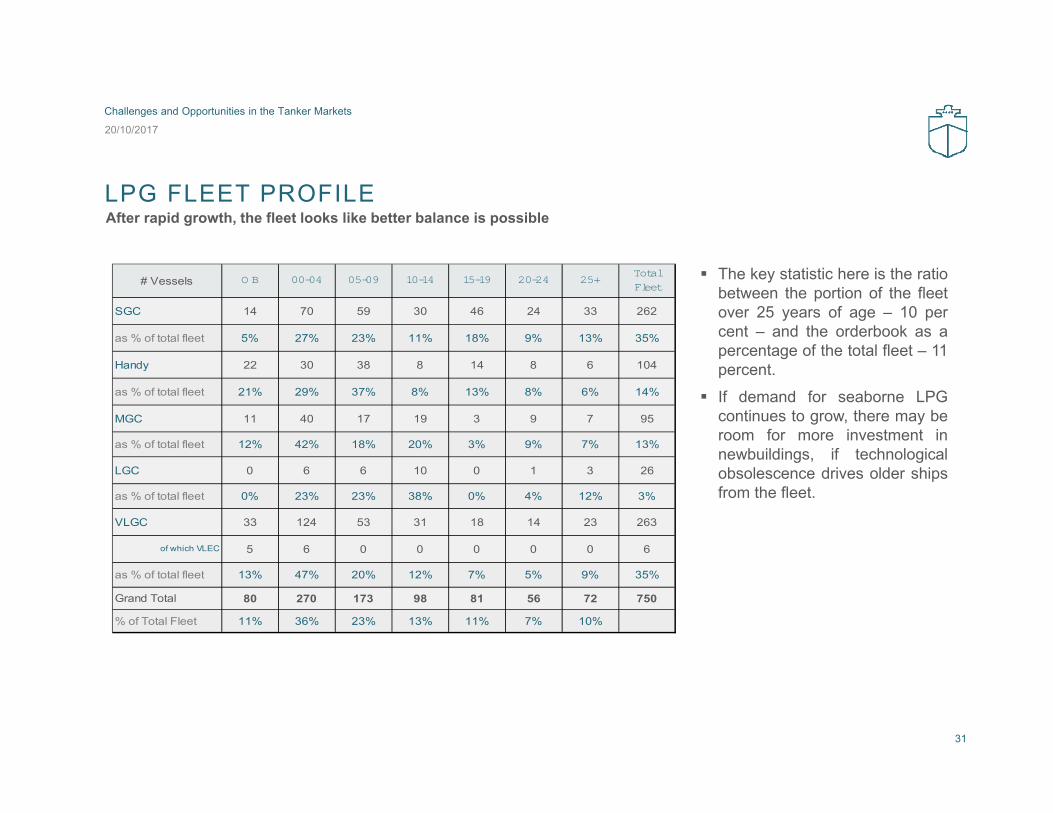
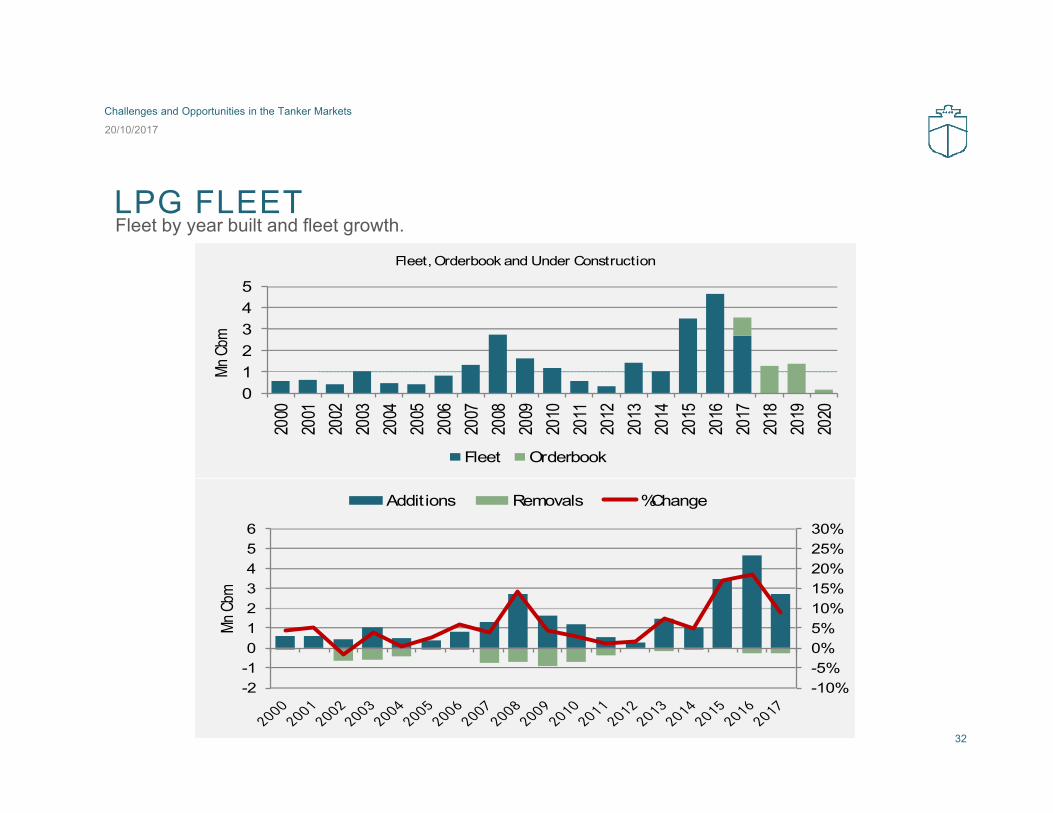
LPG FLEET PROFILE
The key statistic here is the ratiobetween the portion of the fleetover 25 years of age – 10 percent – and the orderbook as apercentage of the total fleet – 11percent.
If demand for seaborne LPGcontinues to grow, there may beroom for more investment innewbuildings, if technologicalobsolescence drives older shipsfrom the fleet.
After rapid growth, the fleet looks like better balance is possible
20/10/2017
Challenges and Opportunities in the Tanker Markets
31
# Vessels O B 00-04 05-09 10-14 15-19 20-24 25+Total Fleet
SGC 14 70 59 30 46 24 33 262
as % of total fleet 5% 27% 23% 11% 18% 9% 13% 35%
Handy 22 30 38 8 14 8 6 104
as % of total fleet 21% 29% 37% 8% 13% 8% 6% 14%
MGC 11 40 17 19 3 9 7 95
as % of total fleet 12% 42% 18% 20% 3% 9% 7% 13%
LGC 0 6 6 10 0 1 3 26
as % of total fleet 0% 23% 23% 38% 0% 4% 12% 3%
VLGC 33 124 53 31 18 14 23 263
of which VLEC 5 6 0 0 0 0 0 6
as % of total fleet 13% 47% 20% 12% 7% 5% 9% 35%
Grand Total 80 270 173 98 81 56 72 750
% of Total Fleet 11% 36% 23% 13% 11% 7% 10%
20/10/2017
Challenges and Opportunities in the Tanker Markets
32
Fleet by year built and fleet growth. LPG FLEET
012345
2000
2001
2002
2003
2004
2005
2006
2007
2008
2009
2010
2011
2012
2013
2014
2015
2016
2017
2018
2019
2020
Mn C
bm
Fleet, Orderbook and Under Construction
Fleet Orderbook
-10%-5%0%5%10%15%20%25%30%
-2-10123456
Mn C
bm
Additions Removals %Change
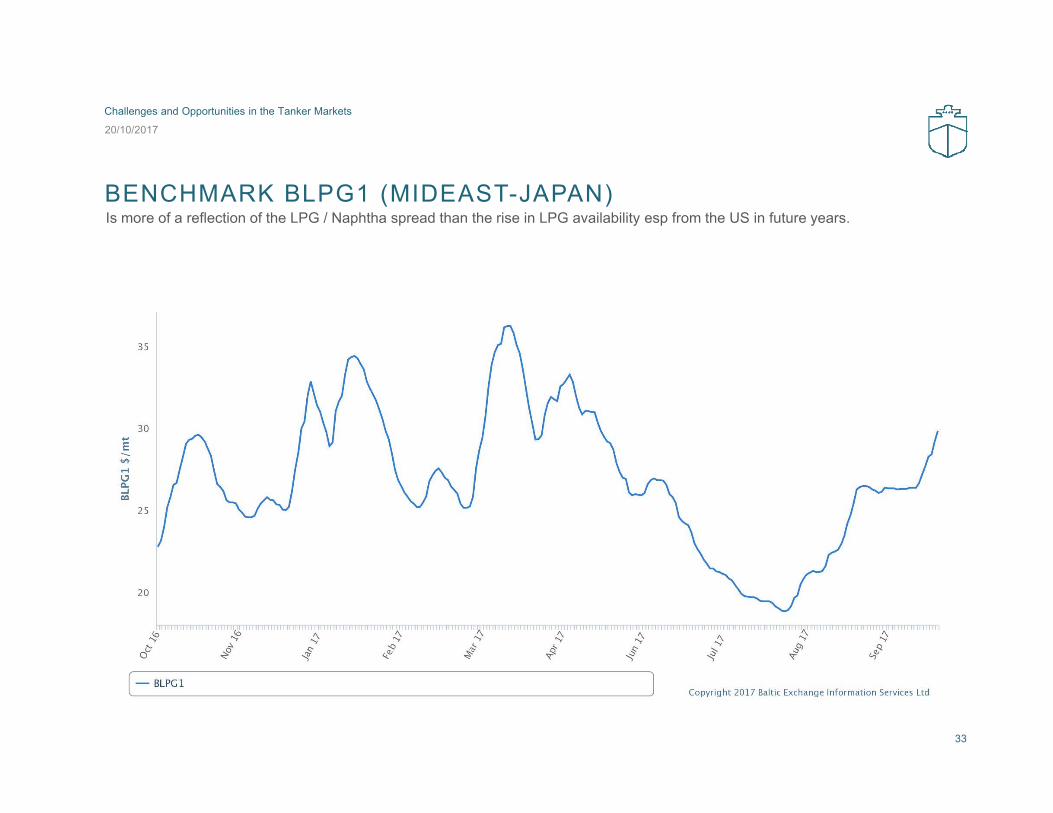
BENCHMARK BLPG1 (MIDEAST-JAPAN) Is more of a reflection of the LPG / Naphtha spread than the rise in LPG availability esp from the US in future years.
20/10/2017
Challenges and Opportunities in the Tanker Markets
33
LNG COMMENTS

In H1 2017 143 Mn T of LNG were exported, up 12% from H1 2016• Australia and the US produced an incremental 12 Mn T (H1-17 vs
H1-16)• This trend is expected to continue with existing trains ramping-up
capacity and new projects (Cameron LNG, Wheatstone LNG)coming online
• Malaysia contributed an additional 1.7 Mn T of supply growth in H12017. Petronas successfully commissioned Train 9 at Bintulu LNGcomplex in Q4 2016 and achieved its first cargo with the PFLNGSatu in March 2017
• LNG production at Trinidad and Tobago’s liquefaction facilitydeclined by 0.6 Mn T compared to the first half 2016. LNGproduction has been shrinking for more than a year due to gasshortages in the country
• Angola LNG continues to ramp up production after the plant’srestart last year. An additional 1.4 Mn T were exported in H1 2017versus H1 2016
US & AUSTRALIA INCREASE LNG EXPORTS
35Source: Affinity, Reuters
+6.8
+5.3+0.3
+3.7-0.5
+0.1
120
130
140
150Mt LNG
Incremental LNG Exports by Region, H1 2017 vs H1 2016 (million tons)
Incremental LNG Exports by Region, H1 2017 vs H1 2016 (million tons)
Incremental LNG Exports by Country, H1 2017 vs H1 2016 (million tons)
-1.1
-0.6
-0.5
-0.4
0.3
0.4
0.5
1.3
1.4
1.7
5.3
6.8
Indonesia
Trinidad
Norway
Brunei
⁞
Papua New Guinea
Equatorial Guinea
Egypt
Nigeria
Angola
Malaysia
United States
Australia
Note: LNG exports do not include re-exports and indigenous exports
+12% +5%
-0.5
+0.6
-1.8
-0.5
-0.4
0.6
0.6
0.7
0.9
1.0
1.2
2.7
4.0
4.3
United Kingdom
Brazil
United Arab Emirates
⁞
Portugal
Pakistan
Italy
France (Northern)
Turkey
Spain
South Korea
Japan
China
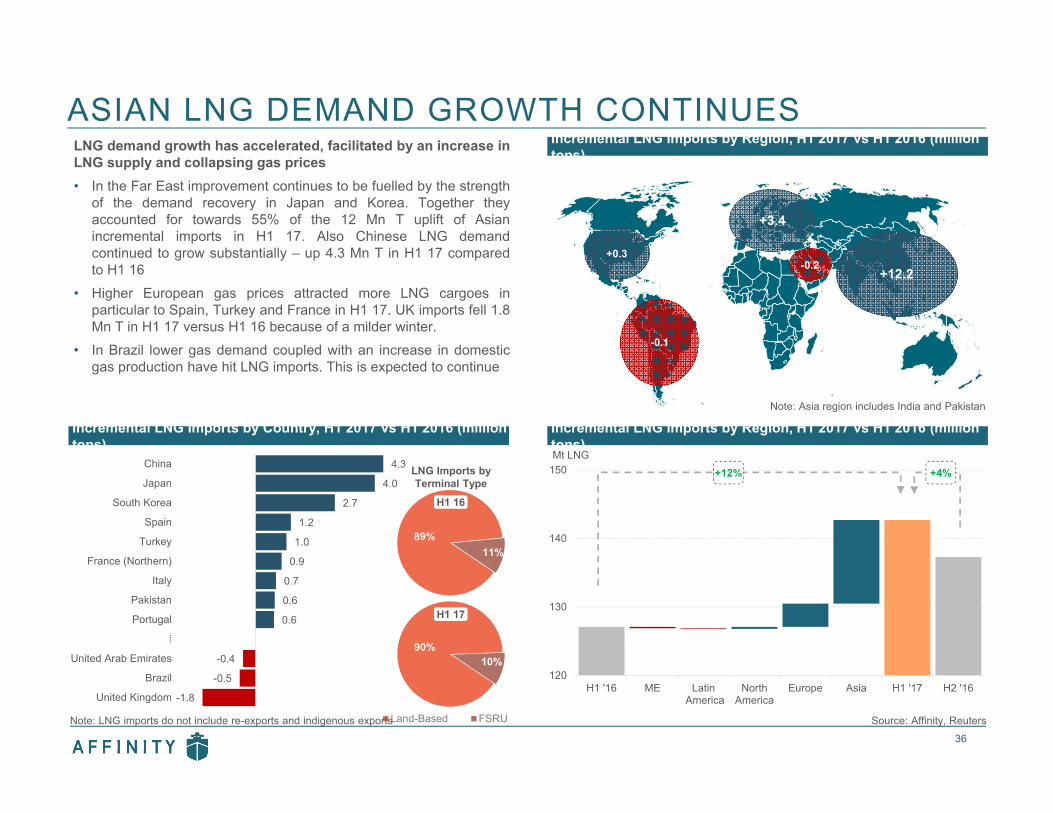
ASIAN LNG DEMAND GROWTH CONTINUES
36Source: Affinity, Reuters
90%10%
Land-Based FSRU
LNG Imports by Terminal Type
89%11%
H1 16
H1 17
Incremental LNG Imports by Region, H1 2017 vs H1 2016 (million tons)
Incremental LNG Imports by Region, H1 2017 vs H1 2016 (million tons)
Incremental LNG Imports by Country, H1 2017 vs H1 2016 (million tons)
LNG demand growth has accelerated, facilitated by an increase inLNG supply and collapsing gas prices• In the Far East improvement continues to be fuelled by the strength
of the demand recovery in Japan and Korea. Together theyaccounted for towards 55% of the 12 Mn T uplift of Asianincremental imports in H1 17. Also Chinese LNG demandcontinued to grow substantially – up 4.3 Mn T in H1 17 comparedto H1 16
• Higher European gas prices attracted more LNG cargoes inparticular to Spain, Turkey and France in H1 17. UK imports fell 1.8Mn T in H1 17 versus H1 16 because of a milder winter.
• In Brazil lower gas demand coupled with an increase in domesticgas production have hit LNG imports. This is expected to continue
120
130
140
150
H1 '16 ME Latin America
NorthAmerica
Europe Asia H1 '17 H2 '16
Mt LNG
+12.2+0.3
-0.2
-0.1
+3.4
Note: LNG imports do not include re-exports and indigenous exports
Note: Asia region includes India and Pakistan
+12% +4%
(150)
(100)
(50)
-
50
100
150
200
250
Q3 Q4 Q1 Q2 Q3 Q4 Q1 Q2 Q3 Q4 Q1 Q2 Q3 Q4 Q1 Q2 Q3 Q4
2017 2018 2019 2020 2021
# Vesselsnormalized to 165m3 Vessel Demand Vessel Supply Shipping Balance
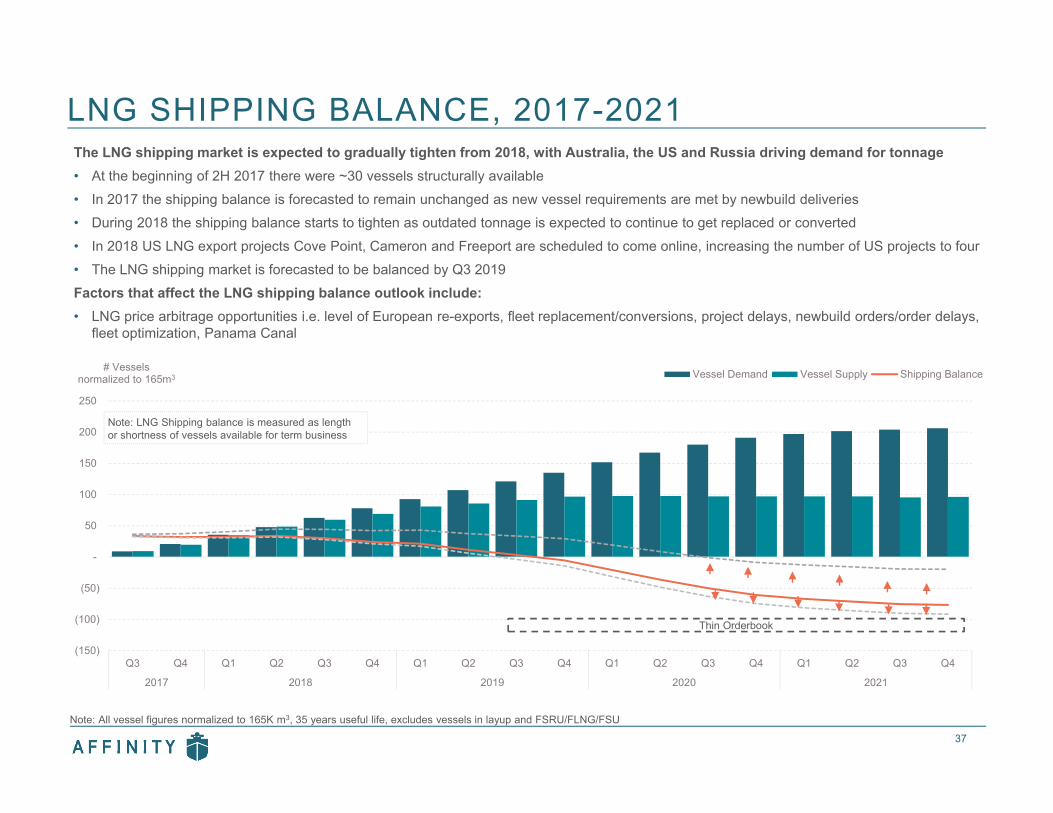
LNG SHIPPING BALANCE, 2017-2021
37
Note: LNG Shipping balance is measured as length or shortness of vessels available for term business
Note: All vessel figures normalized to 165K m3, 35 years useful life, excludes vessels in layup and FSRU/FLNG/FSU
Thin Orderbook
The LNG shipping market is expected to gradually tighten from 2018, with Australia, the US and Russia driving demand for tonnage• At the beginning of 2H 2017 there were ~30 vessels structurally available• In 2017 the shipping balance is forecasted to remain unchanged as new vessel requirements are met by newbuild deliveries• During 2018 the shipping balance starts to tighten as outdated tonnage is expected to continue to get replaced or converted• In 2018 US LNG export projects Cove Point, Cameron and Freeport are scheduled to come online, increasing the number of US projects to four• The LNG shipping market is forecasted to be balanced by Q3 2019Factors that affect the LNG shipping balance outlook include:• LNG price arbitrage opportunities i.e. level of European re-exports, fleet replacement/conversions, project delays, newbuild orders/order delays,
fleet optimization, Panama Canal
-
20
40
60
80
100
120
140
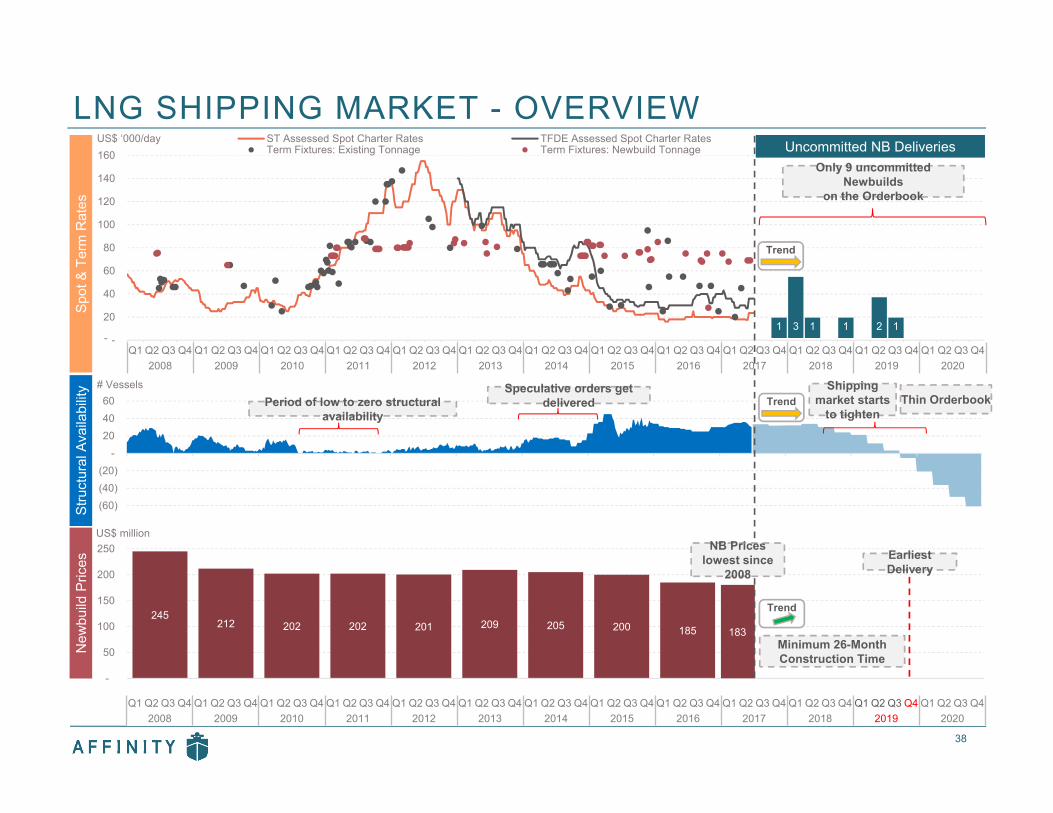
160US$ ‘000/day ST Assessed Spot Charter Rates TFDE Assessed Spot Charter Rates
Term Fixtures: Existing Tonnage Term Fixtures: Newbuild Tonnage
LNG SHIPPING MARKET - OVERVIEW
38
(60) (40) (20)
- 20 40 60
Jan-08 Jan-09 Jan-10 Jan-11 Jan-12 Jan-13 Jan-14 Jan-15 Jan-16 Jan-17 Jan-18 Jan-19 Jan-20
# VesselsPeriod of low to zero structural
availability
Speculative orders get delivered Thin Orderbook
245212 202 202 201 209 205 200 185
-
50
100
150
200
250US$ million
Minimum 26-Month Construction Time
New
build
Pric
esSt
ruct
ural
Ava
ilabi
lity
Spot
& T
erm
Rat
es
Uncommitted NB Deliveries
1 3 1 1 2 1 -
Q1 Q2 Q3 Q4 Q1 Q2 Q3 Q4 Q1 Q2 Q3 Q4 Q1 Q2 Q3 Q4 Q1 Q2 Q3 Q4 Q1 Q2 Q3 Q4 Q1 Q2 Q3 Q4 Q1 Q2 Q3 Q4 Q1 Q2 Q3 Q4 Q1 Q2 Q3 Q4 Q1 Q2 Q3 Q4 Q1 Q2 Q3 Q4 Q1 Q2 Q3 Q42008 2009 2010 2011 2012 2013 2014 2015 2016 2017 2018 2019 2020
Q1 Q2 Q3 Q4 Q1 Q2 Q3 Q4 Q1 Q2 Q3 Q4 Q1 Q2 Q3 Q4 Q1 Q2 Q3 Q4 Q1 Q2 Q3 Q4 Q1 Q2 Q3 Q4 Q1 Q2 Q3 Q4 Q1 Q2 Q3 Q4 Q1 Q2 Q3 Q4 Q1 Q2 Q3 Q4 Q1 Q2 Q3 Q4 Q1 Q2 Q3 Q42008 2009 2010 2011 2012 2013 2014 2015 2016 2017 2018 2019 2020
Earliest Delivery
Only 9 uncommitted Newbuilds
on the Orderbook
Shipping market starts
to tighten
183
NB Prices lowest since
2008
Trend
Trend
Trend
DISCLAIMERThe information contained within this report is given in good faith based on the current market situation at the time of preparing this report and as such is specific to that point only. While all reasonable care has been taken in the preparation and collation of information in this report Affinity (Shipping) LLP (and all associated and affiliated companies) does not accept any liability whatsoever for any errors of fact or opinion based on such facts.Some industry information relating to the shipping industry can be difficult to find or establish. Some data may not be available and may need to be estimated or assessed and where such data may be limited or unavailable subjective assessment may have to be used.No market analysis can guarantee accuracy. The usual fundamentals may not always govern the markets, for example psychology, market cycles and external events (such as acts of god or developments in future technologies) could cause markets to depart from their natural/usual course. Such
external events have not been considered as part of this analysis. Historical market behaviour does not predict future market behaviour and shipping is an inherently high risk business. You should therefore consider a variety of information and potential outcomes when making decisions based on the information contained in this report.All information provided by Affinity (Shipping) LLP is without any guarantee whatsoever. Affinity (Shipping) LLP or any of its subsidiaries or affiliates will not be liable for any consequences thereof.This report is intended solely for the information of the email recipient account and must not be passed or divulged to any third parties whatsoever without the written permission of Affinity (Shipping) LLP. Affinity (Shipping) LLP accepts no liability to any third parties whatsoever. If permission is granted, you must disclose the full report including all disclaimers, and not selected excerpts which may be taken out of context.
© 2017 Affinity Research LLPAffinity Research London
T. +44 20 3142 0100E. [email protected]
20/10/2017
Challenges and Opportunities in the Tanker Markets
39
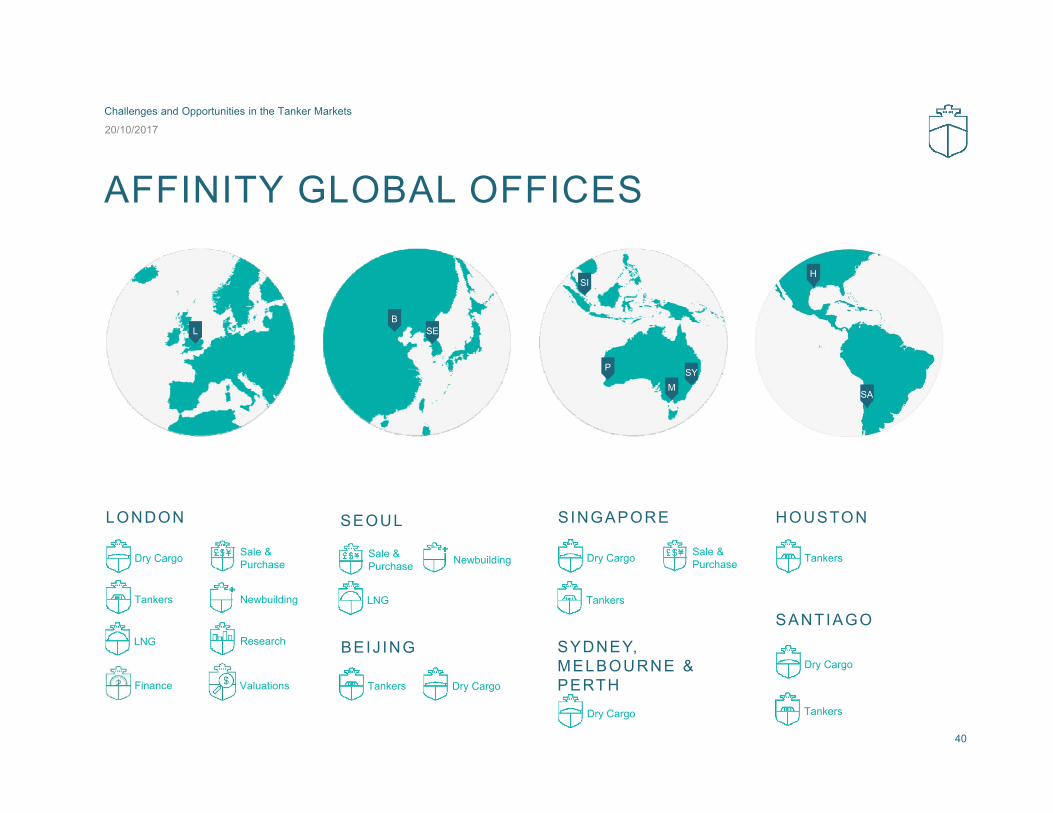
AFFINITY GLOBAL OFFICES
40
LONDON
H
SYM
P
Dry Cargo
Tankers LNG
Sale & Purchase
Newbuilding
Research
SEOUL
Sale & Purchase Newbuilding
S INGAPORE
Dry Cargo Sale & Purchase
SYDNEY, MELBOURNE & PERTH
Dry Cargo
HOUSTON
Tankers
SI
BEIJ ING
Tankers Dry Cargo
LNG
Finance Valuations
Tankers
LB
SE
SANTIAGO
Dry Cargo
Tankers
SA
H
20/10/2017
Challenges and Opportunities in the Tanker Markets


