Challenges and Opportunities of Membrane Bioelectrochemical Reactors for Wastewater Treatment Jian Li Dissertation submitted to the faculty of the Virginia Polytechnic Institute and State University in partial fulfillment of the requirements for the degree of Doctor of Philosophy In Civil Engineering Zhen He, Chair Gregory D. Boardman Zhiwu Wang Francine Battaglia March 23, 2016 Blacksburg, VA Keywords: Microbial fuel cells, Wastewater, Energy recovery, Fouling, Optimization
Transcript
Challenges and Opportunities of Membrane Bioelectrochemical
Reactors for Wastewater Treatment
Jian Li
Dissertation submitted to the faculty of the Virginia Polytechnic Institute and
State University in partial fulfillment of the requirements for the degree of
Doctor of Philosophy
In
Civil Engineering
Zhen He, Chair
Gregory D. Boardman
Zhiwu Wang
Francine Battaglia
March 23, 2016
Blacksburg, VA
Keywords: Microbial fuel cells, Wastewater, Energy recovery, Fouling,
Optimization
Challenges and Opportunities of Membrane Bioelectrochemical
Reactors for Wastewater Treatment
Jian Li
ABSTRACT
Microbial fuel cells (MFCs) are potentially advantageous as an energy-efficient approach
for wastewater treatment. Integrating membrane filtration with MFCs could be a viable
option for advanced wastewater treatment with a low energy input. Such an integration is
termed as membrane bioelectrochemical reactors (MBERs). Comparing to the
conventional membrane bioreactors or anaerobic membrane bioreactors, MBER could be
a competitive technology, due to the its advantages on energy consumption and nutrients
removal. By installing the membrane in the cathodic compartment or applying granular
activated carbon as fluidized bed materials, membrane fouling issue could be alleviated
significantly. In order to drive MBER technology to become a more versatile platform,
applying anion exchange membrane (AEM) could be an option for nutrients removal in
MBERs. Wastewater can be reclaimed and reused for subsequent fermentation use after a
series MFC-MBR treatment process. Such a synergistic configuration not only provide a
solution for sustainable wastewater treatment, but also save water and chemical usage from
other non-renewable resource. Integrating membrane process with microbial fuel cells
through an external configuration provides another solution on sustainable wastewater
treatment through a minimal maintenance requirement.
iii
ABSTRACT (GENERAL AUDIENCE)
Water is prerequisite to all living organisms. Anthropic activities produce a significant
amount of waste every day, certainly including household wastewater. A proper
wastewater treatment is a key to sustainable societal development, and this aim can be
accomplished by microbial fuel cells (MFCs) technologies. In MFCs, organics in the
wastewater are degraded, and the produced bioelectrical energy is harvested through
external circuit. Comparing to the conventional wastewater treatment process, MFC offers
several advantages, such as less sludge production, operational flexibility, and energy
recovery. To optimize MFC system, integrating membrane separation process with MFC,
which is termed as membrane bioelectrochemical reactors (MBERs), can produce a high
quality effluent with a minimal footprint requirement and energy input. Such an integrated
system can effectively remove organic contaminants, accomplish solid and liquid
separation, and achieve wastewater reclamation. Therefore, the MBER system can be
applied as a decentralized treatment system to remote area residents, who may not have
fully developed sanitation system yet. Besides the organic contaminants, nutrients
compounds, such as nitrogen and phosphorus, can be controlled by using a two chamber
MBER system with anion exchange membrane as a separator material. To sum up,
integrating MFC with membrane separation process has been considered as a next
generation advanced wastewater treatment in a sustainable way.
iv
ACKNOWLEDGEMENTS
The pathway of earning doctorate degree is a long and struggling process. First and
foremost, thank GOD ALMIGHTY for the wisdom he bestowed upon me, the strength,
peace of my mind and good health to finish this research.
I would certainly thank Dr. Zhen (Jason) He, my major advisor during my Ph. D training
process. Without his help, advice, expertise, and encouragements, this research and
dissertation would not have happened. Thanks for offering me such a good opportunity of
doing interesting research in microbial fuel cells, membrane filtration, and other fantastic
water and wastewater treatment technologies. By working with Dr. He in these four years,
my interest on environmental engineering, especially on water/wastewater nexus energy
has been stimulated significantly. I would also like to thank other members of my
dissertation committee: Drs. Gregory D Boardman, Zhiwu (Drew) Wang and Francine
Battaglia. Their insight, advice and feedback helps me a lot on my dissertation writing.
I would also like to thank Gannett Fleming. Inc and National Science Foundation (NSF)
grant (#1358145) to financially support my research. I would also thank all of EBBL
members for their support and assistance during my Ph. D study, and special thanks for Dr.
Zheng Ge.
I would also like to thank my family members and my girlfriend, Dr. Shi. Without their
constant support, encouragement and understanding, it would not have been possible for
me to achieve my goal. I wish there was room on my diploma to write down their names.
v
CONTENTS
ABSTRACT ........................................................................................................................ ii
ABSTRACT (GENERAL AUDIENCE) ........................................................................... iii
ACKNOWLEDGEMENTS ............................................................................................... iv
CONTENTS ........................................................................................................................ v
ATTRIBUTION ................................................................................................................. ix
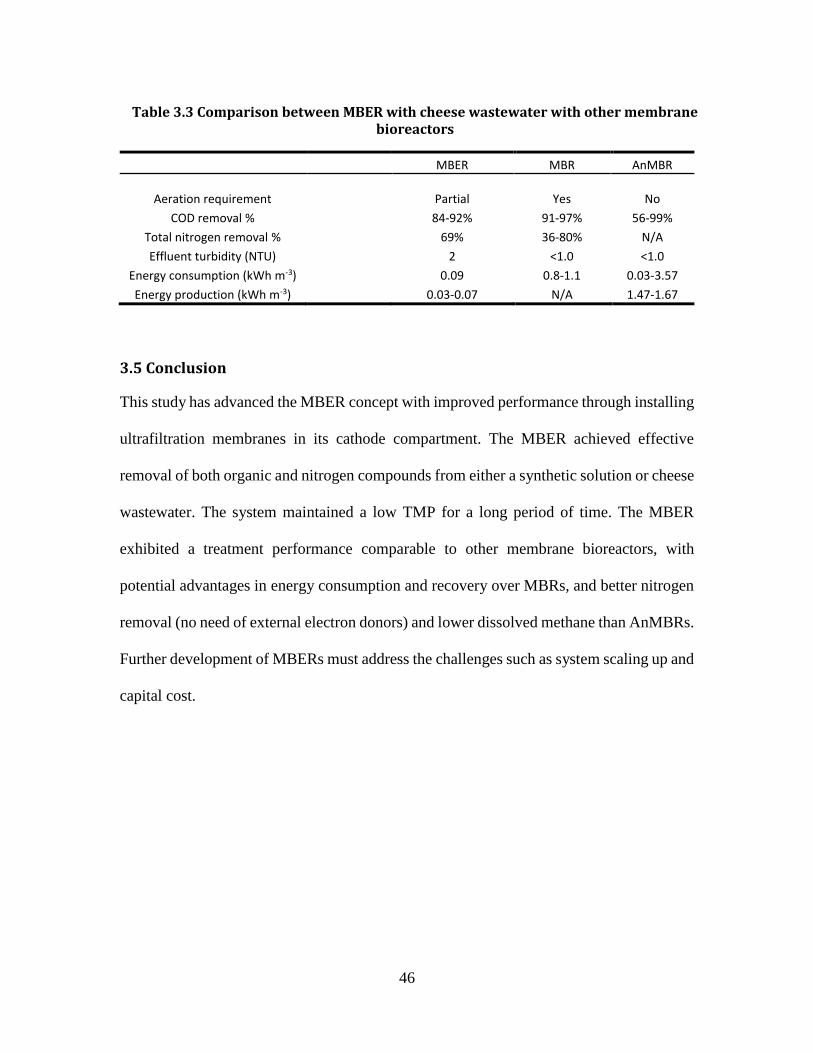
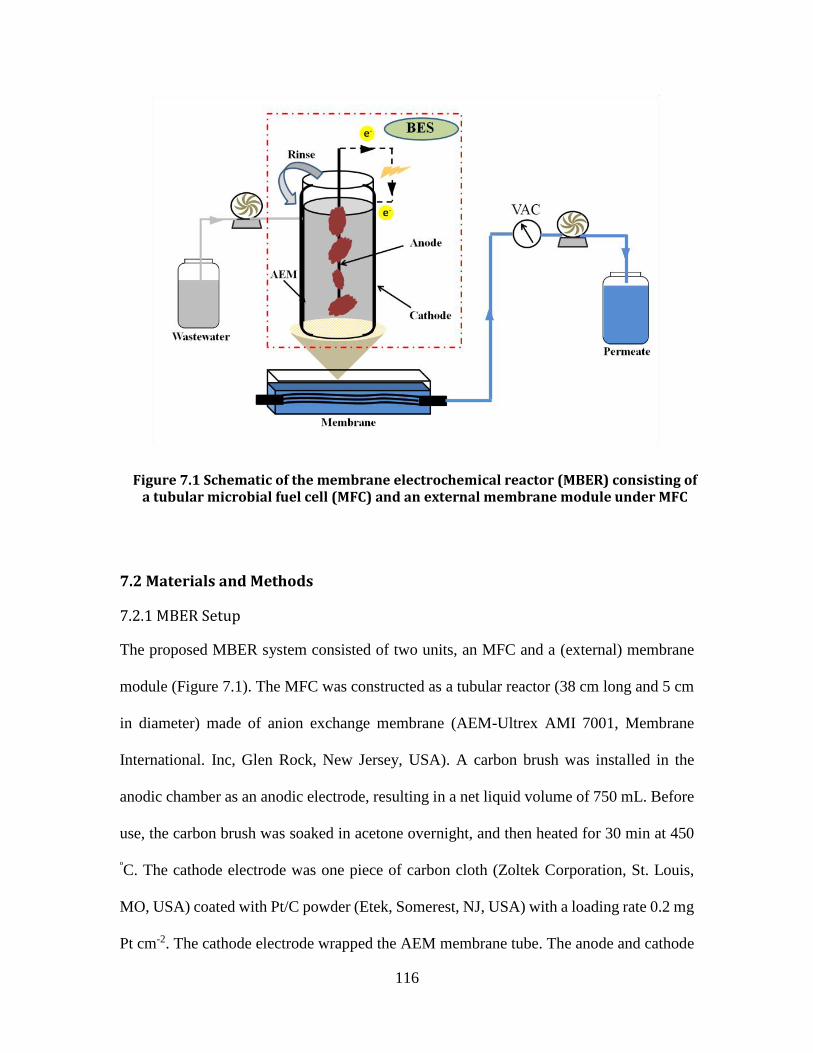
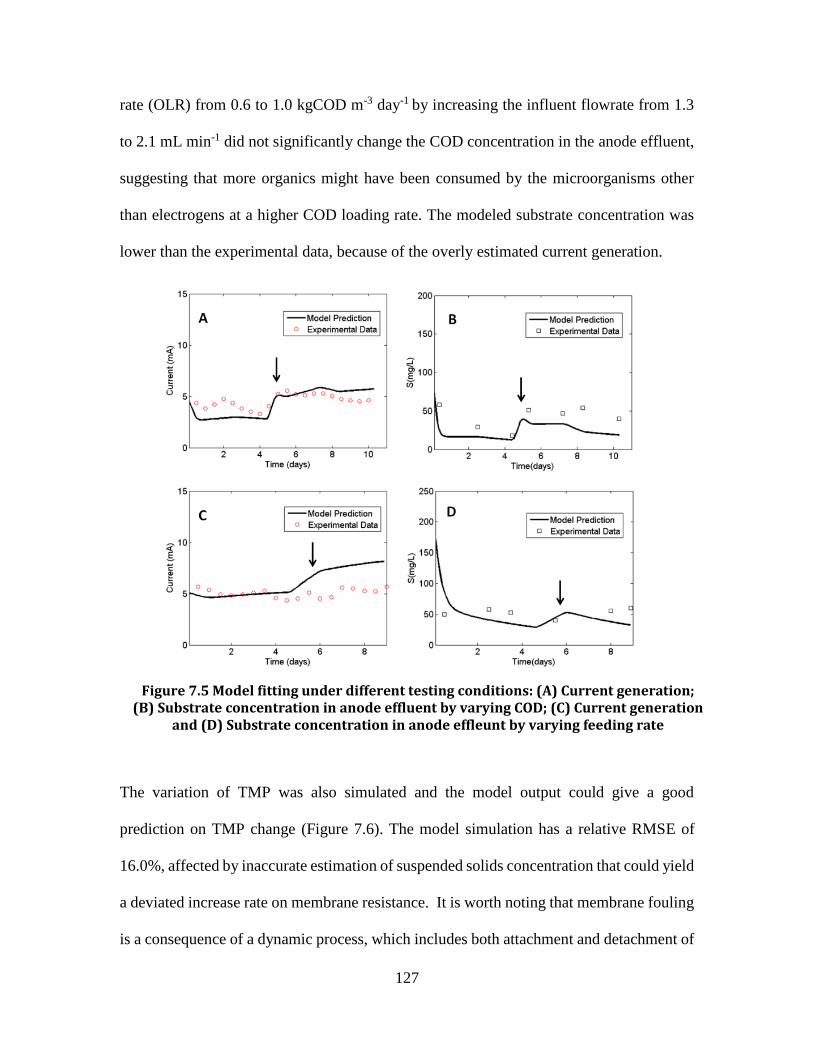
(TMP) was recorded manually and the average value was reported in this study. Turbidity
was measured using a turbidimeter (DRT 100B, HF Scientific, Inc, Fort Meyers, FL, USA).
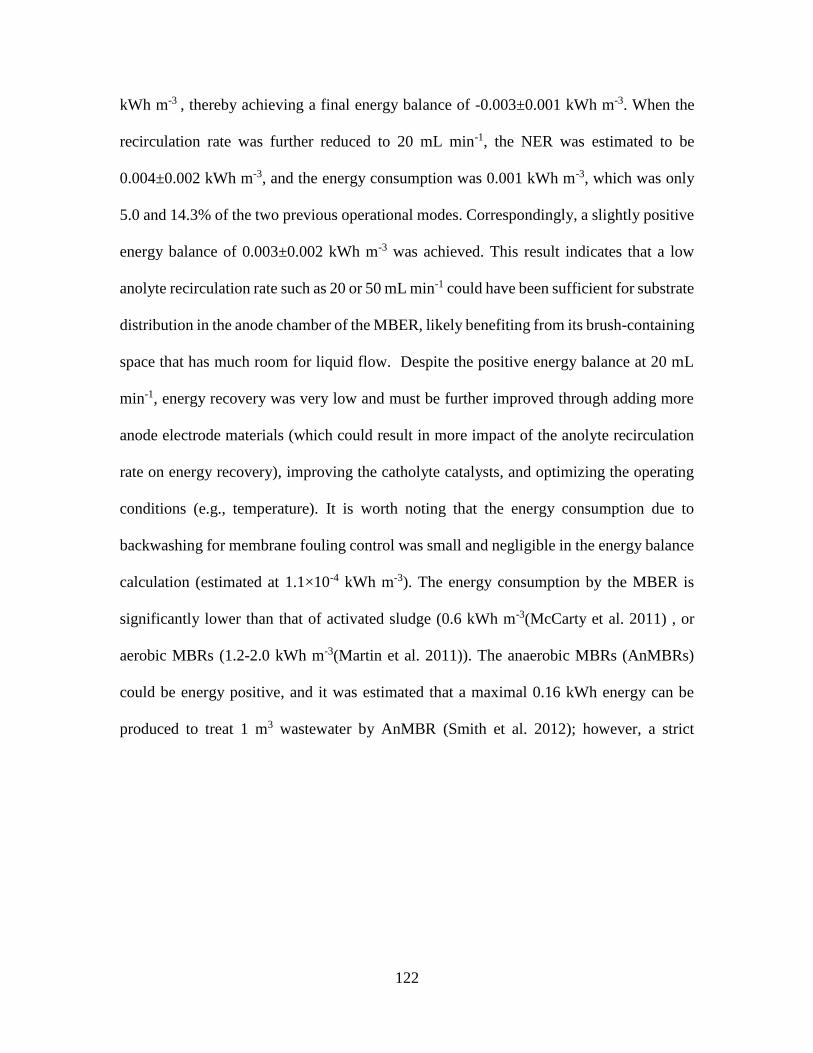
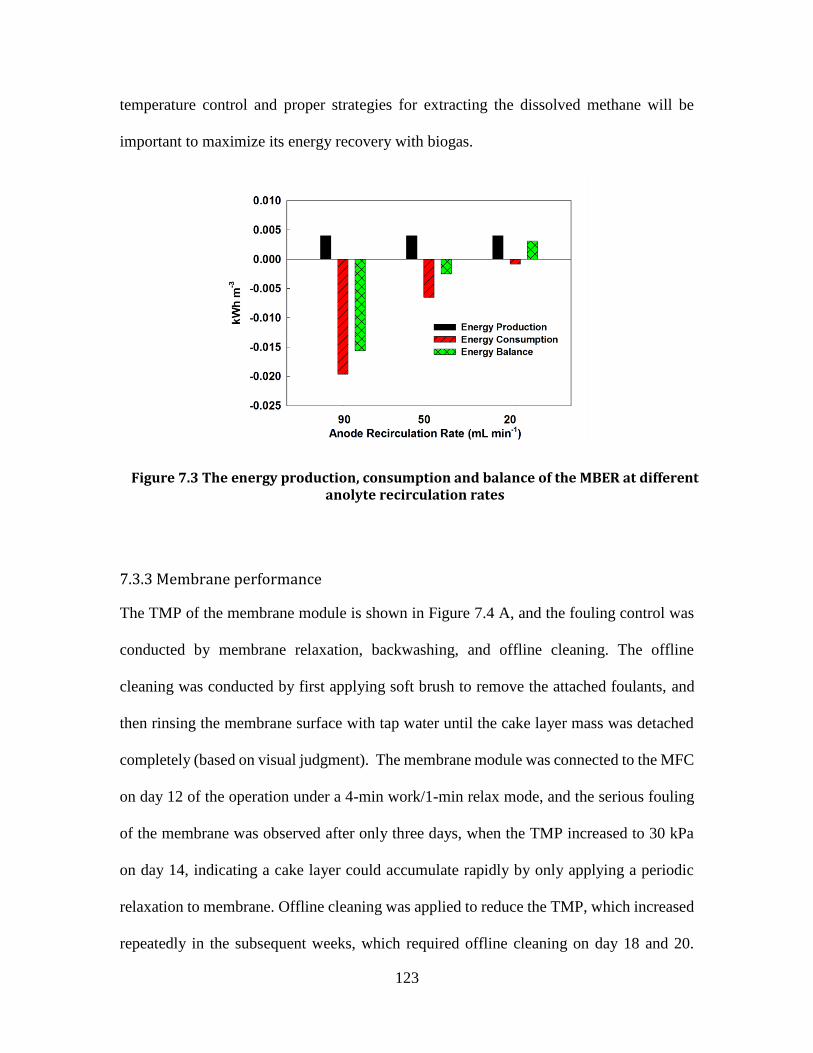
Energy consumption by the MBER came from two parts, pumping system and aeration.
53
The estimation of energy consumption by the pumping system (for feeding, recirculating
and membrane extraction) was calculated by the following equation (Kim et al. 2011): The
energy by aeration was estimated according to a previous study (Zhang et al. 2013a). The
data of energy consumption were expressed based on the volume of treated wastewater
(kWh m-3), the removed organics (kWh kgCOD-1) (Xiao et al. 2014), and the removed
nitrogen (kWh kg N-1) .
4.3 Results and Discussion
4.3.1 MBER fed with Synthetic Solution
4.3.1.1 Electricity generation
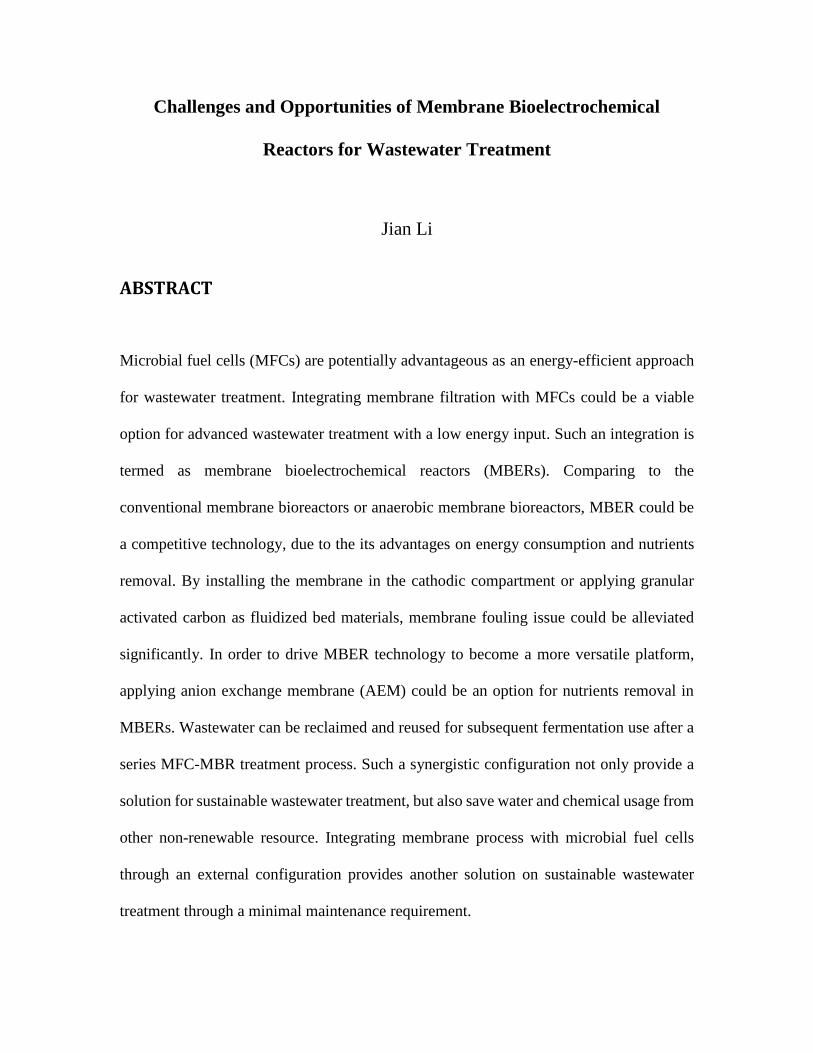
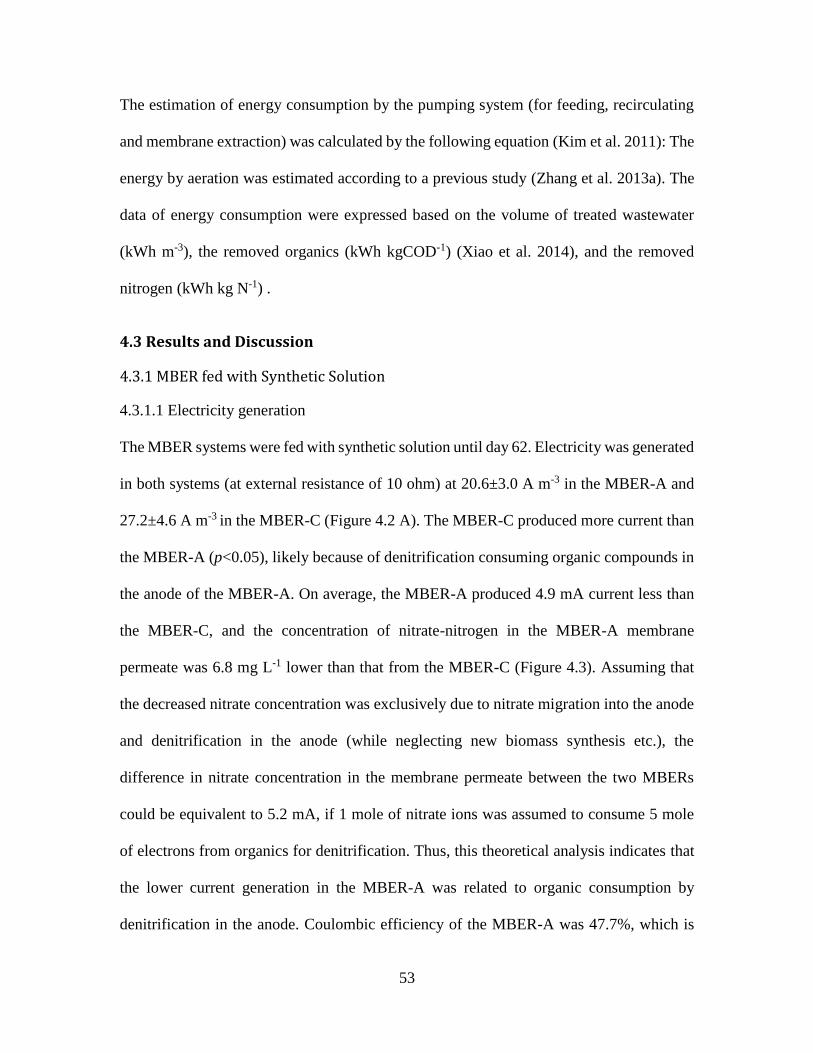
The MBER systems were fed with synthetic solution until day 62. Electricity was generated
in both systems (at external resistance of 10 ohm) at 20.6±3.0 A m-3 in the MBER-A and
27.2±4.6 A m-3 in the MBER-C (Figure 4.2 A). The MBER-C produced more current than
the MBER-A (p<0.05), likely because of denitrification consuming organic compounds in
the anode of the MBER-A. On average, the MBER-A produced 4.9 mA current less than
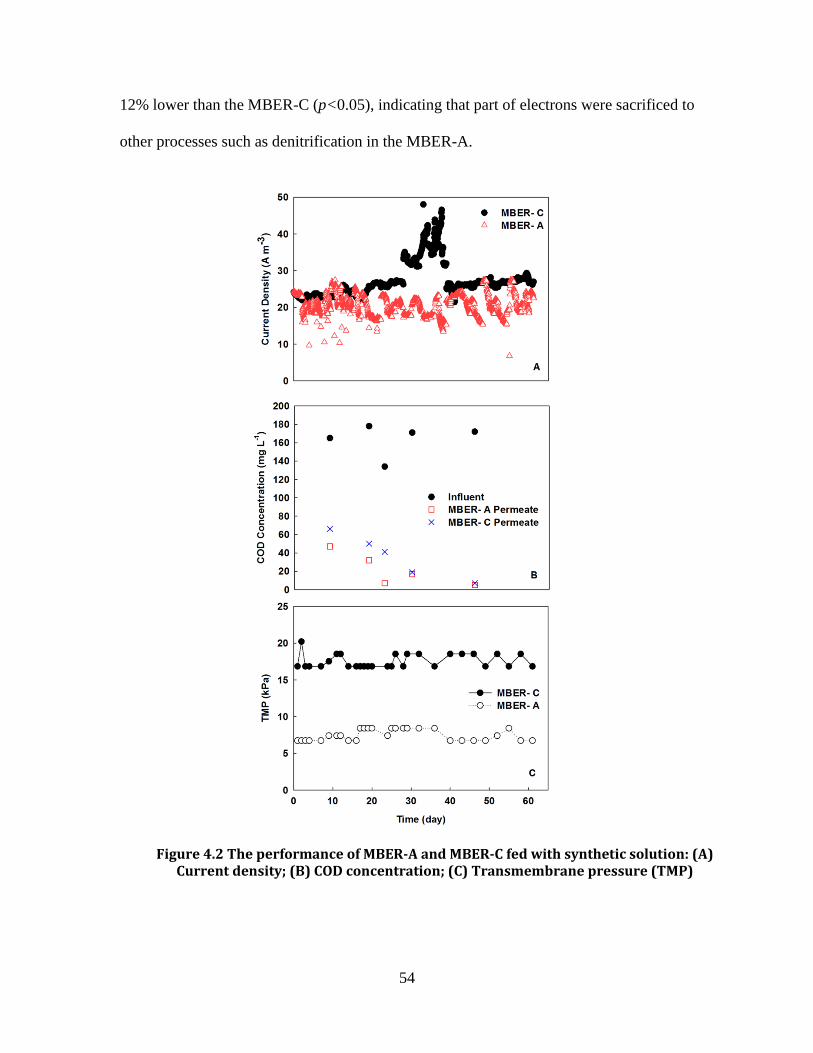
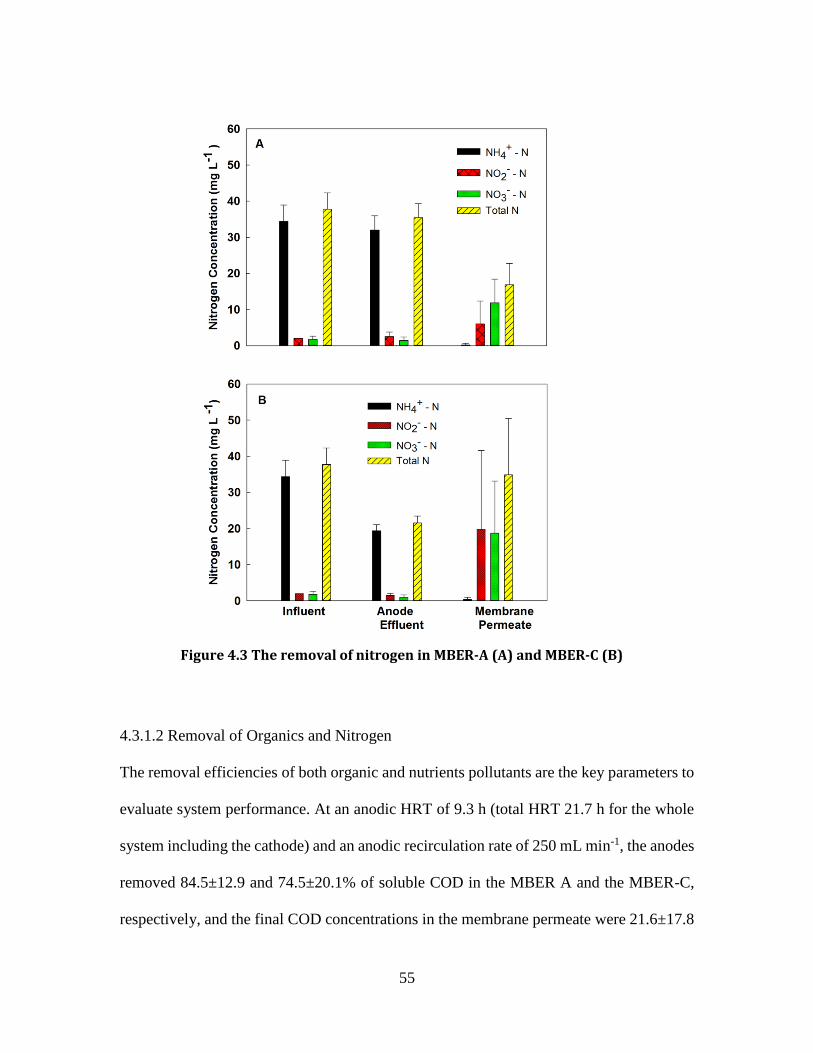
the MBER-C, and the concentration of nitrate-nitrogen in the MBER-A membrane
permeate was 6.8 mg L-1 lower than that from the MBER-C (Figure 4.3). Assuming that
the decreased nitrate concentration was exclusively due to nitrate migration into the anode
and denitrification in the anode (while neglecting new biomass synthesis etc.), the
difference in nitrate concentration in the membrane permeate between the two MBERs
could be equivalent to 5.2 mA, if 1 mole of nitrate ions was assumed to consume 5 mole
of electrons from organics for denitrification. Thus, this theoretical analysis indicates that
the lower current generation in the MBER-A was related to organic consumption by
denitrification in the anode. Coulombic efficiency of the MBER-A was 47.7%, which is
54
12% lower than the MBER-C (p<0.05), indicating that part of electrons were sacrificed to
other processes such as denitrification in the MBER-A.
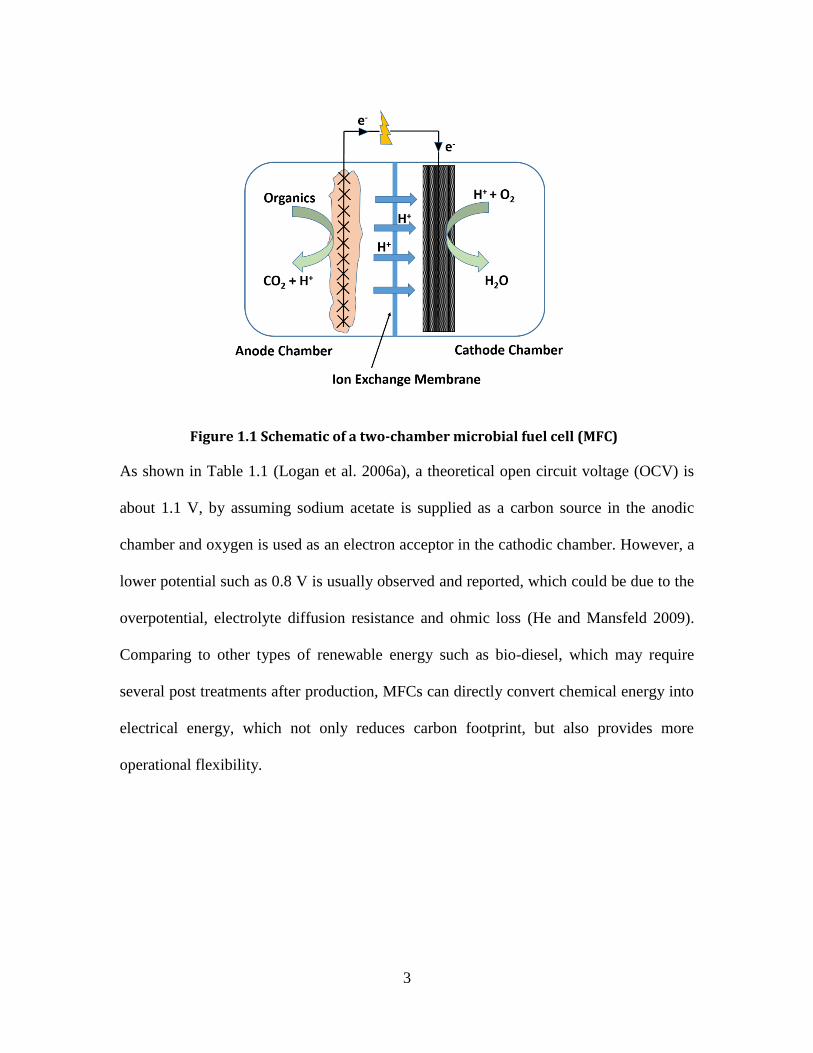
Figure 4.2 The performance of MBER-A and MBER-C fed with synthetic solution: (A) Current density; (B) COD concentration; (C) Transmembrane pressure (TMP)
55
4.3.1.2 Removal of Organics and Nitrogen
The removal efficiencies of both organic and nutrients pollutants are the key parameters to
evaluate system performance. At an anodic HRT of 9.3 h (total HRT 21.7 h for the whole
system including the cathode) and an anodic recirculation rate of 250 mL min-1, the anodes
removed 84.5±12.9 and 74.5±20.1% of soluble COD in the MBER A and the MBER-C,
respectively, and the final COD concentrations in the membrane permeate were 21.6±17.8
Figure 4.3 The removal of nitrogen in MBER-A (A) and MBER-C (B)
56
(MBER-A) and 36.6±23.7 mg L-1 (MBER-C) (Figure 4.2 B). Although both systems
achieved more than 99% removal of ammonium nitrogen because of nitrification in the
aerobic cathode, the removal efficiency of total inorganic nitrogen (ammonia + nitrite +
nitrate) was significantly different. The MBER-A removed 56.9% of total inorganic
nitrogen, while the MBER-C removed only 7.6% (Figure 4.3). The difference was mainly
due to nitrate and nitrite remained in the final effluent: there was 18.7 mg L-1 of nitrate-
nitrogen and 19.8 mg L-1 of nitrite-nitrogen in the MBER-C membrane permeate, much
higher than 11.9 mg L-1 of nitrate-nitrogen and 6.0 mg L-1 of nitrite-nitrogen in the MBER-
A membrane permeate (Figure 4.3). Those results have demonstrated that the use of AEM
in an MBER can significantly improve the removal efficiency of total inorganic nitrogen.
4.3.1.3 Membrane Performance
Membrane fouling is a key factor that affects the operation of membrane-based treatment
system, and transmembrane pressure (TMP) is usually used to monitor membrane fouling.
The operating TMP of the hollow-fiber membranes used in this study is below 35 kPa, as
suggested by the membrane manufacturer. Fed with synthetic solution, both MBERs
maintained a low TMP, less than 10 kPa in the MBER-A and varying between 15 and 20
kPa in the MBER-A (Figure 4.2 C). There was no physical or chemical cleaning applied to
those MBERs during this period. The low TMP could be resulted from two aspects: (1) the
anode removed most organic compounds and low remaining organics resulted in low
microbial contamination of the hollow-fiber membranes; and (2) aeration in the cathode
might alleviate membrane fouling.
57
4.3.2 MBER fed with Primary Effluent (actual wastewater)
Because the MBER-A demonstrated superior performance in improved nitrogen removal,
the following sections report the performance of the MBER-A only fed with actual
wastewater (primary effluent) from day 62 to 200.
4.3.2.1 Electricity Generation
With feeding the actual wastewater, the MBER-A generated much lower current than that
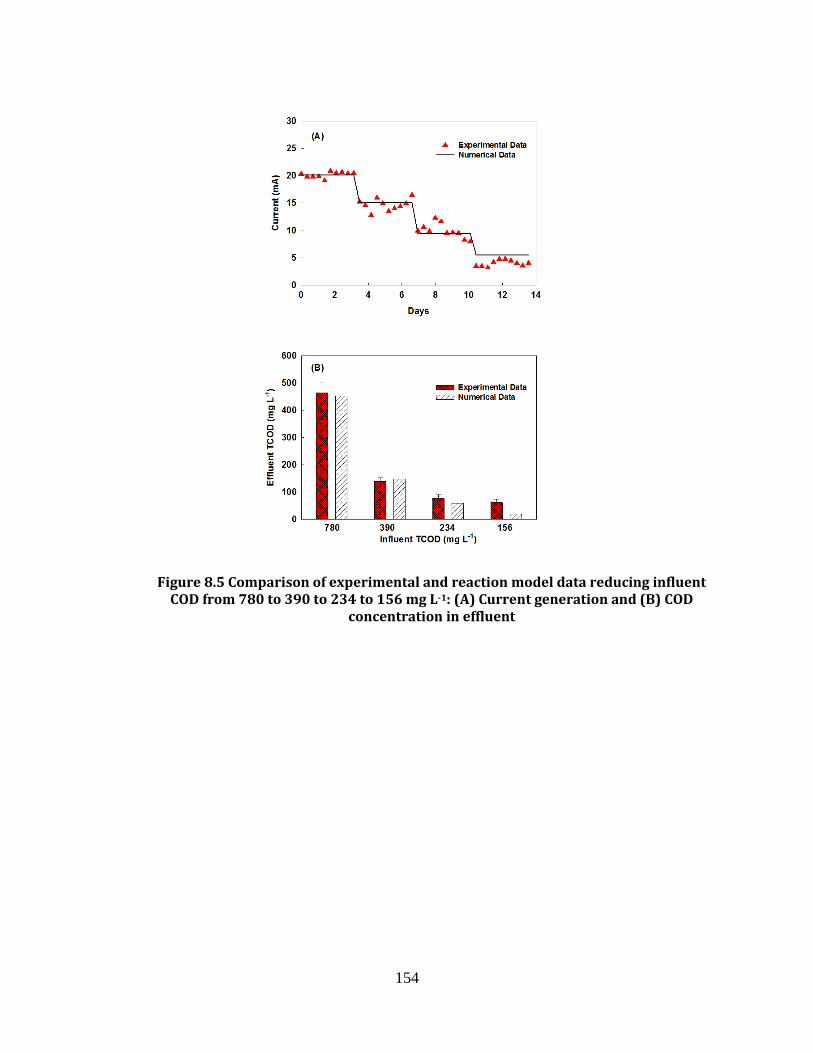
with the synthetic solution, likely because of low organic concentration and complex
organic compounds in the wastewater. On day 75, the HRT was decreased to 6 h (arrow a,
Figure 4.4 A) for increasing the organic loading, which resulted in higher current
generation. However, the current generation still remained low at only 3.3±1.9 A m-3,
which might be related to microbial community: during the period of synthetic solution,
acetate was the only organic compound and thus microbial community could be dominated
by the species that degraded acetate and there could lack microorganisms for degrading
complex substrates. Thus, on day 109, the MBER-A was reinoculated with anaerobic
sludge and HRT was adjusted to 15 h, which led to obvious improvement in current
generation (arrow b, Figure 4.4 A). After two-week reinoculation and adaptation period,
anaerobic sludge was removed from the feeding solution (wastewater) on day 123 and the
MBER-A was still operated at HRT 15 h. The current of the MBER-A decreased to 4.0 A
m-3 after inoculum was excluded in the feeding solution, indicating that organic supply
could still be a major reason for decreased current generation. The MBER-A produced
current density of 3.5±2.1 A m-3 at HRT 15 h in the following 42 days, followed by a series
of changes in HRT to 10 h on day 165 (arrow c, Figure 4 A) and 5 h on day 187 (arrow d,
Figure 4.4 A). On day 195, 200 mg glucose per liter was added into the feeding solution to
58
increase organic supply (arrow e, Figure 4.4 A). Unfortunately, we did not observe
substantial improvement in current generation with this addition, possibly because of short
operating period under this condition.
4.3.2.2 Removal of Organics and Nitrogen
Figure 4.4 The performance of the MBER-A fed with actual wastewater (primary effluent): (A) Current generation at 10 ohms; (B)COD concentration; (C)
Transmembrane pressure (TMP)
59
In general, the MBER-A exhibited lower COD removal efficiency with wastewater,
affected by HRT, compared with that of the synthetic solution (Figure 4.4 B). At HRT 6
h, the anode removed 21.6±0.0 % COD and the whole system achieved 66.5±15.3% COD
removal. When the HRT increased to 15 h, the COD removal efficiency increased to
43.1±19.5 and 84.5±14.4% in its anode and the whole system, respectively. Decreasing
HRT to 10 and 5 h did not obviously change the overall COD removal, but affected the
COD removal in the anode (55.0±12.7 and 41.9±15.8 % under those two HRTs,
respectively). The COD removal efficiency was also related to the COD concentration in
the primary effluent, which varied from time to time during those tests. It should be noted
that with additional 200 mg L-1 glucose in the wastewater, the COD removal rate of the
MBER-A actually improved from 0.41 to 1.33 kg m-3 d-1, indicating that the MBER-A had
capacity for higher organic loading.
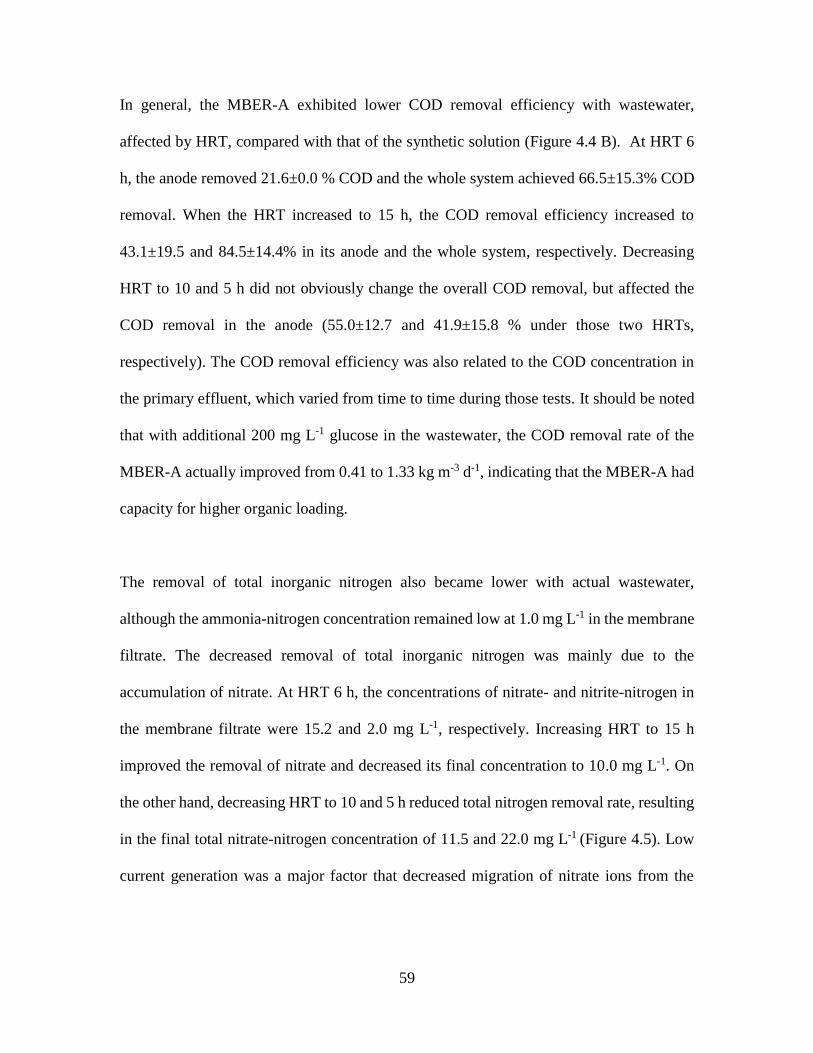
The removal of total inorganic nitrogen also became lower with actual wastewater,
although the ammonia-nitrogen concentration remained low at 1.0 mg L-1 in the membrane
filtrate. The decreased removal of total inorganic nitrogen was mainly due to the
accumulation of nitrate. At HRT 6 h, the concentrations of nitrate- and nitrite-nitrogen in
the membrane filtrate were 15.2 and 2.0 mg L-1, respectively. Increasing HRT to 15 h
improved the removal of nitrate and decreased its final concentration to 10.0 mg L-1. On
the other hand, decreasing HRT to 10 and 5 h reduced total nitrogen removal rate, resulting
in the final total nitrate-nitrogen concentration of 11.5 and 22.0 mg L-1 (Figure 4.5). Low
current generation was a major factor that decreased migration of nitrate ions from the
60
cathode into the anode, and thus less nitrate ions were removed via heterotrophic
denitrification in the anode.
4.3.2.3 Membrane Performance
The TMP of the hollow-fiber membranes varied between 10 and 15 kPa TMP for most of
the time with actual wastewater (Figure 4.4 C). The complex composition of actual
wastewater was related to the increase in TMP, compared with the synthetic solution. A
significant increase in the TMP from 10 to 24 kPa occurred on day 92, likely because of
more serious membrane fouling that was caused by complex composition of wastewater
and/or the growth of heterotrophic bacteria. Extending the HRT from 6 to 15 h decreased
the TMP to 12 kPa, benefited from a reduced organic loading and a lower water flux. From
day 198 to 203 when additional glucose was added as a supplemental substrate, the TMP
increased from 16 to 28 kPa, confirming the previous finding that carbohydrates can
accelerate membrane fouling because of increased amount of flocs formed by extracellular
polymeric substances (EPSs) (Zuriaga-Agustí et al. 2013).
Figure 4.5 The effects of the anolyte HRT on the nitrogen concentration in the MBER-A
61
4.3.3 Energy Consumption
Energy consumption is a key parameter to evaluate the MBER system. When the MBER-
A was fed with the synthetic solution, it was estimated that the system would consume 0.12
kWh to treat 1 m3 wastewater or 0.86 kWh energy to remove 1 kg COD. Further analysis
shows that the anolyte recirculation was the major consumer with 55% of total energy
consumption used to drive the recirculation pump. The remaining energy consumption was
mostly by aeration in the cathode; and the energy requirement by feeding and extracting
water was very minor. The MBER-A produced 0.03 kWh m-3 or 0.20 kWh kgCOD-1 energy
from synthetic solution. The final energy balance (considering both energy consumption
and production) showed that the MBER-A would consume 0.09 kWh m-3 or 0.66 kWh kg
COD-1. For each kg total nitrogen removal, the MBER-A would consume 4.40 kWh.
To further understand the effect of the anolyte recirculation on energy consumption, we
have investigated the energy requirement by the MBER-A at three different recirculation
rates, 50, 150, and 250 mL min-1; the external resistance was fixed at 1 ohm, the HRT was
5 h for those tests, and actual wastewater was used as an anode substrate. The use of 1 ohm
was because that with actual wastewater, the energy production was very low (0.05 kWh
kg COD-1 at 150 ohm, which was close to the internal resistance of the MBER). The results
clearly show that a lower recirculation rate would result in much less energy consumption.
The total energy consumption at 50 mL min-1 was 0.02 kWh m-3 or 0.25 kWh kg COD-1,
less than 40% of the ones at 250 mL min-1 (0.05 kWh m-3 or 0.57 kWh kg COD-1) (Figure
4.6). The energy demand for nitrogen removal was 3.0 kWh kg N-1 at 50 mL min-1, much
lower than 12.6 kWh kg N-1 at 250 mL min-1. Varying the anolyte recirculation rate did not
significantly affect the anode COD removal efficiency, which was 41.6±25.3% at 50 mL
62
min-1 or 39.9±7.5% at 250 mL min-1; in addition, the total nitrogen concentration in the
final membrane filtrate was 21.9 mg L-1 at 50 mL min-1 or 19.5 mg L-1 at 250 mL min-1.
Those results of contaminant removal and energy consumption at different anolyte
recirculation rates suggest that the energy consumption by the MBER could be decreased
by optimizing the operating condition without negative influence on the treatment
performance.
4.3.4 Perspectives of the MBER technology
The developed MBER possesses a certain advantages compared with the existing
technologies. Its energy consumption is much lower than MBRs. Unlike MBRs, MBER is
an integrated system to combine anaerobic process in the anode chamber and aerobic
process in the cathode chamber. With anaerobic treatment, the organic input to the aerobic
process (the cathode) is low, resulting in less requirement of aeration energy, low
Figure 4.6 Energy consumption by the MBER-A per volume of wastewater treated, per COD removed, or per kg nitrogen removed at different anolyte recirculation rate
63
production of aerobic sludge, and low membrane fouling. However, compared with
AnMBRs, the MBERs do not have obvious energy advantage, because of much lower
energy recovery (although AnMBRs also have significant challenges in recovering
methane that is largely dissolved in the membrane filtrate (Liu et al. 2014)). The main
advantage of the MBERs lies in nitrogen removal through an integrated aerobic and
anaerobic processes involving electricity generation. In addition, the MBERs can be
operated at lower temperature than AnMBRs, thereby saving a large amount of energy
associated with heating.
There are some challenges that must be addressed in future development of the MBER
technology. First, nitrogen removal efficiency needs to be further improved; because nitrate
removal is the bottleneck of the total nitrogen removal, nitrate migration across the AEM
or bioelectrochemical denitrification in the cathode should be further investigated. One
possible approach for promoting nitrate migration is to apply a small external voltage to
increase current generation (Ge et al. 2014). Second, the energy consumption needs to be
minimized by controlling aeration intensity and electrolyte recirculation, with
simultaneous evaluation of the effects of those control strategies on the MBER
performance (e.g., removal of contaminants and membrane fouling). Third, a strategy for
system scaling up should be developed to transform laboratory results into a practical
technology.
4.4 Conclusions
This study has demonstrated the improved removal of total nitrogen by using anion
exchange membrane in a membrane bioelectrochemical reactor. The present design
64
promoted nitrate migration/removal, and maintained a low membrane fouling due to the
removal of organic compounds in the anode. The MBER system effectively removed
organic and nitrogen compounds from both synthetic solution and actual wastewater
(primary effluent). Energy consumption could be reduced by decreasing the intensity of
the anolyte recirculation. Further investigation needs to further improve nitrate removal,
decrease energy consumption, and develop a proper strategy for system scaling up.
65
CHAPTER 5
A Novel Approach to Recycle Bacterial Culture Waste for Fermentation Reuse via a Microbial Fuel Cell – Membrane Bioreactor System
(This section has been published as: Li, J., Zhu, Y., Zhuang, L., Otsuka, Y., Nakamura, M.,
Goodell, B., Sonoki, T. and He, Z.* (2015) A novel approach to recycle bacterial culture
waste for fermentation reuse via a microbial fuel cell-membrane bioreactor system.
Bioprocess and Biosystem Engineering. Vol 38, pp 1795-1802.)
Abstract
Biochemical production processes require pure water and nutrient resources for culture
media preparation, but aqueous waste is generated after the target products are extracted.
In this study, culture waste (including cells) produced from a lab-scale fermenter were fed
into a Microbial Fuel Cell-Membrane Bioreactor (MFC-MBR) and electrical energy was
generated via the interaction between the microbial consortia and the solid electrode in the
MFC. High quality treated wastewater was reclaimed in this process which was reused as
a solvent and a nutrient source in subsequent fermentations. Polarization testing showed
that the MFC produced a maximum current density of 37.53 A m-3 with a maximum power
density of 5.49 W m-3. The MFC was able to generate 0.04 kWh of energy per cubic meter
of culture waste treated. Separate lab-scale fermenters containing pure cultures of an
engineered Pseudomonas spp. were used to generate 2-pyrone-4,6-dicarboxylic acid
(PDC) as a high value platform chemical. When the MFC-MBR treated wastewater was
used for the fermenter culture medium, a specific bacterial growth rate of 1.00±0.05 h-1
was obtained with a PDC production rate of 708.11±64.70 mg PDC L-1 h-1. Comparable
values for controls using pure water were 0.95±0.06 h-1 and 621.01±22.09 mg PDC L-1 h-1
(P>0.05), respectively. The results provide insight on a new technique for more sustainable
bio-material production while at the same time generating energy, and suggest that recycled
66
treated wastewater can be used as a solvent and a nutrient source for the fermentation
production of high value platform chemicals.
5.1 Introduction
Fermentation is a biological process that permits the biosynthesis of energy-rich
compounds such as carbohydrates, acids, gases, alcohols and other biochemicals. Typical
fermentation products include lactic acid, succinic acid, hydrogen, ethanol and butanol
(Nozzi et al. 2014, Rosa et al. 2014, Wang et al. 2014a, Yan et al. 2014), with more complex
platform chemicals for polymer production now being produced via engineered organisms.
Biosynthesis of almost all of these biofuels and biochemicals requires strict culture
conditions (temperature, pH, nutrients balance, etc.). However, after the target products
have been extracted - typically through salt precipitation, organic solvation, and/or
evaporation - the microorganisms and culture media must be disposed of, generating large
amounts of waste. The demand for clean water and nutrients increases the costs of
biosynthesized platform chemical production, and the generated waste causes
environmental problems as well.
Considerable research has focused on improvement of target compound yields in
fermentation processes (Arimi et al. 2015, Passanha et al. 2014, Sato et al. 2015, Sonoki et
al. 2014, Xu and Xu 2014, Yadav et al. 2014), but to the best of our knowledge, no studies
have focused on the reuse of water and chemicals for culture media preparation and
resulting platform chemical production. Water scarcity problems have become a global
issue and according to the United Nations, around 1.2 billion people are living with
physical water scarcity while another 1.6 billion people are facing an economic water
67
shortage situation (Ang et al. 2015). It is also desirable to limit nutrient and metal element
usage relative to pending shortages of natural resources such as cobalt, nickel and
phosphorus (Nges et al. 2015). Development of a process for sustainable biochemical
production with minimal input of chemicals and pure water would therefore be desirable
and this drove our interest in exploring methods for reclaiming and reusing treated
wastewater as a potential solution for sustainable product development.
Typical water recycling involves processes such as groundwater recharge or industrial re-
use (Asano and Cotruvo 2004, Matos et al. 2014, Mohsen and Jaber 2003), but for broader
recycling efforts, treatment processes are the key to efficient wastewater reuse. Anaerobic
digestion is an ideal process for the treatment of high concentration waste streams; however,
several technical obstacles still remain relative to the application of this method including
temperature control and regulation of dissolved methane (Smith et al. 2012). Microbial fuel
cell (MFC) treatment is considered an alternative to anaerobic treatment, which offers a
potential solution for wastewater treatment in an energy-neutral manner. In MFCs,
microorganisms convert chemical energy stored in biodegradable materials into electrical
energy. A more detailed description of MFCs can be found in a recent review article (Li et
al. 2014c) but few studies have focused on the reuse of MFC effluent to achieve zero liquid
discharge (ZLD). Borole (Borole 2011) suggested that a bioelectrochemical system (such
as MFC/MEC) could potentially improve energy efficiency and enable water recycling in
bio-refineries; however, no data was presented and ‘real-case’ study on wastewater
reclamation for fermentation based on MFC technology has not yet been reported.
68
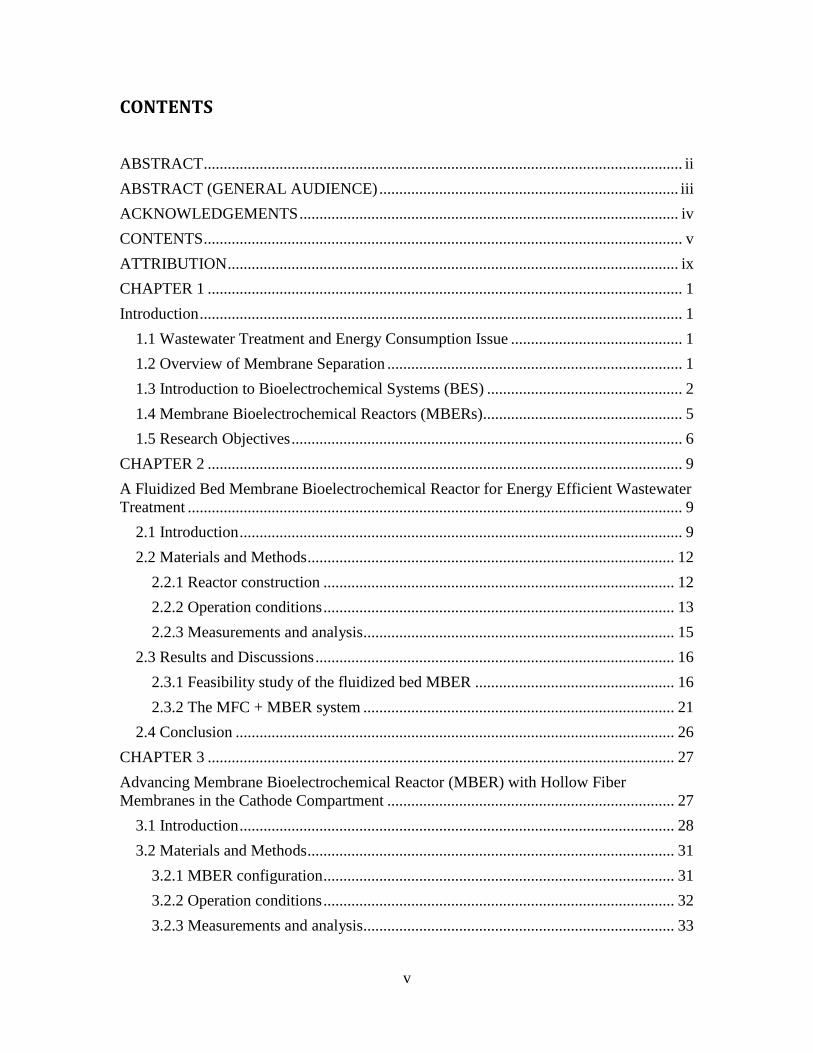
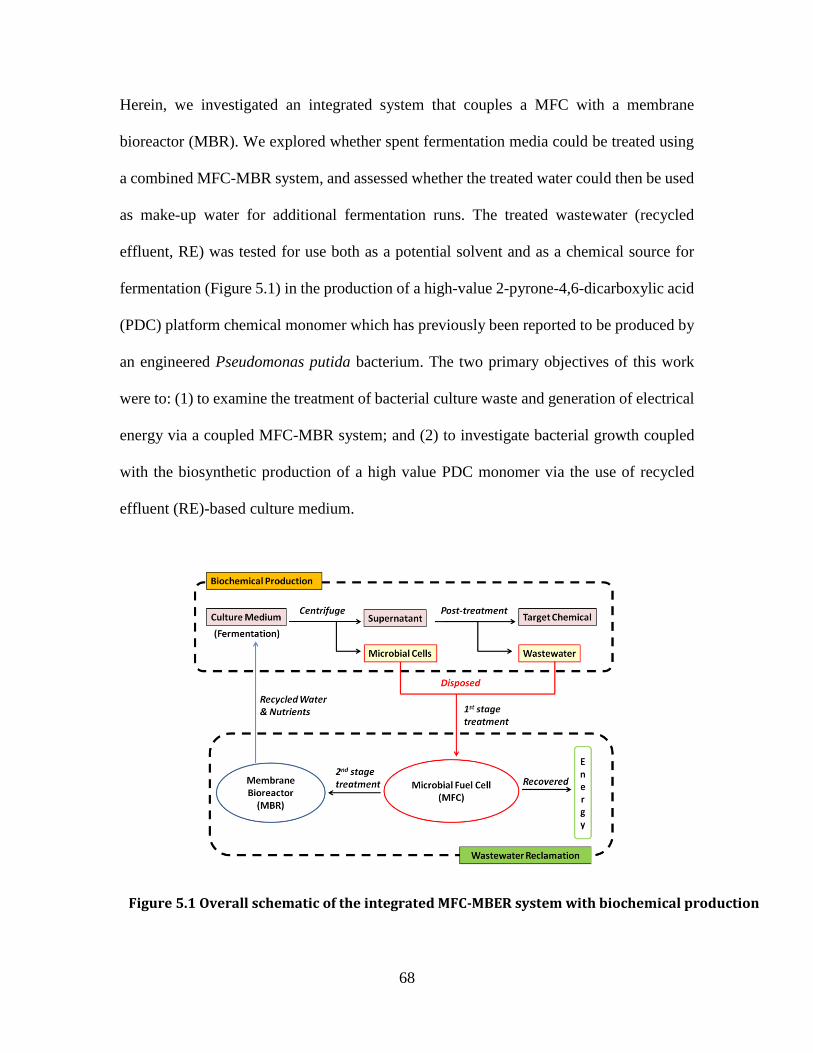
Herein, we investigated an integrated system that couples a MFC with a membrane
bioreactor (MBR). We explored whether spent fermentation media could be treated using
a combined MFC-MBR system, and assessed whether the treated water could then be used
as make-up water for additional fermentation runs. The treated wastewater (recycled
effluent, RE) was tested for use both as a potential solvent and as a chemical source for
fermentation (Figure 5.1) in the production of a high-value 2-pyrone-4,6-dicarboxylic acid
(PDC) platform chemical monomer which has previously been reported to be produced by
an engineered Pseudomonas putida bacterium. The two primary objectives of this work
were to: (1) to examine the treatment of bacterial culture waste and generation of electrical
energy via a coupled MFC-MBR system; and (2) to investigate bacterial growth coupled
with the biosynthetic production of a high value PDC monomer via the use of recycled
effluent (RE)-based culture medium.
Figure 5.1 Overall schematic of the integrated MFC-MBER system with biochemical production
69
5.2 Materials and Methods
5.2.1 Bacterial strains and culture media
Pseudomonas putida PpY1100 and P. putida PpY1100/pDVZ21X were used in this study
(Otsuka et al. 2006). The plasmid pDVZ21X encodes for vanillate demethylase,
protocatechuate-4,5-dioxygenase and 4-carboxy-2-hydroxymuconate-6-semialdehyde
dehydrogenase that are essential for the production of PDC from vanillic acid (VA) and
other aromatic compounds, including waste crude lignin. Both strains were routinely
maintained on LB agar plates containing nalidixic acid (Nal, 20 mg L-1), and additional
Kanamycin (Km, 50 mg L-1) was added when P. putida PpY1100/pDVZ21X was cultured
on the plates. The modified W medium consisted (per liter) of 6.025 g (NH4)2SO4, 3.875 g
KH2PO4, 16.607 g Na2HPO4·7H2O, 2.9 g yeast extract, 200.0 mg MgSO4·7H2O, 19.0 mg
0.5 mg CuSO4·5H2O, 0.6 mg CoSO4·7H2O, 0.1 mg H3BO4, and 0.1 mL concentrated HCl,
was used to culture both strains in liquid medium (Yano and Nishi 1980).
5.2.2 Culture condition
Culture waste from P. putida PpY1100 was generated as follows: The PpY1100 strain was
used to inoculate 10 mL of the modified W medium containing 20 mg L-1 Nal and 10 g L-
1 glucose, and shake-incubated at 30 oC for 16 h. Ten mL of the pre-culture was used to
inoculate modified W medium containing (per liter) 20 mg L-1 Nal and 15 g L-1 glucose,
and cultured for 7 h at 30oC with constant aeration and 700 rpm agitation. The glucose
concentration in the culture was measured using a Glucose C-II Test Wako (Wako Pure
Chemical Industries, Ltd., Osaka, Japan). Culture waste was then collected and fed into the
MFC-MBR.
70
5.2.3 Fermentation using recycled effluent
New culture medium was prepared using either pure water or RE (RE-A, RE-B & RE-C –
Table 5.1) from the MFC-MBR treatments. For fermentation using RE water, pre-cultured
P. putida PpY1100 was inoculated in each RE-based culture medium as discussed in
section 5.2.2, to obtain growth profiles. The recycled effluent from batch A was tested to
replace pure water for the culture media preparation, which was named as RE-A. The
recycled effluent from batch B was tested to minimize both macro-and-micronutrients
addition for culture media preparation, which was named as RE-B1 and RE-B2,
respectively. The PDC-producing bacterium, P. putida PpY1100/pDVZ21X, was also used
to assess PDC production. The organism was inoculated into 10 mL of modified W medium
containing 20 mg L-1 Nal, 50 mg L-1 Kanamycin (Km) and 10 g L-1 glucose and shake-
incubated at 30o C for 16 h. The medium for preculture was prepared using deionized water
throughout this work. The preculture (50 µL) was inoculated into 50 mL of modified W
medium containing 20 mg L-1 Nal, 50 mg L-1 Km and 10 g L-1 glucose in a baffled shake-
culture flask. The recycled effluents from batch B and C (see section 5.2.4) were used as
solvent for the culture media preparation as a parallel to the control experiment that used
deionized (DI) water. The recycled effluent from batch C test was divided into three sub-
tests, which were named as RE-C, RE-C (1:2) and RE-C (1:2r), respectively. The “1:2”
meant that the recycled effluent was diluted to 1:2 before chemical addition, and “r”
indicated that a reduced amount of chemicals were added into culture media. After
inoculation the flask was shake-cultured at 30o C and 500 μl of VA (100 g L-1, pH 7) was
added to the culture at 6 h after the inoculation and then collected 500 μL of the culture at
0, 0.5 and 1 h after the addition of VA. Each collected culture was centrifuged (15,000xg,
71
5 min) and the supernatant was acidified to pH 2 with H3PO4 and filtrated with 0.45µm
filter.
5.2.4 MFC & MBR setup
The MFC system was constructed as a tubular reactor (100 cm long and 4 cm in diameter)
made of cation exchange membrane (CEM-Ultrex CMI 7000, Membrane International,
Inc., Glen Rock, NJ, USA). A one-meter long carbon brush electrode was installed inside
the anode chamber resulting in a net anodic liquid volume of 1400 mL. Before use, the
carbon anode was soaked in acetone overnight and heated for 30 min at 450º C. The cathode
electrode was one piece of carbon cloth (Zoltek Corporation, St. Louis, MO, USA) coated
with activated carbon at a loading rate of 5 mg cm-2. The completed MFC consisted of the
CEM tube, wrapped within the finished cathode electrode. The anode and cathode
electrodes were connected to a 10-ohm external resistor using titanium wire. The MFC was
set up in a 4.5-L cylindrical container that acted as a cathode compartment (with the anode
encapsulated within that), and the 4.5-L container was subsequently aerated with air to
oxygenate the cathode.
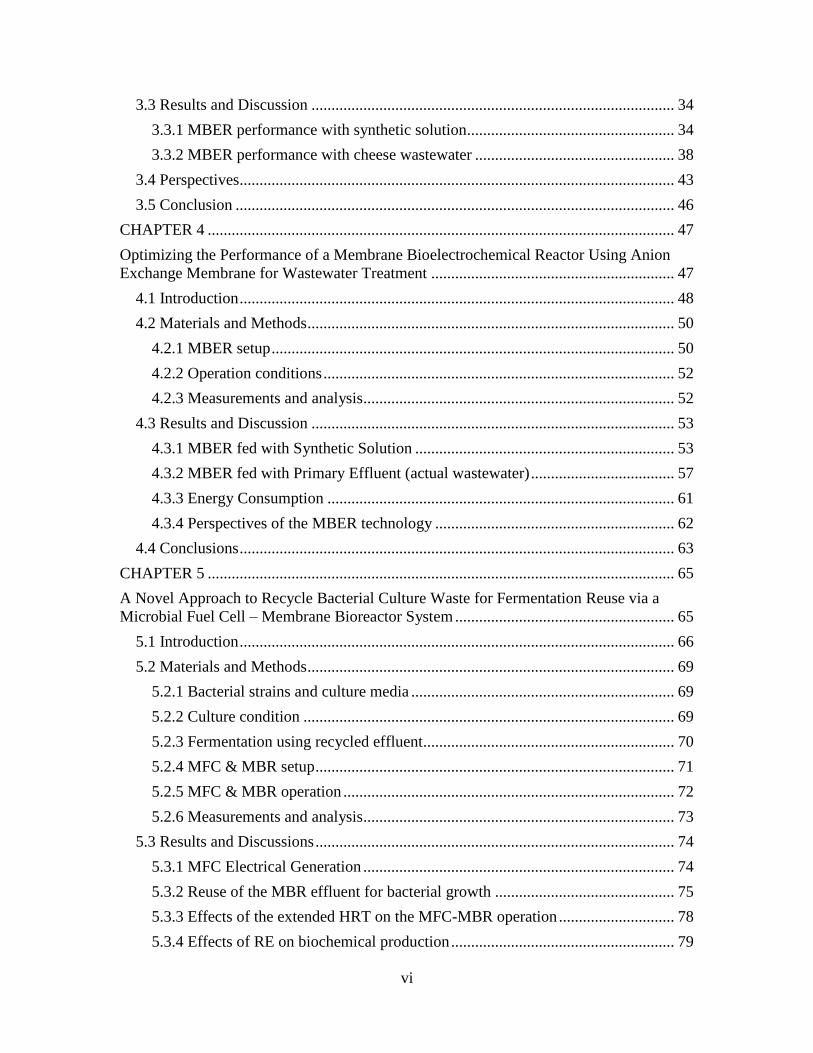
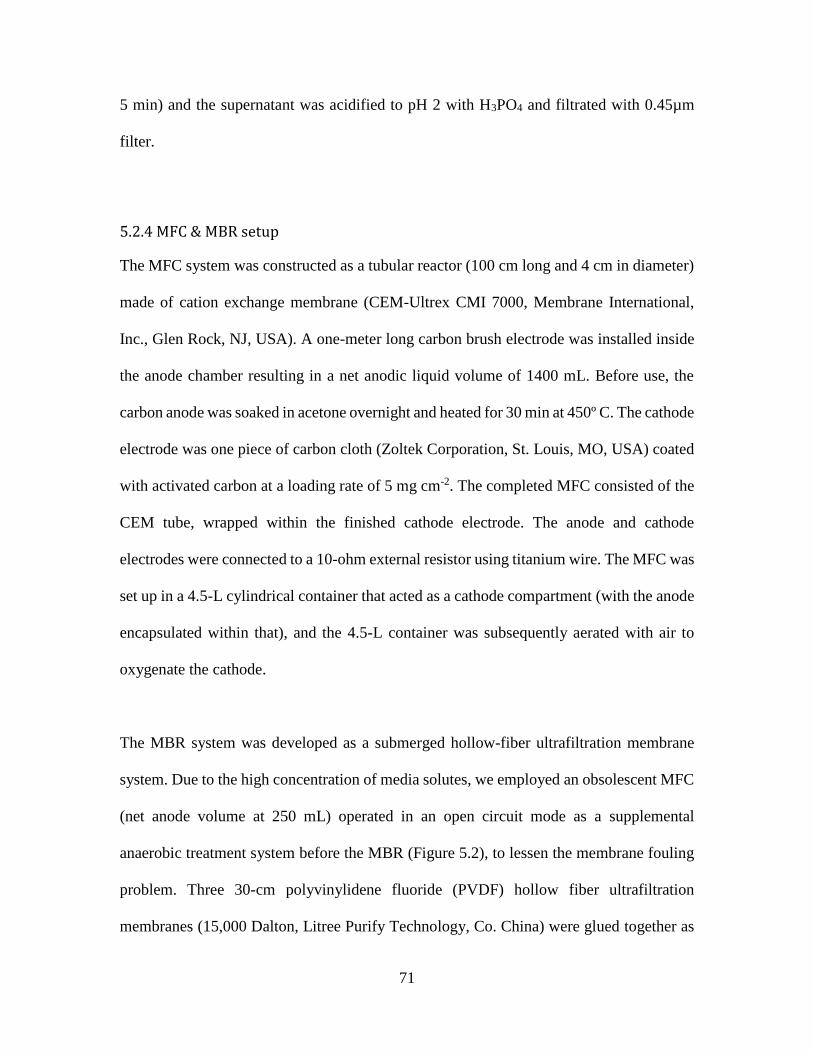
The MBR system was developed as a submerged hollow-fiber ultrafiltration membrane
system. Due to the high concentration of media solutes, we employed an obsolescent MFC
(net anode volume at 250 mL) operated in an open circuit mode as a supplemental
anaerobic treatment system before the MBR (Figure 5.2), to lessen the membrane fouling
problem. Three 30-cm polyvinylidene fluoride (PVDF) hollow fiber ultrafiltration
membranes (15,000 Dalton, Litree Purify Technology, Co. China) were glued together as
72
a membrane bundle and installed inside the MBR, which was aerated by an aquarium
pump. The MBR liquid volume was maintained at approximately 1.1 L.
5.2.5 MFC & MBR operation
The MFC was initially inoculated with anaerobic sludge from the Peppers Ferry
Wastewater Treatment Plant (Radford, VA. USA) and was connected to the MBR system
in series (Figure 5.2). During the start-up period, a defined solution was fed into the MFC
containing (per L of DI water) sodium acetate 0.2 g; NH4Cl 0.15 g; NaCl 0.5 g; MgSO4
0.015 g; CaCl2 0.02 g; KH2PO4 0.53 g; K2HPO4 1.07 g and 1mL trace elements. A 10 mM
phosphorus buffer solution was used as a catholyte solution in the MFC. After start-up, the
defined media solution was gradually switched to the waste stream inoculum, by diluting
the stream with DI water at ratios of 20, 10, 4, and 2 times stepwise at one week intervals.
After the acclimation process with the diluted waste, the raw culture waste (no dilution)
was fed to the MFC-MBR system using three different batch mode delivery methods
designated as: (A) where the waste stream was fed at 0.4 mL min-1, resulting in a total
hydraulic retention time (HRT) for both MFC and MBR of 4.8 d; (B) the system was
operated under the same conditions as the batch A except that 0.1 mole L-1 sodium
bicarbonate was added as a buffering reagent; and (C) the waste feed rate was reduced to
0.12 mL min-1 with a total HRT (MFC+MBR) of 15.9 d and with 0.1 mole L-1 sodium
bicarbonate as a buffering reagent. Correspondingly, the effluent collected from those
batches was designated: RE-A, RE-B and RE-C, respectively. Recirculation was applied
to the anolyte of the MFC at 80 mL min-1.
73
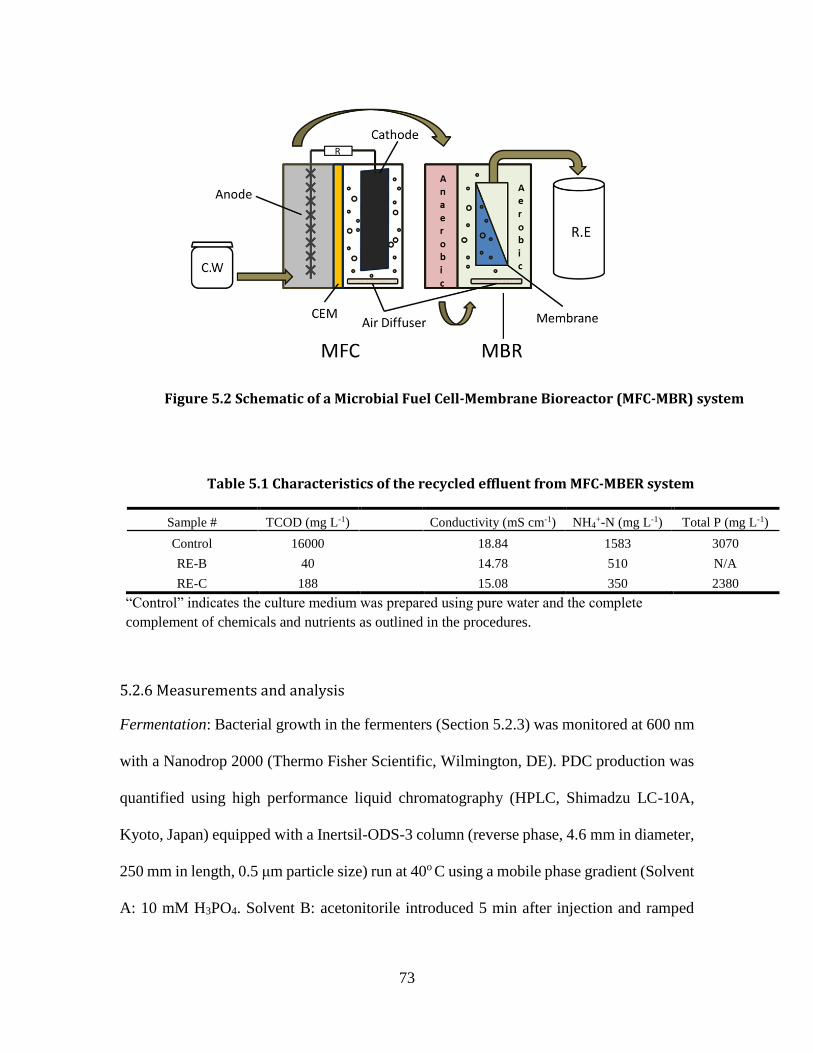
Sample # TCOD (mg L-1) Conductivity (mS cm-1) NH4+-N (mg L-1) Total P (mg L-1)
Control 16000 18.84 1583 3070
RE-B 40 14.78 510 N/A
RE-C 188 15.08 350 2380
“Control” indicates the culture medium was prepared using pure water and the complete
complement of chemicals and nutrients as outlined in the procedures.
5.2.6 Measurements and analysis
Fermentation: Bacterial growth in the fermenters (Section 5.2.3) was monitored at 600 nm
with a Nanodrop 2000 (Thermo Fisher Scientific, Wilmington, DE). PDC production was
quantified using high performance liquid chromatography (HPLC, Shimadzu LC-10A,
Kyoto, Japan) equipped with a Inertsil-ODS-3 column (reverse phase, 4.6 mm in diameter,
250 mm in length, 0.5 μm particle size) run at 40o C using a mobile phase gradient (Solvent
A: 10 mM H3PO4. Solvent B: acetonitorile introduced 5 min after injection and ramped
Figure 5.2 Schematic of a Microbial Fuel Cell-Membrane Bioreactor (MFC-MBR) system
Table 5.1 Characteristics of the recycled effluent from MFC-MBER system
74
from 10 to 50% over 10m). The mobile phase flow rate was 1.0 mL min-1 and the detection
wavelength was 280 nm.
MFC/MBR analysis: The voltage of the MFC (Section 5.2.5) was recorded every 5 min by
a digital multimeter (2700, Keithley Instruments, Cleveland, OH) and the current and
power density was normalized to the anode liquid volume. The pH was measured using a
benchtop pH meter (Oakton Instruments, Vernon Hills, IL, US). Conductivity was
measured using a benchtop conductivity meter (Mettler-Toledo, Columbus, OH, USA).
The concentration of chemical oxygen demand (COD), ammonium, nitrite, nitrate and
phosphorus were measured according to the manufacturer’s procedure (DR/890, Hach
Company, Loveland, CO, USA). Transmembrane pressure (TMP) was recorded manually
and the average value was reported. Turbidity was measured using a turbidimeter (DRT
100B, HF Scientific, Inc, Fort Meyers, FL, USA).
5.3 Results and Discussions
5.3.1 MFC Electrical Generation
The MFC internal resistance was about 10 ohms and its maximum power density reached
as high as 5.49 W m-3 when fed with an acetate solution (Figure 5.3). Given these values,
the MFC was operated under an external resistance of 10 ohms to ensure maximum power
output when the culture waste was treated. Unexpectedly, a high COD concentration of
9000 mg L-1 in the raw culture waste did not result in high power output from the MFC. In
batch A, a low power density of only 0.16±0.04 W m-3 was obtained but this increased to
0.48±0.15 W m-3 in the batch B tests; a significant improvement (P<0.05). This
enhancement was likely due to the buffering effect caused by the addition of 0.1 M sodium
75
bicarbonate. These results demonstrated that low pH (4.4) culture waste inhibited anodic
activity and thus electricity generation, and as a consequence, pH buffering in larger scale
systems would be necessary. The exact reason for low electricity generation was not clear
at this moment, and it could be related to the complex composition of culture wastes,
recalcitrant compounds, and low pH. Those warrant further investigation and improvement
of electricity generation in MFCs.
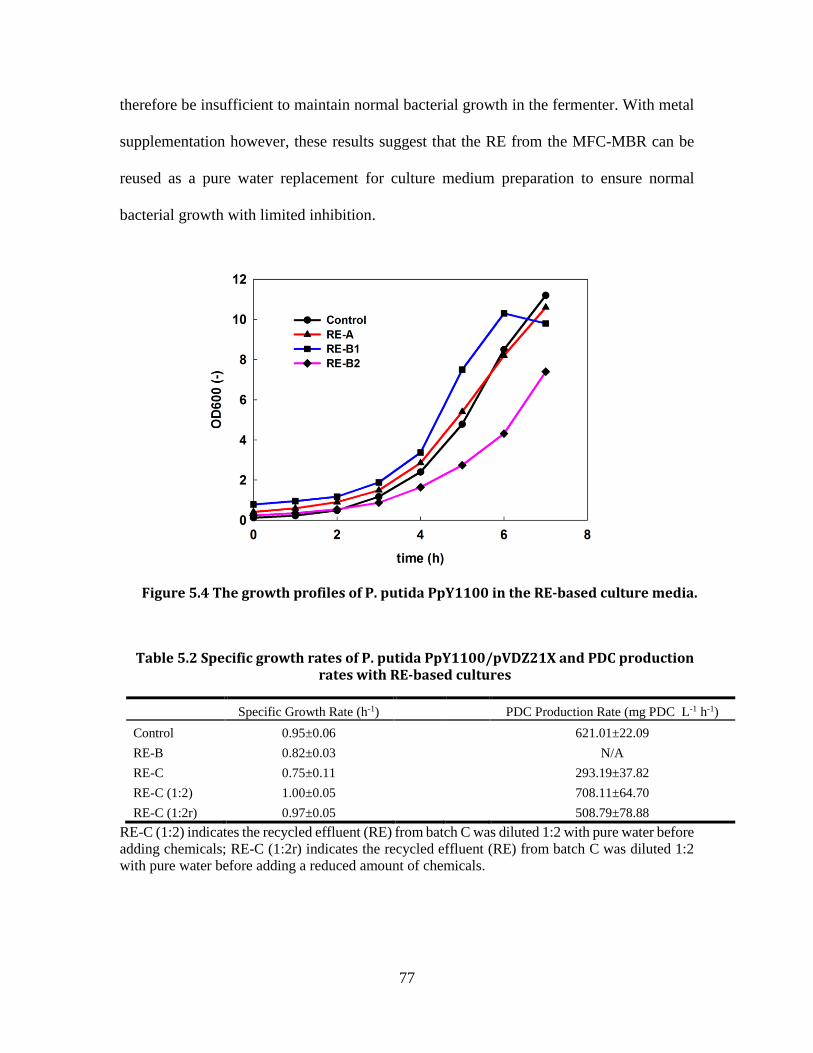
5.3.2 Reuse of the MBR effluent for bacterial growth
The purpose for use of the MFC-MBR system in this work was not only to decrease the
concentration of contaminants in the culture waste and recover electrical energy via the
oxidation of organic compounds, but also to polish the wastewater for reuse by
fermentation. P. putida PpY1100 is a KT2440-derivative strain that has previously been
used for production of a variety of platform chemicals (Sun et al. 2007, Vardon et al. 2015).
A growth profile was obtained (Figure 5.4) for this strain when 500 mL of the RE-A treated
Figure 5.3 The polarization results for the MFC. The solid line represents power density and the dashed line is for voltage
76
wastewater collected from the MBR after 24 h and was used as a replacement for water in
the culture medium. Specific bacterial growth rates (OD600) were 0.79 h-1 from the control
(pure water based), vs. 0.64 h-1 from the RE-A based medium. These results suggest that
undiluted RE can potentially be used for bacterial culture preparation with limited
inhibitory effects.
In addition to using RE to replace water in the media, we also investigated whether ion
concentration in the system would be modified by the MFC-MBR treatment. Chemical
analysis showed that RE-B contained some residual macro-nutrient elements (Table 5.1).
Therefore, two modifications of the RE-B based culture media were developed for test;
RE-B1 and RE-B2. In RE-B1, a small amount of nitrogen (as ammonium sulfate) was
added, and metals were also added to bring their concentrations to the same level as in the
original media (Table 5.1 and Table 5.2) prepared with water (termed as the Control media).
No phosphorus was added to RE-B1. In RE-B2, no metals were added, but the same
amounts of other nutrients were used as in the control (Table 5.1 and Table 5.2). The
PpY1100 strain in both RE-B1 and RE-B2 had a similar growth profile to the control
(Figure 5.4). The specific growth rate (OD600) of RE-B1 was approximately 0.69 h-1,
lower than that of the control (0.79 h-1). However, the specific growth rate in the RE-B2
culture was 0.57 h-1, or 28% lower than that for growth in the control media. This suggests
that the low growth rate may be due to insufficient residual metals in the recycled effluent.
Metals, such as Mg, Fe, Zn etc., have important roles in maintaining a wide variety of
normal cellular activities, although the required amount of each metal element may be very
small. These metals are used for biomass synthesis during both culturing by the bacterial
consortia in the MFC-MBR treatment, and the residual metals in the RE-B would be
77
therefore be insufficient to maintain normal bacterial growth in the fermenter. With metal
supplementation however, these results suggest that the RE from the MFC-MBR can be
reused as a pure water replacement for culture medium preparation to ensure normal
bacterial growth with limited inhibition.
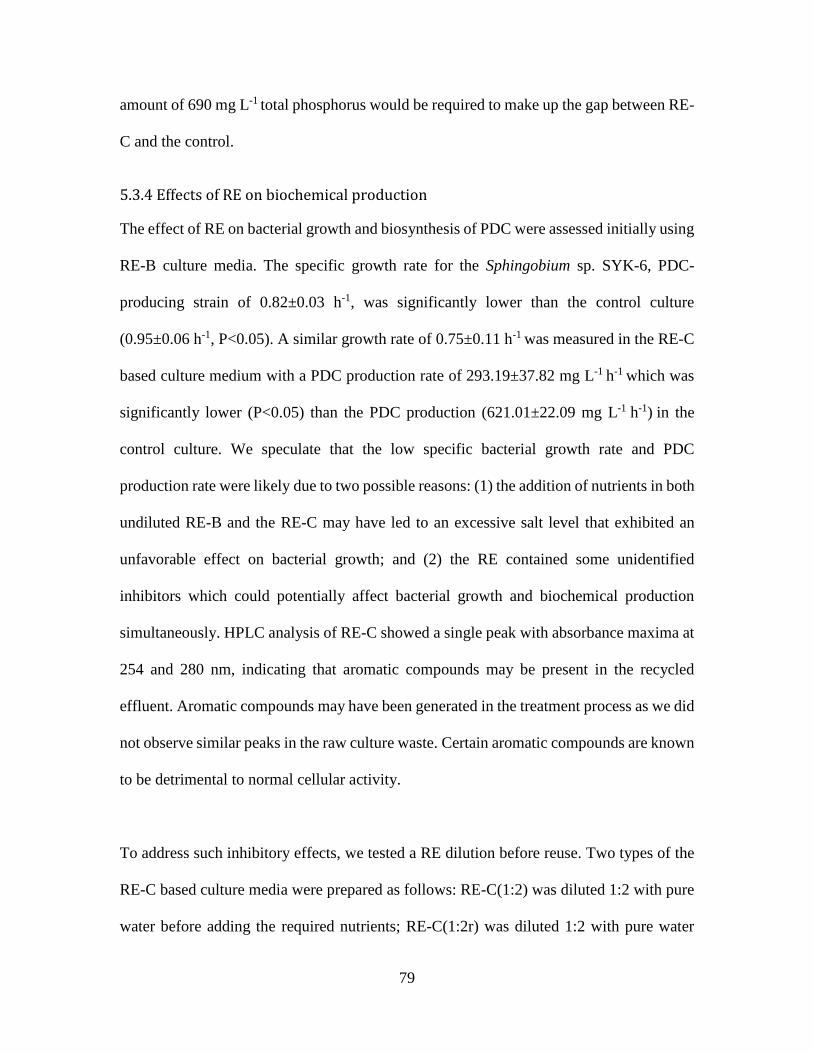
Specific Growth Rate (h-1) PDC Production Rate (mg PDC L-1 h-1)
Control 0.95±0.06 621.01±22.09
RE-B 0.82±0.03 N/A
RE-C 0.75±0.11 293.19±37.82
RE-C (1:2) 1.00±0.05 708.11±64.70
RE-C (1:2r) 0.97±0.05 508.79±78.88
RE-C (1:2) indicates the recycled effluent (RE) from batch C was diluted 1:2 with pure water before
adding chemicals; RE-C (1:2r) indicates the recycled effluent (RE) from batch C was diluted 1:2
with pure water before adding a reduced amount of chemicals.
Figure 5.4 The growth profiles of P. putida PpY1100 in the RE-based culture media.
Table 5.2 Specific growth rates of P. putida PpY1100/pVDZ21X and PDC production rates with RE-based cultures
78
5.3.3 Effects of the extended HRT on the MFC-MBR operation
The batch C treated effluent, with an extended total HRT of 15.2 d was used to examine
both power generation and energy recovery, with energy recovery expressed as kWh m-3
(Ge et al. 2013a). Extending HRT did not improve power output, which was only 0.20±0.07
W m-3 in batch C. However, increasing HRT enhanced energy recovery to 0.04±0.01 kWh
m-3, which was significantly greater than the 0.01±0.00 kWh m-3 observed for batch A
(P<0.05), and close to the energy recovery obtained in from batch B (0.03±0.01 kWh m-3,
P>0.05). This result suggests that there may not be an obvious energy recovery advantage
when HRT is increased, possibly due to the accumulation of aromatic compounds that may
have inhibitory effects on normal cellular activity (discussed further below).
Increasing HRT also did not obviously improve organic removal in the MBR recycled
effluent. In RE-C, a residual COD (188 mg L-1) was greater than the 40 mg L-1 for RE-B
(Table 5.1); however, the ammonium nitrogen concentration (350 mg L-1) in the RE-C,
was lower in RE-B (510 mg L-1). The reduced ammonium accumulation in RE-C may
potentially have been caused by three possible mechanisms: (1) In the MFC, more
positively charged ammonium ions could potentially have migrated to the cathode
compartment given the electrical potential field generated during the elongated retention
time (Kelly and He 2014); (2) more nitrification could potentially occur in the MBR with
increasing HRT. However, a low nitrate nitrogen level (1.4 mg L-1 data not shown) was
observed across the membrane indicating that denitrification occurred inside the MBR
compartment, resulting in a higher pH 8.4 in RE-C than in RE-B (pH 7.8); and (3) Constant
aeration inside the MBR may have removed ammonia through air stripping (Qin and He
2014). The total phosphorus content was 2380 mg L-1 in RE-C, indicating that a theoretical
79
amount of 690 mg L-1 total phosphorus would be required to make up the gap between RE-
C and the control.
5.3.4 Effects of RE on biochemical production
The effect of RE on bacterial growth and biosynthesis of PDC were assessed initially using
RE-B culture media. The specific growth rate for the Sphingobium sp. SYK-6, PDC-
producing strain of 0.82±0.03 h-1, was significantly lower than the control culture
(0.95±0.06 h-1, P<0.05). A similar growth rate of 0.75±0.11 h-1 was measured in the RE-C
based culture medium with a PDC production rate of 293.19±37.82 mg L-1 h-1 which was
significantly lower (P<0.05) than the PDC production (621.01±22.09 mg L-1 h-1) in the
control culture. We speculate that the low specific bacterial growth rate and PDC
production rate were likely due to two possible reasons: (1) the addition of nutrients in both
undiluted RE-B and the RE-C may have led to an excessive salt level that exhibited an
unfavorable effect on bacterial growth; and (2) the RE contained some unidentified
inhibitors which could potentially affect bacterial growth and biochemical production
simultaneously. HPLC analysis of RE-C showed a single peak with absorbance maxima at
254 and 280 nm, indicating that aromatic compounds may be present in the recycled
effluent. Aromatic compounds may have been generated in the treatment process as we did
not observe similar peaks in the raw culture waste. Certain aromatic compounds are known
to be detrimental to normal cellular activity.
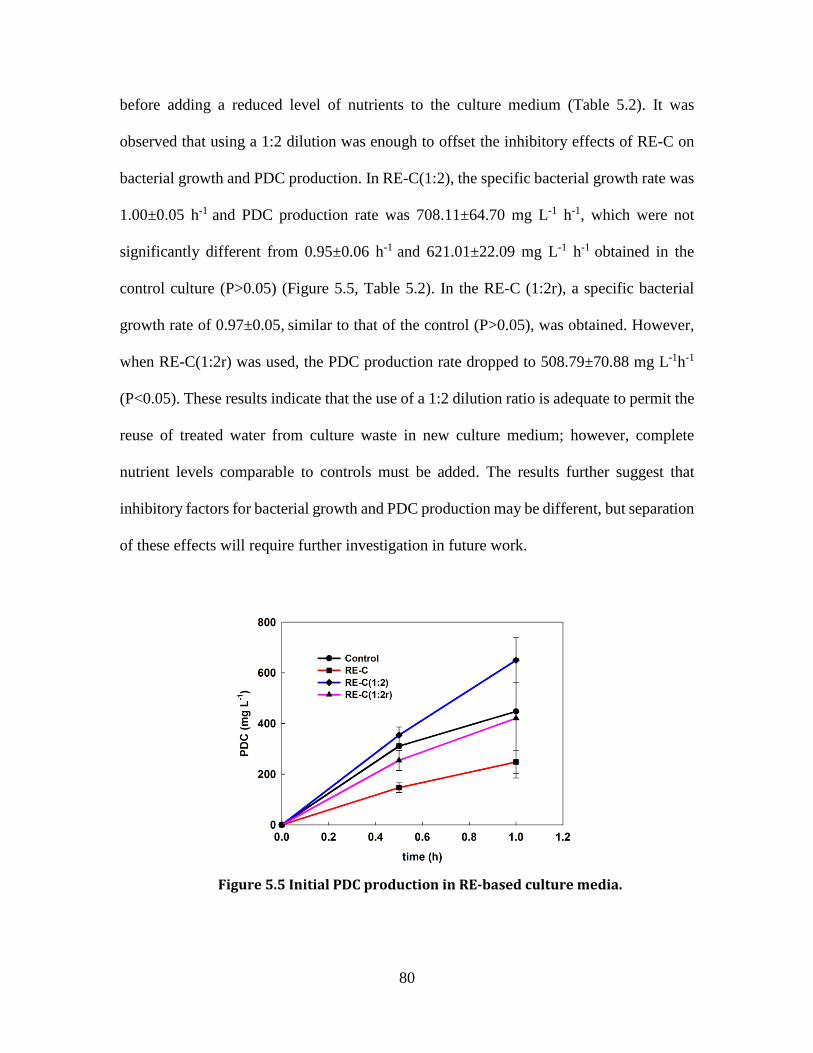
To address such inhibitory effects, we tested a RE dilution before reuse. Two types of the
RE-C based culture media were prepared as follows: RE-C(1:2) was diluted 1:2 with pure
water before adding the required nutrients; RE-C(1:2r) was diluted 1:2 with pure water
80
before adding a reduced level of nutrients to the culture medium (Table 5.2). It was
observed that using a 1:2 dilution was enough to offset the inhibitory effects of RE-C on
bacterial growth and PDC production. In RE-C(1:2), the specific bacterial growth rate was
1.00±0.05 h-1 and PDC production rate was 708.11±64.70 mg L-1 h-1, which were not
significantly different from 0.95±0.06 h-1 and 621.01±22.09 mg L-1 h-1 obtained in the
control culture (P>0.05) (Figure 5.5, Table 5.2). In the RE-C (1:2r), a specific bacterial
growth rate of 0.97±0.05, similar to that of the control (P>0.05), was obtained. However,
when RE-C(1:2r) was used, the PDC production rate dropped to 508.79±70.88 mg L-1h-1
(P<0.05). These results indicate that the use of a 1:2 dilution ratio is adequate to permit the
reuse of treated water from culture waste in new culture medium; however, complete
nutrient levels comparable to controls must be added. The results further suggest that
inhibitory factors for bacterial growth and PDC production may be different, but separation
of these effects will require further investigation in future work.
Figure 5.5 Initial PDC production in RE-based culture media.
81
It is well known that processes such as reverse osmosis (RO), can be used to polish water
for secondary treated urban wastewater reuse (Bunani et al. 2015). However, the extensive
energy requirements for RO treatment and the vulnerability of RO units to membrane
fouling make RO treatment an expensive option. Therefore, the 2:1 dilution of RE offers
a more affordable alternative for treatment of spent culture medium.
5.3.5 Outlook
In this work, we demonstrate the potential for reclaiming and reusing wastewater from
spent culture media through the use of a MFC-MBR system. Although a 2 times dilution
was effective for preparation of new culture media, the inhibitory compounds associated
with the recycled effluent must be identified. Polymeric absorbents such as styrene-
divinylbenzene (Amberlight®) can potentially be used as a low cost method for phenolic
compound removal. Also, although high salt levels did not appear to be a problem, potential
desalination methods could be applied to reduce sample salinity (e.g., electrodialysis,
reverse osmosis, and microbial desalination cell) if this were required. This research
represents a preliminary study demonstrating proof of concept, and more tests should be
conducted to validate the reproducibility of the system’s performance. Energy recovery
should also be further optimized, for example through the use of multiple-stage MFC
systems prior to the membrane bioreactor polishing process. Finally, a comprehensive
assessment of the treatment and recycling system should be conducted to evaluate tradeoffs
between costs (construction and operation) and benefits (recovery of energy, water and
nutrients).
82
5.4 Conclusions
This paper presents a preliminary study on the re-use of water from spent culture media
through treatment with an MFC-MBR system. Results demonstrate that treated wastewater
can successfully be used to prepare new culture media for fermentation and associated
platform chemical production. Under an appropriate reuse strategy (such as 1:2 dilution);
both bacterial growth rate and PDC production were comparable to that obtained in control
cultures using fresh water for media make up. The synergistic processes examined in this
research offer a potential solution for minimizing environmental problems with wastewater
treatment while also generating limited amounts of electrical energy. Benefits also include
reduced carbon emissions and enhanced waste management, while also providing
methodology that supports sustainable fermentation by conserving the use of fresh water
in the production of new biosynthesized platform chemicals.
83
CHAPTER 6
Development of a Dynamic Mathematical Model for Membrane Bioelectrochemical Reactors with Different Configurations
(This section has been published as: Li, J. and He, Z.* (2015) Development of a Dynamic
Mathematic Model for Membrane Bioelectrochemical Reactors with Different
Configurations. Environmental Science and Pollution Research. Vol 23, pp 3897-3906.)
Abstract
Membrane bioelectrochemical reactors (MBERs) integrate membrane filtration into
bioelectrochemical systems for sustainable wastewater treatment and recovery of
bioenergy and other resource. Mathematical models for MBERs will advance the
understanding of this technology towards further development. In the present study, a
mathematical model was implemented for predicting current generation, membrane fouling
and organic removal within MBERs. The relative root-mean-square error was used to
examine the model fit to the experimental data. It was found that a constant to determine
how fast the internal resistance responds to the change of the anodophillic microorganism
concentration could have a dominant impact on current generation. Hydraulic cross flow
exhibited a minor effect on membrane fouling unless it was reduced below 0.5 m s-1. This
MBER model encourages further optimization and eventually can be used to guide MBER
development.
6.1 Introduction
Integrating filtration membranes into bioelectrochemical systems such as microbial fuel
cells (MFCs) represents a new approach for sustainable wastewater treatment and has
attracted great interest (Yuan and He 2015). In MFCs, bioenergy in wastewater is extracted
through the interaction between microbes and electrodes in the anodic compartment and
84
the produced electrons are transferred to cathode electrode through an external circuit
(Logan et al. 2006b). Comparing with the conventional activated sludge (CAS) process,
MFC technology requires less energy input, yields less sludge and produces useful bio-
electricity (Rabaey and Verstraete 2005, Zhang et al. 2013b). Combining a membrane
separation process with MFCs helps to achieve high quality effluent, and the combined
system is called membrane bioelectrochemical reactors (MBERs) or bioelectrochemical
membrane reactors (BEMRs).
MBERs have been demonstrated feasible and advanced in several aspects including
configurations, nutrient removal, and energy balance. Early studies applied biofilm grown
on stainless steel mesh as a membrane-like filtration process to achieve high removal of
both organics and ammonia (Wang et al. 2011b, Wang et al. 2012). Commercial hollow-
fiber ultrafiltration membranes were installed in the anodic compartment of a tubular MFC,
forming an MBER, but membrane fouling reduced water flux and required frequent
membrane cleaning (Ge et al. 2013b). To alleviate fouling issue, MBERs were modified,
such as a fluidized-bed MBER with granular activated carbon (GAC) in the anodic
chamber, or hollow fiber membrane being installed in the cathodic chamber with constant
aeration (Li et al. 2014a, b). Nitrogen removal could be improved by using an anion
exchange membrane (AEM) as a separator (Li and He 2015b). Membrane bioreactors
(MBRs) can be linked to MFCs for achieving treatment of wastewater or reuse of media
for fermentation (Li et al. 2015). Two staged microbial fuel cell-anaerobic fluidized bed
membrane bioreactor generated a high quality effluent with the MBR as an external post-
treatment of the MFC (Ren et al. 2014). High quality effluent, more energy advantage and
85
minimal operation maintenance offers the MBER related technology as an alternative to
the conventional membrane bioreactors (MBRs), but its performance (eg. electrical
generation/membrane fouling) warrants further optimization before large scale
commercialization.
Given its intrinsic physical, biological and electrochemical factors, developing a
mathematical model will be helpful for further understanding of MBER systems. An
MBER model consists of two parts, MFCs and MBR, linked by some key factors such as
organic loading rates (OLR), aeration intensity and reactor configuration. The available
MFC/MEC models are based on Nernst-Monod type of equations to calculate substrate
consumption and bacteria growth in the anodic compartment, but the mass transfer
equations vary depending on the spatial distribution of substrates and microbial activities
(Marcus et al. 2007, Picioreanu et al. 2007, Ping et al. 2014, Pinto et al. 2010). The existing
MBR models are derived from activated sludge model (ASM) with a physical membrane
filtration process (Ng and Kim 2007). Biomass kinetic models and membrane fouling
models are major components to describe the MBR process (Diez et al. 2014, Zuthi et al.
2015). Development of MBER models will need to synergistically integrate MFC models
with MBR models. In this study, a dynamic MBER model was developed for the first time.
The model was validated and examined with the data from three different MBERs reported
previously: an MBER with ultrafiltration membranes in its cathodic compartment, an
MBER with improved nitrogen removal, and an MBER with fluidized GAC. It is expected
that findings from current study can be helpful for next generation MBER model
86
development, which includes heterogeneous substrate and microbial distribution inside
anodic compartment, and dynamic cathode overpotential.
6.2 Methods
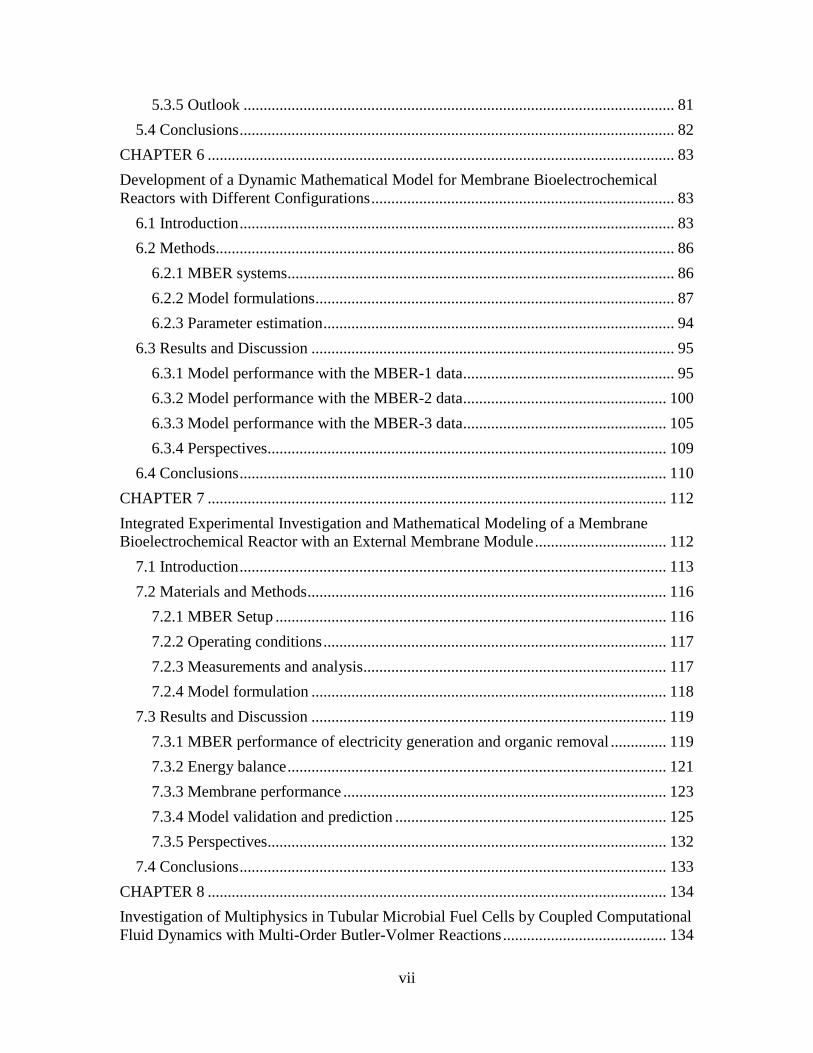
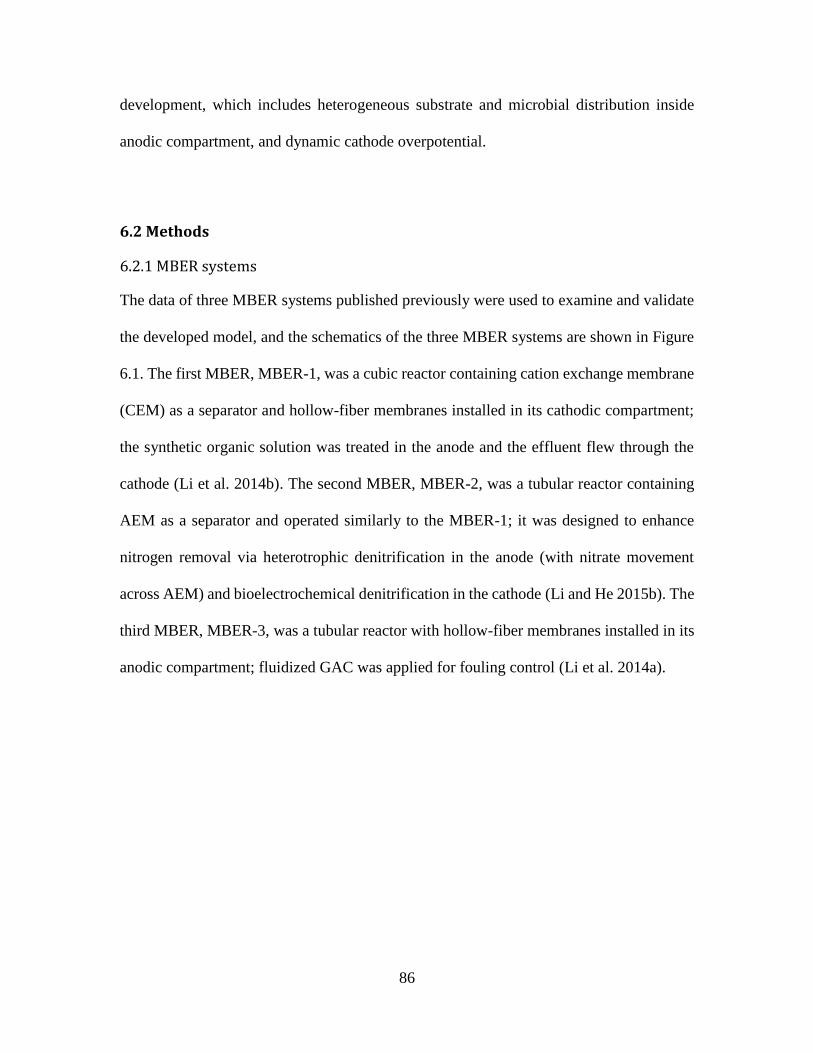
6.2.1 MBER systems
The data of three MBER systems published previously were used to examine and validate
the developed model, and the schematics of the three MBER systems are shown in Figure
6.1. The first MBER, MBER-1, was a cubic reactor containing cation exchange membrane
(CEM) as a separator and hollow-fiber membranes installed in its cathodic compartment;
the synthetic organic solution was treated in the anode and the effluent flew through the
cathode (Li et al. 2014b). The second MBER, MBER-2, was a tubular reactor containing
AEM as a separator and operated similarly to the MBER-1; it was designed to enhance
nitrogen removal via heterotrophic denitrification in the anode (with nitrate movement
across AEM) and bioelectrochemical denitrification in the cathode (Li and He 2015b). The
third MBER, MBER-3, was a tubular reactor with hollow-fiber membranes installed in its
anodic compartment; fluidized GAC was applied for fouling control (Li et al. 2014a).
87
6.2.2 Model formulations
6.2.2.1 Mass Balance for substrate, Microorganisms, and Electron Mediators in the Anode
The mass balance is established by applying multiplicative Monod kinetics for microbial
growth (Pinto et al. 2010). An intracellular redox mediator is assumed to be generated by
anodophillic bacteria to aid transfer of the electrons which were produced from substrate
degradation. To simplify the process of model formulation, a well mixing condition is
assumed in both chambers, and ordinary differential equation (ODE) is used to calculate
Figure 6.1 Schematics of the previously developed membrane bioelectrochemical reactors (MBERs): (A) MBER-1, hollo-fiber membranes installed in the cathode; (B)
MBER-2, enhanced nitrogen removal with AEM; (C) MBER-3, fluidized GAC in the anode
88
the concentration of substrate, anodophillic and methanogenic microorganism in the anode
compartment.
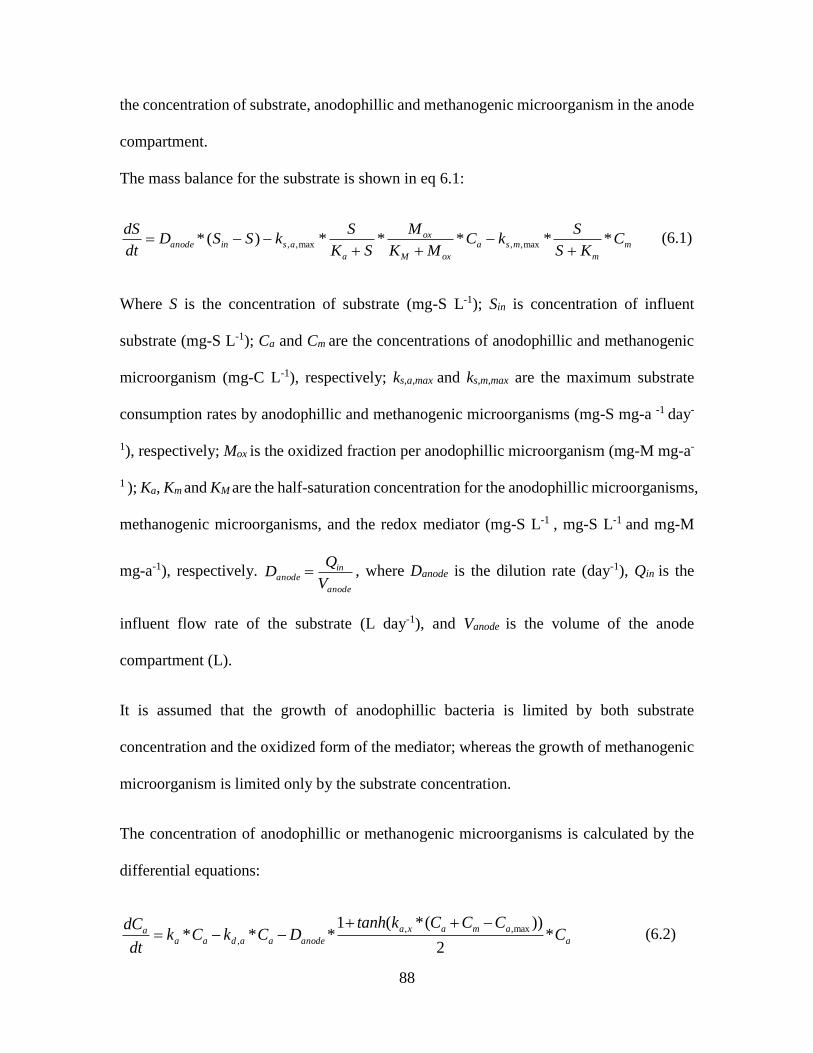
The mass balance for the substrate is shown in eq 6.1:
m
m
msa
oxM
ox
a
asinanode CKS
SkC
MK
M
SK
SkSSD
dt
dS*****)(* max,,max,,
(6.1)
Where S is the concentration of substrate (mg-S L-1); Sin is concentration of influent
substrate (mg-S L-1); Ca and Cm are the concentrations of anodophillic and methanogenic
microorganism (mg-C L-1), respectively; ks,a,max and ks,m,max are the maximum substrate
consumption rates by anodophillic and methanogenic microorganisms (mg-S mg-a -1 day-
1), respectively; Mox is the oxidized fraction per anodophillic microorganism (mg-M mg-a-
1 ); Ka, Km and KM are the half-saturation concentration for the anodophillic microorganisms,
methanogenic microorganisms, and the redox mediator (mg-S L-1 , mg-S L-1 and mg-M
mg-a-1), respectively. anode
inanode
V
QD , where Danode is the dilution rate (day-1), Qin is the
influent flow rate of the substrate (L day-1), and Vanode is the volume of the anode
compartment (L).
It is assumed that the growth of anodophillic bacteria is limited by both substrate
concentration and the oxidized form of the mediator; whereas the growth of methanogenic
microorganism is limited only by the substrate concentration.
The concentration of anodophillic or methanogenic microorganisms is calculated by the
differential equations:
a
amaxa
anodeaadaaa C
CCCktanhDCkCk
dt
dC*
2
))(*(1***
max,,
,
(6.2)
89
m
mmaxm
anodemmdmmm C
CCCktanhDCkCk
dt
dC*
2
))(*(1***
max.,,
,
(6.3)
where kd,a and kd,m are decay rates of the microorganisms (day-1); ka,x and km,x are the
steepness factors for anodophillic microorganisms (L mg-a -1) and methanogenic
microorganisms (L mg-m -1) for the biofilm retention; Ca,max and Cm,max are the maximum
attainable concentration for anodophillic microorganisms (mg-a L-1) and methanogenic
microorganisms (mg-m L-1); ka and km are the growth rates of microorganisms (day-1)
calculated by eq. 6.4 and 6.5:
oxM
ox
a
aaMK
M
SK
Skk
**max,
(6.4)
SK
Skk
m
mm
*max, (6.5)
Where ka,max and km,max are the maximum microorganism growth rates (day -1)
The intercellular materials balance for the oxidized mediator can be described as follows:
FnCV
IkY
dt
dM
eaanode
asMox
***
** ,
(6.6)
redoxtotal MMM (6.7)
where Mtotal is the total mediator fraction per microorganisms (mg-M mg-a-1); Mred is the
reduced mediator fraction per microorganisms (mg-M mg-a-1); Ym is the mediator yield
(mg-M mg-S-1); γ is the mediator molar mass (mg-M mole-M-1); I is the current through
the circuit of an MBER (A); F is the Faraday constant (A day mole-1); and ne is number of
electrons transferred per mole of mediator (mole -e mole-M-1).
90
6.2.2.2 Electrical generation
The overall cell voltage in an MBER is modeled by the following equation:
int** RIOPOPOPVRI conccathodeanodeocext (6.8)
Where Rext is the external resistance (Ω); Voc is the open circuit voltage (V); OPanode is the
anode overpotential (V); OPcathode is the cathode overpotential (V); OPconc is the
concentration overpotential; Rint is the internal resistance (Ω).
Usually, Rint includes mass transfer resistance, ohmic resistance, and activation resistance.
In present study, the internal resistance was calculated as follows:
ar CkeRRRR
*
min)maxminint *(
(6.9)
Where Rmin and Rmax are the minimum and maximum internal resistance (Ω), and kr is the
constant that determines how fast the internal resistance respond to the change in
microorganism concentration Ca (L mg-a-1).
The open circuit voltage was calculated as:
)*/(1
minmaxmin *)( ar Ck
oc eVVVV
(6.10)
Where Vmin and Vmax are the lowest and highest observed Voc values (V).
The concentration overpotential is assumed to be associated with electron mediators and
could be modeled as follows:
red
totalconc
M
M
F
TROP ln*
* (6.11)
91
It is noteworthy that the anode overpotential and cathode overpotential have been neglected,
due to the sufficient buffer solution in both chambers. Hence, the current generation
equation is simplified to be as follows:
intRR
OPVI
ext
concoc
(6.12)
6.2.2.3 Membrane fouling
6.2.2.3.1 Membrane simulation of MBER-1
Due to the similarity of system configuration, sMBR models are used for membrane
performance prediction. Being as a stand-alone technology, sMBR models include
aeration, cake formation, filtration, fouling, physical and bioprocess description. The total
membrane fouling is represented by combining cake layer resistance (Rcake), intrinsic
resistance (Rm) and resistance which is caused by total resistance disturbance (δR). However,
the formation of cake layer is usually responsible for membrane fouling issue (Khan et al.
2009).
mtotal RR + cakeR + R ≈ cakeR (6.13)
where the cake layer resistance is calculated by:
)(* 0
A
mmRcake
(6.14)
where ρ is the specific cake layer resistance (m g-1); m0 is the initial cake mass (g); A is the
area of the membrane surface and m is the current cake mass (g).
The calculation of the transmembrane pressure is expressed as follow:
totalout RQP ** (6.15)
92
where ∆P is the trans-membrane pressure (Pa); η is the water apparent viscosity (Pa.S);
Qout is effluent rate (m3 day-1).
The change of the cake layer mass can be expressed:
mJXQdt
dmairairout *** (6.16)
mK
m
air
air
* (6.17)
where X is the concentration of the suspended solids (g m-3); Jair is the air crossflow (m3 m-
2 day-1); β is the linked to the resistance of the cake to detachment (m-1); Kair is the half
saturation coefficient of air flow (g).
The biological activity is described involving one biomass growing on a limited substrate.
)(**)(*1
SSV
QXS
Ydt
dSin
in (6.18)
SK
SSS
s *)()( max (6.19)
mV
JX
V
QX
V
QX
V
QS
dt
dX airoutin
inW *****))(( (6.20)
where Y is yield coefficient of the substrate consumption; µ(S) is the microbial growth rate
(day -1); µ(S)max is the maximum microbial growth rate (day-1); Qin is the inflow rate (m3
day-1); V is the volume of the cathode chamber (m3); Sin is the substrate concentration in
the influent flow; S is the substrate concentration (g m-3); Ks is the half saturation of
substrate (g m-3); Qw is the waste flux (m3 day-1); and Xin is the solid concentration in the
influent (g m-3).
93
The parameter β represents the ease (or difficulty) of detaching the cake from the
membrane using an air crossflow.
*dt
d (6.21)
6.2.2.3.2 Membrane simulation for the fluidized-bed MBER-3
A previous study was used to develop and predict membrane fouling problem in the
fluidized MBER system (Liu et al. 2003). The membrane fouling rate under various
hydrodynamic conditions has been estimated.
The filtration resistance is calculated as an indicator for membrane fouling status:
J
PR
**10*6.3 9
(6.22)
Where R is the filtration resistance (m-1), J is filtration flux (L m-2 h-1), ∆P was the
transmembrane pressure (Pa). The η is approximately expressed by the viscosity of tap
water and is calculated as follows:
Te *021.0*6003.1 (6.23)
Where T is the temperature of water.
It is assumed that the membrane filtration resistance increases with time during the
filtration, and the increasing rate of resistance K is obtained as a slope of the straight line
to the changing course of the measured resistance.
The increase rate of resistance K is calculated as follows:
edc
Lr XJUfK *** (6.24)
94
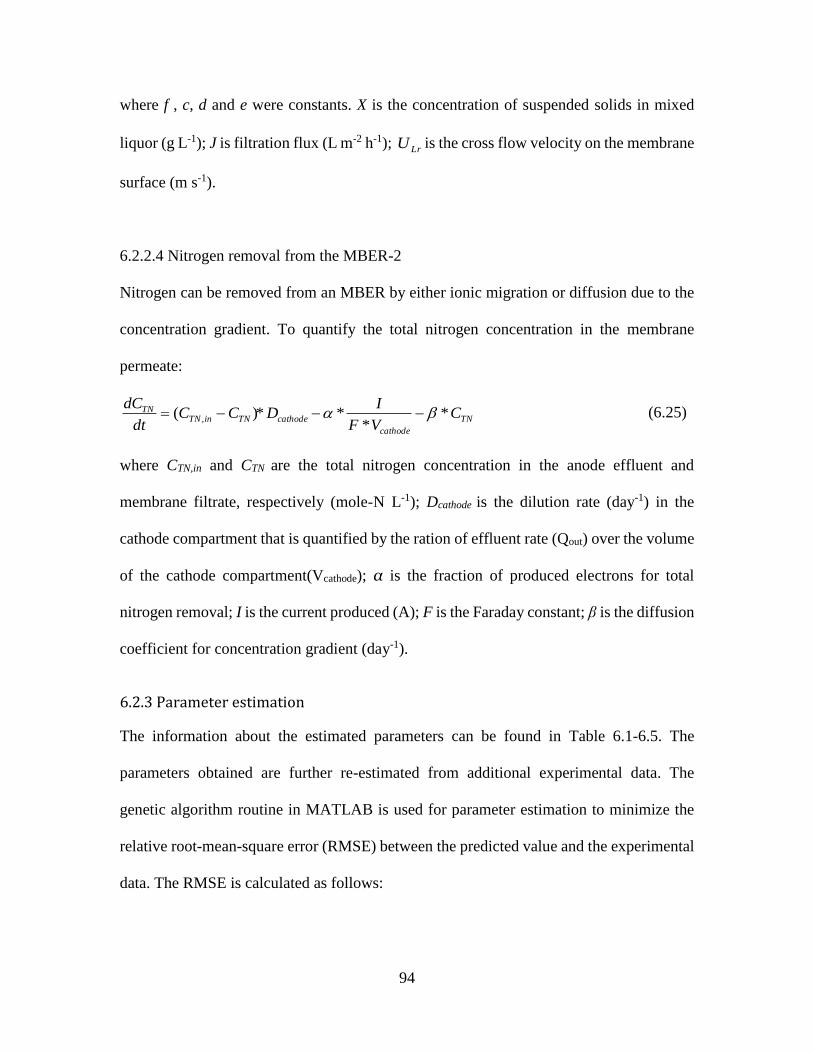
where f , c, d and e were constants. X is the concentration of suspended solids in mixed
liquor (g L-1); J is filtration flux (L m-2 h-1); LrU is the cross flow velocity on the membrane
surface (m s-1).
6.2.2.4 Nitrogen removal from the MBER-2
Nitrogen can be removed from an MBER by either ionic migration or diffusion due to the
concentration gradient. To quantify the total nitrogen concentration in the membrane
permeate:
TN
cathode
cathodeTNinTNTN C
VF
IDCC
dt
dC*
***)( , (6.25)
where CTN,in and CTN are the total nitrogen concentration in the anode effluent and
membrane filtrate, respectively (mole-N L-1); Dcathode is the dilution rate (day-1) in the
cathode compartment that is quantified by the ration of effluent rate (Qout) over the volume
of the cathode compartment(Vcathode); α is the fraction of produced electrons for total
nitrogen removal; I is the current produced (A); F is the Faraday constant; β is the diffusion
coefficient for concentration gradient (day-1).
6.2.3 Parameter estimation
The information about the estimated parameters can be found in Table 6.1-6.5. The
parameters obtained are further re-estimated from additional experimental data. The
genetic algorithm routine in MATLAB is used for parameter estimation to minimize the
relative root-mean-square error (RMSE) between the predicted value and the experimental
data. The RMSE is calculated as follows:
95
)max(
)(1
2
e
N
i em
y
N
yy
RMSE
(6.26)
where N is the total number sampling time points in the simulation; ym and ye represents
model predicted values and experimental data at ti, respectively. The maximum value of
experimental data was used to normalize the error in equation 6.26. A smaller RMSE
indicates that model has a good fit to experimental data. It is also worthy to note that
MATLAB function ODE 23 is applied to solve all of differential equation in our study.
6.3 Results and Discussion
6.3.1 Model performance with the MBER-1 data
The developed model was examined with the data of the MBER-1 that was operated under
a hydraulic full loop mode and the flow rate of its anode feeding was adjusted at 0.23, 0.39
and 0.23 mL min-1 on day 20, 66 and 78, respectively, resulting in an anodic HRT of 10, 6
and 10 h. The model output of current value shows a general agreement with the
experimental measurement, but some underestimation and overestimation can be seen
(Figure 6.2 A). The RMSE indicated that the mean error for the current generation was
within 15.2% of their maximum value during first 46 days. Such a discrepancy can be from
the mismatch at the early period: the current simulation was started from day 20 of the
MBER operation, and a sharp decrease in the modeled current occurred in a short period
of time afterward. The initial anodophillic bacteria concentration was estimated as 345.3
mg L-1, and the lagging time of bacteria growth resulted in a temporary drop of current
generation; when the anodophillic bacteria concentration reached a steady state, a stable
current generation was achieved as a result. The simulated current generation increased by
96
0.5 mA from day 66, as a response to enhanced organic loading rate, but overestimation
can be observed and the RMSE for the current generation was 20.8%. The formulated
model has a high sensitivity to the change of organic loading rate, but the experiment did
not respond correspondingly, possibly related to the fact that a large amount of organic
compounds was consumed by microorganisms rather than anodophillic bacteria. The
predicted current generation was below 4 mA after the feeding flowrate was changed back
to 0.23 mL min-1 on day 78 with slight overestimation and a RMSE of 18.4%.
The predicted TMP profile had a very good fit to the experimental data (Figure 6.2 B), and
the relative RMSE was 11.3% when the system was operated at an anodic HRT of 10 h
from day 20 to 66. The simulated TMP experienced a dynamic process, in which it started
from 5 kPa on day 20, increased to a peak value of 8 kPa on day 40, and then dropped back
to 5 kPa. The underestimation of the TMP during the starting period was likely related to
the formation of membrane fouling. The arch shape of the TMP change can be explained
from eq 6.16, in which the first term represents the attachment of total suspended solids on
the membrane surface depending on the effluent rate, and the second term in the equation
represents cake detachment proportional to the air cross flow. The eq 6.16 indicates that
the change of cake layer mass is proportional to the instantaneous cake layer mass, with a
factorial of 2. Hence, the change of cake layer mass follows a parabolic shape and “archy”
shape is a portion of the parabola. The change of TMP was less obvious in the experimental
measurements due to the method of TMP recording (data were recorded manually three
times a day, and the average value was used for analysis). The developed model was further
evaluated and validated for TMP by changing the feeding rate to 0.39 mL min-1 on day 66
97
and then to 0.23 mL min-1 on day 78 in a step-wise way. The model prediction for TMP
generally followed the trend of experimental data, and the simulated TMP increased from
14 to 25 kPa before the anode feeding rate was changed back to 0.23 mL min-1. During this
period, a linearized change of TMP indicates that the enhanced water flux played a
dominant role for cake layer accumulation on the membrane surface, and cake mass
detachment from air crossflow became a marginal effect due to a higher vacuum pressure
after water flux adjustment. The change of cake layer mass is proportional to water flux by
a factorial of 1, resulting in a linearized TMP change. The simulated TMP dropped back to
10 kPa along with reduced water flux after the anolyte was fed at 0.23 mL min-1 again on
day 78; it is worth noting that the TMP began to increase from an initial TMP of 10 kPa,
higher than 5 kPa on day 20, likely because of irreversible fouling. The model gave a fairly
good prediction on TMP variation with a low RMSE of 5.4% during the final period.
98
Figure 6.2 Experimental data and model simulation of the MBER-1 (A) current generation; (B) TMP change
99
Parameters Description Value Units
F Faraday constant 96,485 C mol-1
R Ideal gas constant 8.314 J K-1 mol-1
T Temperature 298.15 K
Y Yield of anodophillic 10.5 mg-M mg-S-1
YCH4 Methane Yield 0.3 mL CH4 mg-S-1
qmax,a Maximum anodophillic reaction rate 2.32 mg-S mg-x-1 d-1
qmax,m Maximum methanogenic reaction rate 8.2 mg-S mg-x-1 d-1
µmax, a Maximum anodophillic growth rate 0.797 d-1
µmax, m Maximum methanogenic growth rate 0.1 d-1
Ks,a Half-rate constant of anodophillic 20 mg-S L-1
Ks,m Half-rate constant of methanogens 80 mg-S L-1
m Electrons transfer per mol of mediator 2 mol-1 mol mediator -1
γ Mediator molar mass 663,400 mg-M mol mediator-1
Mtotal Mediator fraction 0.05 mg-M mg-x-1
KM Mediator half rate constant 0.01 mg-M L-1
Kd,a Decay rate of anodophillic microorganism 0.02*µmax,a d-1
Kd,m Decay rate of methanogenic microorganism 0.02*µmax,m d-1
Xmax,a Anodophillic biofilm space limitation 512.5 mg-x L-1
Xmax,m Methanogenic biofilm space limitation 525 mg-x L-1
Kx Steepness Factor 0.04 L mg-x-1
Rmin Minimum internal resistance 31 Ω
Rmax Maximum internal resistance 2000 Ω
Emin Minimum open circuit potential 0.1 V
Emax Maximum open circuit potential 0.7 V KR steepness factor correction coefficient 0.0818 L mg-x-1
Table 6.1 Parameters of the MBER-1 for electrical performance
100
Parameters Description Value Units
η Water apparent viscosity 0.00089 Pa.S
A Membrane surface area 0.0051 m-2
ρ Specific cake resistance 100000000 m g-1
γ Coefficient of β 0.05
Y Yield coefficient of the substrate consumption 1.4 mg-Mmg-S-1
µs,max Maximum growth rate 0.09 d-1
Jair Air crossflow 80 m3 m-2 d-1
Ks Half saturation of substrate 10 g m-3
Kair Half saturation of airflow 4.6*10-5 g m-3
β Resistance of detachable cake by air crossflow 0.01 m-1
Q Inflow 0.000336 m3 d-1
V Volume of cathodic compartment 0.00022 m3
6.3.2 Model performance with the MBER-2 data
The MBER-2 was a modified MBER-1 with AEM as a separator for enhancing nitrogen
removal through nitrate migration driven by electricity generation and denitrification.
Thus, nitrogen was a new parameter for the model to include. This MBER was fed with an
anolyte at 1.34 mL min-1 in a hydraulic full loop mode until day 60. The developed model
gave good prediction on current generation from a synthetic solution with slight
overestimation and a low RMSE of 10.7% (Figure 6.3 A). The using of carbon brush and
enhanced separator area resulted in an improved electrical performance (compared to the
MBER-1). The substrate consumption in the anodic chamber was also simulated (Figure
6.3 B), and the simulated results suggest that the MBER-2 almost reached a steady state in
40 days with a low concentration of residual COD. It should be noted that the measurement
was taken once a week, and future studies to improve the developed model will require
more frequent measurement. Cake mass accumulation endured a dynamic process, in
Table 6.2 Parameters of the MBER-1 for membrane performance
101
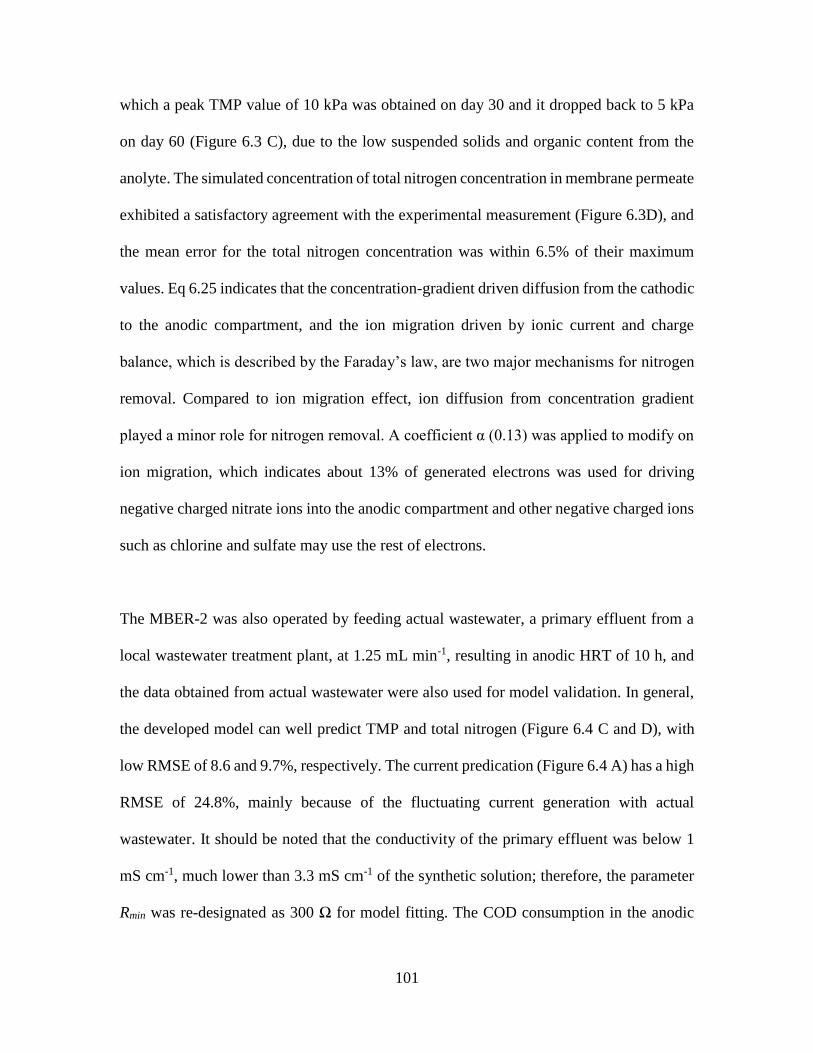
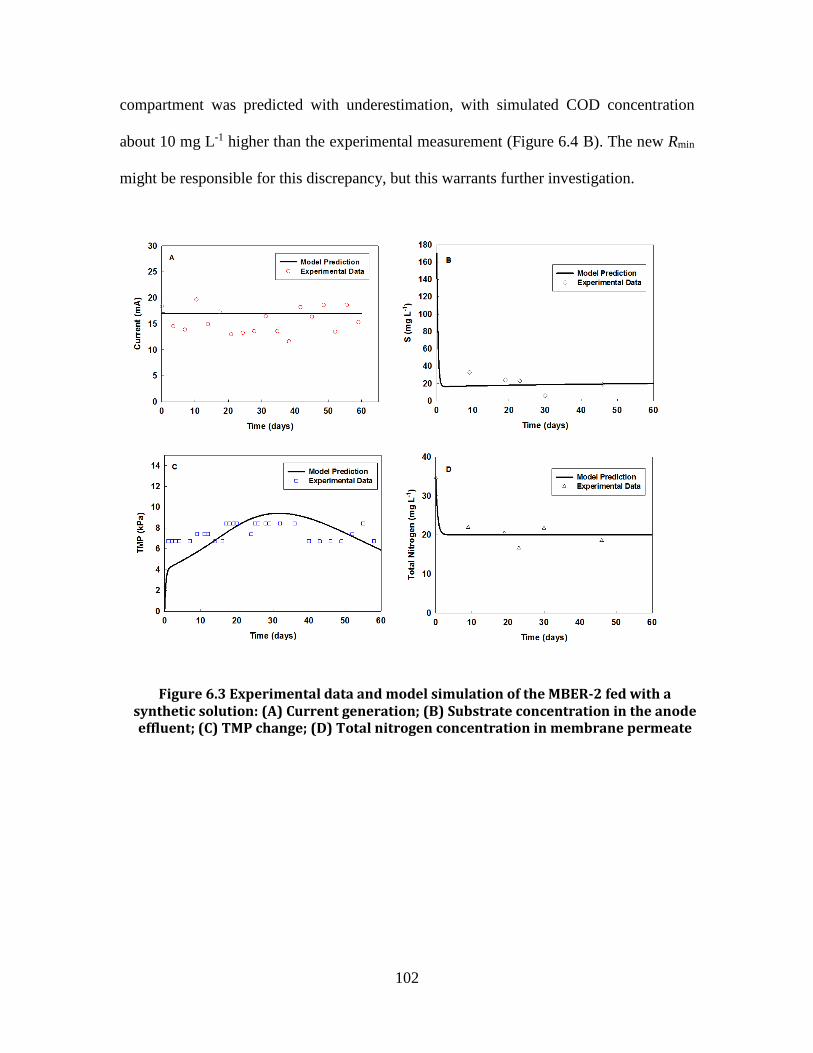
which a peak TMP value of 10 kPa was obtained on day 30 and it dropped back to 5 kPa
on day 60 (Figure 6.3 C), due to the low suspended solids and organic content from the
anolyte. The simulated concentration of total nitrogen concentration in membrane permeate
exhibited a satisfactory agreement with the experimental measurement (Figure 6.3D), and
the mean error for the total nitrogen concentration was within 6.5% of their maximum
values. Eq 6.25 indicates that the concentration-gradient driven diffusion from the cathodic
to the anodic compartment, and the ion migration driven by ionic current and charge
balance, which is described by the Faraday’s law, are two major mechanisms for nitrogen
removal. Compared to ion migration effect, ion diffusion from concentration gradient
played a minor role for nitrogen removal. A coefficient α (0.13) was applied to modify on
ion migration, which indicates about 13% of generated electrons was used for driving
negative charged nitrate ions into the anodic compartment and other negative charged ions
such as chlorine and sulfate may use the rest of electrons.
The MBER-2 was also operated by feeding actual wastewater, a primary effluent from a
local wastewater treatment plant, at 1.25 mL min-1, resulting in anodic HRT of 10 h, and
the data obtained from actual wastewater were also used for model validation. In general,
the developed model can well predict TMP and total nitrogen (Figure 6.4 C and D), with
low RMSE of 8.6 and 9.7%, respectively. The current predication (Figure 6.4 A) has a high
RMSE of 24.8%, mainly because of the fluctuating current generation with actual
wastewater. It should be noted that the conductivity of the primary effluent was below 1
mS cm-1, much lower than 3.3 mS cm-1 of the synthetic solution; therefore, the parameter
Rmin was re-designated as 300 Ω for model fitting. The COD consumption in the anodic
102
compartment was predicted with underestimation, with simulated COD concentration
about 10 mg L-1 higher than the experimental measurement (Figure 6.4 B). The new Rmin
might be responsible for this discrepancy, but this warrants further investigation.
Figure 6.3 Experimental data and model simulation of the MBER-2 fed with a synthetic solution: (A) Current generation; (B) Substrate concentration in the anode effluent; (C) TMP change; (D) Total nitrogen concentration in membrane permeate
103
Figure 6.4 Experimental data and model simulation of the MBER-2 fed with actual wastewater (primary effluent): (A) Current generation; (B) Substrate concentration
in anode effluent; (C) TMP change; (D) Total nitrogen in membrane permeate
104
Parameters Description Value Units
F Faraday constant 96,485 C mol-1
R Ideal gas constant 8.314 J K-1 mol-1
T Temperature 298.15 K
Y Yield of anodophillic 17.1 mg-M mg-S-1
YCH4 Methane Yield 0.3 mL CH4 mg-S-1
qmax,a Maximum anodophillic reaction rate 5.32 mg-S mg-x-1 d-1
qmax,m Maximum methanogenic reaction rate 8.2 mg-S mg-x-1 d-1
µmax, a Maximum anodophillic growth rate 0.797 d-1
µmax, m Maximum methanogenic growth rate 0.1 d-1
Ks,a Half-rate constant of anodophillic 20 mg-S L-1
Ks,m Half-rate constant of methanogens 80 mg-S L-1
m Electrons transfer per mol of mediator 2 mol-1 mol mediator -1
γ Mediator molar mass 663,400 mg-M mol mediator-1
Mtotal Mediator fraction 0.05 mg-M mg-x-1
KM Mediator half rate constant 0.01 mg-M L-1
Kd,a Decay rate of anodophillic microorganism 0.02*µmax,a d-1
Kd,m Decay rate of methanogenic
microorganism 0.02*µmax,m d-1
Xmax,a Anodophillic biofilm space limitation 512.5 mg-x L-1
Xmax,m Methanogenic biofilm space limitation 525 mg-x L-1
Kx Steepness Factor 0.04 L mg-x-1
Rmin Minimum internal resistance 31 Ω
Rmax Maximum internal resistance 2000 Ω
Emin Minimum open circuit potential 0.1 V
Emax Maximum open circuit potential 0.7 V
KR Steepness factor correction coefficient 0.0818 L mg-x-1
Table 6.3 Parameters of the MBER-2 for electrical performance
105
Parameters Description Value Units
η Water apparent viscosity 0.00089 Pa S
A Membrane surface area 0.0261 m-2
ρ Specific cake resistance 100000000 m g-1
γ Coefficient of β 0.05
Y Yield coefficient of the substrate consumption 1.2 mg-M mg-S-1
µs,max Maximum growth rate 0.12 d-1
Jair Air crossflow 120 m3 m-2 d-1
Ks Half saturation of substrate 10 g m-3
Kair Half saturation of airflow 4.6*10-5 g m-3
β Resistance of detachable cake by air crossflow 0.01 m-1
Q Inflow 0.0019 m3 d-1
V Volume of cathodic compartment 0.001 m3
Dn Diffusion coefficient for nitrate ions through AEM 0.0293 d-1
αn Fraction of electrons for nitrate ions migration 0.13
6.3.3 Model performance with the MBER-3 data
The MBER-3 was a fluidized bed system with GAC as media. The fluidized GAC was
affected by the anolyte recirculation, and thus recirculation strategy was examined. The
developed model showed a satisfactory agreement of current prediction with the
experimental measurement and its RMSE was within 8.8% of their maximum value (Figure
6.5 A). The slight overestimation of current between day 10 and 43 was related to the
assumption that a homogeneous condition for substrate and biomass distribution is always
valid, even though the absence of recirculation flow may retard substrate transfer to
electrode surface. A significant mismatch with a high RMSE of 55.7% was observed on
day 63 when the anodic HRT was changed to 5 h. Such a discrepancy was likely related to
several factors: the stacked GAC in the anodic chamber may have offset the effect of the
enhanced flowrate of feeding solution; the electrochemically-active biofilm on the
electrode surface may require longer time for acclimating to new hydraulic condition;
Table 6.4 Parameters of the MBER-2 for membrane and nutrients removal performances
106
and/or the enhanced organics could be consumed by the non-electrochemically-active
microorganism on the GAC surface (which could be dominate in a mixed culture system).
The model gave a very good prediction for TMP change with a low RMSE of 9.0% (Figure
6.5 B). The change of filtration resistance (R) correlates to water flux (J) and hydraulic
cross flow (ULr), which has been shown in eq. 6.23 and 6.25. The change of membrane
resistance rate (K) is proportional to water flux by a factorial of 0.38 and to hydraulic cross
flow inversely by a factorial of 1.1. The increase of TMP has been expressed in a linearized
way after the recirculation flow was stopped, and the effect of ULr can be neglected due to
the extremely low cross-flow on membrane surface. Therefore, since day 10, TMP has
been increasing along with a slope, mainly determined by water flux. Water flux might
have a minor effect after the recirculation flow was re-started, due to the quantitative
relationship between J and ULr. Hence, filtration resistance is determined by hydraulic cross
flow in an inverse relationship, and a low TMP can be seen between day 43 to 63. The
model prediction of TMP was also validated after the MBER system was fed at 2.33 mL
min-1 on day 63, and based on the model results, hydraulic cross-flow still could have
played a dominant role for membrane fouling control.
The effects of multiple factors were studied focusing on water flux (J) and hydraulic cross
flow on membrane surface (ULr), where these two parameters are changed simultaneously
for evaluating filtration resistance change (Figure 6.6). The simulation results show that a
higher water flux can be compensated by increasing the recirculation rate. It is
demonstrated that for a fixed water flux, the change of membrane resistance K decreases
107
upon the increase of hydraulic cross flow at 0.0005 m s-1 , corresponding to 630 mL min-1
recirculation flow in this MBER. The membrane has a minor fouling issue (or it requires a
long time for noticeable fouling) when a recirculation flow rate is higher than 630 mL min-
1. However, for a fixed recirculation flow rate lower than 630 mL min-1, the change of
filtration resistance increases upon the increase of water flux. Therefore, controlling
recirculation flow rate at 630 mL min-1 can be an optimum operation method to minimize
membrane fouling issue, thereby extending membrane’s lifetime and reducing energy
consumption, in the absence of aeration and chemical cleaning.
Figure 6.5 Experimental data and simulation results of the MBER-3 (A) Current generation; (B) TMP change.
108
Figure 6.6 Model simulation of the effects of multiple factors including membrane filtration resistance (K), cross-flow velocity (Ulr) and water flux (J)
109
Parameters Description Value Units
F Faraday constant 96,485 C mol-1
R Ideal gas constant 8.314 J K-1 mol-1
T Temperature 298.15 K
Y Yield of anodophillic 2.04 mg-M mg-S-1
YCH4 Methane Yield 0.3 mL CH4 mg-S-1
qmax,a Maximum anodophillic reaction rate 6.32 mg-S mg-x-1 d-1
qmax,m Maximum methanogenic reaction rate 8.2 mg-S mg-x-1 d-1
µmax, a Maximum anodophillic growth rate 0.797 d-1
µmax, m Maximum methanogenic growth rate 0.1 d-1
Ks,a Half-rate constant of anodophillic 20 mg-S L-1
Ks,m Half-rate constant of methanogens 80 mg-S L-1
m Electrons transfer per mol of mediator 2 mol-1 mol mediator -1
γ Mediator molar mass 663,400 mg-M mol mediator-1
Mtotal Mediator fraction 0.05 mg-M mg-x-1
KM Mediator half rate constant 0.01 mg-M L-1
Kd,a Decay rate of anodophillic microorganism 0.02*µmax,a d-1
Kd,m Decay rate of methanogenic microorganism 0.02*µmax,m d-1
Xmax,a Anodophillic biofilm space limitation 512.5 mg-x L-1
Xmax,m Methanogenic biofilm space limitation 525 mg-x L-1
Kx Steepness Factor 0.04 L mg-x-1
Rmin Minimum internal resistance 31 Ω
Rmax Maximum internal resistance 2000 Ω
Emin Minimum open circuit potential 0.1 V
Emax Maximum open circuit potential 0.7 V
KR steepness factor correction coefficient 0.0818 L mg-x-1
J Water flux 4.2 L m-2 h-1
f Constant in eq. 25 89330000
ULr Hydraulic crossflow on membrane surface 0.000634 m s-1
c Constant in eq. 25 -1.1
d Constant in eq. 25 0.376
e Constant in eq. 25 0.532
X Suspended solids concentration in the mixed liquor 200 mg L-1
6.3.4 Perspectives
This work represents the first attempt to model membrane bioelectrochemical systems and
the developed model can effectively predict the key parameters of an MBER such as
Table 6.5 Parameters of the MBER-3 for electrical and membrane performance
110
current generation, substrate consumption and TMP. However, limitations still exist in the
current model. For example, the present model is based on the assumption that a
homogeneous condition has been well established within an MBER; although this
assumption simplifies simulation and calculation procedures, such an ideal condition
cannot be easily obtained with real operation. In addition, the model assumes that the
overpotential of both anode and cathode electrodes are kept constant in a low range, which
may not always be the case because the residual organics from the anode chamber can act
as a source of organics for the microbial simulation in the cathode and as a result the
overpotential will vary. Furthermore, other factors such as nitrogen consumption due to the
microbial synthesis have not been accounted for total nitrogen simulation. Future studies
will optimize and advance this MBER model from several aspects: (1) complex substrates
and substrate gradient, and heterogeneous spatial distribution of microorganism will be
considered; (2) dynamic variation of electrode overpotential will be included; (3) other
biological processes such as denitrification should be included for the organic consumption;
and (4) the model will be used to guide the system scaling up for developing large-scale
MBER system for treating actual wastewater.
6.4 Conclusions
A dynamic mathematical model has been developed and used to simulate/predict the key
parameters of the MBER systems, such as current generation, substrate consumption,
membrane fouling, and nitrogen removal. It was adjusted to successfully model three
different types of MBER systems with distinct features such as nitrogen removal and
fluidized GAC. The model gave a satisfactory agreement with experimental data, but some
111
under/over estimation was observed. The results of this work encourages further
optimization of this MBER model through including more dynamic factors and ultimately
the model can guide the development of large-scale MBER systems for actual wastewater
treatment.
112
CHAPTER 7
Integrated Experimental Investigation and Mathematical Modeling of a Membrane Bioelectrochemical Reactor with an External Membrane Module
(This section has been published as: Li, J. Rosenberger, G and He, Z.* (2015) Integrated
Experimental Investigation and Mathematical Modeling of a Membrane
Bioelectrochemical Reactor with an External Membrane Module. Chemical Engineering
Journal. Vol 287, pp 321-328.)
Abstract
Membrane bioelectrochemical reactors (MBER) integrate membrane filtration module into
microbial fuel cells (MFCs) to achieve simultaneous wastewater treatment, bioenergy
production, and high-quality effluent. Previous MBERs usually have membrane modules
as a part of the MFC reactors that creates challenges for membrane cleaning. In this study,
an MBER with an external membrane module was investigated through both experiments
and mathematical modeling. This MBER produced a current density of 7.1±0.5 A m-3 with
an anolyte recirculation of 90 mL min-1; reducing the anolyte recirculation rate had a
negligible effect on MBER’s electrical performance but resulted in a positive energy
balance of 0.003±0.002 kWh m-3. Periodic backwashing (1 min-backwashing/15 min-
operation) was demonstrated as an effective method for fouling control. A mathematical
model was developed and validated using the experimental data. The model could predict
the influence of key parameters such as influent organic concentration and anolyte flow
rate on the current generation, and identify the maximum organic loading rate for current
generation. Those results encourage further investigation and development of this MBER
towards system scaling up.
113
7.1 Introduction
Membrane bioelectrochemical reactors (MBERs) are a newly emerged technology for
sustainable wastewater treatment and resource recovery (Yuan and He 2015). An MBER
is a combination of bioelectrochemical system (BES), such as microbial fuel cells (MFCs),
with membrane separation. Thus, the technology inherits the advantages of both BES and
membrane treatment (e.g., membrane bioreactors), and can directly generate electricity and
produce a high-quality effluent. MBERs have been demonstrated in various studies. For
example, biofilm was formed on the stainless steel mesh as a filtration material to achieve
high organics and nutrient removal (Wang et al. 2011b, Wang et al. 2012). Commercial
ultrafiltration hollow fiber membrane was integrated into a tubular MFC, either in the
anode or the cathode (Ge et al. 2013b, Li et al. 2014b, Li and He 2015b). The MBER
operation can generate energy and require low energy input, thereby creating an energy
neutral treatment system. It was estimated that net electricity could be recovered from
treating a low-strength synthetic wastewater after eliminating aeration process in the
cathode chamber of an MBER (Wang et al. 2013). Increasing organic loading rate by
decreasing hydraulic retention time (HRT) can also diminish the gap between energy
consumption and production because of more energy production (Ge et al. 2013b).
Membrane fouling poses a great challenge to MBER operation, especially when
membranes are integrated with BES in an internal configuration. It was reported that
foulants could accumulate on the membrane surface rapidly when the membrane was
installed in the anodic compartment of an MBER, and severe fouling occurred in two weeks
with a rapid TMP increase from 0 to 50 kPa (Ge et al. 2013b). Coating polydopamine on
membrane surface to increase hydrophobicity (Kim et al. 2014b) or lowering particle zeta
114
potential to increase electro-repulsion force (Tian et al. 2015) have been demonstrated to
control membrane fouling effectively, but a long-term operation should be examined on
membrane fouling. Fluidized bed granular activated carbon (GAC) was applied in the
anodic compartment of an MBER to reduce transmembrane pressure (Li et al. 2014a), but
the high pumping load due to the high recirculation and clogging issue after long-term
abrasion of GAC could cause maintenance issues and high energy demand.
Periodic cleaning of membranes using physical and chemical methods is necessary to
maintain a functioning membrane module, but with an internal membrane installation, in
situ cleaning becomes very difficult because of potential effects on biological and
electrochemical reactions. Thus, external linkage between BES and membrane module
may provide a flexible system in which the membrane module can be cleaned/replaced
without affecting the BES. Such a linkage was reported in two recent studies. In one study,
an air-cathode MFC was connected to an anaerobic fluidized membrane bioreactor
(AFMBR), forming a two-staged MFC-AFMBR (Ren et al. 2014). This system achieved
the removal of more than 90% total COD and almost 100% total suspended solids; biogas
production in the AFMBR may compensate for energy consumption by the system. The
other study used an MFC-MBR system to treat the waste from a fermentation process that
helped recycle the water and nutrients back to the fermentation process (Li et al. 2015).
The challenge of those systems is that the external membrane module involves biological
reactions that have high requirement for operation and maintenance; in addition, the
collection of methane (and dissolved methane in the effluent) in the AFMBR (Ren et al.
115
2014) and aeration in the MBR (Li et al. 2015) may limit their application. In contrast, an
abiotic membrane module could be easier to manage.
Given much interest in MBERs and in light of the above mentioned issues of managing
membrane module, an MBER system consisting of an MFC and an abiotic membrane
module was developed and investigated through an integrated approach of experimental
investigation and mathematical modeling. The membrane module was linked to the MFC
through a unique approach to take advantage of the catholyte dripping from the MFC
(Figure 7.1). This type of tubular MFCs with dripping catholyte has been extensively
demonstrated in previous studies including a long-term operated system with actual
wastewater in a wastewater treatment plant (Ge et al. 2013c, Ge and He 2015, Yuan et al.
2015, Zhang et al. 2010, Zhang et al. 2013b). A dynamic mathematical model for MBER
has been recently developed (Li and He 2015a) and is applied with proper modification for
further understanding of the present MBER. The objectives of this study were: (1) to
demonstrate feasibility of this MBER in an energy-neutral operation; (2) to maintain low
membrane fouling with an enhanced flexibility; and (3) to apply a mathematical model to
predict MBER performance affected by organic loading rate (OLR).
116
7.2 Materials and Methods
7.2.1 MBER Setup
The proposed MBER system consisted of two units, an MFC and a (external) membrane
module (Figure 7.1). The MFC was constructed as a tubular reactor (38 cm long and 5 cm
in diameter) made of anion exchange membrane (AEM-Ultrex AMI 7001, Membrane
International. Inc, Glen Rock, New Jersey, USA). A carbon brush was installed in the
anodic chamber as an anodic electrode, resulting in a net liquid volume of 750 mL. Before
use, the carbon brush was soaked in acetone overnight, and then heated for 30 min at 450
ºC. The cathode electrode was one piece of carbon cloth (Zoltek Corporation, St. Louis,
MO, USA) coated with Pt/C powder (Etek, Somerest, NJ, USA) with a loading rate 0.2 mg
Pt cm-2. The cathode electrode wrapped the AEM membrane tube. The anode and cathode
Figure 7.1 Schematic of the membrane electrochemical reactor (MBER) consisting of a tubular microbial fuel cell (MFC) and an external membrane module under MFC
117
electrodes were connected to a 10 Ω resistor. The external membrane module was made of
Purifying Technology Co. China) that were installed in a 150 mL rectangular container,
and was set up under the MFC to collect the catholyte.
7.2.2 Operating conditions
The MBER system was operated at room temperature. Its anode was fed with a synthetic
solution containing (per L of tap water): glucose 0.25 g; NH4Cl 0.15 g; NaCl 0.5 g; MgSO4
0.015 g; CaCl2 0.02 g; KH2PO4 0.53 g; K2HPO4 1.07 g; and 1mL trace elements. The
anolyte was recirculated at 90, 50 and 20 mL min-1 on day 9, 55 and 74, respectively. The
MBER was operated in a full loop mode, in which the synthetic solution was first fed into
the anodic compartment and then the anodic effluent flowed to the cathode acting as a
catholyte. There was no recirculation applied to the catholyte. The catholyte was collected
by the membrane module, and the final permeate was extracted from the hollow-fiber
membranes. The hollow fiber membrane module was operated in 4-min working/1-min
relaxing mode; 1-min backwashing was applied in every 30-min from day 22 and in every
15-min from day 40, respectively. The flow rate of 1.25 mL min-1 was controlled by
peristaltic pumps to achieve the desired anodic hydraulic retention time (HRT) at 10 h.
7.2.3 Measurements and analysis
The MFC voltage was recorded every 5 min by a digital multimeter (2700, Keithley
Instruments, Cleveland, OH). The current and power density was normalized to the anode
liquid volume. The pH was measured using a benchtop pH meter (Oakton Instruments,
Vernon Hills, IL, USA). The conductivity was measured by a benchtop conductivity meter
(Mettler-Toledo, Columbus, OH, USA). The concentration of chemical oxygen demand
118
(COD) was measured according to the manufacturer’s procedure (Hach DR/890, Hach
Company, Loveland, CO, USA). Transmembrane pressure (TMP) was recorded manually
and the average value was reported in this study. Turbidity was measured using a
turbidimeter (DRT 100B, HF Scientific, Inc, Fort Meyers, FL, USA). Energy recovery was
evaluated by normalized energy recovery (NER) in kWh m-3 (Ge et al. 2013a, Xiao et al.
2014), a parameter for evaluating amount of energy can be generated for treating each m3
of wastewater. The estimated energy consumption by the pumping system (for feeding,
recirculating and membrane extracting) was calculated by the following equation (Kim et
al. 2011). The energy consumption was expressed based on the volume of treated
wastewater (kWh m-3). The energy balance is the gap between energy recovery and
consumption, which was also expressed based on the volume of treated wastewater (kWh
m-3).
7.2.4 Model formulation
A mathematical model is formulated by applying multiplicative Monod kinetics for
microbial growth (Ping et al. 2014, Pinto et al. 2010). Intracellular redox mediator is
assumed to be a key factor to aid electron transfer from substrate to an electrode, and a
well-mixing condition is assumed in the anodic compartment. The overall cell voltage in
MBER system is calculated by the difference between open circuit potential (Voc) and
potential loss, which includes overpotential from anode and cathode electrode,
concentration overpotential and internal resistance. Because of the sufficient buffer
solution and oxygen supply, the overpotential of the anode and the cathode electrodes has
been neglected in this model. The estimated internal resistance includes mass transfer
119
resistance, ohmic resistance and activation resistance. More information about mass
balance for substrate consumption, microorganism concentration, electron mediators and
electrical production can be found in Table 7.1 and 7.2.
7.3 Results and Discussion
7.3.1 MBER performance of electricity generation and organic removal
The MBER system was fed with a synthetic solution for 101 days, and current generation
is shown in Figure 7.2 A. The anolyte recirculation rate was gradually decreased from 90
(day 9), to 50 (day 55), and then to 20 mL min-1 (day 74). The MBER generated 7.1±0.5
A m-3 with the recirculation of 90 mL min-1. Comparing to a previous MBER that was
operated under a similar HRT (Li and He 2015b), the present MBER produced about 65.6%
less electricity, possibly because that glucose used here is more complex than acetate used
in the prior study and a lower COD concentration (250 vs. 350 mg L-1) limits substrate
transfer. Decreasing the anolyte recirculation rate to 50 mL min-1 resulted in current
generation of 7.1±1.0 A m-3, and further decrease to 20 mL min-1 produced current of
7.4±1.4 A m-3. Unlike the prior study that shows improved electricity generation with the
anolyte recirculation (Pham et al. 2008, Zhang et al. 2010) the present system was not
obviously affected by the tested anolyte recirculation rates, most likely because of those
recirculation rates are generally low. Significant improvement of the electricity generation
was obtained with a high recirculation rate of 4-12 times of the anolyte volume per minute
(Zhang et al. 2010), which is equivalent to 3,000 to 9,000 mL min-1 in the present system.
Electrolyte recirculation has been identified as a major energy consumer in a
bioelectrochemical system (Li and He 2015b, Zhang and He 2015) and thus low
120
recirculation rates are preferred from an aspect of low-energy operation. In fact, in our
ongoing large MFC system (200-L), no anolyte recirculation is applied (data not shown).
The present MBER could effectively remove organic compounds (COD), through a staged
removal in the anode, the cathode and the hollow-fiber membranes module. At the anodic
HRT of 10 h and a recirculation rate of 90 mL min-1, the anodic compartment removed
43.3±7.7% of total COD, and the cathode removed 48.2±7.2%; a final COD concentration
in the membrane permeate was 4.0±3.8 mg L-1 , resulting in an overall COD removal
efficiency of 98.4±1.5 % (Figure 7.2 B). The dripping cathode functioned as a secondary
aerobic degradation process that polished the anode effluent by removing much of residual
COD; such a removal would benefit the down-stream membrane module with less foulants.
Thus, the membrane module acted mainly as a solid-liquid separation process without
much biological reaction. Decreasing the anolyte recirculation rate to 50 or 20 mL min-1
actually enhanced the overall COD removal efficiency to 100.0±0.0%, benefited from the
improved removal by the anode (TCOD removal of 74.9±0.6 or 72.4±18.4%). Such
improvement might be related to the reduced oxygen leak into the anode through
recirculation tubing at a lower rate, but the exact reasons are not clear at this moment and
warrant further investigation. The turbidity of the membrane permeate was under 1 NTU.
121
7.3.2 Energy balance
The energy performance of the present MBER was evaluated through establishing an
energy balance. The NER of the MBER was 0.004±0.001 kWh m-3 under the recirculation
of 90 mL min-1 and the system would require 0.020 kWh energy to treat 1 m3 of the
synthetic solution; as a result, the overall energy balance was negative at -0.016±0.001
kWh m-3 (Figure 7.3). Decreasing the anolyte recirculation rate to 50 mL min-1 did not
obviously change the NER but significantly decreased the energy consumption to 0.007
Figure 7.2 The performance of the MBER fed with synthetic wastewater: (A) Current density; (B) COD concentration in different liquid stream
122
kWh m-3 , thereby achieving a final energy balance of -0.003±0.001 kWh m-3. When the
recirculation rate was further reduced to 20 mL min-1, the NER was estimated to be
0.004±0.002 kWh m-3, and the energy consumption was 0.001 kWh m-3, which was only
5.0 and 14.3% of the two previous operational modes. Correspondingly, a slightly positive
energy balance of 0.003±0.002 kWh m-3 was achieved. This result indicates that a low
anolyte recirculation rate such as 20 or 50 mL min-1 could have been sufficient for substrate
distribution in the anode chamber of the MBER, likely benefiting from its brush-containing
space that has much room for liquid flow. Despite the positive energy balance at 20 mL
min-1, energy recovery was very low and must be further improved through adding more
anode electrode materials (which could result in more impact of the anolyte recirculation
rate on energy recovery), improving the catholyte catalysts, and optimizing the operating
conditions (e.g., temperature). It is worth noting that the energy consumption due to
backwashing for membrane fouling control was small and negligible in the energy balance
calculation (estimated at 1.1×10⁻⁴ kWh m-3). The energy consumption by the MBER is
significantly lower than that of activated sludge (0.6 kWh m-3(McCarty et al. 2011) , or
aerobic MBRs (1.2-2.0 kWh m-3(Martin et al. 2011)). The anaerobic MBRs (AnMBRs)
could be energy positive, and it was estimated that a maximal 0.16 kWh energy can be
produced to treat 1 m3 wastewater by AnMBR (Smith et al. 2012); however, a strict
123
temperature control and proper strategies for extracting the dissolved methane will be
important to maximize its energy recovery with biogas.
7.3.3 Membrane performance
The TMP of the membrane module is shown in Figure 7.4 A, and the fouling control was
conducted by membrane relaxation, backwashing, and offline cleaning. The offline
cleaning was conducted by first applying soft brush to remove the attached foulants, and
then rinsing the membrane surface with tap water until the cake layer mass was detached
completely (based on visual judgment). The membrane module was connected to the MFC
on day 12 of the operation under a 4-min work/1-min relax mode, and the serious fouling
of the membrane was observed after only three days, when the TMP increased to 30 kPa
on day 14, indicating a cake layer could accumulate rapidly by only applying a periodic
relaxation to membrane. Offline cleaning was applied to reduce the TMP, which increased
repeatedly in the subsequent weeks, which required offline cleaning on day 18 and 20.
Figure 7.3 The energy production, consumption and balance of the MBER at different anolyte recirculation rates
124
From day 22, a regular backwashing flow at 2.5 mL min-1 (as double as membrane filtration
flowrate) was applied for 1 min in every 30-min operation. This strategy has clearly
delayed the TMP increase, which took about 10 days to reach 40 kPa on day 31, and after
offline cleaning increased to 45 kPa on day 40. The frequency of backwashing was adjusted
to 1 min in every 15-min permeation cycle and water flux was recorded from day 40 (Figure
7.4B). Such a change allowed the MBER to maintain its TMP under 40 kPa in the following
46 days without any offline cleaning. The water flux began to drop from 6 L m-2 h-1 (LMH)
on day 40, due to the cake mass accumulation, to 2.8 LMH as the minimum on day 64. The
TMP decrease and water flux increase on day 80 was related to the detachment of the cake
mass due to the operational reasons.
125
7.3.4 Model validation and prediction
The data used for parameter estimation were obtained under the experimental condition of
varying either the anolyte COD concentration from 100 to 250 mg L-1, or the anolyte flow
rate from 1.3 to 2.1 mL min-1 (250 mg L-1 COD). The predicted current generation and
organic concentration in the anode effluent were plotted along the experimental data in
Figure 7.5. When varying the COD concentration, the model output of current generation
generally followed the trend of experimental data that current generation was enhanced
along with the increased substrate concentration (Figure 7.5 A). The relative root mean
Figure 7.4 The variation of transmembrane pressure (TMP) (A) and water flux (B)
126
square error (RMSE) showed that the simulated current generation was within 16.4% of
their maximum value, affected by the fluctuation of experimental data. The model output
of substrate concentration shared the same trend with the experimental measurement
(Figure 7.5 B), with a relative RMSE of 36.9%, indicating large deviation existed between
the simulation and the experimental data. Such a discrepancy can be from mismatch of
current generation that at the early stage, the modeled current endured a sharp decrease and
a temporal lagging period of bacteria growth could occur due to insufficient substrate
supply; consequently, a lower COD concentration in the anode effluent was observed. The
model output of the substrate concentration in the anode effluent began to increase as a
response to the enhanced COD concentration in the influent, but overestimation was
observed from the model simulation data, possibly due to the overestimated current
generation from model simulation results with larger COD removal.
The model output of current generation affected by the anolyte flow rate had a high RMSE
of 27.8%, because of the poor sensitivity of the MBER experiment (Figure 7.5 C). When
the anolyte flow rate was changed from 1.3 to 2.1mL min-1, the model current increased
from 5.0 to 8.2 mA but the experimental data did not obviously respond. A similar
phenomenon was reported in a model for microbial desalination cells (MDCs), suggesting
that mathematical model has higher sensitivity to the change of substrate concentration
when current generation is in a low range. Likewise, the experimental data of the COD
concentration did not well respond to the change of the anolyte flow rate like that of the
modeled value (Figure 7.5 D). The simulated substrate concentration shared a similar trend
to the experimental data, with a relative RMSE of 32.1%. Enhancing the organic loading
127
rate (OLR) from 0.6 to 1.0 kgCOD m-3 day-1 by increasing the influent flowrate from 1.3
to 2.1 mL min-1 did not significantly change the COD concentration in the anode effluent,
suggesting that more organics might have been consumed by the microorganisms other
than electrogens at a higher COD loading rate. The modeled substrate concentration was
lower than the experimental data, because of the overly estimated current generation.
The variation of TMP was also simulated and the model output could give a good
prediction on TMP change (Figure 7.6). The model simulation has a relative RMSE of
16.0%, affected by inaccurate estimation of suspended solids concentration that could yield
a deviated increase rate on membrane resistance. It is worth noting that membrane fouling
is a consequence of a dynamic process, which includes both attachment and detachment of
Figure 7.5 Model fitting under different testing conditions: (A) Current generation; (B) Substrate concentration in anode effluent by varying COD; (C) Current generation
and (D) Substrate concentration in anode effleunt by varying feeding rate
128
the foulants. The attached foulants includes the suspended solids from the influent (from
the MFC) and newly produced biomass within the membrane module; while the
detachment occurs when physical fouling control such as air-bubble scrubbing or surface
cross-flowing is provided. Water flux (J) and suspended solids (X) are two major
components for simulating TMP (indicating membrane fouling) in the developed model,
and result in a linear increase of TMP with time as shown in Figure 7.6.
The model was used to predict the performance (current generation and COD removal) of
the MBER affected by two factors, the influent COD concentration and the feeding rate of
the anolyte (anodic HRT), both of which can affect the organic loading rate (OLR). It was
found that current generation began to decline after the anodic HRT was extended (Figure
7.7 A) or influent COD was reduced (Figure 7.7 B). Insufficient organic supply for
anodophillic bacteria was assumed to be a reason for such interactive effect. It also
demonstrated that the anodic HRT has little impact on current generation after the influent
Figure 7.6 Model fitting of transmembrane pressure (TMP)
129
COD is beyond 2150 mg L-1, indicating that the conversion rate of the substrate-to-
electricity may have reached its maximum and additional substrate could not be converted
to electricity. The relationship between current generation and organic loading rate (OLR)
confirmed that the current generation could increase along with OLR in a logarithmic way
with R2 of 0.928 (Figure 7.7 C): current generation of 16.9 mA could be achieved after the
OLR was increased to 11.4 kg COD m-3 day-1, and further enhancing OLR had a marginal
effect on current generation at a cost of worse organic removal performance. It is worth
noting that to achieve same OLR, coupling high influent organic concentration with a
longer anodic HRT could result in more current generation than that of low influent organic
concentration with a shorter anodic HRT (Figure 7.7 D). For example, at an OLR of 2.4 kg
COD m-3 day-1, current generation of 10.7 mA could be achieved under the influent COD
of 800 mg L-1 at an HRT of 8 h, but a higher current of 16.2 mA can be generated after the
influent COD is changed to 1400 mg L-1 at HRT of 14 h (with the same OLR of 2.4 kg
COD m-3 day-1). The model indicated that such improvement could be related to more
stimulated anodophillic bacteria activity.
130
Figure 7.7 Model prediction for current generation affected by (A) Anodic HRT; (B) Influent COD; (C) Organic loading rate; and (D) COD removal efficiency
131
Parameters Description Value Units
F Faraday constant 96,485 C mol-1
R Ideal gas constant 8.314 J K-1 mol-1
T Temperature 298.15 K
Y Yield of anodophillic 4.44 mg-M mg-S-1
YCH4 Methane Yield 0.3 mL CH4 mg-S-1
qmax,a Maximum anodophillic reaction rate 5.32 mg-S mg-x-1 d-1
qmax,m Maximum methanogenic reaction rate 8.2 mg-S mg-x-1 d-1
µmax, a Maximum anodophillic growth rate 0.797 d-1
µmax, m Maximum methanogenic growth rate 0.1 d-1
Ks,a Half-rate constant of anodophillic 20 mg-S L-1
Ks,m Half-rate constant of methanogens 80 mg-S L-1
m Electrons transfer per mol of mediator 2 mol-1 mol mediator -1
γ Mediator molar mass 663,400 mg-M mol mediator-1
Mtotal Mediator fraction 0.05 mg-M mg-x-1
KM Mediator half rate constant 0.01 mg-M L-1
Kd,a Decay rate of anodophillic microorganism 0.02*µmax,a d-1
Kd,m Decay rate of methanogenic microorganism 0.02*µmax,m d-1
Xmax,a Anodophillic biofilm space limitation 512.5 mg-x L-1
Xmax,m Methanogenic biofilm space limitation 525 mg-x L-1
Kx Steepness Factor 0.04 L mg-x-1
Rmin Minimum internal resistance 31 Ω
Rmax Maximum internal resistance 2000 Ω
Emin Minimum open circuit potential 0.1 V
Emax Maximum open circuit potential 0.7 V KR steepness factor correction coefficient 0.0818 L mg-x-1
Table 7.1 Parameters for MBER electrical performance
132
Parameters Description Value Units
η Water apparent viscosity 0.00089 Pa.S
A Membrane surface area 0.013 m-2
ρ Specific cake resistance 100000000 m g-1
α Coefficient for TMP correction 1 (NO BW)
Y Yield coefficient of the substrate consumption
0.7 (BW1) 0.3 (BW2)
1.2 mg-Mmg-S-1
µs,max Maximum growth rate 0.12 d-1
Jair Air crossflow 0 m3 m-2 d-1
Ks Half saturation of substrate 10 g m-3
Kair Half saturation of airflow 4.6*10-5 g m-3
β Resistance of detachable cake by air crossflow 0.01 m-1
Qout Outflow 0.0018 m3 d-1
V Volume of membrane module 0.00015 m3
Note: BW means backwashing; BW1 means 1-min backwashing in every 30-min
operation; BW2 means 1-min backwashing in every 15-min operation.
7.3.5 Perspectives
This is an early attempt to integrate experimental results with a mathematical model to
optimize an MBER system. The present MBER is different from the prior MBERs in
several aspects: (1) the external installation of the membrane module (through one-
direction liquid flow connection) improves the flexibility of membrane module and
decreases the effects of its operation/cleaning on the MFC unit; (2) the dripping method
for supplying the cathode effluent can bring dissolved oxygen to the membrane module for
additional aerobic treatment, which will be important when organic loading rate becomes
higher; (3) aeration is eliminated from the cathode with its special configuration exposing
the cathode surface to the air; and (4) the present MBER could theoretically achieve energy
neutral. Both the findings of the influence of the anolyte recirculation rates and the
mathematical model developed here can provide more insightful information on optimizing
Table 7.2 Parameters for membrane performance
133
MBER system. Future studies will investigate the improvement of energy recovery from
organic conversion, possibly through adding the anode electrode materials and optimizing
the system operating conditions such as temperature. Despite the low fouling of the present
system, membrane fouling will be expected during a long-term operation with actual
wastewater, and thus appropriate anti-fouling methods will still be needed. One of the
interesting approaches for fouling control is to use in situ generated hydrogen peroxide for
reducing fouling, and this will require precise control of oxygen reduction (via two electron
reduction pathway for hydrogen peroxide production) on the cathode. In addition, system
scaling up will remain a great challenge for developing MBERs.
7.4 Conclusions
This study has presented an MBER consisting of an MFC with an external membrane
module, and the performance of this system was demonstrated through both the
experiments and mathematical modeling. The external configuration allowed more
flexibility in membrane cleaning without affecting the MFC unit. The anolyte recirculation
was a major energy consumer in this system, and by decreasing the anolyte recirculation
to 20 mL min-1, the MBER could potentially be a net energy producer. Mathematical model
was validated with experimental data and predicated that current generation by the MBER
could reach a plateau of 16.9 mA after the OLR is increased to 11.4 kgCOD m-3 day-1. The
model may be further improved by considering heterogeneous substrate and microbial
distribution.
134
CHAPTER 8
Investigation of Multiphysics in Tubular Microbial Fuel Cells by Coupled Computational Fluid Dynamics with Multi-Order Butler-Volmer Reactions
(This section has been published as: Zhao, L., Li, J., Battaglia, F. and He, Z.* (2016)
Investigation of Multiphysics in Tubular Microbial Fuel Cells by Coupled Computational
Fluid Dynamics with Multi-Order Butler-Volmer Reactions. In Press. DOI:
http://dx.doi.org/10.1016/j.cej.2016.03.110)
Abstract
Microbial fuel cells (MFCs) are considered as an emerging concept for sustainable
wastewater treatment with energy recovery. The anode of an MFC plays a key role in
conversion of organic compounds to electricity, and thus understanding the multiphysics
within the anodic compartment will be helpful with MFC optimization and scaling-up. In
this study, a multi-order Butler-Volmer reaction model was proposed to compute organic
consumption and energy recovery. Computational fluid dynamics (CFD) was applied to
analyze the hydrodynamics and species transport inside the anodic compartment. By
comparing to the experimental data, the reaction order of anodic surface reaction was
determined as 6.4. The reaction model gave good agreement with experimental data when
the influent sodium acetate was 1.0, 0.5 and 0.3 g L-1 at anodic hydraulic retention time
(HRT) of 10 h, indicating the effectiveness of this multi-order Butler-Volmer reaction
model. When the influent sodium acetate was 0.2 g L-1 or the anodic HRT was 15 h, the
model exhibited discrepancies in predicting current generation and effluent chemical
oxygen demand (COD) concentration, likely due to the interference of the decayed biomass
and the activities of non-electroactive bacteria. The results of this study have demonstrated
the viability of coupling CFD with a multi-order reaction model to understand the key
operating factors of an MFC.
135
8.1 Introduction
Microbial fuel cells (MFCs) have emerged as a promising approach for sustainable
wastewater treatment with bioenergy recovery (Li et al. 2014d). In MFCs, organic
materials are biologically degraded and electrical energy is produced through interaction
between microbes and solid electron acceptors (Logan et al. 2006b). Various
configurations of MFCs have been developed to optimize organics removal, energy
recovery and operational flexibility (He et al. 2006, Hernández-Fernández et al. 2015, Liu
et al. 2004, You et al. 2006). Among these proposed configurations, tubular MFC systems
have been studied in great detail because of its potential advantages in microbial and
substrate distribution, short distance between anode and cathode electrodes, and large
surface area of separator materials (Jacobson et al. 2015, Rabaey et al. 2005, Sun et al.
2015, Zhang et al. 2010). Interdependent multiphysics processes are present in tubular
MFCs. For example, the hydrodynamics of electrolyte flow in the anodic chamber plays a
key role in the substrate transport with associated effects on the activation overpotential
distribution and chemical reactions, and vice versa. The activation overpotential and
chemical reactions could contribute to the substrate consumption and transport, thereby
impacting the flow field. Therefore, proper understanding of multiphysics phenomena in
tubular MFCs can help guide the design and operation of such systems.
Mathematical modeling is a powerful tool to complement experiments and can be used to
further understand the key processes that cannot be easily measured via experiments.
Several models have been developed for studying metabolic pathway in anaerobic mixed
culture fermentation and MFCs (González-Cabaleiro et al. 2015, Luo et al. 2015, Ortiz-
Martínez et al. 2015), and among them, computational fluid dynamics (CFD) can be used
136
to numerically predict fluid flow, including mass transfer and reactions by solving various
advection-diffusion equations. The application of CFD techniques in studying MFCs is still
limited with very few publications in the past ten years. An early study combined
MATLAB, COMSOL and a self-developed Java code to study the macro-scale
homogeneous concentration evolution of soluble substrates and biomass in bulky liquid,
and a micro-scale heterogeneous two dimensional biofilm model (Picioreanu et al. 2010).
In this model, liquid velocity was calculated from the Navier-Stokes equations within a
laminar flow regime, and it was found that localized proton accumulation was a rate-
limiting factor on MFC output, and porous bio-electrode did not necessarily generate
higher current as long as convective flow was absent. Unfortunately, those findings were
not substantiated by any experimental results. Numerical simulations using CFD-ACE+
demonstrated in a Y-shape mixer with inset cylinders, a lower aspect ratio (micro-channel
depth-to-width) and larger inlet Reynolds number ratio (Reynolds number ratio based on
inlet streams) could enhance flow mixing efficiency, due to the increased side wall effect
and shear stress (Wang et al. 2011a). COMSOL Multiphysics was used to simulate laminar
incompressible fluid flow in an MFC and demonstrated that enlarged biofilm attachment
and increased shear rate within helical flow pathways accounted for the enhanced MFC
performance (Kim et al. 2012). Subsequently, three different helical flow channels (1.5,
5.4 and 10.8 mm, based on the spacing between helices) were experimentally investigated
with a maximum power density of 11.63 W m-3 achieved in the smallest channel, which
was confirmed by CFD modeling using a two layer k- eddy viscosity turbulence model
(Michie et al. 2014). A recent study simulated a cubic-shaped MFC containing twelve
different internal structures (e.g., triangular/rectangular shape, number, length and
137
upward/downward orientation) using ANSYS CFX. (Kim et al. 2014a). Numerical results
demonstrated that the maximum power density of 0.54 W m-2 could be achieved with the
largest working space of 0.57 m2. The CFD prediction using ANSYS Fluent 12.1 revealed
that better water distribution and biomass attachment could be developed with granular
graphite and stainless steel meshes due to the minimized occurrence of preferential flow
ways (Vila-Rovira et al. 2015).
Although the aforementioned CFD-based MFC studies have provided useful information
to understand MFC systems by analyzing micro- or macro-scaled flow conditions, there
are still limitations with the CFD modeling that can be further addressed. For example,
analyzing flow conditions alone fails to provide any information on activation
overpotential and organic distribution, which can determine anodic surface reaction rate.
A simplified electron transfer mechanism (e.g., external mediators) could be applied to
electrochemically-active bacteria, which exists in a complex microbial community within
the anodic chamber. Furthermore, time-dependent experimental data are essential to
validate the model formulation. Herein, a coupled CFD and multi-order Butler-Volmer
reaction model was proposed and validated to address some of the limitations, including a
simple electron transfer mechanism, and an interaction between heterogeneous substrate
and overpotential distribution on the anode surface. A direct contact electron transfer
mechanism between microbes and the electrode surface was applied instead of an external
mediator, because adding external mediator would not be feasible in wastewater
treatments. Heterogeneous species distribution and electricity generation was predicted
using the Butler-Volmer equations to include species concentration and activation
overpotential on reaction rates. Real time-dependent experimental results were used for
138
model validation. The results of this work were expected to demonstrate the viability of
using a high-fidelity CFD approach to model the complex reaction physics in a tubular
MFC.
8.2 Materials and Methods
8.2.1 MFC setup and operation
The MFC was constructed as a tubular reactor (32 cm long and 3.8 cm inner diameter)
made of anion exchange membrane (AEM-Ultrex AMI 7001, Membrane International. Inc,
Glen Rock, New Jersey, USA), as shown in Fig 8.1. Carbon cloth (Zoltek Corporation, St.
Louis, MO, USA) was used as the material for both the anodic and cathodic electrodes.
Before use, the carbon cloth was soaked in acetone solvent overnight and then heated for
30 min at 450 ºC. The finished anode electrode (with effective surface dimensions of 22
cm-long and 2.9 cm-diameter) was installed along the inner surface of the AEM tube and
supported by a plastic mesh, resulting in a net anodic liquid volume of 350 mL. The cathode
electrode (23 cm × 12 cm) was coated with Pt/C powder (Etek, Somerrest, NJ, USA) at a
loading rate 0.3 mg Pt cm-2, and wrapped the AEM tube. The anode and cathode electrodes
were connected to a 10 Ω resistor.
The MFC was operated at room temperature. Its anodic compartment was inoculated with
anaerobic sludge from the Peppers Ferry Wastewater Treatment Plant (Radford, VA, USA)
and operated with sodium acetate in a batch mode. During the start-up period, the external
resistance was changed from 1000 to 10 Ω in a stepwise approach. After start-up, the
system was fed with a synthetic solution containing (per L of tap water): sodium acetate 1
To determine if the predictions are grid-independent, three grid resolutions (37 × 110, 73
× 220, and 145 × 440) are simulated and predictions of the acetate concentration and
activation overpotential along the anodic surface are presented in Fig. 8.4 A and C. With
increasing grid resolution, the acetate concentration and activation overpotential slightly
decreased with average relative error lower than 0.3%. However, the average relative error
is still inconclusive. To quantitatively specify the numerical uncertainties and
mathematical correctness of the current model, the grid convergence index (GCI) (Celik et
al. 2008, Roache 1994) was evaluated for the same grid resolutions (Fig. 8.4 B and D). The
error bar denotes the possible range of exact numerical solution. Clearly, the numerical
solution using the fine mesh falls within the error bars with the average GCI less than 0.1%.
Table 8.1 Model parameters and values
151
Hence, the results from the grid resolution study indicate that a resolution of 145 × 440 is
sufficient for the CFD simulation.
Coarse Mesh Medium Mesh
Acetate Concentration 0.2% 0.1%
Activation Overpotential 0.06% 0.09%
Figure 8.4 Grid independent study for (A) acetate concentration using three grid resolution; (B) error bars on acetate concentration; (C) activation overpotential three
grid resolution and (D) error bars on activation overpotential
Table 8.2 Mean relative error for different grid resolution
152
Medium Mesh Fine Mesh
Acetate Concentration 0.8% 0.8%
Activation Overpotential 0.5% 0.4%
8.4.3 Reaction model validation
Two independent operations were carried out to further validate the reaction model with
different organic concentrations and flow rates of the influent solution. The operating
parameters remained unchanged from Section 8.4.2 except for the target ones being
studied.
The first test reduced the influent sodium acetate concentration in three steps from 1.0 to
0.5 to 0.3 to 0.2 g L-1 sequentially at an anodic HRT of 10 h. Figures 8.5 A and B present
the experimental data and CFD predictions for current generation and total COD
concentration in the effluent, respectively. In general, the CFD reaction model predictions
for electricity generation were in good agreement with the experiments, indicating the
effectiveness of the multi-order Butler-Volmer reaction model. However, at the lowest
influent sodium acetate of 0.2 g L-1, a discrepancy on the effluent COD occurred between
the numerical and experimental data, which might be related to the low sodium acetate
concentration from the influent. The CFD model calculated the effluent COD solely based
on the residual sodium acetate by neglecting the decayed biomass, but the effects of the
decayed biomass could become more significant when the influent organics are low. The
decayed biomass could potentially be used as substrates and/or remain in the effluent,
resulting in higher COD concentrations. The time scale of such a decay-conversion process
Table 8.3 Mean GCI for different grid resolution
153
would play an important role in understanding its influence on the model prediction and
warrants further investigation. Moreover, the slight discrepancy on current generation
might result in an overestimation of COD removal.
Contour plots of the influent organic concentrations are shown in Fig. 8.6, and have been
non-dimensionalized:
𝐶𝑎𝑐∗ =
𝐶𝑎𝑐
𝐶𝑎𝑐,0 (8.21)
where 𝐶𝑎𝑐∗ represents the nondimensional concentration of acetate, 𝐶𝑎𝑐 is the
heterogeneous concentration of acetate, and 𝐶𝑎𝑐,0 is the inlet acetate concentration. The
organics were evenly distributed within the anodic compartment when the influent sodium
acetate concentration is 1.0 g L-1, and a decreased organic concentration from the influent
is obtained with a lower influent organic concentration (Fig 8.6). The CFD predictions
suggest that the anodic surface reaction occurred mainly below 13 cm after the influent
organic concentration decreased to 0.2 g L-1, indicating the system was not operated under
the optimum condition for energy recovery.
154
Figure 8.5 Comparison of experimental and reaction model data reducing influent COD from 780 to 390 to 234 to 156 mg L-1: (A) Current generation and (B) COD
concentration in effluent
155
The second test was conducted by decreasing the influent flowrate from 1.17 mL min-1
(anodic HRT of 5 h) to 0.59 mL min-1 (anodic HRT of 10 h) to 0.39 mL min-1 (anodic HRT
of 15 h), with the influent sodium acetate concentration fixed at 0.3 g L-1, to replicate the
strength of traditional municipal wastewater. The CFD predictions for current generation
showed satisfactory agreement with the experiments for HRT of 5 and 10 h, as shown in
Fig. 8.7, indicating effectiveness of the multi-order reaction model on the surface reaction.
However, overestimation can be seen after HRT was extended to 15 h (Fig. 8.7 A), possibly
Figure 8.6 Heterogeneous distribution of nondimensional acetate concentration under different influent sodium acetate concentration
156
related to two reasons. First, more substrates are consumed by non-electroactive bacteria.
The tubular MFC had two PVC caps as top/bottom ends, which contained no electrode
materials and would allow the growth of non-electroactive microbial community.
Consumption of organic compounds in such regions could become more dominant with an
extended HRT, and as a consequence, less substrate was available for electrochemically-
active microorganisms. Unfortunately, such effects were not simulated by the reaction
model. Second, the conventional Monod-limitation equation may not be valid to describe
methanogenic activity. In this study, the volumetric reaction rate was assumed to follow
conventional Monod-limitation equation, in which the reaction rate was related to the
sodium acetate concentration and half-reaction constant (Eq. 8.6) in a linear relationship;
but actually, this could not occur ideally due to the fierce internal microbial competition
with a low feeding rate. The numerical data exhibit good agreement with experimental data
on the effluent COD concentration (Fig. 8.7 B), and predicted that the effluent COD is 148
mg L-1 at anodic HRT of 5 h, comparable to 134.7±26.4 mg L-1 obtained in the experiment.
Reducing the influent feeding rate resulted in a lower effluent COD concentration, which
was also predicted by the model that showed the effluent COD was reduced to 19 mg L-1
after the anodic HRT was extended to 15 h, within in the range of 27.3±19.3 mg L-1
obtained from the experiments.
157
8.4.4 Perspectives
This study has demonstrated that the coupled CFD and multi-order Butler-Volmer model
could effectively simulate the multiphysics (e.g., hydrodynamics, species transport,
electricity generation) in the anodic chamber of a tubular MFC. Comparing to the previous
MFC modeling works (Li and He 2015a, Ping et al. 2014) that assumed homogeneous
substrate distribution within anodic chamber and a constant overpotential on the anode
surface, our work using a heterogeneous substrate distribution can deliver more accurate
predictions for concentration loss, which in turn, affects the activation overpotential on
Figure 8.7 Comparison of experimental and reaction model data reducing flow rate of anolyte feeding from 1.17 to 0.59 to 0.39 mL min-1 sequentially: (A) Current
generation and (B) Effluent total COD concentration
158
each geometric cell. The improvement using a heterogeneous model is especially useful
for predicting large-scale MFC performance because the systems are not well-mixed due
to the operational limitations. Moreover, although the Butler-Volmer- Monod equation has
been applied in other published MFC models to represent substrate consumption, biomass
growth, and electrochemical reactivity (Huang et al. 2014, Yan and Fan 2013, Zhao et al.
2014), a multi-order model has not been used in conjunction with CFD. Thus the coupling
of CFD and the multi-order Butler-Volmer model presented in this paper can be used as a
platform to accommodate more diverse electron transfer mechanisms and more complex
flow conditions. For example, the addition of external mediator could stimulate biomass
activity and enhance electricity generation. Such an operational change can be reflected by
varying the exponential number in the multi-order reaction equation. In addition, the
influence of substrate type on electricity generation can also be accomplished by modifying
the multi-order reaction equation. More complex hydrodynamics (e.g., tortuous internal
structure, internal recirculation flow) could be achieved by adopting geometry change from
meshing process and modifying inlet and outlet boundary conditions.
Several limitations may exist in the current model and should be addressed with future
work. First, like many of the previously published MFC models, real wastewater containing
complex substrates and low conductivity was not considered here, resulting in
discrepancies between treatment performance and model prediction. Second, the influence
of biofilm (e.g. thickness, conductivity, and capacity) was not well incorporated into the
model formulation. In this study, the biofilm on the anode surface was assumed as an ideal
conductive material, in which the produced electrons and protons could be transported
159
freely. Third, the current model did not involve temperature fluctuations, which may pose
a significant influence on biomass activity and mass transport within the anodic
compartment. This may be addressed by adding another convection diffusion equation into
the governing equations. Last, biomass decay was not included in the model, and this could
lead to deviations in the model predictions, especially when the organic concentration
becomes low and the decayed biomass could be used as a substrate.
In addition to addressing the above limitations, further improvements may be achieved
with knowledge of the electrochemically-active microorganism metabolic activities, which
is necessary to determine the reaction order. A two-population microbial community could
represent dominant species inside the anodic chamber, but it cannot exactly depict
microbial activities. Thus, a complex bacteria community should be described in the model.
Moreover, dynamic biomass attachment and detachment from the electrode surface should
be considered because biomass thickness affects bacterial activity and diffusion on the
substrate. Severe biomass detachment can cause operational issues, which may require a
post treatment such as membrane separation process (Li et al. 2016). Thus, it is important
to account for dynamic biofilm variation in the model. The reaction potential on the cathode
surface should also be considered. For MFC applications, choosing a suitable electron
acceptor for the cathode electrode is critical. Oxygen is a possible candidate due to its non-
toxic and massive-available characteristics. A localized oxygen concentration can play a
significant role in cathodic performance, but a high oxygen concentration may pose an
unfavorable influence on the electrochemically-active microorganisms’ activity, due to the
cross-diffusion issue. Therefore, such a trade-off effect deserves further investigations.
160
8.5 Conclusions
A coupled CFD-multi-order Butler Volmer reaction model has been proposed and
validated in the present work. Convective flow conditions and associated heterogeneous
species distributions were simulated using the improved CFD reaction model. Comparing
to the conventional Monod-limitation equation, the multi-order model was able to predict
current generation and organics removal in a simplified way. The model was
experimentally validated by varying organic concentrations and the anolyte flow rate. The
CFD predictions demonstrate that the MFC system was not operated under the optimum
condition for energy recovery and substrate supply could limit the anodic surface reaction
in the higher zone of the reactor. Moreover, it is expected that this new model will not
merely be specific to tubular MFC systems, and its application in other reactor
configurations (e.g., rectangular cross-section) will be of strong interest. The model can be
improved by considering more diverse microbial communities, biomass decay, complex
hydrodynamic conditions and dynamic cathodic reaction potentials.
161
CHAPTER 9
Conclusion
As described in this study, membrane bioelectrochemical reactors were proved to be a
promising next-generation advanced wastewater treatment. The conventional membrane
fouling issue has been alleviated by using different strategies without causing extra energy
consumption. Nutrients removal, another common intrinsic issue associated with anaerobic
treatment process, was addressed by taking advantage of anaerobic-aerobic condition
between the anodic and cathodic compartments. In addition, overall carbon emission is
reduced from this process.
However, several limitations still exist and need to be addressed. In the current work, all
of attempted membrane fouling controls are based on the engineering perspective. Such
engineering methods could provide straight-forward solutions, but based on the scaling-up
perspective, some potential operational problems could emerge as well. For example, the
fluidized GAC bed could function as an ideal surface for attached growth, which could
result in a potential clogging issue. Alternatively, optimization of aeration in the cathodic
chamber is required to minimize the energy demand, without influencing the normal
operations. Besides controlling the membrane fouling, advanced membrane materials can
be attempted, including applying more hydrophilic membrane by reducing contact angle
or using a thinner and conductive polymeric material as a separator. In this way, less
residual organics were left to cathodic compartment due to the less internal resistance. Last
but not least, coating a layer of nano-silver particles onto membrane surface could be
another option to control the fouling issue.
162
Moreover, the energy advantages of MBERs should be further optimized. This could be
accomplished by using a more efficient electrode (e.g less overpotential from cathode
materials) or optimizing the internal recirculation and aeration pattern. As described in the
aforementioned chapter, adding recirculation could boost up electricity generation in an
efficient way, but it also requires more energy to offset head pressure loss at inlet port.
Such trade-off effects can be investigated by using computational fluid dynamics.
Changing the hydrodynamics conditions to increase substrate mixing condition without
incurring extra energy consumption could be attempted by adding filling materials within
the anodic compartment. Optimizing aeration also could be achieved by using low intensity
but coarse bubbling or precise controlling from membrane diffusion.
Direct/indirect wastewater reclamation and reuse from MBERs could be investigated
towards agricultural activities, due to the less available freshwater resource. Comparing to
the direct potable use, agriculture does not require high-quality water, but pathogen and
organic matters should be given enough attention. MBERs can be an option to meet these
requirements. Both the organics and pathogen could be effectively removed from
membrane permeate by either biodegradation process or physical separation. While the
nutrient elements such as potassium, nitrogen and phosphorus can be reused as a partial
fertilizer to subsequent agricultural practice.
Last, but not least, a next-generation MBER model can be developed by taking account a
more complex condition within the anodic compartment, such as heterogeneous biomass
and substrate distribution, equilibrium between new biomass produced and decay, and
163
mixed bacterial consortium. The separator materials (either cation exchange membrane or
anion exchange membrane) cannot prevent oxygen diffusion in an ideal way, which means
some substrate can be utilized by aerobic bacteria, rather than electro-active bacteria.
Therefore, aerobic bacteria activity should be taken into account in the next generation
MBER model. Cathode performance should be considered in a next generation MBER
model as well. Until now, most of microbial fuel cell modeling assumed an ideal and
constant cathode performance, which does not always happen in actual operation. Oxygen
diffusion toward cathode surface is an important factor to influence electricity generation.
However, this has been seldom investigated in previous modeling studies.
164
Reference
Alonso, A. Camargo, J.A. 2006 Toxicity of nitrite to three species of freshwater