43
Situation analysis for the Mid-Term Review of the NMSP 2011-2015: Relevent outcomes and impact measures Chaminuka, Lodge

Situation analysis for the Mid-Term Review of the NMSP 2011-2015:Relevent outcomes and impact measures
Chaminuka, Lodge
Overview
• Goals, targets, objectives• Coverage of interventions• Recommendations
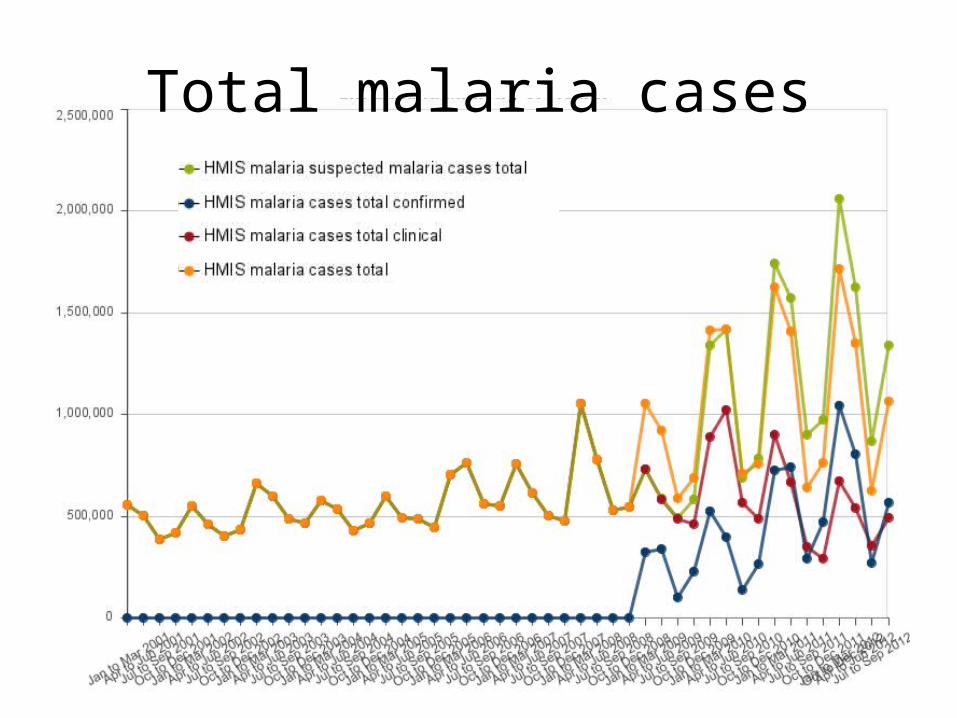
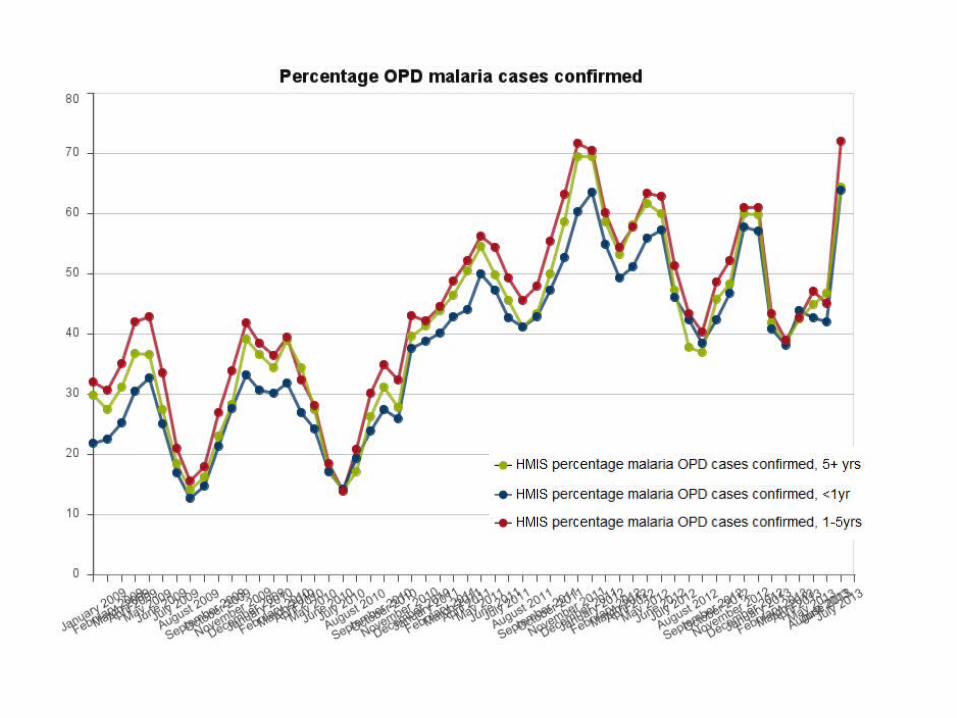
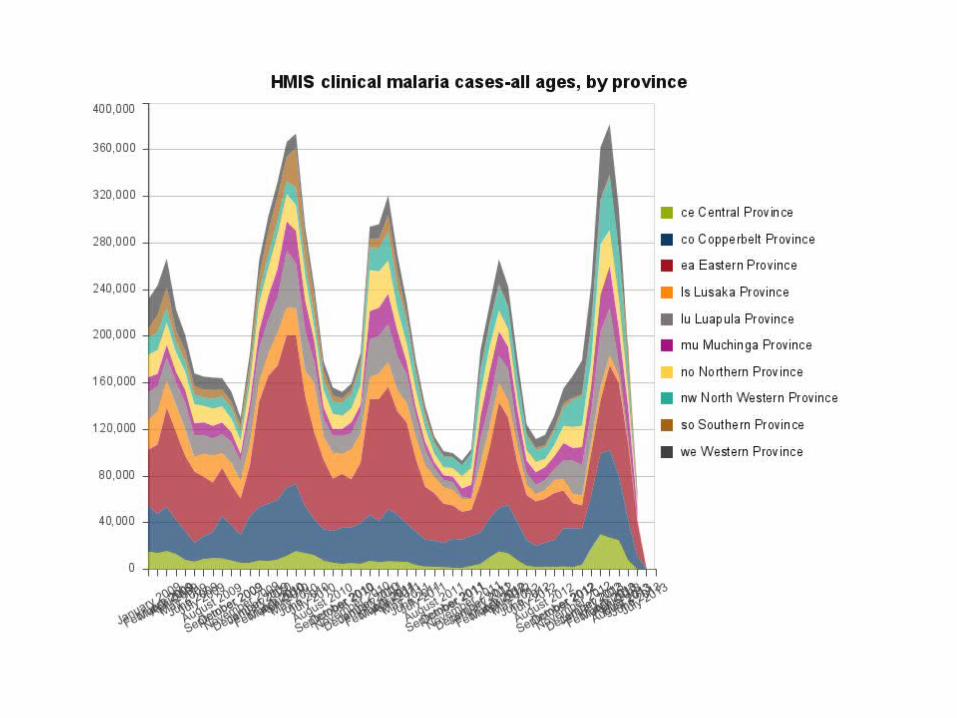
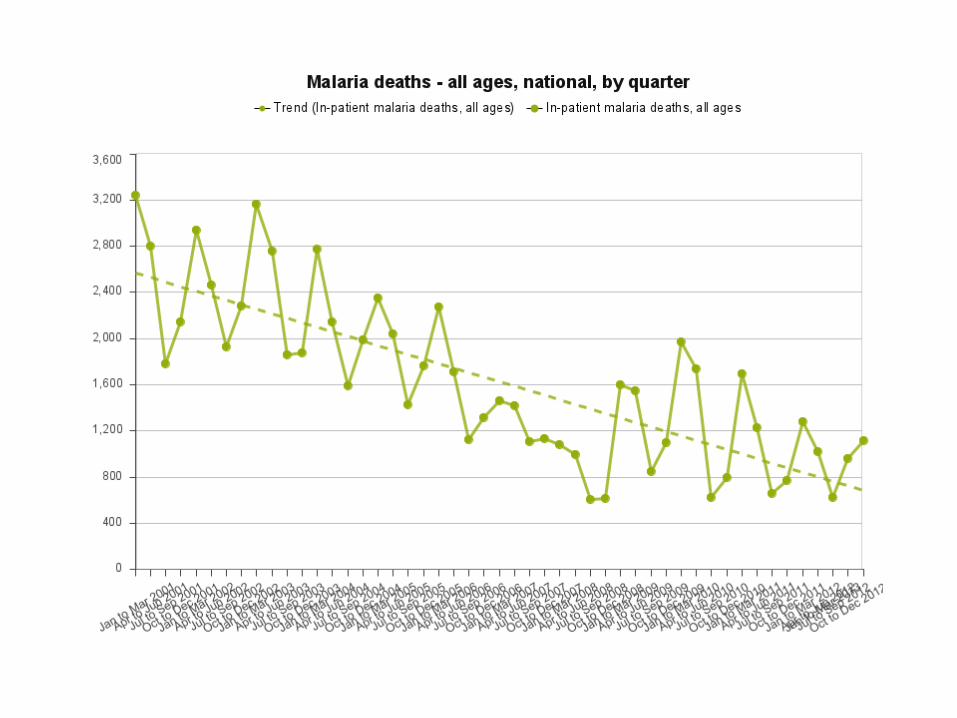
Total malaria cases

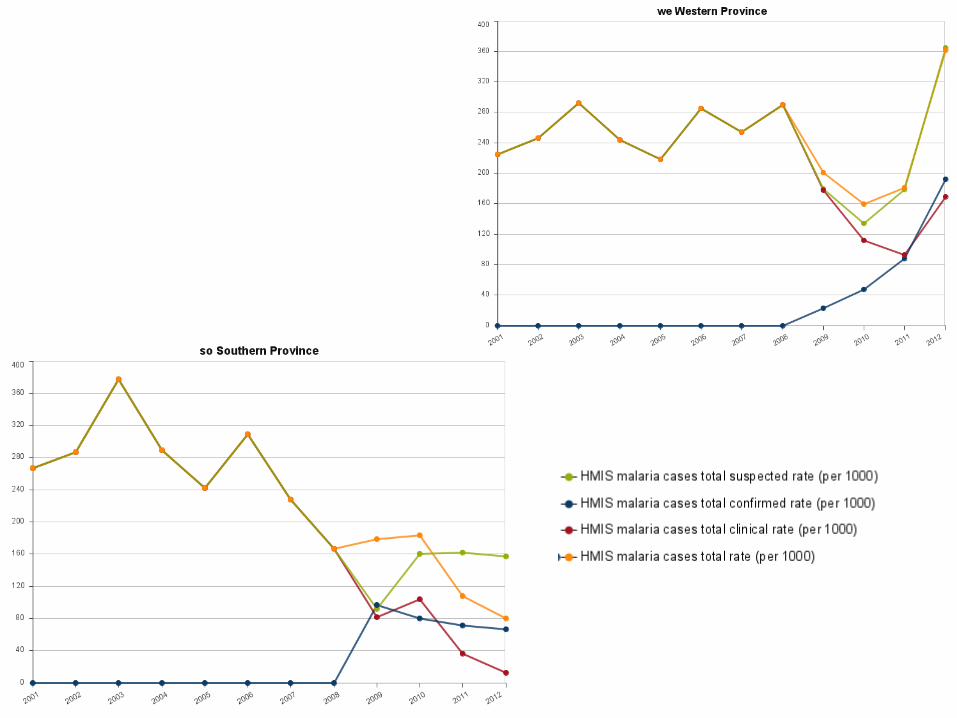
Total malaria case rates


Malaria reported case rates by district and case counts by facility 2011
g


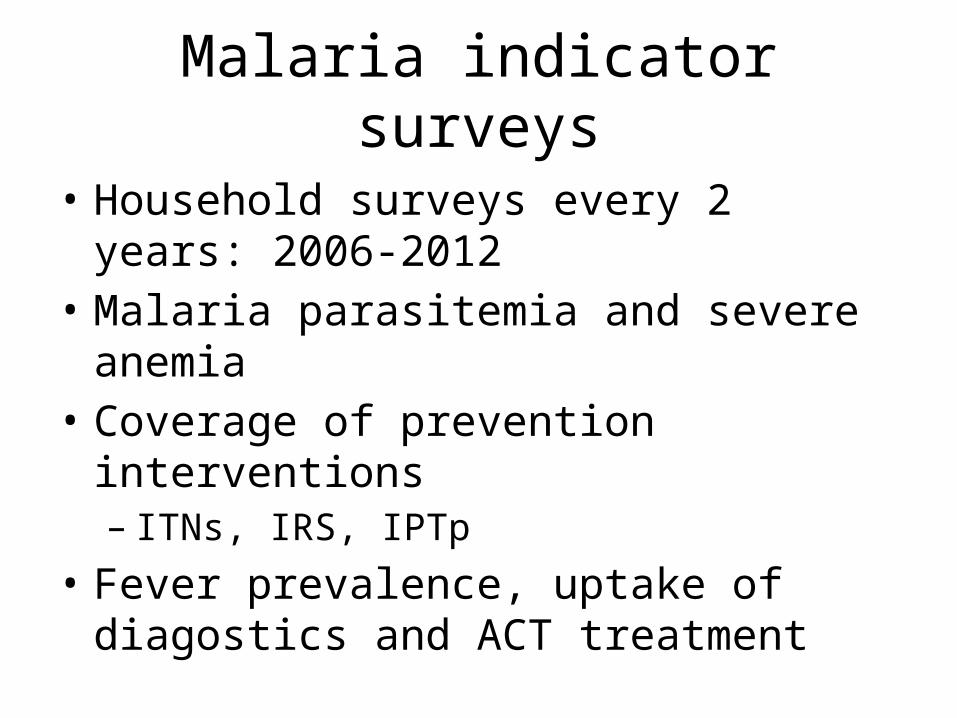
Malaria indicator surveys
• Household surveys every 2 years: 2006-2012• Malaria parasitemia and severe anemia• Coverage of prevention interventions– ITNs, IRS, IPTp
• Fever prevalence, uptake of diagostics and ACT treatment

Fever prevalence with the preceding two weeks among children under age five years (Zambia 2006–2012)
<12m 12–23m 24–35m 36–47m 48–59m Urban Rural National0.0
5.0
10.0
15.0
20.0
25.0
30.0
35.0
40.0
45.0
50.0
30.3
40.9
33.930.7
27.4
19.3
37.4
33.2
27.1
34.5
28.725.5
24.0 24.3
29.5 28.128.5
37.2 36.338.4
30.4
26.1
37.534.1
19.0
24.0
28.1 27.2
22.6
13.2
29.3
24.2
Age in months
2006 2008 2010 2012
Perc
enta
ge

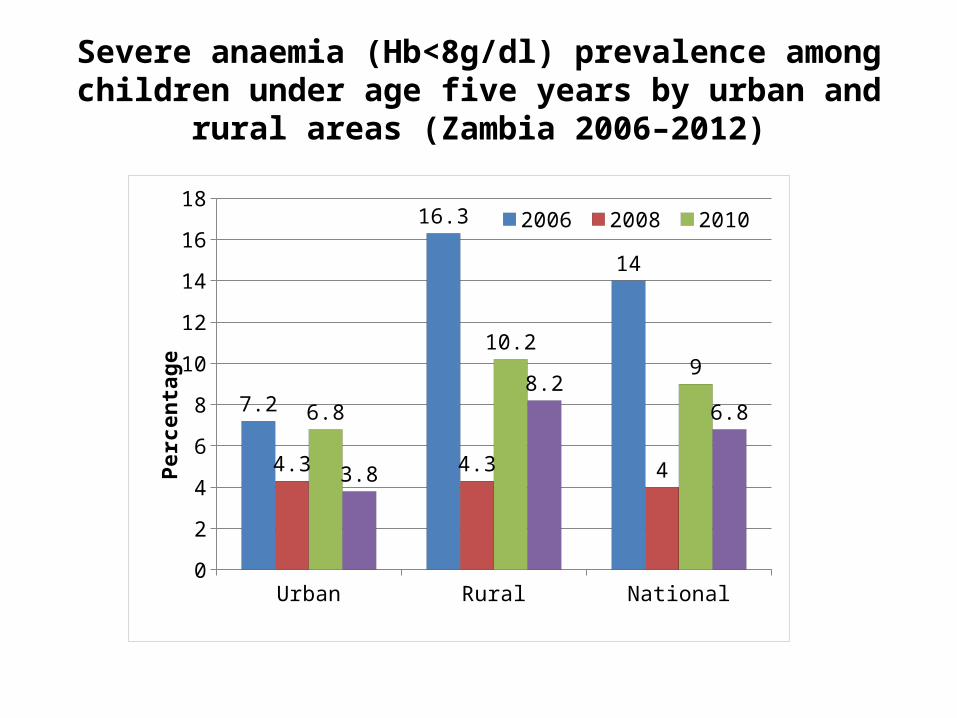
Severe anaemia (Hb<8g/dl) prevalence among children under age five years by urban and rural areas (Zambia 2006–2012)
Urban Rural National0
2
4
6
8
10
12
14
16
18
7.2
16.3
14
4.3 4.3 4
6.8
10.29
3.8
8.26.8
2006 2008 2010 2012
Perc
enta
ge
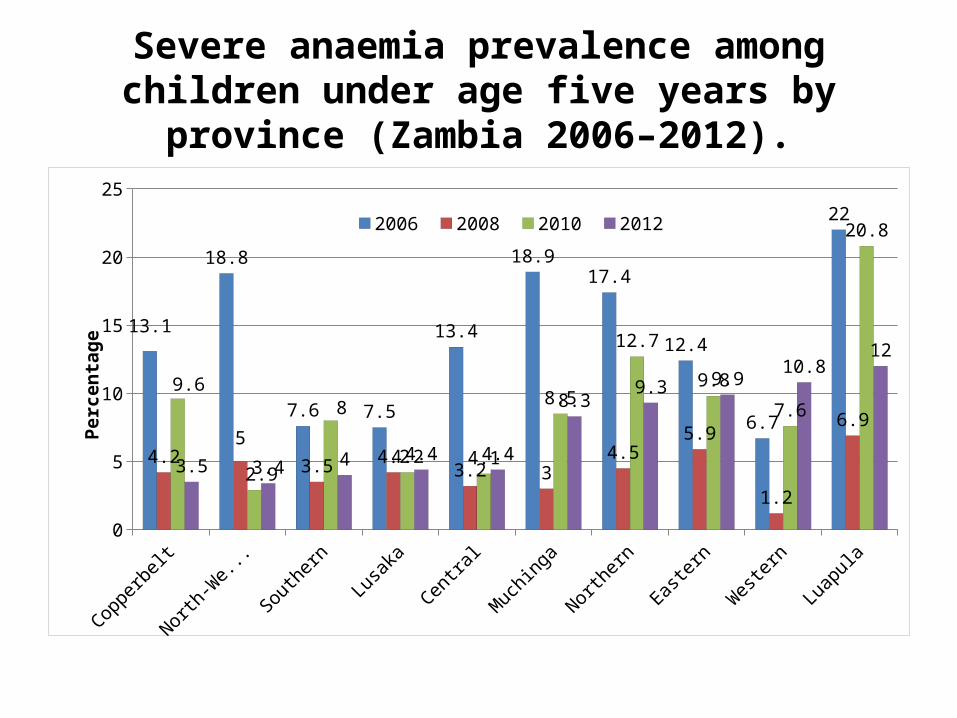
Severe anaemia prevalence among children under age five years by province (Zambia 2006–2012).
Copperbelt
North-W
estern
Southern
Lusaka
Centra
l
Muchinga
Northern
Easte
rn
Western
Luapula
0
5
10
15
20
25
13.1
18.8
7.6 7.5
13.4
18.917.4
12.4
6.7
22
4.25
3.5 4.23.2 3
4.55.9
1.2
6.9
9.6
2.9
8
4.2 4.1
8.5
12.7
9.8
7.6
20.8
3.5 3.4 4 4.4 4.4
8.39.3 9.9
10.812
2006 2008 2010 2012
Perc
enta
ge
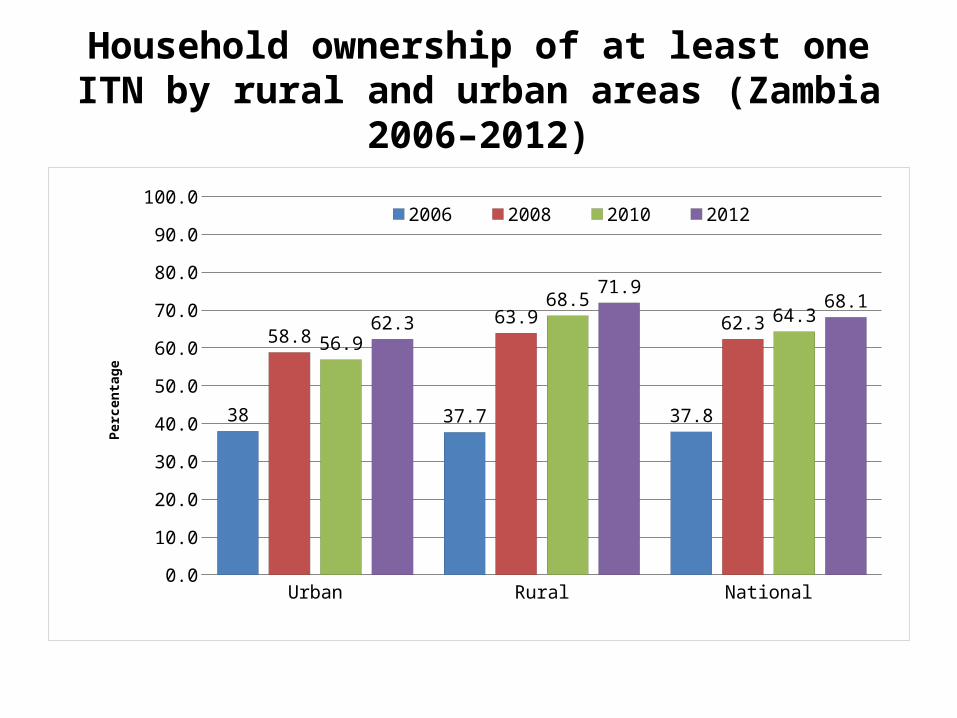
Household ownership of at least one ITN by rural and urban areas (Zambia 2006–2012)
Urban Rural National0.0
10.0
20.0
30.0
40.0
50.0
60.0
70.0
80.0
90.0
100.0
38 37.7 37.8
58.863.9 62.3
56.9
68.564.362.3
71.968.1
2006 2008 2010 2012
Perc
enta
ge

Household ownership of at least one ITN by province (Zambia 2006–2012).
Western
Lusaka
Central
Muchinga
Copperbelt
Southern
North-W
estern
Northern
Eastern
Luapula
0.0
10.0
20.0
30.0
40.0
50.0
60.0
70.0
80.0
90.0
100.0
67.0
26.7
48.4
38.8
30.4
46.942.3
15.7
33.2
40.433.8
55.451.0
93.7
57.2
69.9
48.4
86.5
74.369.8
74.7
49.9
74.069.5
62.366.1
72.8
57.8
75.7
50.151.955.4 55.7
62.2 62.4 63.7
77.883.1
87.5 90.02006 2008 2010 2012
Perc
enta
ge
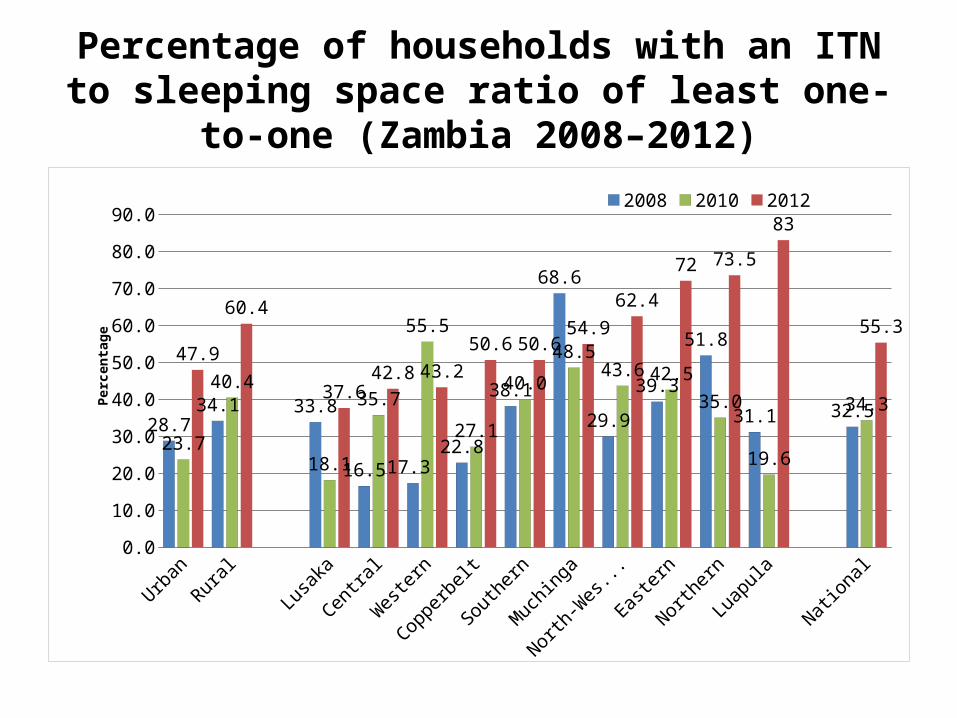
Percentage of households with an ITN to sleeping space ratio of least one-to-one (Zambia 2008–2012)
Urban
Rural
Lusaka
Centra
l
Western
Copperbelt
Southern
Muchinga
North-W
estern
Easte
rn
Northern
Luapula
National0.0
10.0
20.0
30.0
40.0
50.0
60.0
70.0
80.0
90.0
28.734.1 33.8
16.5 17.322.8
38.1
68.6
29.9
39.3
51.8
31.1 32.5
23.7
40.4
18.1
35.7
55.5
27.1
40.0
48.543.6 42.5
35.0
19.6
34.3
47.9
60.4
37.642.8 43.2
50.6 50.654.9
62.4
72 73.5
83
55.3
2008 2010 2012
Perc
enta
ge

ITN use by children under age five years by rural and urban areas (Zambia 2006–2012)
Urban Rural National0.0
10.0
20.0
30.0
40.0
50.0
60.0
70.0
80.0
25.2 24.0 24.0
37.842.3 41.0
44.3
52.550.050.9
60.157.1
2006 2008 2010 2012
Per-
cent
-ag
e
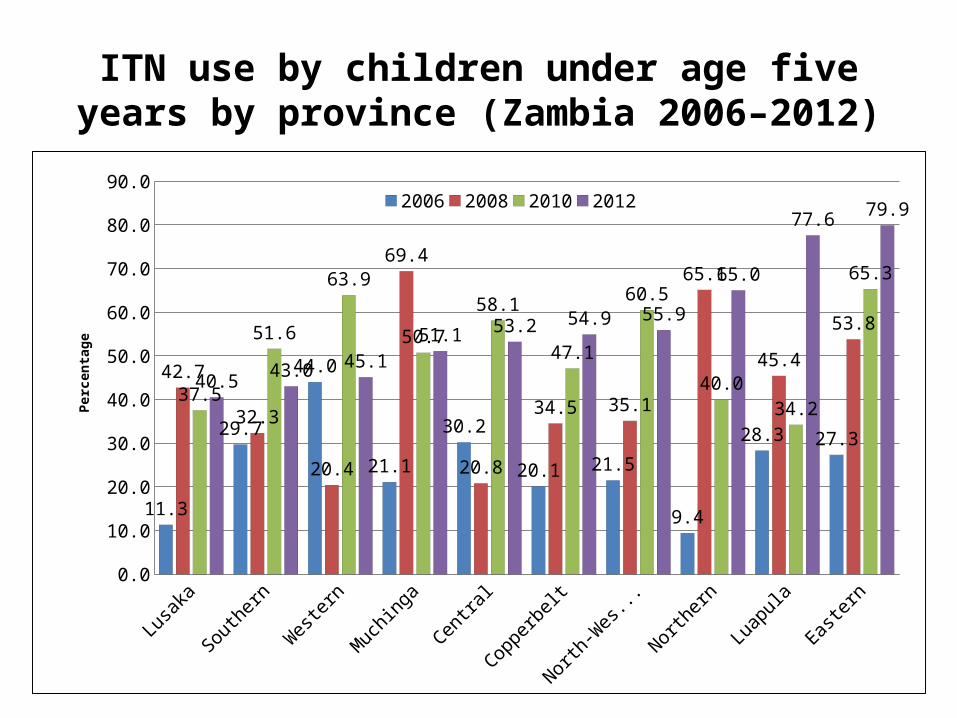
ITN use by children under age five years by province (Zambia 2006–2012)
Lusaka
Southern
Western
Muchinga
Central
Copperbelt
North-W
estern
Northern
Luapula
Easte
rn0.0
10.0
20.0
30.0
40.0
50.0
60.0
70.0
80.0
90.0
11.3
29.7
44.0
21.1
30.2
20.1 21.5
9.4
28.3 27.3
42.7
32.3
20.4
69.4
20.8
34.5 35.1
65.1
45.4
53.8
37.5
51.6
63.9
50.7
58.1
47.1
60.5
40.034.2
65.3
40.5 43.0 45.151.1 53.2 54.9 55.9
65.0
77.6 79.92006 2008 2010 2012
Perc
enta
ge

ITN use among household members by age group (Zambia 2006–2012)
0–4 5–9 10–14
15–19
20–24
25–29
30–34
35–39
40–44
45–49
50–54
55–59
60–64
65–69
70–74
75–79
80+0.0
10.0
20.0
30.0
40.0
50.0
60.0
70.0
24.3
14.912.0 12.8
18.3
24.0 24.4 24.9 23.7 23.020.1 18.5
15.013.2
20.5 19.0 18.7
41.1
28.8
22.0 21.6
33.6
40.544.9
41.743.7 42.3
37.8 38.636.6 35.5
31.1
40.536.3
49.9
36.3
30.227.8
39.4
49.851.7 50.2
52.147.9 46.1
43.3 44.4
39.341.4
31.9
41.1
57.1
45.4
37.1 36.7
45.7
51.1
56.258.6 59.7 61.0
47.6
42.2
47.851.4
39.841.8
44.7
2006 2008 20102012
Age in years
Pe rce nt ag e

Households reported sprayed within the previous 12 months (Zambia 2006–2012)
National Urban Rural0.0
10.0
20.0
30.0
40.0
50.0
60.0
9.5
26.2
0.8
14.9
35.3
5.8
23.1
37.9
14.6
29.133.8
18.9
2006 2008 2010 2012
Perc
enta
ge
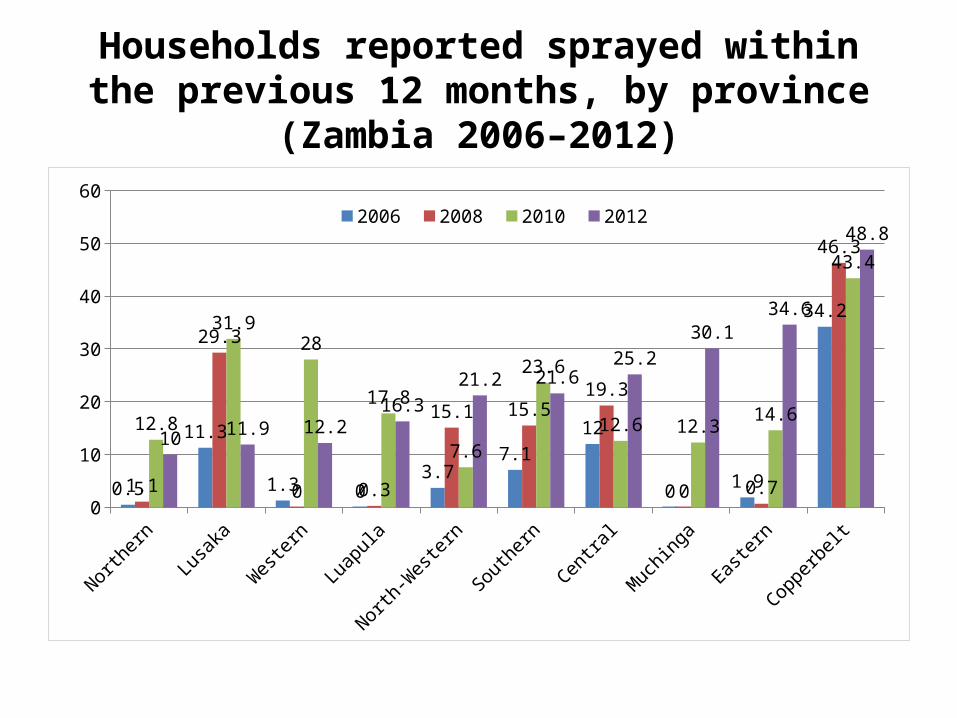
Households reported sprayed within the previous 12 months, by province (Zambia 2006–2012)
Northern
Lusaka
Western
Luapula
North-W
estern
Southern
Centra
l
Muchinga
Easte
rn
Copperbelt
0
10
20
30
40
50
60
0.5
11.3
1.3 03.7
7.112
0 1.9
34.2
1.1
29.3
0 0.3
15.1 15.519.3
0 0.7
46.3
12.8
31.928
17.8
7.6
23.6
12.6 12.314.6
43.4
10 11.9 12.216.3
21.2 21.625.2
30.134.6
48.82006 2008 2010 2012

Households reporting either at least one ITN or house sprayed or both (Zambia 2006–2012)
2006 2008 2010 2012 2006 2008 2010 2012Any ITN or IRS Any ITN and IRS
0.0
20.0
40.0
60.0
80.0
100.0
43.2
68.372.9 73.4
4.18.9
14.519.1
53.4
72.972.8
71.1
10.8
21.2 21.925.1
37.9
66.372.9 75.8
0.6 3.410.2
15.1
National Urban Rural
Perc
enta
ge

Women with recent births reporting coverage of IPTp two doses and three doses, by urban and rural areas
(Zambia 2010–2012)
Urban Rural National0.0
10.0
20.0
30.0
40.0
50.0
60.0
70.0
80.0
90.0
78.7
65.770.2
59.2
43.949.2
77.80
69.4072.50
63.8
49.154.3
IPT2 2010IPT3 2010IPT2 2012IPT3 2012

Fever prevalence with the preceding two weeks among children under age five years (Zambia 2006–2012)
<12m 12–23m 24–35m 36–47m 48–59m Urban Rural National0.0
5.0
10.0
15.0
20.0
25.0
30.0
35.0
40.0
45.0
50.0
30.3
40.9
33.930.7
27.4
19.3
37.4
33.2
27.1
34.5
28.725.5
24.0 24.3
29.5 28.128.5
37.2 36.338.4
30.4
26.1
37.534.1
19.0
24.0
28.1 27.2
22.6
13.2
29.3
24.2
Age in months
2006 2008 2010 2012
Perc
enta
ge

Percentage of febrile children under age five years with a reported finger stick for presumed diagnostic testing services
and parasitologic confirmation (Zambia 2008–2012)
Urban
Rural
National
Lusaka
Western
Northern
Muchinga
Luapula
Southern
Centra
l
Easte
rn
North-W
estern
Copperbelt0.0
10.0
20.0
30.0
40.0
50.0
60.0
70.0
15.39.5 10.9
20.8
0.15.1
10.815.2 17.9
3.4 5.4
29.4
10.4
21.015.4 16.7 15.2 19.3
6.2
16.6 15.1 15.111.2
17.6
27.8 28.231.1 32.6 32.3
14.419.9
26.4 27.7 28.5 30.834.1
43.7
54.3 56.62008 2010 2012
Perc
enta
ge
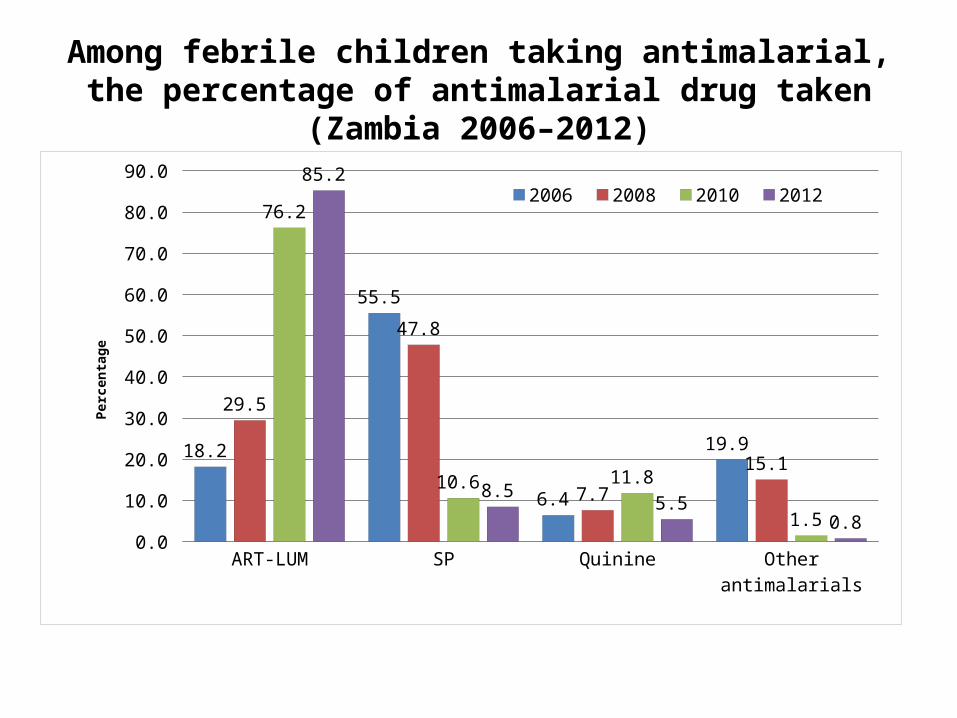
Among febrile children taking antimalarial, the percentage of antimalarial drug taken (Zambia 2006–2012)
ART-LUM SP Quinine Other antimalarials0.0
10.0
20.0
30.0
40.0
50.0
60.0
70.0
80.0
90.0
18.2
55.5
6.4
19.9
29.5
47.8
7.7
15.1
76.2
10.6 11.8
1.5
85.2
8.5 5.5
0.8
2006 2008 2010 2012
Perc
enta
ge
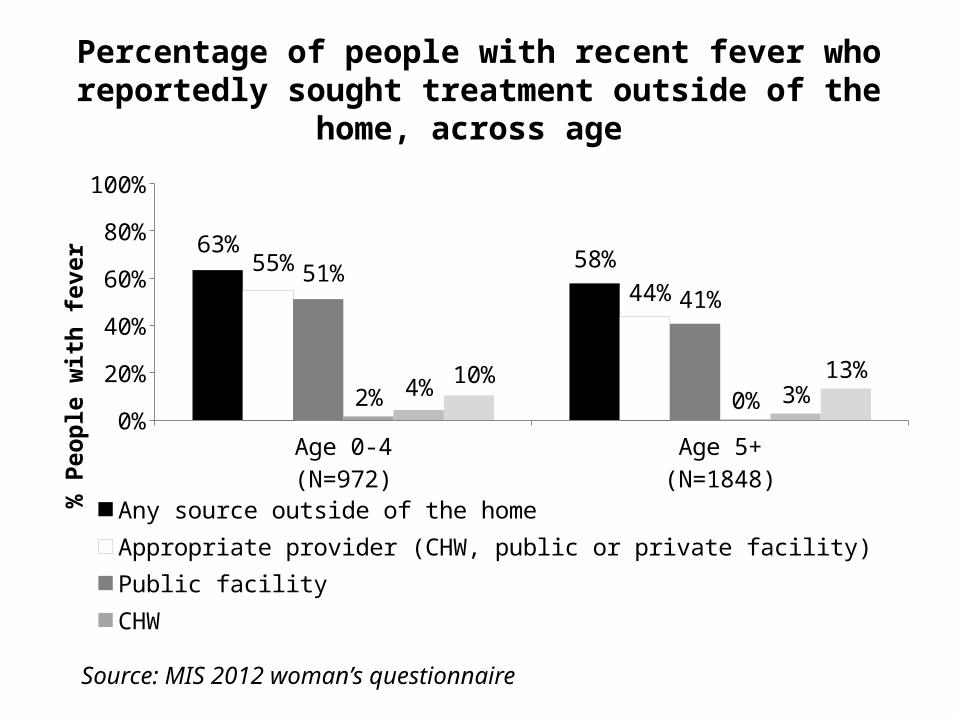
Percentage of people with recent fever who reportedly sought treatment outside of the home, across age
Age 0-4(N=972)
Age 5+(N=1848)
0%
20%
40%
60%
80%
100%
63% 58%55%44%
51%41%
2% 0%4% 3%10% 13%
Any source outside of the homeAppropriate provider (CHW, public or private facility)Public facilityCHWPrivate facilityOther private (pharmacy, shop)
% P
eopl
e w
ith fe
ver
Source: MIS 2012 woman’s questionnaire

Percentage of patients with suspected malaria who received a blood test for malaria, across level of care and patient age
Health post (N=86)
Rural health center (N=116)
Urban health center (N=117)
Hospital (N=110)
All patients age 5+ (N=429)
Health post (N=97)
Rural health center (N=134)
Urban health center (N=102)
Hospital (N=102)
All patients age 0-4 (N=435)
Faci
lity
type
:
Faci
lity
type
:
Age
5+
Age
0-4
0% 20% 40% 60% 80% 100%
55%
53%
81%
79%
64%
60%
70%
76%
78%
71%
% Patients with suspected malaria
Source: HFS 2011

Percentage of patients who were prescribed the first line ACT (AL) across blood test results, patient age, and level of care
Health post (N=26)Rural health center (N=29)
Urban health center (N=28)Hospital (N=36)
All patients age 5+ (N=119)Health post (N=24)
Rural health center (N=50)Urban health center (N=15)
Hospital (N=22)All patients age 0-4 (N=111)
Health post (N=31)Rural health center (N=42)
Urban health center (N=59)Hospital (N=44)
All patients age 5+ (N=176)Health post (N=42)
Rural health center (N=46)Urban health center (N=59)
Hospital (N=48)All patients age 0-4 (N=195)
Faci
lity
type
: Fa
cilit
y ty
pe:
Faci
lity
type
:
Faci
lity
type
:
Age
5+
Age
0-4
Age
5+
Age
0-4
Posit
ive
bloo
d te
stN
egat
ive
bloo
d te
st
0% 10% 20% 30% 40% 50% 60% 70% 80% 90% 100%
97%98%
79%82%
89%97%
87%82%
87%86%
2%12%13%
12%12%
4%10%12%
16%11%
% Patients with suspected malariaSource: HFS 2011
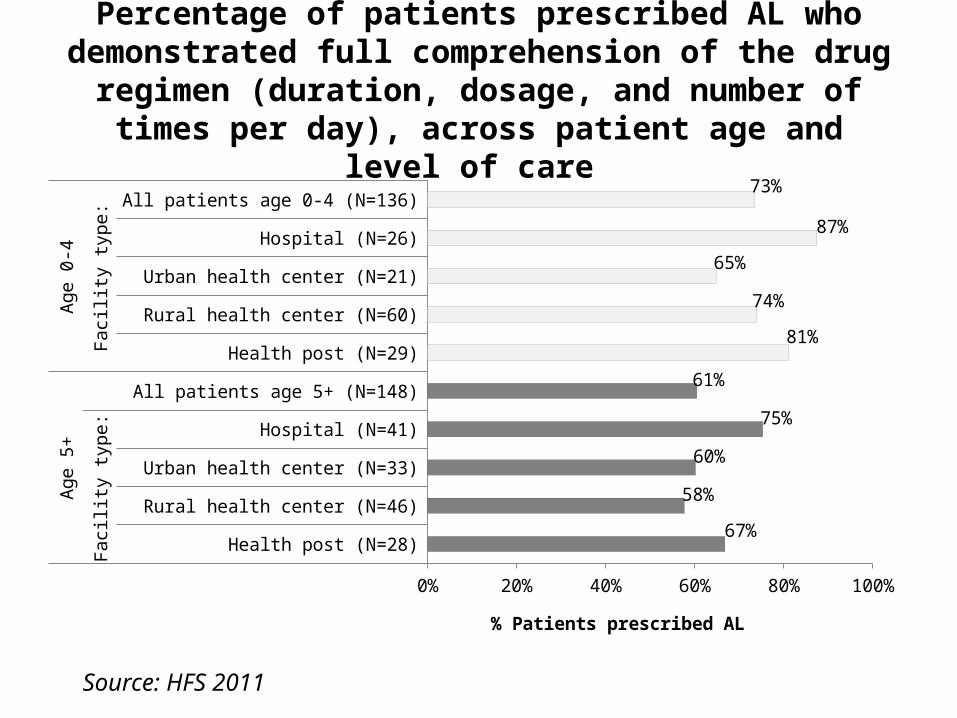
Percentage of patients prescribed AL who demonstrated full comprehension of the drug regimen (duration, dosage, and
number of times per day), across patient age and level of care
Health post (N=28)
Rural health center (N=46)
Urban health center (N=33)
Hospital (N=41)
All patients age 5+ (N=148)
Health post (N=29)
Rural health center (N=60)
Urban health center (N=21)
Hospital (N=26)
All patients age 0-4 (N=136)
Faci
lity
type
:
Faci
lity
type
:
Age
5+
Age
0-4
0% 20% 40% 60% 80% 100%
67%
58%
60%
75%
61%
81%
74%
65%
87%
73%
% Patients prescribed AL
Source: HFS 2011

Summary• Slight decrease in parasite prevalence between 2010 and 2012,
but still and overall decline compared to 2006• Improving quality ITN distributions through door-to-door
campaigns, particularly in Luapula, Muchinga, and Eastern– More ITNs per household to cover all sleeping spaces– Increase in use among all ages, including U5s and PW
• General shift in IRS coverage from urban to more malarious, rural areas
• IPTp continues to remain high, including more than half of women receiving 3 doses during pregnancy
• Trend in improving use of ACTs among antimalarials and increasing amounts of testing for febrile episodes

Recommendations (1)• Changes in parasite prevalence and severe anemia, while reduced in some areas,
have stagnated in several key areas of the country. It is recommended to examine approaches to maximizing the use of existing prevention and treatment interventions in combinations to exact the greatest impact on localized malaria burden.
• Re-establish high ITN ownership and use in areas of the country that dropped between 2010 and 2012 including Southern, Western, Central provinces provinces and encourage continued sustained coverage of ITNs uptake among all households and household members throughout the country.
• The effort to reach to last 30% of households is likely to be more difficult than reaching the 70% presently reached. The National Malaria Control Program recommends house to house distribution for replacement and current strategies should align to attain highest coverage possible. Full coverage at community level benefits all members of the community, including the most vulnerable populations of children under five and pregnant women.
Recommendations (2)• Continue to strategically offer IRS services to areas with malaria
to maximize the potential of malaria burden reduction, complementing current IRS and ITN efforts and in conjunction with an integrated vector management framework.
• Continue to expand case management, including diagnostics for parasitologic confirmation of suspected malaria cases, and consider that screening populations and treating those with infection may be important to further curtail malaria transmission. This latter effort would be especially appropriate in areas with continued and persistent high levels of malaria parasitaemia and transmission to supplement existing malaria prevention interventions.


