SEDIMENT TRANSPORT IN SUNGAI KULIM, KEDAH CHANG CHUN KIAT UNIVERSITI SAINS MALAYSIA 2006 brought to you by CORE View metadata, citation and similar papers at core.ac.uk provided by Repository@USM
Transcript
SEDIMENT TRANSPORT IN SUNGAI KULIM, KEDAH
CHANG CHUN KIAT
UNIVERSITI SAINS MALAYSIA
2006
brought to you by COREView metadata, citation and similar papers at core.ac.uk
Thesis submitted in fulfillment of the requirements for the degree of
Master of Science
December 2006
ii
ACKNOWLEDGEMENTS
First and foremost I would like to express my appreciation to my supervisor, Associate
Prof. Dr. Aminuddin Abd Ghani and Associate Prof. Dr. Rozi Abdullah for their constant
support, guidance and valuable suggestions for my study.
Special thanks go to Prof. Howard H. Chang from San Diego State University, USA
and Prof. Pierre Y. Julien from the University of Colorado, USA for their advice and
help. Prof. Howard H. Chang had kindly provided guidance and technical support in
FLUVIAL-12 modeling and Prof. Pierre Y. Julien offered his constructive criticism and
comments throughout this research. I would also like to thank the Department of
Drainage and Irrigation (DID) Kulim/Bandar Baharu and Hydrology Division for
providing river survey data, hydrological data and relevant information for this
research.
I would like to express my appreciation to River Engineering and Urban Drainage
Research Centre (REDAC), Universiti Sains Malaysia especially Mr. Mohamad Fauzi
Ahmad Shah, Mr. Mohamad Firdaus Talib, Mr. Zakaria Ansori Rahman, Mr. Rahim
Ghazali, Mr. Othman Zainuddin and to rest of the group, Mr. Chew Teck Yeow, Mr.
Cheng Kok Leong, Mr. Noorazlan Amat Sihab, Mr. Nicholas Lim, Mr. Chow Soon Lee,
and Ms Lim Hooi Wen for helping me in the hydraulic and sediment data collection. A
special thank you to the Director of REDAC, Prof. Dr. Nor Azazi Zakaria, for giving me
all the encouragement and support from the beginning until the completion of this
study. I would also like to express my appreciation to my colleagues at REDAC, Dr. Lai
Sai Hin, Mr. Leow Cheng Siang, Ms. Hasliza Wan Chik, Ms. Intan Faezah Darul Izham,
Ms Rosmaliza Ramli, Mrs Farhah Md Radhzi, Ms. Siti Norlaila Ahmad, Mr. Nasrul
iii
Osman and Mr. Rashid Man for their numerous help and encouragement during my
research.
A hearty thank you to my parents and my ever loving wife, Mrs. Ooi Sek Chuang who
had always supported and encourages to complete this study.
Chang Chun Kiat December 2006
iv
TABLE OF CONTENTS
Page ACKNOWLEDGEMENTS ii
TABLE OF CONTENTS iv
LIST OF TABLES viii
LIST OF FIGURES xi
LIST OF ABBREVIATION xvii
LIST OF SYMBOLS xviii
ABSTRAK xx
ABSTRACT xxii
CHAPTER 1 – INTRODUCTION 1 1.1 Background 1
1.2 Objectives 2
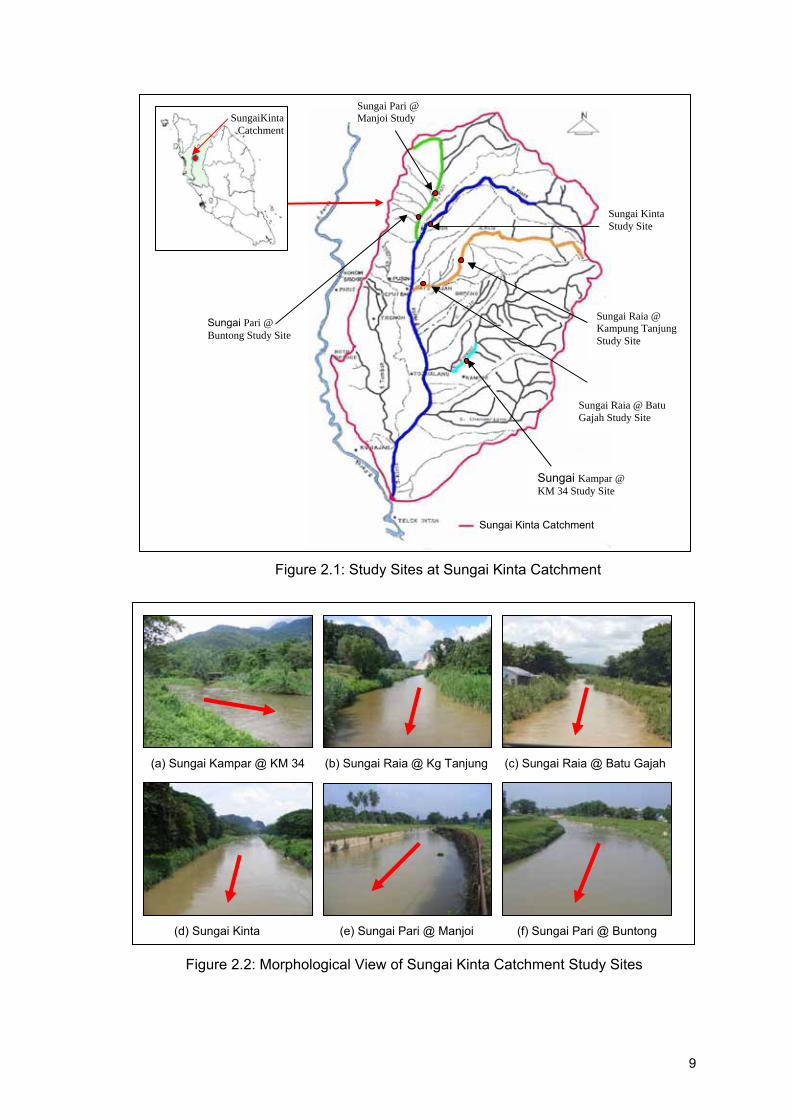
1.3 Study Site 2
1.4 Scope of Research 4
1.5 Structure of Thesis 5
CHAPTER 2 – LITERATURE REVIEW 7 2.1 Sediment Transport 7
2.2 Sediment Data Collection and Analysis 8
2.2.1 Sungai Kinta Catchment 8
2.2.2 Sungai Langat Catchment 17
2.2.3 Nile River Catchment 21
2.3 Sediment Transport Modeling 26
2.3.1 Model Selection 27
2.3.2 Model Applications 32
2.3 Summary 54
CHAPTER 3 – METHODOLOGY 56 3.1 Introduction 56
3.1.1 Study Area 56
3.1.2 Landuse / Development 58
3.1.3 Climate 61
3.1.4 Historical Flood 61
v
3.1.5 Siltation 66
3.1.6 Sedimentation Problem 67
3.1.7 Sand Mining 68
3.2 River Hydrology and Hydraulics 69
3.2.1 River Geometry Data 69
3.2.2 Rainfall Data 69
3.2.3 Streamflow Data 73
3.2.4 Water Level Record 75
3.2.5 Stage-Discharge Data 75
3.2.6 Flood Frequency Analysis 76
3.3 Field Measurement 79
3.3.1 Flow Measurement 80
3.3.2 Sediment Data Collection 80
3.3.3 Water Surface and Bed Level Measurement 83
3.4 Laboratory Test and Analysis 83
3.4.1 Sieve Analysis 84
3.4.2 Filtration Method 85
CHAPTER 4 – SEDIMENT DATA ANALYSIS 87 4.1 Introduction 87
4.2 Flow Hydraulics 87
4.3 Sediment Size Distributions 87
4.4 Computation of Sediment Load 92
4.4.1 Bed Load 92
4.4.2 Suspended Load 98
4.4.3 Total Load 99
4.5 Sediment Rating Curve 99
4.5.1 Bed Load 99
4.5.2 Suspended Load 100
4.5.3 Total Load 101
4.6 Cross Section Changes 102
4.7 Flow Resistance 102
4.7.1 Evaluation of Existing Equations 104
4.7.2 Flow Rating Curve 104
4.7.3 Development of New Manning’s Coefficient Equations 107
4.8 Sediment Transport Equation Assessment 110
vi
4.9 Summary 117
CHAPTER 5 –SEDIMENT TRANSPORT MODELING 118 5.1 Introduction 118
5.2 FLUVIAL-12 Model 119
5.3 Model Assumptions and Input Parameter 119
5.3.1 Study Reach 120
5.3.2 Geometry Data 120
5.3.3 Historical Flood Hydrograph 122
5.3.4 Rating Curve 124
5.3.5 Sediment Size Distribution 125
5.3.6 Summary 126
5.4 Model Output 127
5.5 Model Calibration and Validation 130
5.5.1 Sensitivity Analysis 130
5.5.2 Selection of Sediment Transport Equation 141
5.5.3 Model Calibration 142
5.5.4 Model Validation 147
5.6 Existing Condition Modeling 150
5.6.1 Sediment Delivery 150
5.6.2 Changes in Channel Geometry and Water Surface Profile
151
5.6.3 Changes in Sediment Size 151
5.6.4 Changes in Cross Sectional Geometry 152
5.7 Future Condition Modeling 154
5.7.1 Design Flood Hydrograph 154
5.7.2 Sediment Delivery 154
5.7.3 Changes in Channel Geometry and Water Surface Profile
155
5.7.4 Changes in Sediment Size 155
5.7.5 Changes in Cross Sectional Geometry 156
5.8 Long-Term Modeling 158
5.8.1 Sediment Delivery 158
5.8.2 Changes in Channel Geometry 159
5.8.3 Changes in Sediment Size 159
5.8.4 Changes in Cross Sectional Geometry 160
5.9 Summary 162
vii
CHAPTER 6 – CONCLUSIONS AND RECOMMENDATIONS 164 6.1 Conclusions 164
6.1.1 Sediment Data Collection and Analysis 164
6.1.2 Sediment Transport Modeling 166
6.2 Recommendations 167
BIBLIOGRAPHY 169
PUBLICATION LIST 178
APPENDICES
Appendix A – Comparison of Bed Material and Bed Load Size Distribution at Sungai Kulim
Appendix B – Computation of Bed Load for CH 14390 and CH 3014 at Sungai Kulim using Seven-Point Measurement Method
Appendix C – Computed Bed Load and Sediment Characteristic for CH 14390 and CH 3014 at Sungai Kulim
Appendix D – Computation of Bed Load for CH 14390 and CH 3014 at Sungai Kulim using Three-Point Measurement Method
Appendix E – Computation of Suspended Load for CH 14390 and CH 3014 at Sungai Kulim
Appendix F – Measured and Computed n from the Equations 2.1 to 2.8, Equations 4.3 and 4.4 for representative data at Sungai Kulim, Sungai Kinta and Sungai Langat
Appendix G – Example of FLUVIAL-12 Output
viii
LIST OF TABLES
Page
2.1 Range of Field Data for Sungai Kinta Catchment (Ab. Ghani et al., 2003)
10
2.2 Summary of Discrepancy Ratio using Equations 2.7 and 2.8 for Sungai Kinta Catchment (Abdul Ghaffar, 2003)
16
2.3 Summary of Sediment Transport Equation Assessment for Sungai Kinta Catchment (Ab. Ghani, 2003)
17
2.4 Range of Field Data for Sungai Langat Catchment (Ariffin, 2004)
19
2.5 Summary of Sediment Transport Equation Assessment for Sungai Langat Catchment (Ariffin, 2004)
21
2.6 Main Characteristics of the Study Sites (Abdel-Fattah et al., 2004)
4
2.7 Measured Data at Four Study Sites, Nile River (Abdel-Fattah et al., 2004)
24
2.8 Measured and Predicted Bed Load Transport Rates at the Four Study Sites (Abdel-Fattah et al., 2004)
25
2.9 Measured and Predicted Suspended Load Transport Rates at the Four Study Sites (Abdel-Fattah et al., 2004)
25
2.10 Measured and Predicted Total Load Transport Rates at the Four Study Sites (Abdel-Fattah et al., 2004)
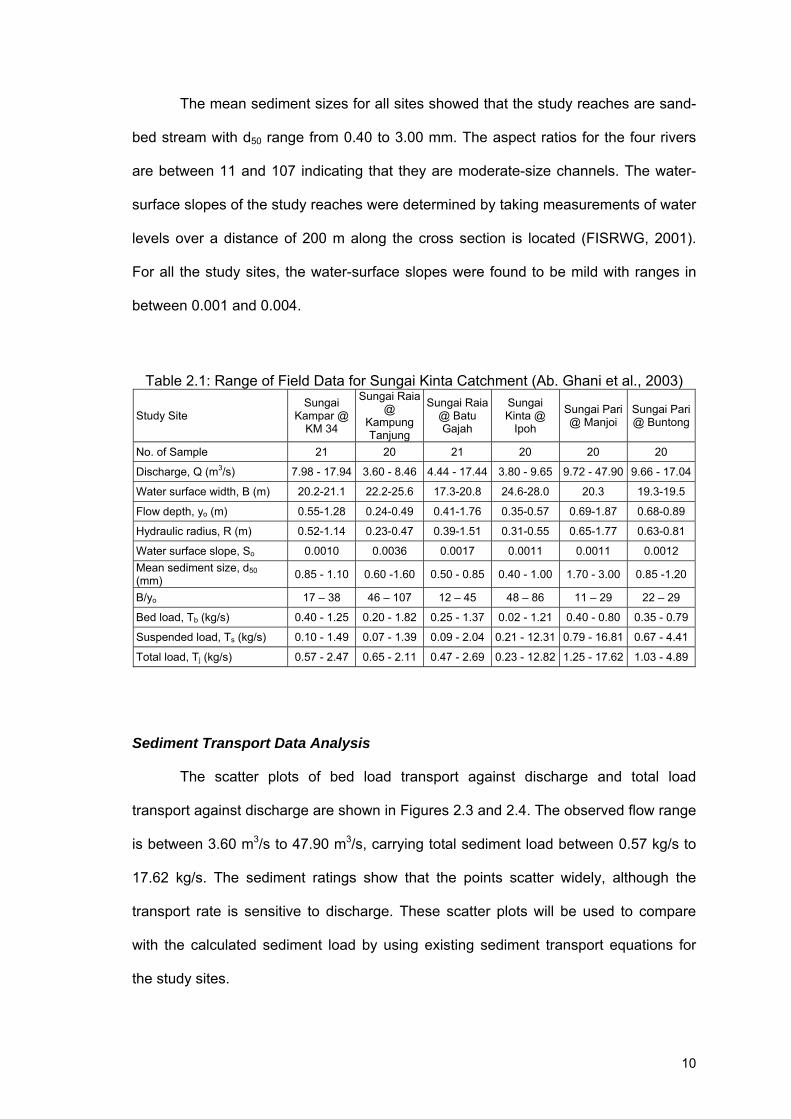
The scatter plots of bed load transport against discharge and total load
transport against discharge are shown in Figures 2.3 and 2.4. The observed flow range
is between 3.60 m3/s to 47.90 m3/s, carrying total sediment load between 0.57 kg/s to
17.62 kg/s. The sediment ratings show that the points scatter widely, although the
transport rate is sensitive to discharge. These scatter plots will be used to compare
with the calculated sediment load by using existing sediment transport equations for
the study sites.
11
0.1
1
10
1 10 100Q (m3/s)
T b (k
g/s)
0.1
1
10
1 10 100Q (m3/s)
T b (k
g/s)
0.1
1
10
1 10 100Q (m3/s)
T b (k
g/s)
0.1
1
10
1 10 100Q (m3/s)
T b (k
g/s)
0.01
0.1
1
10
0.1 1 10 100Q (m3/s)
T b (k
g/s)
0.1
1
10
1 10 100Q (m3/s)
T b (k
g/s)
Sungai Kampar @ KM 34
Sungai Kinta
Sungai Raia @ Kampung Tanjung
Sungai Raia @ Batu Gajah
Sungai Pari @ Buntong Sungai Pari @
Manjoi
0.1
1
10
100
0.1 1 10 100Q (m3/s)
T j (k
g/s)
0.1
1
10
100
0.1 1 10 100Q (m3/s)
T j (k
g/s)
0.1
1
10
100
0.1 1 10 100Q (m3/s)
T j (k
g/s)
0.1
1
10
100
0.1 1 10 100Q (m3/s)
T j (k
g/s)
0.1
1
10
100
0.1 1 10 100Q (m3/s)
T j (k
g/s)
0.1
1
10
100
0.1 1 10 100Q (m3/s)
T j (k
g/s)
Sungai Kampar @ KM 34
Sungai Kinta
Sungai Raia @ Kampung Tanjung
Sungai Raia @ Batu Gajah
Sungai Pari @ Buntong
Sungai Pari @ Manjoi
Figure 2.3: Bed Load Rating Curves for Sungai Kinta Catchment (Ab. Ghani et al., 2003)
Figure 2.4: Total Load Rating Curve for Sungai Kinta Catchment (Ab. Ghani et al., 2003)
The additional calculation of bed load transport rate by using three-point
measurement method (4 sections) has also been carried out (Ab. Ghani et al., 2003).
Figure 2.5 shows comparison of bed load transport rate obtained using seven-point
12
0.00
0.50
1.00
1.50
2.00
2.50
0.00 0.50 1.00 1.50 2.00 2.50Tb (7 Points), kg/s
T b (3
Poi
nts)
, kg/
s
0.00
0.50
1.00
1.50
0.00 0.50 1.00 1.50Tb (7 Points), kg/s
T b (3
Poi
nts)
, kg/
s
0.00
0.50
1.00
1.50
0.00 0.50 1.00 1.50
Tb (7 Points), kg/s
T b (3
Poi
nts)
, kg/
s
0.00
0.50
1.00
1.50
0.00 0.50 1.00 1.50Tb (7 Points), kg/s
T b (3
Poi
nts)
, kg/
s
0.00
0.50
1.00
1.50
0.00 0.50 1.00 1.50Tb (7 Points), kg/s
T b (3
Poi
nts)
, kg/
s
0.00
0.50
1.00
1.50
0.00 0.50 1.00 1.50Tb (7 Points), kg/s
T b (3
Poi
nts)
, kg/
s
Sungai Kampar @ KM 34
Sungai Kinta
Sungai Raia @ Kampung Tanjung
Sungai Raia @ Batu Gajah
Sungai Pari @ Buntong
Sungai Pari @ Manjoi
R2=0.34
R2=0.48
R2=0.79 R2=0.61
R2=0.85 R2=0.77
measurement method (8 sections) and three-point measurement method (4 sections).
The bed load transport rates are not much difference between the two methods.
Therefore, the rusults suggested that bed load measurement in a small stream can be
carried out using the three-point measurement method with advantages in terms of
time, cost and man power.
Figure 2.5: Comparison of Computed Bed Load Transport Rate between Seven-Point Measurement Method and Three-Point Measurement Method (Ab. Ghani et al., 2003)
Flow Resistance
Research on determination of Manning n value at the Sungai Kinta catchment
was started by Abdul Ghaffar (2003). Six manning equations were chosen for
evaluation and the equations can be categorized as follow:
13
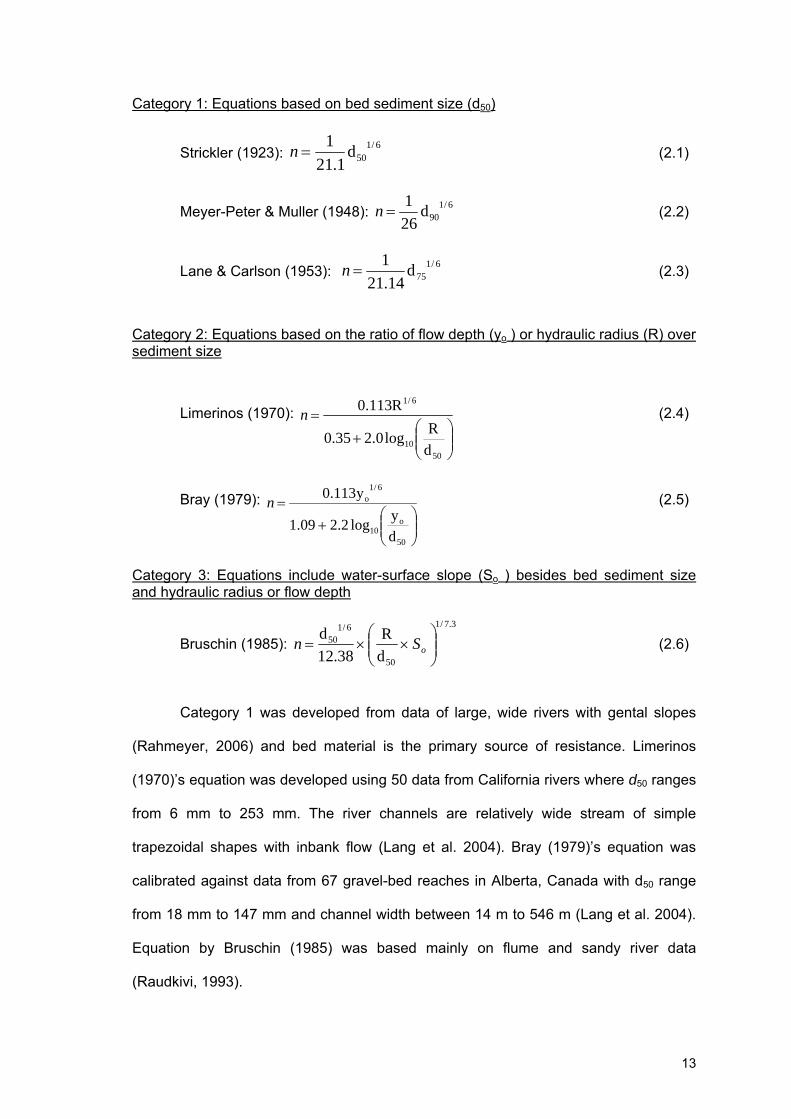
Category 1: Equations based on bed sediment size (d50)
Strickler (1923): 6/150d
1.211 =n (2.1)
Meyer-Peter & Muller (1948): 6/190d
261 =n (2.2)
Lane & Carlson (1953): 6/175d
14.211 =n (2.3)
Category 2: Equations based on the ratio of flow depth (yo ) or hydraulic radius (R) over sediment size
Limerinos (1970):
⎟⎟⎠
⎞⎜⎜⎝
⎛+
=
5010
6/1
dRlog0.235.0
R113.0 n (2.4)
Bray (1979):
⎟⎟⎠
⎞⎜⎜⎝
⎛+
=
50
o10
6/1o
dylog2.209.1
y113.0 n (2.5)
Category 3: Equations include water-surface slope (So ) besides bed sediment size and hydraulic radius or flow depth
Bruschin (1985): 3.7/1
50
6/150
dR
38.12d ⎟⎟
⎠
⎞⎜⎜⎝
⎛××= oSn (2.6)
Category 1 was developed from data of large, wide rivers with gental slopes
(Rahmeyer, 2006) and bed material is the primary source of resistance. Limerinos
(1970)’s equation was developed using 50 data from California rivers where d50 ranges
from 6 mm to 253 mm. The river channels are relatively wide stream of simple
trapezoidal shapes with inbank flow (Lang et al. 2004). Bray (1979)’s equation was
calibrated against data from 67 gravel-bed reaches in Alberta, Canada with d50 range
from 18 mm to 147 mm and channel width between 14 m to 546 m (Lang et al. 2004).
Equation by Bruschin (1985) was based mainly on flume and sandy river data
(Raudkivi, 1993).
14
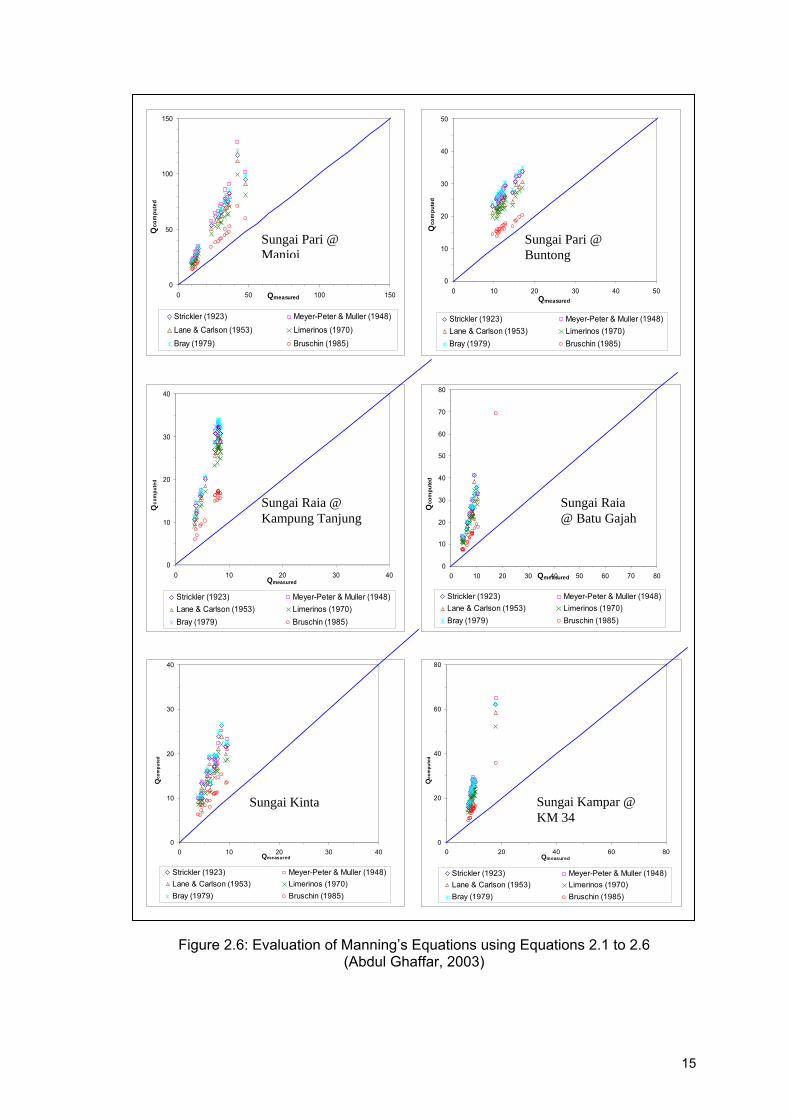
The existing equations (Strickler, 1923; Meyer-Peter & Muller, 1948; Lane &
Carlson 1953; Limerinos, 1970; Bray, 1979 and Bruschin, 1985) were evaluated for
their suitability in predicting discharge for several streams along the Sungai Kinta
catchment. However, the evaluation of the existing equations for the six study sites at
Sungai Kinta catchment resulted in an unsatisfactory prediction of discharge, as shown
in Figure 2.6 (Abdul Ghaffar, 2003).
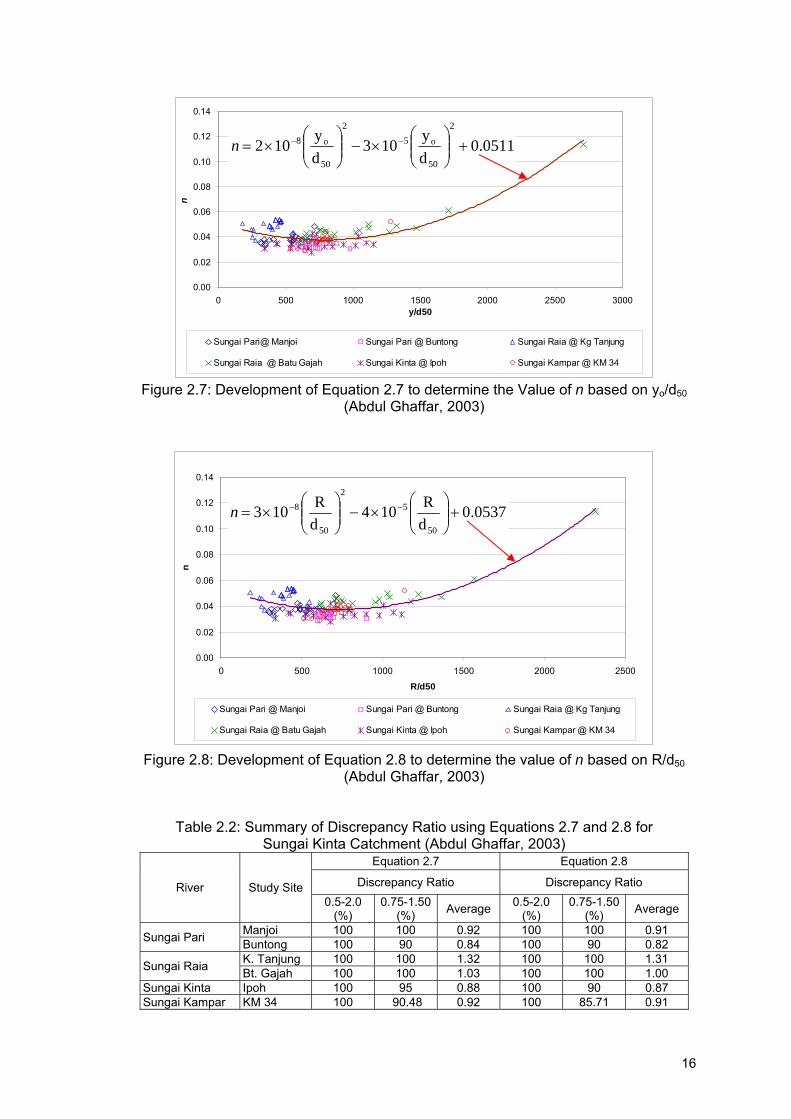
Two new equations (Equations 2.7 and 2.8) were proposed by Abdul Ghaffar
(2003) for determining Manning’s n for rivers in Malaysia for moderate-size channels in
Malaysia with a correlation coefficient R2 = 0.61. Figures 2.7 and 2.8 plot Manning’s n
against both yo/d50, and R/d50, respectively. These equations were evaluated for their
suitability in predicting discharge for several streams along the Sungai Kinta catchment.
Abdul Ghaffar (2003): 0511.0dy103
dy102
2
50
o52
50
o8 +⎟⎟⎠
⎞⎜⎜⎝
⎛×−⎟⎟
⎠
⎞⎜⎜⎝
⎛×= −−n (2.7)
0537.0dR104
dR103
50
52
50
8 +⎟⎟⎠
⎞⎜⎜⎝
⎛×−⎟⎟
⎠
⎞⎜⎜⎝
⎛×= −−n (2.8)
Table 2.2 gives a summary of discrepancy (ratio of computed discharge over
measured discharge) by using Equations 2.7 and 2.8 for all the 122 data. The results
show that all the computed discharges are within the 0.5 to 2.0 range of discrepancy
ratio suggesting the viability of using these new equations for predicting discharge of
the rivers with similar characteristics as studied (Table 2.1).
Sungai Lui Kg. Lui 92 27 29.3 14 15.2 21 22.8 2 2.2 Sungai Semenyih
Kg. Sg. Rinching 50 18 36.0 15 30.0 12 24.0 4 8.0
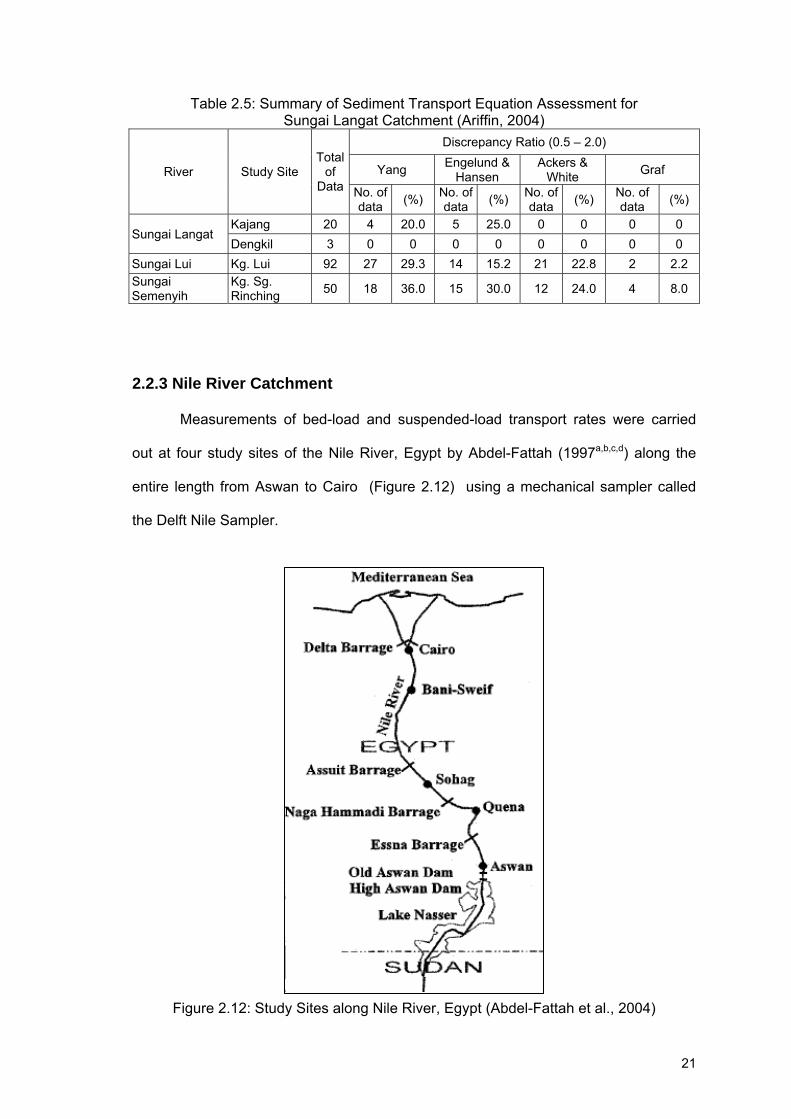
2.2.3 Nile River Catchment
Measurements of bed-load and suspended-load transport rates were carried
out at four study sites of the Nile River, Egypt by Abdel-Fattah (1997a,b,c,d) along the
entire length from Aswan to Cairo (Figure 2.12) using a mechanical sampler called
the Delft Nile Sampler.
Figure 2.12: Study Sites along Nile River, Egypt (Abdel-Fattah et al., 2004)
22
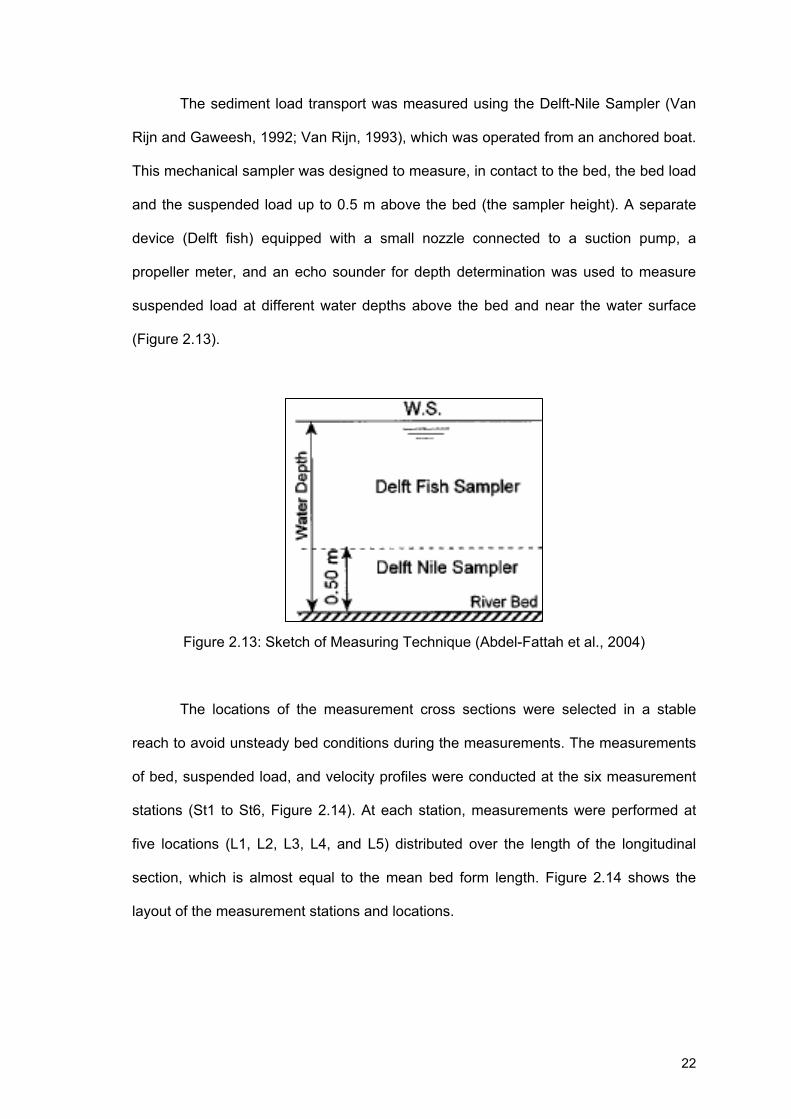
The sediment load transport was measured using the Delft-Nile Sampler (Van
Rijn and Gaweesh, 1992; Van Rijn, 1993), which was operated from an anchored boat.
This mechanical sampler was designed to measure, in contact to the bed, the bed load
and the suspended load up to 0.5 m above the bed (the sampler height). A separate
device (Delft fish) equipped with a small nozzle connected to a suction pump, a
propeller meter, and an echo sounder for depth determination was used to measure
suspended load at different water depths above the bed and near the water surface
(Figure 2.13).
Figure 2.13: Sketch of Measuring Technique (Abdel-Fattah et al., 2004)
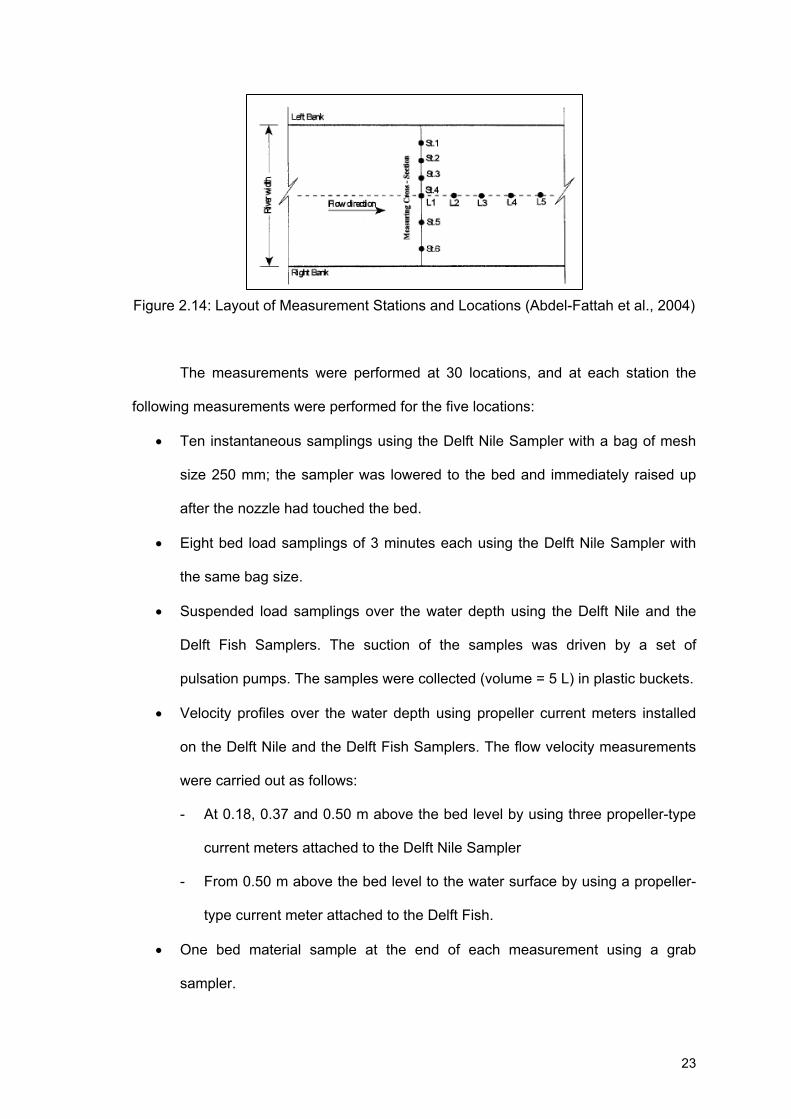
The locations of the measurement cross sections were selected in a stable
reach to avoid unsteady bed conditions during the measurements. The measurements
of bed, suspended load, and velocity profiles were conducted at the six measurement
stations (St1 to St6, Figure 2.14). At each station, measurements were performed at
five locations (L1, L2, L3, L4, and L5) distributed over the length of the longitudinal
section, which is almost equal to the mean bed form length. Figure 2.14 shows the
layout of the measurement stations and locations.
23
Figure 2.14: Layout of Measurement Stations and Locations (Abdel-Fattah et al., 2004)
The measurements were performed at 30 locations, and at each station the
following measurements were performed for the five locations:
• Ten instantaneous samplings using the Delft Nile Sampler with a bag of mesh
size 250 mm; the sampler was lowered to the bed and immediately raised up
after the nozzle had touched the bed.
• Eight bed load samplings of 3 minutes each using the Delft Nile Sampler with
the same bag size.
• Suspended load samplings over the water depth using the Delft Nile and the
Delft Fish Samplers. The suction of the samples was driven by a set of
pulsation pumps. The samples were collected (volume = 5 L) in plastic buckets.
• Velocity profiles over the water depth using propeller current meters installed
on the Delft Nile and the Delft Fish Samplers. The flow velocity measurements
were carried out as follows:
- At 0.18, 0.37 and 0.50 m above the bed level by using three propeller-type
current meters attached to the Delft Nile Sampler
- From 0.50 m above the bed level to the water surface by using a propeller-
type current meter attached to the Delft Fish.
• One bed material sample at the end of each measurement using a grab
sampler.
24
• Water temperature was measured.
• At each station, a longitudinal bed profile for the five locations was sounded.
The main topographic and hydraulic characteristics of the four study sites were
summarized in Table 2.6 and measured data were presented in Tables 2.7.
Table 2.6: Main Characteristics of the Study Sites (Abdel-Fattah et al., 2004) Location Aswan Quena Sohag Bani-Sweif River width 517 578 481 400 Local slope 3.5 4.2 5.7 8.5 Flow discharge 1,331 1,250 1,560 1,040 Average bed form length 44 22 24 28 Average bed form height 1.6 0.8 0.7 0.75
Table 2.7: Measured Data at Four Study Sites, Nile River (Abdel-Fattah et al., 2004)