CHANGES IN CATCH AND EFFORT IN THE ATLANTIC MENHADEN PURSE-SEINE FISHERY 1940-68 WILLIAM R. NICHOLSON' ABSTRACf The catch, number of vessel weeks, and catch per vessel week in the Atlantic menhaden fishery increased during the 1950's. During this period fishing methods improved and the efficiency of vessels increased. Improvements included use of airplanes for spotting schools, aluminum purse boats, nylon nets, power blocks, and fish pumps for catching and handling fish, and larger and faster carrier vessels that could range farther from port. The catch and catch per vessel week began declining north of Chesapeake Bay in the early 1960's. By 1966, fish north of Chesapeake Bay had become so scarce that plants either closed or operated far below their capacity. In Chesapeake Bay the number of vessel weeks increased, and the catch and catch per vessel week decreased through the early and mid 1960's. Variations in catch, effort, and catch per unit of effort showed no trends in the South Atlantic. The annual' mean II umber of purse-seine sets per day varied in different areas and ranged from about 2.0 to 4.5. The annual mean catch per set ranged from about 11 to 25 metric tons. Catch and effort statistics are important in eval- uating and managing any fishery. They may be used in measuring changes in actual or apparent abundance, estimating population sizes and mor- tality rates, and determining optimum fishing rates. When investigations of the Atlantic menhaden (Brevoortia tyrannus) fishery were begun in 1955 by the Bureau of Commercial Fisheries, provisions were made for collecting and com- piling catch and effort statistics. The number and locations of daily purse-seine sets were ob- tained from logbooks placed aboard vessels at the beginning of the fishing season, and daily catches of individual vessels were copied from plant records. The objectives of the present study were: (1) to analyze logbook data and vessel landing records to determine differences and changes in the number of purse-seine sets, mean number of sets per day, and the mean catch per set, both between and within geographical divisions of the fishery, (2) to develop a method of measuring fishing effort, and (3) to document changes that 'have occurred in the fishery: 1 National Marine Fisheries Service, Center for Est- uarine and Menhaden Research, Beaufort, N.C. 28516. Manuscript accepted April 1971. FISHERY BULLETIN: VOL. 6'1, NO.4, 1971. BRIEF HISTORY OF THE FISHERY Atlantic menhaden are found from central Florida to Nova Scotia and at one time or an- other have been exploited over most of this range. Fishing began in the early part of the 19th century in waters off Massachusetts and Maine. Following improved methods of fishing, extracting oil, and processing meal, the fishery expanded in this area in the latter part of the 19th century. When the scarcity of menhaden in waters north of Cape Cod caused the collapse of the fishery in that area, about 1895, the in- dustry shifted to the Middle and South Atlantic coast. By the 1930's processing plants were lo- cated in approximately the same areas where they occur today (Figure 1). Although in some areas pound nets capture menhaden incidentally with other species, purse seines catch nearly all of the fish that are reduced for meal and oil. Purse seining began in the late 19th century and by present standards was inefficient and la- borious. Purse boats were rowed and carrier vessels were sailed. Gradually, sailing vessels were replaced by larger, coal burning steam ships, purse boats were equipped with gasoline 765
Transcript
CHANGES IN CATCH AND EFFORT IN THE ATLANTIC MENHADEN
PURSE-SEINE FISHERY 1940-68
WILLIAM R. NICHOLSON'
ABSTRACf
The catch, number of vessel weeks, and catch per vessel week in the Atlantic menhaden fishery increasedduring the 1950's. During this period fishing methods improved and the efficiency of vessels increased.Improvements included use of airplanes for spotting schools, aluminum purse boats, nylon nets, powerblocks, and fish pumps for catching and handling fish, and larger and faster carrier vessels that couldrange farther from port. The catch and catch per vessel week began declining north of Chesapeake Bayin the early 1960's. By 1966, fish north of Chesapeake Bay had become so scarce that plants eitherclosed or operated far below their capacity. In Chesapeake Bay the number of vessel weeks increased,and the catch and catch per vessel week decreased through the early and mid 1960's. Variations incatch, effort, and catch per unit of effort showed no trends in the South Atlantic. The annual' meanIIumber of purse-seine sets per day varied in different areas and ranged from about 2.0 to 4.5. Theannual mean catch per set ranged from about 11 to 25 metric tons.
Catch and effort statistics are important in evaluating and managing any fishery. They may beused in measuring changes in actual or apparentabundance, estimating population sizes and mortality rates, and determining optimum fishingrates.
When investigations of the Atlantic menhaden(Brevoortia tyrannus) fishery were begun in1955 by the Bureau of Commercial Fisheries,provisions were made for collecting and compiling catch and effort statistics. The numberand locations of daily purse-seine sets were obtained from logbooks placed aboard vessels atthe beginning of the fishing season, and dailycatches of individual vessels were copied fromplant records.
The objectives of the present study were:(1) to analyze logbook data and vessel landingrecords to determine differences and changes inthe number of purse-seine sets, mean numberof sets per day, and the mean catch per set, bothbetween and within geographical divisions of thefishery, (2) to develop a method of measuringfishing effort, and (3) to document changes that'have occurred in the fishery:
1 National Marine Fisheries Service, Center for Estuarine and Menhaden Research, Beaufort, N.C. 28516.
Manuscript accepted April 1971.FISHERY BULLETIN: VOL. 6'1, NO.4, 1971.
BRIEF HISTORY OF THE FISHERY
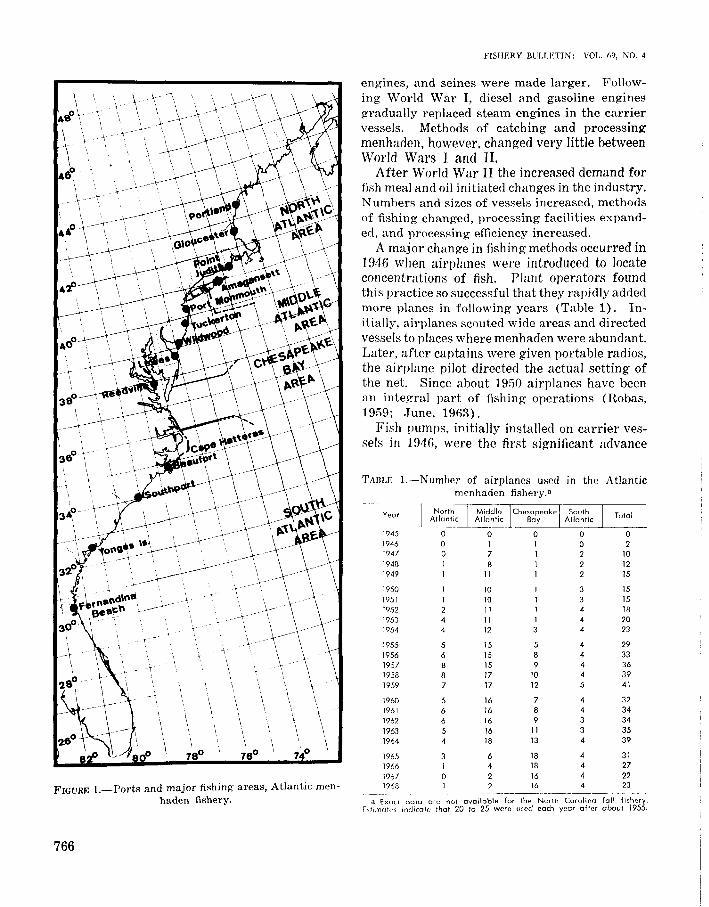
Atlantic menhaden are found from centralFlorida to Nova Scotia and at one time or another have been exploited over most of thisrange. Fishing began in the early part of the19th century in waters off Massachusetts andMaine. Following improved methods of fishing,extracting oil, and processing meal, the fisheryexpanded in this area in the latter part of the19th century. When the scarcity of menhadenin waters north of Cape Cod caused the collapseof the fishery in that area, about 1895, the industry shifted to the Middle and South Atlanticcoast. By the 1930's processing plants were located in approximately the same areas wherethey occur today (Figure 1).
Although in some areas pound nets capturemenhaden incidentally with other species, purseseines catch nearly all of the fish that are reducedfor meal and oil.
Purse seining began in the late 19th centuryand by present standards was inefficient and laborious. Purse boats were rowed and carriervessels were sailed. Gradually, sailing vesselswere replaced by larger, coal burning steamships, purse boats were equipped with gasoline
765
FIGURE I.-Ports and major fishing areas, Atlantic menhaden fishery.
766
FIsm:RY BULLETIN: VOL. 69, NO.4
engines, and seines were made larger. Following World War I, diesel ilnd gasoline enginesgradually replaced steam engines in the carriervessels. Methods of catching and processingmenhaden, however, changed very little betweenWorld Wars I and II.
After World War II the increased demand forfish meal and oil initiated changes in the industry.Numhers and sizes of vessels increased, methodsof fishing changed, processing facilities expanded, and processing efficiency increased.
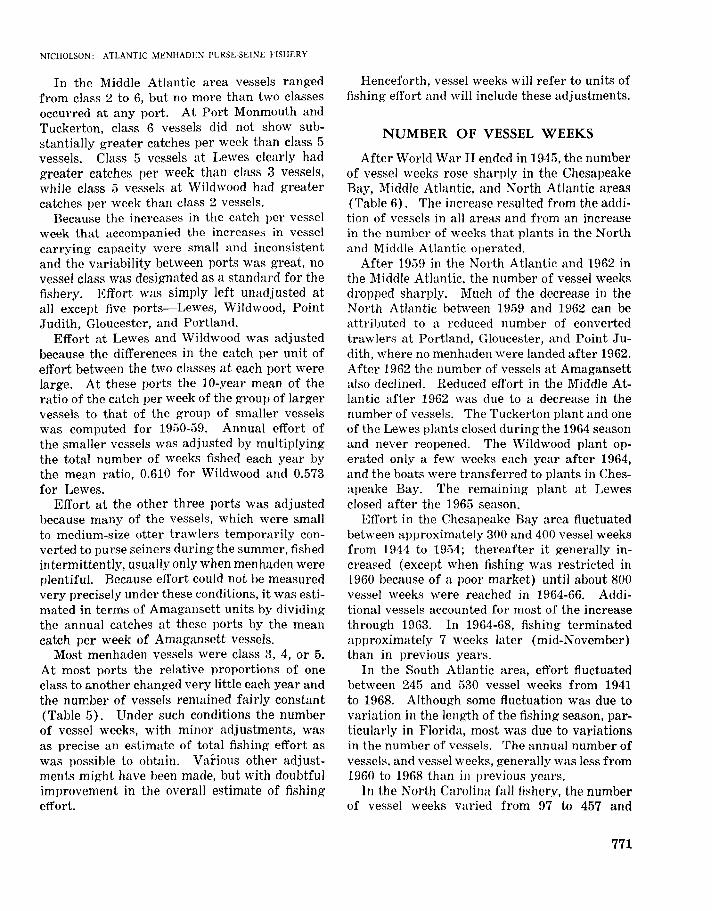
A major change in fishing methods occurred in1916 when airplanes were introduced to locateconcentrations of fish. Plant operators foundthis practice so successful that they rapidly addedmore planes in following years (Table 1). Initially, airplanes scouted wide areas and directedvessels to places where menhaden were abundant.Later, after captains were given portable radios,the airplane pilot directed the actual setting ofthe net. Since about 19GO airplanes have beenan integral part of fishing operations (Robas,19S9; .Tune, 1963).
Fish pumps, initially installed on carrier vessels in 1916, were the first significant advance
TABLE l.-Numher of airplanes used in the Atlanticmenhaden fishery. a
Tolal~~-
1945 0 0 0 0 01946 0 1 1 0 21947 0 7 I 2 101948 I 8 1 2 121949 1 11 I 2 15
a Exact data are not available for fhe North Carolina fall fishery.E"timoles indicate that 20 to 25 were used each year after about 1955.
NICHOLSON: ATLANTIC MENHADF:N PURSE-SEINE FISHERY
in fishing methods after World War II (Robas,1959). Pumping fish directly from the purseseine to the hold replaced the time-consumingmethod of brailing and left more time for scouting and making additional sets. By 1955 nearlyall vessels were equipped with fish pumps(Table 2).
Before fish in the seine can be pumped orbrailed aboard the carrier vessel, they must beconcentrated, or "hardened-up." This can bednne by crewmen in the purse boats pulling inthe net by hand, but it is a laborious process thatrequires approximately 22 men. A mechanical
TABLE 2.--Percent of vessels equipped with fish pumpsand power blocks in the Atlantic menhaden purse-seinensh"ry.
device, or "power block," for "drying-up" the net,used experimentally in 1955, became operationalin 1956 (Schmidt, 1959a). Its use reduced thecrew by 6 to 10 men and the average time to"harden-up" the fish by about 6 min (Schmidt,1959a, 1959b), and enabled the crew to retrievethe net quickly if the fish were missed. Powerblocks were used extensively for the first timein 1958 and by 1966 were installed on nearly allvessels from Long Island southward (Table 2).
Large sets are sometimes lost when the netcannot be raised manually or mechanically toconcentrate the fish so that they may be pumped.But the pump head, if positively charged withelectricity, becomes an electrode that attracts andconcentrates menhaden without the necessity ofraising the bunt (Kreutzer 1959). Such a device, commonly called a "fish shocker," was firstinstalled on vessels in 19;)6, but its use did notspread beyond the Middle and North Atlanticareas. By 1966 it had fallen into disuse(Table 3).
Beginning in 1954, nylon nets gradually replaced cotton or linen nets (Tclble 3). Althoughmore expensive initially, nylon nets last longerand do not split or tear when filled with fishas other nets sometimes do.
Aluminum purse boats began replacing wooden purse boats in 1957 (Table 3). Being lighter,more maneuverable, and more stable than wooden boats, they can encircle a school of fish easier
TABLE 3.-Percent of vessels equipped with fish shockers, nylon nets, and aluminum purse boats in the Atlanticmenhaden purse-seine fishery.
Middle Atlantica Chesapeake Bay South Atlantic
Year Fish INylon I
Aluminum Fish I Nylon TIinum Fish Aluminum
shockers nets bursa shockers nets purse shockers purseoats boats boats
1954 a 2 a a a a 0 a a1955 0 5 0 0 0 0 0 0 01956 47 19 a a 4 a a a a1957 45 18 a a 44 a 0 13 a1958 85 100 66 a 82 4 0 14 01959 85 100 85 0 94 23 a 20 a1960 82 100 82 0 100 32 0 45 01961 82 100 82 a 100 30 a 58 a1962 82 100 89 a 100 63 0 81 331963 82 100 100 a 100 83 a 100 501964 78 100 100 0 100 100 0 100 501965 86 100 100 a 100 100 a 100 581966 a 100 100 0 100 100 0 100 691967 0 100 100 0 100 100 a 100 100
and faster, and can operate more easily in roughseas.
Three jet-propelled purse boats were introduced in 1962. Adjustable jet nozzles on eachend gave the boats excellent maneuverability,and there was no propeller or guard to entanglenets. They lacked the power to close up the seinerapidly, however, and were abandoned.
With the exception of airplanes for spotting,none of the improvements were adopted by vessels in the Point Judith, Gloucester, or Portlandfleets. All vessels fishing from these ports weresmall to medium-sized otter trawlers that wereconverted to purse seining for only about 2months during the summer.
DESCRIPTION OF THE FISHERY
The purse-seine season for menhaden extendsfrom late spring through fall, but the time variesin different localities. South of Cape Hatteras,N.C., it begins in April or May and lasts untillate December or early January. From Chesapeake Bay to the southern shore of Long Islandit begins in late May and usually ends about thethird week in October. North of Cape Cod theseason lasts only from about late June to earlySeptember.
To facilitate summarizing and discussing annual changes in the fishery, June and Reintjes(1959) divided the range of Atlantic menhadeninto four areas, the North Atlantic, Middle Atlantic, Chesapeake Bay, and South Atlantic (Figure 1). Although the boundaries are arbitrary,they were drawn to take advantage of naturalseparations in the fishing areas. Similaritiesin age and size composition of the catches, timeand duration of fishing, and range of vessels fromthe home port tended to set each area apart.The North Carolina fall fishery, a specializedfishery that occurs only during November andDecember from Cape Hatteras to Cape Fear, isdistinct from the summer fishery in the SouthAtlantic and was treated as if it were an area.This classification, which provides a convenientway of expressing statistics of the fishery, is usedin the present analysis. Ports in the South Atlantic area are Fernandina Beach, Fla.; YongesIsland, S.C.; and Southport and Beaufort, N.C.;
768
FISHERY BULLETIN: YOLo 69, NO.4
in the Chesapeake Bay area-Reedville, Va.; inthe Middle Atlantic area, Lewes, Del.; and Wildwood, Tuckerton, and Port Monmouth, N.J.; inthe North Atlantic area-Amagansett, N.Y.;Point Judith, R.L; Gloucester, Mass.; and Portland, Maine; and in the North Carolina fall fishery-Beaufort and Morehead City, N.C.
A disadvantage of the fishery area concept isthat all of the fish landed at a port in a particular area may not have been caught in that area.The problem is not serious, however, because vessels seldom fish in areas other than the one inwhich their home port is located. Port Monmouth vessels, which sometimes go through theEast River to fish in western Long Island Sound,and Amagansett vessels, which sometimes fishoff the northern New Jersey coast, contradict thisgeneral rule more often than do vessels at otherports.
The number and location of daily purse-seinesets each year from 1955 to 1966 were obtainedfrom logbooks placed aboard vessels at the beginning of each fishing season. Port samplerswere instructed to pick up copies of each pageevery 2 weeks, answer questions pertaining tothe methods of keeping the logs, and stimulateinterest of the pilots to keep the logs completeand up to date. From 25 to 100j;, of the boatsfishing at each port kept logs. Although generally over 60~:' of the fleet was covered eachyear, many vessels did not keep complete records.
Daily landings of each vessel were copied fromplant records. Although some records extendedback as far as 1912, records at most plants werenot available for years prior to 1940.
ANNUAL CATCH
No trends were evident in the annual catchesin the South Atlantic area or North Carolinafall fishery, but the catches in the other threeareas reflected an increase in fishing effort after1945 and a decline in abundance after 1956(Table 4). After reaching a peak in 1956 of378,300 metric tons in the Middle Atlantic areaand 98,500 tons in the North Atlantic area, thecatch declined to 6,000 and 1,800 tons, respectively in 1966. In the Chesapeake Bay area thecatch decreased from 196,800 metric tons in
NICHOLSON: ATLANTIC MENHADEN PURSE-SEINE FISHERY
1959 to 115,600 tons in 1966. In the North Atlantic area, the Point Judith, Gloucester, andPortland fleets, which began menhaden fishingabout 1949, accounted for most of the increasesbetween 1950 and 1960. Menhaden were notlanded at Portland after 1957 or at Gloucesterand Point Judith after 1962.
CALCULATION OF FISHING EFFORT
In any searching fishery where the sizes andtypes of vessels vary, the unit of fishing effortis difficult to define. Marr (1950) found a positive linear relation between mean catch per boatweek and boat length in the Pacific sardine(Sardinops sagax) fishery off Oregon. He selected the modal boat-length group as a standard,calculated the catch per boat week of boats inthis group for each year, and based his estimatesof apparent abundance on this index. He wasunable, however, to estimate total effort except
by dividing the total catch of all vessels by thecatch per unit of the standard group.
Silliman and Clark (1945), studying the Pacific sardine fishery off California, linked groupsof identical vessels and estimated apparentabundance from the catch per boat week of thesegroups. They estimated the total effort by dividing the total catch by the catch per boat weekof the linked group, assuming that the catch perboat week of the selected vessels was representative of the catch per boat week of the fleet, andusing a base season for each of the three areasthey studied. Recognizing the effect of differences in vessel size on catch per unit of effort,they used a standard multiple regression to estimate total effort in each area by relating in asingle equation the length and horsepower of eachvessel, the number of vessels, and the number ofweeks.
Clark and Daugherty (1950) extended thestudy by Silliman and Clark through the 1948-49
TABLE 4.-Atlantic menhaden purse-seine catch by year and area.
Area
Year North Middle Chesapeake South North Carolina Totol
Any time period, therefore, that assumes continuous fishing and accounts for unproductivefishing days should be a satisfactory unit of basicfishing effort. Because the vessel week satisfiesthese conditions and may be readily computed,it was selected as the basic unit.
Because variations in the catch per unit ofeffort among vessels may necessitate adjustingthe basic unit to a common standard, the relative efficiency of vessels fishing from each portwas examined.
No clear correlation could be shown betweencatch per week and vessel length or weight, sothe relation between mean catch per week andvessel carrying capacity was explored. Carrying capacity, determined for each vessel by averaging the 10 largest catches for 3 consecutiveyears, ranged from about 100 to 350 short tons(90-317 metric tons). Vessels were grouped,according to their carrying capacity in shorttons, into six classes:
1 <1412 141-1803 181-2204 221-2605 261-3006 >300
The relative efficiency of vessels at each portwas examined by plotting the mean catch perweek of each vessel and by plotting the catchper week against carrying capacity.
In the South Atlantic area all vessels wereclass 3 at Fernandina Beach, Yonges Island, andSouthport, and class 1 or 3 at Beaufort. Variation in the catch per week among vessels wasevident at all ])orts, but there was no distincttendency for any group to have larger or smallercatches per week than another.
Until about 1963 nearly all vessels in Chesapeake Bay were class 3, although a few wereclass 2, 4, or 5. After 1961 the number of class5 vessels increased. Although the large capacityvessel tended to have greater mean catches perweek than small capacity vessels, the variationwas extreme among all vessels, both between andwithin years. As the catch per week declinedafter 1961, the variation between vessels of smalland large capacities decreased.
season. They also used linked groups of vessels,but simplified calculations by using catch perlunar month rather than catch per week.
June and Reintjes (1957), studying the menhaden fishery off Delaware Bay, used the linkagemethod to determine the catch per boat weekfor selected boats from 1939 to 1953. Theyestimated the total number of boat weeks by dividingthe total catch by the catch per boat week.
In the yellowfin tuna (Thurmlls albawres)bait-boat fishery in the eastern tropical Pacific,Shimada and Schaefer (19S6) grouped vesselsby carrying capacity. They computed the catchper days absence from port for each group andestablished one group as a standard. Theystandardized effort by dividing the catch per daysabsence of the standard group by the catch perdays absence of each other group. Broadhead(1962) related the catch per day of bait boats tothe catch per day of purse-seine vessels by usingregression analysis.
Menhaden plant records, while showing thedate and amount of fish landed by each vessel,do not list days when vessels fish and catchnothing, and do not indicate whether a catchrepresents 1 or more days' fishing. While vessels generally land their catch daily, quite oftenin the Middle and North Atlantic areas theyland 2 or 3 days' catch at one time, particularlyin late spring and early fall, a practice whichhas increased in recent years as fish have becomescarce and daily catches smaller.
There is no satisfactory way of getting thecomplete daily history of each vessel. Even ifport samplers recorded each vessel's daily activity, the records still would be incomplete because not all ports are sampled and because noports were sampled prior to 1955. Logbookrecords also are incomplete. Any effective method of measuring effort. therefore, must use vessel landings as they are recorded at the plants.
Fortunately, menhaden vessels generally operate continuously throughout all or part of thefishing season and fish every day that weatherpermits, unless in port for repairs. Except inthe North Carolina fall fishery, which lasts only6 to 8 weeks, the number of days that bad weatherprohibits menhaden fishing is relatively smalland is relatively constant from year to year.
770
Class Carrying capacity
NICHOLSON: ATLANTIC MENHADEN PURSE-SEINE FISHERY
In the Middle Atlantic area vessels rangedfrom class 2 to 6, but no more than two classesoccurred at any port. At Port Monmouth andTuckerton, class 6 vessels did not show substantially greater catches per week than class 5vessels. Class 5 vessels at Lewes clearly hadgreater catches per week than class 3 vessels,while class 5 vessels at Wildwood had greatercatches per week than class 2 vessels.
Because the increases in the catch per vesselweek that accompanied the increases in vesselcarrying capacity were small and inconsistentand the variability between ports was great, novessel class was designated as a standard for thefishery. Effort was simply left unadjusted atall except five ports-Lewes, Wildwood, PointJudith, Gloucester, and Portland.
Effort at Lewes and Wildwood was adjustedbecause the differences in the catch per unit ofeffort between the two classes at each port werelarge. At these ports the 10-year mean of theratio of the catch per week of the group of largervessels to that of the group of smaller vesselswas computed for 1950-59. Annual effort ofthe smaller vessels was adjusted by multiplyingthe total number of weeks fished each year bythe mean ratio, 0.610 for Wildwood and 0.573for Lewes.
Effort at the other three ports was adjustedbecause many of the vessels, which were smallto medium-size otter trawlers temporarily converted to purse seiners during the summer, fishedintermittently, usually only when menhaden wereplentiful. Because effort could not be measuredvery precisely under these conditions, it was estimated in terms of Amagansett units by dividingthe annual catches at these ports by the meancatch per week of Amagansett vessels.
Most menhaden vessels were class 3, 4, or 5.At most ports the relative proportions of oneclass to another changed very little each year andthe number of vessels remained fairly constant(Table 5). Under such conditions the numberof vessel weeks, with minor adjustments, wasas precise an estimate of total fishing effort aswas possible to obtain. Various other adjustments might have been made, but with doubtfulimprovement in the overall estimate of fishingeffort.
Henceforth, vessel weeks will refer to units offishing effort and will include these adjustments.
NUMBER OF VESSEL WEEKS
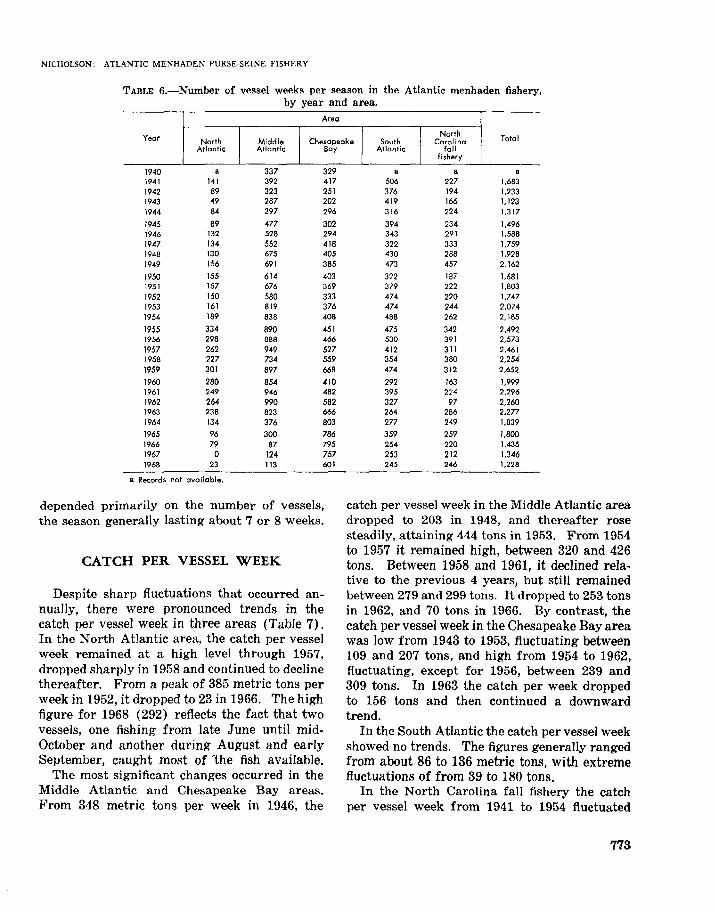
After World War II ended in 1945, the numberof vessel weeks rose sharply in the ChesapeakeBay, Middle Atlantic, and North Atlantic areas(Table 6). The increase resulted from the addition of vessels in all areas and from an increasein the number of weeks that plants in the Northand Middle Atlantic operated.
After 19G9 in the North Atlantic and 1962 inthe Middle Atlantic, the number of vessel weeksdropped sharply. Much of the decrease in theNorth Atlantic between 1959 and 1962 can beattributed to a reduced number of convertedtrawlers at Portland, Gloucester, and Point Judith, where no menhaden were landed after 1962.After 1962 the number of vessels at Amagansettalso declined. Reduced effort in the Middle Atlantic after 1962 was due to a decrease in thenumber of vessels. The Tuckerton plant and oneof the Lewes plants closed during the 1964 seasonand never reopened. The Wildwood plant operated only a few weeks each year after 1964,and the boats were transferred to plants in Chesapeake Bay. The remaining plant at Lewesclosed after the 1965 season.
Effort in the Chesapeake Bay area fluctuatedbetween approximately 300 and 400 vessel weeksfrom 1944 to 1954; thereafter it generally increased (except when fishing was restricted in1960 because of a poor market) until about 800vessel weeks were reached in 1964-66. Additional vessels accounted for most of the increasethrough 1963. In 1964-68, fishing terminatedapproximately 7 weeks later (mid-November)than in previous years.
In the South Atlantic area, effort fluctuatedbetween 245 and 530 vessel weeks from 1941to 1968. Although some fluctuation was due tovariation in the length of the fishing season, particularly in Florida, most was due to variationsin the number of vessels. The annual number ofvessels, and vessel weeks, generally was less from1960 to 1968 than ill previous years.
In the North Carolina fall fishery, the numberof vessel weeks varied from 97 to 457 and
771
TABLE 5.-Number of menhaden vessels fishing at Atlantic coast ports, by class capacity.
Amagansett, Port Monmouth, Tuckerton, lewes, Wildwood, Reedv;!le, Va. Beaufort, N.C. Southport, Fernandina Beach, Fla.N.Y. N.J. N.J. Del. N.J. N.C. and Yonges Is., S.c.
Year Closs Closs Class Closs Class Class Class Closs Class
5 I 6 5 I 6 5 I 6 3 I 5 2 I 5 2 I 3 I 4 I 5 1 I 2 I 3 2 I 3 3
1940 a. a a a 0 0 15 4 3 0 2 7 1 0 10 4 0 4 0 a1941 9 0 a a 0 0 12 3 5 0 2 12 1 0 6 1 0 5 0 151942 9 0 a a 0 0 16 3 3 0 2 12 1 0 6 1 0 3 0 101943 5 0 a a 0 0 12 1 3 0 1 S 0 0 5 0 0 2 0 151944 6 0 a a 0 0 20 4 3 0 1 9 1 0 6 0 0 3 0 13
1945 6 0 a a 4 0 10 5 2 0 1 10 0 5 0 0 3 0 121946 7 0 a a 5 0 12 7 2 0 1 8 0 6 0 0 3 0 81947 8 0 a a 5 0 14 6 2 0 1 13 0 5 0 1 3 0 81948 9 0 a a 5 0 20 11 3 0 2 14 0 9 2 2 3 0 121949 7 2 a a 6 0 15 10 3 0 1 13 0 7 1 2 3 3 14
1950 7 2 a a 6 0 12 11 3 1 1 13 2 5 2 3 3 3 81951 8 2 a a 6 0 12 13 2 2 1 13 1 5 2 1 2 3 91952 7 2 a a 6 0 7 11 2 2 1 10 1 6 1 2 3 5 101953 7 2 a a 5 1 10 14 3 3 1 16 0 6 1 2 3 5 121954 7 2 a a 5 1 10 12 4 3 2 17 0 6 1 2 2 5 11
depended primarily on the number of vessels,the season generally lasting about 7 or 8 weeks.
CATCH PER VESSEL WEEK
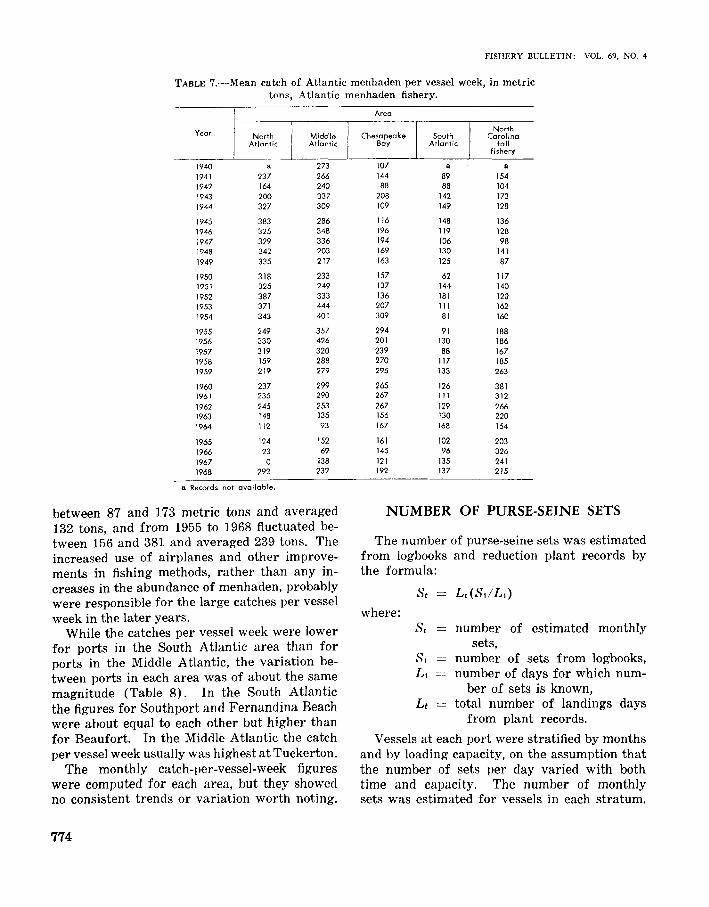
Despite sharp fluctuations that occurred annually, there were pronounced trends in thecatch per vessel week in three areas (Table 7).In the North Atlantic area, the catch per vesselweek remained at a high level through 1957,dropped sharply in 1958 and continued to declinethereafter. From a peak of 385 metric tons perweek in 1952, it dropped to 23 in 1966. The highfigure for 1968 (292) reflects the fact that twovessels, one fishing from late June until midOctober and another during August and earlySeptember, caught most of 'the fish available.
The most significant changes occurred in theMiddle Atlantic and Chesapeake Bay areas.From 348 metric tons per week in 1946, the
catch per vessel week in the Middle Atlantic areadropped to 203 in 1948, and thereafter rosesteadily, attaining 444 tons in 1953. From 1954to 1957 it remained high, between 320 and 426tons. Between 1958 and 1961, it declined relative to the previous 4 years, but still remainedbetween 279 and 299 tons. It dropped to 253 tonsin 1962, and 70 tons in 1966. By contrast, thecatch per vessel week in the Chesapeake Bay areawas low from 1943 to 1953, fluctuating between109 and 207 tons, and high from 1954 to 1962,fluctuating, except for 1956, between 239 and309 tons. In 1963 the catch per week droppedto 156 tons and then continued a downwardtrend.
In the South Atlantic the catch per vessel weekshowed no trends. The figures generally rangedfrom about 86 to 136 metric tons, with extremefluctuations of from 39 to 180 tons.
In the North Carolina fall fishery the catchper vessel week from 1941 to 1954 fluctuated
773
FISHERY BULLETIN: VOL. 69, NO.4
TABLE 7.-Mean catch of Atlantic menhaden per vessel week, in metrictons, Atlantic menhaden fishery.
between 87 and 173 metric tons and averaged132 tons, and from 1955 to 1968 fluctuated between 156 and 381 and averaged 239 tons. Theincreased use of airplanes and other improvements in fishing methods, rather than any increases in the abundance of menhaden, probablywere responsible for the large catches per vesselweek in the later years.
While the catches per vessel week were lowerfor ports in the South Atlantic area than forports in the Middle Atlantic, the variation between ports in each area was of about the samemagnitude (Table 8). In the South Atlanticthe figures for Southport and Fernandina Beachwere about equal to each other but higher thanfor Beaufort. In the Middle Atlantic the catchper vessel week usually was highest at Tuckerton.
The monthly catch-per-vessel-week figureswere computed for each area, but they showedno consistent trends or variation worth noting.
The number of purse-seine sets was estimatedfrom logbooks and reduction plant records bythe formula:
St L t (StiLt)
where:St number of estimated monthly
sets,S) number of sets from logbooks,L) number of days for which num-
ber of sets is known,L t total number of landings days
from plant records.
Vessels at each port were stratified by monthsand by loading capacity, on the assumption thatthe number of sets per day varied with bothtime and capacity. The number of monthlysets was estimated for vessels in each stratum.
NICHOLSON, ATLANTIC MENHADEN PURSE-SEINE FISHERY
TABLE S.-Mean catch of Atlantic menhaden per vessel week, in metric tons, landed at ports in the South andMiddle Atlantic areas.
Fernandina Southport, Beaufort, J lewes, Tuckerton, PortYear Beach, Fla., and Monmouth,
Yonges Is., s.c. N.C. Del. N.J. N.J.N.C.
1940 a 73 27 255 165 b 3181941 106 88 36 292 211 b 2571942 109 84 34 261 243 b 2171943 170 119 51 337 309 b 3441944 170 148 107 319 269 b 302
1965 105 137 69 131 103 b 1871966 137 67 72 50 238 b 481967 173 172 192 b 171 b 1221968 122 260 189 b 175 b 261
a Records not available.b Plant closed.
Monthly totals at each port were obtained bysumming the estimates for each stratum, seasonal totals by summing the monthly estimates,and area totals by summing the totals of eachport. The mean number of sets per day foreither month or season was calculated by dividing the total number of estimated sets by thetotal number of fishing days.
Because of the difficulty of maintaining goodlogbook records in recent years, the analysiswas not continued beyond 1966. By that timelittle fishing was done north of Chesapeake Bay.
At ports where more than one size class ofvessels fished, the larger vessels generally averaged slightly more sets per day than the smallerones (Table 9). The differences were greaterat ports where the vessel classes were not adjacent (Lewes and Wildwood) than they were atports where the vessel classes were adjacent(Amagansett, Port Monmouth, and Tuckerton).Because data were insufficient to calculate the
mean catch per set for each vessel class in Chesapeake Bay, the data were combined for classes2 and 3, and 4 and 5. After 1964 the lack ofdata made meaningful comparisons impossible.
The slightly greater mean number of sets perday for the larger vessels may reflect the abilityof these vessels to steam faster and range fartherfrom their home port, and to carry more fishwhen fully loaded. More than likely, these figures reflect the ability and aggressiveness of thevessel captains, since the better ones generallyare assigned to the larger vessels.
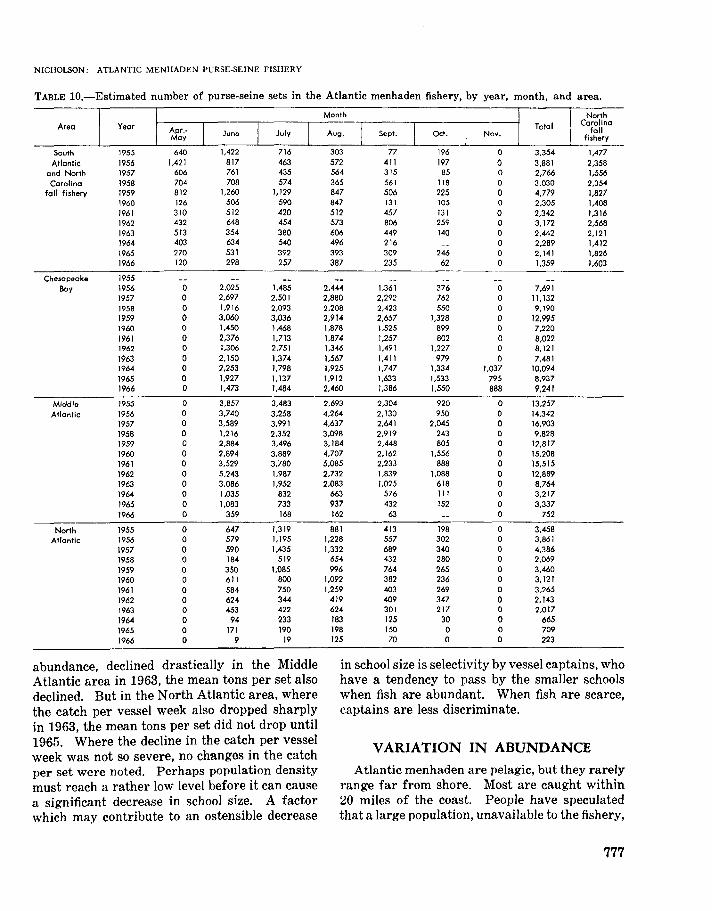
The annual or monthly number of sets (Table10) reflected the abundance of fish and theamount of fishing effort. Excluding the NorthCarolina fall fishery, the most sets per seasonthrough 1963 were usually made in the MiddleAtlantic area and the fewest sets in the SouthAtlantic. After 1963, following the drastic decline of the fishery and the decrease in effort inthe Middle and North Atlantic areas, the number
775
FISHERY BULLETIN: VOL. 69, NO.4
TABLE 9.-Mean number of purse-seine sets per day, Atlantic menhaden fishery, by port and vessel class.
of sets in Chesapeake Bay, reflecting the increasein effort, was more than double the number inany other area.
There also were differences in the mean number of sets per day between areas (Table 11).Generally, the greatest number of sets per daywas made in Chesapeake Bay, where vesselsaveraged about 0.10 set per day more than vessels in the Middle Atlantic. The fewest sets perday were made in the South Atlantic, where thetendency of schools to disappear by middaylimited fishing to the forenoon, and in the NorthCarolina fall fishery, where the huge schools offish enabled the vessels to load with relativelyfew sets.
CATCH PER SET
The mean catch per set varied monthly andannually in each area (Table 12). In all areasexcept the North Atlantic, it tended to be smallerduring the middle part of the season than duringthe early or later part. In the Middle and NorthAtlantic areas, it averaged 9 tons more in October than in any other month. Annually, it fluctuated randomly in all areas except the MiddleAtlantic, where it decreased after 1962.
Since purse seines tend to capture an entireschool, the mean catch per set is an estimate ofmean school biomass.
The school biomass appears to increase as theaverage age of the fish constituting the schoolincreases. The catch per set in the North At-
776
lantic, where 3-year and older fish constitute thebulk of catch, was higher than in the South Atlantic and Chesapeake Bay, where 1- and 2-yearold fish compose most of the catch (Nicholsonand Higham, 1964). In the South Atlantic in1960 and 1961, and in Chesapeake Bay in 1958,1960, and 1961, when 2- rather than 1-year-oldfish composed an unusually high percentage ofthe catch (Nicholson and Higham, 1964), themean catch per set was relatively high. In theMiddle Atlantic area in 1955 and 1956, when thecatch contained a large percentage of fish olderthan age 2 (June and Reintjes, 1959, 1960), themean catch per set was relatively high. Boththe mean catch per set and the average age werelow in the North Atlantic in 1957 and 1958. Inthe Middle Atlantic both the average age andthe mean catch per set tended to decrease fromJune to September and then increase sharplyin October, while in the North Atlantic bothtended to increase from June to October.
Except for the South Atlantic area, wherethe disappearance of schools by midday limitsthe number of sets, the mean number of setsper day (Table 11) and the mean tons per set(Table 12) were inversely correlated, implyingthat fewer sets were necessary to load a vesselin areas where the school biomass was large, thatschools became more numerous as their biomassdecreased, or that heavy fishing pressure tendedto keep school size small.
Relative abundance also appears to influenceschool biomass, but the relationship is not clear.When the catch per vessel week, a measure of
NICHOLSON: ATLANTIC MENHADEN PURSE-SEINE FISHERY
TABLE rO.-Estimated number of purse-seine sets in the Atlantic menhaden fishery, by year, month, and area.
abundance, declined drastically in the MiddleAtlantic area in 1963, the mean tons per set alsodeclined. But in the North Atlantic area, wherethe catch per vessel week also dropped sharplyin 1963, the mean tons per set did not drop until1965. Where the decline in the catch per vesselweek was not so severe, no changes in the catchper set were noted. Perhaps population densitymust reach a rather low level before it can causea significant decrease in school size. A factorwhich may contribute to an ostensible decrease
in school size is selectivity by vessel captains, whohave a tendency to pass by the smaller schoolswhen fish are abundant. When fish are scarce,captains are less discriminate.
VARIATION IN ABUNDANCE
Atlantic menhaden are pelagic, but they rarelyrange far from shore. Most are caught within20 miles of the coast. People have speculatedthat a large population, unavailable to the fishery,
777
FISHERY BULLETIN: VOL. 69. NO.4
TABLE ll.-Mean number of purse-seine sets per vessel day in the Atlantic menhaden fishery, by year, month, andarea. Raw means are weighted, column means are unweighted.
may occur far offshore. There is no availableevidence to support this view.
There is evidence, however, that the entirepopulation is fished. Since 1945 Atlantic menhaden have been exploited from northern Floridato the Gulf of Maine, an area constituting nearlytheir entire range. With the advent of airplanesthat could search larger areas and vessels that
could range up to a hundred miles from port,no areas have been unsearched or unfished, except where prohibited by local restrictions.
Under these conditions changes in the catchper unit of effort are assumed to reflect changesin actual, rather than apparent, abundance.Even though the figures have been influencedby changes in vessel efficiency, they are sensitive
778
NICHOLSON: ATLANTIC MENHADEN PURSE·SEINE FISHERY
TABLE 12.-Mean catch per purse-seine set of Atlantic menhaden, in metric tons, by year, month, and area. Rowmeans are weighted, column means are unweighted.
enough to reflect real differences in populationabundance.
Variations in year-class strength have contributed to fluctuations in population abundance.Estimates of year-class strength prior to 1952have been based on catch-per-unit-of effort figures and since 19f1Z on catch samples. From1950 to 1958 there were four exceptionally large
year classes, the largest occurring in 1958 (Juneand Reintjes, 1959; Nicholson and Higham,1964). Most of the year classes after 1958 havebeen smaller than any of the year classes priorto 1958. This series of small year classes occurred simultaneously with the general declinein abundance, which began about 1956 and became more noticeable in 1963, after the large
779
1958 year class had nearly passed from thefishery.
The greatest decline in abundance has beenin the Middle and North Atlantic areas, whereolder fish constitute the bulk of the catches.Fish pumps and airplane spotters, two of theimprovements having the most impact on fishingeffectiveness, increased sharply in both areasafter 1949. Yet the catch per vessel week, afterreaching a peak in about 1952, declined thereafter in both areas, despite other fishing improvements added in the middle 1950's. In the NorthAtlantic, the catch per vessel week, except for1952 and 1953, was no greater from 1950 through1962 than it had been from 1941 to 1950. In theMiddle Atlantic, the catch per vessel week, although being substantially greater from 19fi2 to1962 than it had been up until 1951, began asteady decline in 1957, and from 1963 to 1966was much lower than in the years prior to 1950.From these data one may conclude that theabundance of menhaden in these two areas wasno greater from 1950 to 1962, and considerablyless after 1962, than it had been prior to 1950.
The decline in abundance in Chesapeake Bay,where 1- and 2-year-old fish compose most ofthe catches, has not been as great as in theNorth and Middle Atlantic. The catch per vesselweek was substantially greater from 1954 to 1962than it was prior to 1954 or after 1962. Sincethe major improvements in fishing methods camea few years later than in the Middle and NorthAtlantic, the higher catches per vessel week after1953 probably reflect an increase in fishing efficiency, although they could reflect an increase inmenhaden abundance. The decrease after 1962probably resulted from a true decrease in menhaden abundance.
Abundance in the South Atlantic, where age-lfish compose most of the catch, appears to haveremained unchanged. The catches per vesselweek varied widely, but showed no trend. Inthis area the fisheries at the three ports aresmall, geographically distinct, and dependent onrelatively small numbers of fish, principally ofone age group, that are dispersed over a Jargp.area. If the carrying capacity is less in the SouthAtlantic than in other areas, the abundance offish in the area is less likely to reflect changes
780
FISHERY BULLETIN: YOLo 69, NO.4
in the total Atlantic menhaden population thanis the abundance of fish in areas of high densityand high carrying capacity, such as ChesapeakeBay.
In the North Carolina fall fishery menhadennearly always will appear to be abundant, because they are concentrated in a small area fora short period of time and are easy to catch.But since weather is more variable than in otherareas, it influences the catch per vessel weekmore than it does elsewhere. The wide fluctuations in the catch per vessel week, therefore,do not necessarily reflect variations in abundance.
The relation between the decline in abundanceand the high levels of fishing effort can be understood only if the spawning age, the age and sizedistribution, and the seasonal movements of thefish are considered. Atlantic menhaden spawnafter they have completed three growing seasons(Higham and Nicholson, 1964), and rarely survive past seven growing seasons. Their age andsize distribution and seasonal movements havebeen described by June and Nicholson (1964)and Nicholson; and are briefly summarized here.
During the fishing season from about May toOctober, the population from Florida to Chesapeake Bay is composed primarily of age-1 andage-2 fish. Although the proportion of each agegroup varies with the strength of individual yearclasses, age-l fish are usually more abundant,particularly south of Cape Hatteras. From themouth of Chesapeake Bay to Long Island, age-2fish gradually replace age-1 fish as the dominantage group. Age-3 fish, dominant in Long Islandand Nantucket Sounds, become less abundantnorth of Cape Cod, where age-4 to age-7 fishpredominate. A southward movement beginsamong fish at the northern end of the rangein late summer and extends to all fish north ofCape Hatteras by early November. By mid-January nearly all menhaden have moved into theoffshore area between Cape Lookout and northern Florida. In late winter these fish begin anorthward movement.
• Nicholson, William R. Movements of Atlantic menhaden as inferred from changes in age and size distribution. (Unpublished manuscript.)
NICHOLSON: ATLANTIC MENHADEN PURSE·SEINE FISHERY
As older fish decreased in abundance, fisheriesdependent on them declined. No menhaden werelanded after 1958 at Portland, after 1962 atGloucester, or after 1963 at Point Judith. Afterthe 1958 year class ceased to contribute largenumbers to the catch, the Amagansett, Port Monmouth, and Tuckerton catches dropped sharply.As catches declined and plants closed or reducedfishing, effort also dropped. By 1968 only 136vessel weeks were expended in the North andMiddle Atlantic, as compared with 1,265 in 1962.
Effort in areas where age-l and -2 fish werepredominant continued to be high. In 1968, 846vessel weeks were expended in the South Atlanticand Chesapeake Bay, as compared with 909 in1962.
Changes in the catch and the catch per vesselweek suggest that the decline in numbers of fisholder than age 2 was much greater than the decline in numbers of fish younger than age 3.
If recruitment is dependent on spawning population size, and spawning population size is dependent on the escapement of prespawning agefish, the total yield will be limited by the amountof escapement. Schaaf and Huntsman' haveshown that with present levels of fishing effort,the spawning stock of Atlantic menhaden is inadequate for recovery of the population.
LITERATURE CITED
BROADHEAD, G. C.1962. Recent changes in the efficiency of vessels
fishing for yellowfin tuna in the Eastern PacificOcean. Inter-Am. Trop. Tuna Comm., Bull. 6:283-316.
CLARK, F. N., AND A. E. DAUGHERTY.
1950. Average lunar month catch by Californiasardine fishermen, 1932-33 through 1948-49. Calif.Div. Fish Game, Fish Bull. 76, 28 p.
HIGHAM, J. R., JR., AND W. R. NICHOLSON.
1964. Sexual maturation and spawning of Atlanticmenhaden. U.S. Fish Wildt Serv., Fish. Bull. 63:255-271.
JUNE, F. C.
1963. The menhaden fishery. In M. E. Stansby
, Schaaf, William E., and Gene R. Huntsman. Population dynamics of the Atlantic menhaden: An analysis of the purse seine fishery, 1955-69. (Unpublishedmanuscript.)
(editor), Industrial fishery technolog-y, p. 146-159.Reinhold Publishing Corp., New York.
JUNE, F. C., AND W. R. NICHOLSON.
1964. Age and size composition of the menhadencatch along the Atlantic coast of the United States,1958; with a brief review of the commercial fishery. U.S. Fish Wildl, Serv., Spec. Sci. Rep. Fish.46, 40 p.
JUNE, F. C., AND J. W. REINTJES.
1957. Survey of the ocean fisheries off DelawareBay. U.S. Fish Wildl, Serv., Spec. Sci. Rep. Fish.222, 55 p.
1959. Age and size composition of the menhadencatch along the Atlantic coast of the United States,1952-55; with a brief review of the commercialfishery. U.S. Fish Wildt Serv., Spec. Sci. Rep.Fish. 317, 65 p.
1960. Age and size composition of the menhadencatch along the Atlantic coast of the United States,1956; with a brief review of the commercial fishery. U.S. Fish Wild!. Serv., Spec. Sci. Rep. Fi~h.336, 38 p.
KREUTZER, C. O.1959. The use of electricity in commercial fishing
in the sea. Proc. Gulf Caribb. Fish. Inst. 11:50-52.
MARK, J. C.1950. Apparent abundance of the pilchard (Sardi
nOl)S caerulea) off Oregon Rnd Washington, 193543, as measured by the catch per boat. U.S. FishWild!. Serv., Fish. Bull. 51: 385-394.
NICHOLSON, W. R., AND J. R. HIGHAM, JR.
1964. Age and size composition of the menhadencatch along the Atlantic coast of the United States,1959; with a brief review of the commercial fishery. U.S. Fish Wildt Serv., Spec. Sci. Rep. Fish.478, 34 p.
ROBAS, J. S.1959. Menhaden purse seining. In H. Kristjonsson
(editor), Modern fishing gear of the world, p. 394399. Fishing News (Books) Ltd., London.
SCHMIDT, P. G., JR.
1959a. New purse-seining techniques in the menhaden fishery employing the power block. Proc.Gulf Caribb. Fish. Inst. 11: 46-50.
1959b. The Puretic power block and its effect onmodern purse seining. In H. Kristjonsson (editor), Modern fishing gear of the world, p. 400-413.Fishing News (Books) Ltd., London.
SHIMADA, B. M., AND M. B. SCHAEFER.
1956. A study of changes in fishing effort, abundance, and yield for yellowfin and skipjack tunain the Eastern Tropical Pacific Ocean. InterAm. Trop. Tuna Comm., Bull. 1: 351-421.
SILLIMAN, R. P., AND F. N. CLARK.
1945. Catch per-unit-of-effort in California watersof the sardine (Sardino1J8 caerulea) 1932-42.Calif. Div. Fish Game, Fish. Bull. 62, 76 p.