Developmental Cell Article Changes in Ect2 Localization Couple Actomyosin-Dependent Cell Shape Changes to Mitotic Progression Helen K. Matthews, 1 Ulysse Delabre, 2,3 Jennifer L. Rohn, 1 Jochen Guck, 2 Patricia Kunda, 1 and Buzz Baum 1, * 1 MRC Laboratory for Molecular Cell Biology, University College London, Gower St., London WC1E 6BT, UK 2 Department of Physics, Cavendish Laboratory, University of Cambridge, J.J. Thomson Avenue, Cambridge CB3 0HE, UK 3 PCC Curie, Institut Curie/CNRS/Universite ´ Paris 6 - UMR 168, 26 rue d’Ulm, 75248 Paris, France *Correspondence: [email protected]http://dx.doi.org/10.1016/j.devcel.2012.06.003 SUMMARY As they enter mitosis, animal cells undergo profound actin-dependent changes in shape to become round. Here we identify the Cdk1 substrate, Ect2, as a central regulator of mitotic rounding, thus uncover- ing a link between the cell-cycle machinery that drives mitotic entry and its accompanying actin re- modeling. Ect2 is a RhoGEF that plays a well-estab- lished role in formation of the actomyosin contractile ring at mitotic exit, through the local activation of RhoA. We find that Ect2 first becomes active in prophase, when it is exported from the nucleus into the cytoplasm, activating RhoA to induce the forma- tion of a mechanically stiff and rounded metaphase cortex. Then, at anaphase, binding to RacGAP1 at the spindle midzone repositions Ect2 to induce local actomyosin ring formation. Ect2 localization there- fore defines the stage-specific changes in actin cortex organization critical for accurate cell division. INTRODUCTION Cell division requires sequential changes in cell architecture, which are coordinated by a small set of conserved mitotic kinases (Ma and Poon, 2011). Although most recent attention has focused on the changes in microtubule organization that accompany spindle assembly and that drive chromosome segregation, mitotic progression is also accompanied by pro- found changes in cell shape. These begin at the onset of mitosis as cells detach from the substrate and round up (Cramer and Mitchison, 1997; Harris, 1973); a process that is important for spindle assembly, positioning, and chromosome capture (Car- reno et al., 2008; Kunda and Baum, 2009; Kunda et al., 2008). At mitotic exit, cells then elongate and divide in two, before re- spreading to take up their resting interphase shape once more. Mitotic rounding requires the loss of substrate adhesion (Dao et al., 2009), together with changes in surface volume ratio and osmotic pressure (Stewart et al., 2011). In addition, the actin cytoskeleton is completely remodeled to generate a rigid and rounded actomyosin cortex (Kunda et al., 2008). Although several actin regulators, including ERM proteins (Carreno et al., 2008; Kunda et al., 2008), myosin II (Maddox and Burridge, 2003), Cofilin, and WDR1 (Fujibuchi et al., 2005), are known to play roles in this process, it is not known how changes in actin organization are coupled to mitotic entry and progression. Entry into mitosis in mammalian cells is controlled by activa- tion of the mitotic Cdk1/CyclinB complex, through a tightly regu- lated process that involves multiple feedback loops (Lindqvist et al., 2009). Once active, Cdk1/CyclinB phosphorylates a large number of targets, triggering many of the early events of mitosis including centrosome separation, chromosome condensation, and nuclear envelope breakdown (Gavet and Pines, 2010b). Although some of the key substrates mediating the effects of Cdk1/CyclinB activity on chromatin, the nuclear lamina, and the mitotic spindle have been identified (Blangy et al., 1995; Ki- mura et al., 1998; Peter et al., 1990), it is not known if changes in Cdk1/CyclinB activity also function to directly alter actin fila- ment organization and dynamics. Here, we identify a known Cdk1 substrate (Hara et al., 2006; Niiya et al., 2006), Ect2, as a regulator of mitotic rounding. Ect2 is a RhoGEF that was previously shown to be essential for cytokinesis (Tatsumoto et al., 1999), where it activates RhoA to regulate assembly of the actomyosin contractile ring (Chalama- lasetty et al., 2006; Nishimura and Yonemura, 2006; Yu ¨ ce et al., 2005). We show that Ect2 also activates RhoA and its down- stream effectors, Rho kinase (ROK), and myosin II, at the onset of mitosis to induce the actomyosin remodeling that drives both mitotic rounding and cortical stiffening. This early function of Ect2 is dependent on its export from the nucleus in prophase, but does not require RacGAP1 (also known as MgcRacGAP) or microtubules, which have been shown to drive the relocalization of Ect2 to the cell equator prior to cytokinesis (Burkard et al., 2009; Petronczki et al., 2007; Somers and Saint, 2003; Wolfe et al., 2009; Yu ¨ ce et al., 2005). These data show that, through regulated changes in its localization, Ect2 is able to reshape the mitotic cell to drive rounding upon entry into mitosis and cleavage furrow formation at mitotic exit. RESULTS Rounding Is Initiated at the Start of Mitosis To better understand the coupling between cell shape changes and mitotic progression, we began by determining the timing of mitotic rounding relative to the other events of mitotic entry. HeLa cells expressing Histone H2B-mRFP and tubulin-GFP Developmental Cell 23, 371–383, August 14, 2012 ª2012 Elsevier Inc. 371
Transcript
Developmental Cell
Article
Changes in Ect2 LocalizationCouple Actomyosin-Dependent Cell ShapeChanges to Mitotic ProgressionHelen K. Matthews,1 Ulysse Delabre,2,3 Jennifer L. Rohn,1 Jochen Guck,2 Patricia Kunda,1 and Buzz Baum1,*1MRC Laboratory for Molecular Cell Biology, University College London, Gower St., London WC1E 6BT, UK2Department of Physics, Cavendish Laboratory, University of Cambridge, J.J. Thomson Avenue, Cambridge CB3 0HE, UK3PCC Curie, Institut Curie/CNRS/Universite Paris 6 - UMR 168, 26 rue d’Ulm, 75248 Paris, France*Correspondence: [email protected]
http://dx.doi.org/10.1016/j.devcel.2012.06.003
SUMMARY
As they enter mitosis, animal cells undergo profoundactin-dependent changes in shape to become round.Here we identify the Cdk1 substrate, Ect2, asa central regulator of mitotic rounding, thus uncover-ing a link between the cell-cycle machinery thatdrives mitotic entry and its accompanying actin re-modeling. Ect2 is a RhoGEF that plays a well-estab-lished role in formation of the actomyosin contractilering at mitotic exit, through the local activation ofRhoA. We find that Ect2 first becomes active inprophase, when it is exported from the nucleus intothe cytoplasm, activating RhoA to induce the forma-tion of a mechanically stiff and rounded metaphasecortex. Then, at anaphase, binding to RacGAP1 atthe spindle midzone repositions Ect2 to induce localactomyosin ring formation. Ect2 localization there-fore defines the stage-specific changes in actincortex organization critical for accurate cell division.
INTRODUCTION
Cell division requires sequential changes in cell architecture,
which are coordinated by a small set of conserved mitotic
kinases (Ma and Poon, 2011). Although most recent attention
has focused on the changes in microtubule organization that
accompany spindle assembly and that drive chromosome
segregation, mitotic progression is also accompanied by pro-
found changes in cell shape. These begin at the onset of mitosis
as cells detach from the substrate and round up (Cramer and
Mitchison, 1997; Harris, 1973); a process that is important for
spindle assembly, positioning, and chromosome capture (Car-
reno et al., 2008; Kunda and Baum, 2009; Kunda et al., 2008).
At mitotic exit, cells then elongate and divide in two, before re-
spreading to take up their resting interphase shape once more.
Mitotic rounding requires the loss of substrate adhesion (Dao
et al., 2009), together with changes in surface volume ratio and
osmotic pressure (Stewart et al., 2011). In addition, the actin
cytoskeleton is completely remodeled to generate a rigid and
rounded actomyosin cortex (Kunda et al., 2008). Although
several actin regulators, including ERM proteins (Carreno et al.,
Develop
2008; Kunda et al., 2008), myosin II (Maddox and Burridge,
2003), Cofilin, and WDR1 (Fujibuchi et al., 2005), are known to
play roles in this process, it is not known how changes in actin
organization are coupled to mitotic entry and progression.
Entry into mitosis in mammalian cells is controlled by activa-
tion of the mitotic Cdk1/CyclinB complex, through a tightly regu-
lated process that involves multiple feedback loops (Lindqvist
et al., 2009). Once active, Cdk1/CyclinB phosphorylates a large
number of targets, triggering many of the early events of mitosis
including centrosome separation, chromosome condensation,
and nuclear envelope breakdown (Gavet and Pines, 2010b).
Although some of the key substrates mediating the effects of
Cdk1/CyclinB activity on chromatin, the nuclear lamina, and
the mitotic spindle have been identified (Blangy et al., 1995; Ki-
mura et al., 1998; Peter et al., 1990), it is not known if changes
in Cdk1/CyclinB activity also function to directly alter actin fila-
ment organization and dynamics.
Here, we identify a known Cdk1 substrate (Hara et al., 2006;
Niiya et al., 2006), Ect2, as a regulator of mitotic rounding. Ect2
is a RhoGEF that was previously shown to be essential for
cytokinesis (Tatsumoto et al., 1999), where it activates RhoA to
regulate assembly of the actomyosin contractile ring (Chalama-
lasetty et al., 2006; Nishimura and Yonemura, 2006; Yuce et al.,
2005). We show that Ect2 also activates RhoA and its down-
stream effectors, Rho kinase (ROK), and myosin II, at the onset
of mitosis to induce the actomyosin remodeling that drives
both mitotic rounding and cortical stiffening. This early function
of Ect2 is dependent on its export from the nucleus in prophase,
but does not require RacGAP1 (also known as MgcRacGAP) or
microtubules, which have been shown to drive the relocalization
of Ect2 to the cell equator prior to cytokinesis (Burkard et al.,
2009; Petronczki et al., 2007; Somers and Saint, 2003; Wolfe
et al., 2009; Yuce et al., 2005). These data show that, through
regulated changes in its localization, Ect2 is able to reshape
the mitotic cell to drive rounding upon entry into mitosis and
cleavage furrow formation at mitotic exit.
RESULTS
Rounding Is Initiated at the Start of MitosisTo better understand the coupling between cell shape changes
and mitotic progression, we began by determining the timing
of mitotic rounding relative to the other events of mitotic entry.
HeLa cells expressing Histone H2B-mRFP and tubulin-GFP
mental Cell 23, 371–383, August 14, 2012 ª2012 Elsevier Inc. 371
during which time mean HeLa cell length (Picone et al., 2010)
was reduced from 53 ± 3 mm to 23.5 ± 1.3 mm. Rounding began
in early prophase, before centrosome separation and visible
chromatin condensation, around 6 min before nuclear envelope
breakdown (Figure 1C). This makes rounding one of the earliest
events in mitosis, concordant with the rise in Cdk1 activity during
prophase as measured using a FRET probe (Gavet and Pines,
2010b). Since Cdk1/CyclinB is thought to directly control many
events of prophase (Gavet and Pines, 2010a), this suggested
the possibility that Cdk1/Cyclin B also instigates mitotic round-
ing. Indeed, Cdk1/Cyclin B has been shown to be sufficient to
induce rounding upon injection into interphase cells (Lamb
et al., 1990). Thus, in our search for upstream regulators of cell
rounding, we focused our attention on established Cdk1
substrates.
Ect2 Controls the Dynamics of Mitotic RoundingTo identify regulators of mitotic rounding, we carried out an RNAi
screen. We used siRNA to silence 60 key actin regulators. Since
372 Developmental Cell 23, 371–383, August 14, 2012 ª2012 Elsevie
we aimed to identify genes that couple mitotic progression to
changes in cell shape, this set specifically included siRNAs tar-
geting actin regulators previously identified as mitotic kinase
substrates in systematic large-scale screens (Beausoleil et al.,
2006; Blethrow et al., 2008; Dephoure et al., 2008; Ji et al.,
2002). Two days after siRNA treatment, HeLa cells were fixed,
stained, and analyzed to identify gene-specific siRNAs that
induced reproducible changes in mitotic cell shape and actin
organization (for details of screen methodology and list of genes
screened, see Supplemental Experimental Procedures and
Table S1 available online). This identified a number of siRNAs
that affected mitotic cell shape. Unsurprisingly in light of
previous work (Fujibuchi et al., 2005), this included two inhibitors
of actin filament formation, WDR1 and actin capping protein
(Table S1). More significantly for our purposes, the screen also
identified a single well-established Cdk1 substrate, Ect2.
To confirm a role for Ect2 inmitotic roundingwe turned to time-
lapse microscopy. Ect2 loss of function has previously been
shown cause cytokinesis failure, leading to the formation of
binucleate cells (Tatsumoto et al., 1999). Our analysis therefore
focused on the first cell division after Ect2 knockdown (around
24 hr after RNAi treatment) to avoid delays in rounding caused
by cells being large and multinucleate. This analysis revealed
that Ect2 depleted cells initiate rounding on schedule relative
to nuclear envelope breakdown, but round more slowly (mean
r Inc.
Developmental Cell
Ect2 Controls Cell Shape in Early Mitosis
rounding time of 31.1 ± 4.3 min, Figures 1B and 1D). The vast
majority then went on to fail cytokinesis (Figure 1E). Both pheno-
types were replicated using three different nonoverlapping
siRNAs (Figure 1E) and the knockdown at 24 hr was verified in
each case by western blotting (Figure 1F). Furthermore, as a
definitive proof that the phenotype reflects depletion of Ect2
itself, we rescued the RNAi phenotype in HeLa cells using the
constitutive expression of mouse Ect2-GFP (Hutchins et al.,
2010), which lacks the siRNA binding sequence (Figures 1E
and 1F). Finally, this function for Ect2 is not confined to HeLa
cells, as a similar phenotypewas observed following Ect2 knock-
down in RPE1 cells, a diploid nontransformed human cell line, as
well as inDrosophilaS2R+ cells depleted of the fly Ect2 homolog,
pebble (Prokopenko et al., 1999) (Figure S1). These data lead us
to conclude that Ect2 plays a conserved role in mitotic rounding.
Ect2 Is Required for Assembly of a Stiff Cortical ActinCytoskeleton at MitosisSince the actin cytoskeleton controls mitotic cell shape (Kunda
and Baum, 2009), we used confocal time-lapse microscopy to
determine whether this role for Ect2 in rounding reflects a role
in mitotic actin remodeling. In control cells expressing LifeAct-
GFP (Riedl et al., 2008), actin filaments were found to redistribute
to form a visible cortex underlying the plasmamembrane as cells
rounded and increased in height upon entry into mitosis (Fig-
ure 2A; Movie S1). This cortical recruitment was clearly per-
turbed in both live (Figure 2B; Movie S1) and fixed metaphase
Ect2 RNAi cells (Figures 2E and 2F). First actin filaments ap-
peared profoundly disorganized in Ect2 RNAi cells (Figure 2E).
In addition, Ect2 RNAi cells were considerably flatter than meta-
phase control cells (Figures 2C and 2D).
This role for Ect2 in mitotic actin cortex assembly would be
expected to lead to corresponding changes in mitotic cell
mechanics (Kunda et al., 2008). To test whether or not this is
the case, we used an ‘‘optical stretcher’’ to measure the rigidity
of control and Ect2 RNAi cells in mitosis. This phototonic tool
consists of two counter-propagating laser beams that are used
to trap and exert a stretching force on suspended cells passing
through a central microfluidic chamber (Figure 2G) (Guck et al.,
2001). The deformation induced by the two beams can then be
used to determine a cell’s compliance, an inverse measure of
its stiffness. Using this system, we first established that, as
previously reported (Kunda et al., 2008), mitotic cells are less
compliant than interphase cells and that this depends on an
intact actin cytoskeleton (Figure S2). Strikingly, however, mitotic
Ect2 RNAi cells were significantly more compliant than control
cells in mitosis (Figure 2H). Taken together, these data show
that Ect2 is essential for the assembly of the normal, rigid, acto-
myosin-based mitotic cortex.
It has previously been shown that a rigid and rounded actin
cortex is essential for spindle assembly in Drosophila cells (Car-
reno et al., 2008; Kunda et al., 2008). In addition, myosin II has
been shown to play an important role in centrosome separation
(Rosenblatt et al., 2004). Therefore Ect2 depleted HeLa cells
might be expected to exhibit spindle defects. We found that
while Ect2 RNAi cells were ultimately able to build a bipolar
spindle, cells suffered delays in centrosome separation and
spindle assembly (Figure S2) similar to those previously
observed when myosin activity is compromised (Rosenblatt
Develop
et al., 2004). In addition, Ect2 RNAi cells exhibited defects in
the alignment of chromosomes at the metaphase plate and in
their segregation at anaphase, where we frequently observed
lagging chromosomes (Figure S2). Furthermore, when we used
RNAi mediated depletion of Mad2 to compromise the spindle
checkpoint and to accelerate mitotic progression (Jones et al.,
2004), the majority of Ect2 depleted cells exhibited catastrophic
defects in chromosome segregation (Figure S2), while few
defects were seen in Mad2 RNAi control cells. Thus, the Ect2
dependent changes in mitotic actin cytoskeletal organization
and cell shape are required to support the timely assembly of
a functional bipolar spindle.
Ect2 Acts Upstream of RhoA and Myosin II to DriveMitotic RoundingEct2 is essential for cytokinesis. It is recruited to the spindle
midzone at anaphase through a physical interaction with
a component of the centralspindlin complex, RacGAP1 (Somers
and Saint, 2003; Yuce et al., 2005), where it induces the local
activation of RhoA and actomyosin ring formation (Tatsumoto
et al., 1999; Kamijo et al., 2006; Nishimura and Yonemura,
2006). We used small molecule inhibitors and siRNAs to deter-
mine which, if any, of these factors function together with
Ect2 in mitotic rounding (Figure 3A). Neither treatment with an
siRNA against RacGAP1 nor the removal of microtubules with
nocodozole affected the rate of rounding. This was the case
even though RacGAP1 silencing resulted in a highly penetrant
failure in cytokinesis. In contrast, and as expected based on
previous work, the inhibition of downstream targets of Ect2,
Rho (Maddox and Burridge, 2003), ROK (Meyer et al., 2011),
and myosin II (Cramer and Mitchison, 1997) led to a profound
delay in mitotic rounding, similar to that seen following Ect2
RNAi (Figure 3B).
To test whether Ect2 is directly responsible for RhoA activa-
tion before the onset of anaphase, a RhoA FRET probe was
used (Pertz et al., 2006). While RhoA activity was seen at the
cortex of control cells in prometaphase (Figure 3C) as previ-
ously described (Mali et al., 2010; Yoshizaki et al., 2003),
Ect2 silencing resulted in a marked reduction in cortical RhoA
activity (Figures 3D and 3E). Since RhoA activates ROK to alter
myosin II activity, in part through the phosphorylation of myosin
light chain (Amano et al., 1996), we then used an antibody
raised against p-myosin II to determine whether Ect2 also influ-
ences myosin II activation at the onset of mitosis. In interphase
cells, p-myosin II was visible in stress fibers, which were lost
along with focal adhesions in early prophase in control and
Ect2 RNAi cells (Figure S3). At the same time, p-myosin II
was seen accumulating at the retracting margins of control
cells as they rounded up (Figure 3F), but was largely absent
from Ect2 RNAi cells (Figures 3G and 3H). By contrast, when
we examined ERM protein activation using the same approach
(Kunda et al., 2008), we observed no differences in ERM phos-
phorylation between control and Ect2 RNAi cells (Figure S3).
Taken together, these data reveal that Ect2 is required at the
early stages of mitosis to activate RhoA and Myosin II to drive
the actomyosin contraction required for cell rounding. Signifi-
cantly, however, the upstream regulators of Ect2 activity are
distinct from those that are required for contractile ring forma-
tion at mitotic exit.
mental Cell 23, 371–383, August 14, 2012 ª2012 Elsevier Inc. 373
A B
E
GD
H
optical fibre optical fibre
stretch laser beams
control siRNA Ect2 siRNA
time (s)
J (
Pa
-1)
Stretch
F-ac
tin
cort
ex/c
ytopla
sm r
atio
F
con Ect2 con Ect2
cel
l hei
ght
(μm
)
C
Mitosis + con siRNA
Mitosis + Ect2 siRNA
Interphase
0
0.01
0.02
0.03
0.04
0.05
0.06
0 2 4 6
0
5
10
15
20
25
30
35
0
1
2
3
4
5
6
7
interphase mitosis
con Ect2 con Ect2
interphase mitosis
**
**
p = 0.33
p = 0.26
control siRNA Ect2 siRNA
29
μm
17
μm
time (mins) time (mins)
z (
μm)
z (
μm)
0
4
8
0
4
8
Figure 2. Ect2 Is Required for the Organization of a Rigid, Cortical Actin Cytoskeleton in Mitosis
(A and B) Time-lapse confocal images of HeLa cells entering mitosis labeled with LifeAct-GFP and histone H2B-mRFP treated with control siRNA (A) and
Ect2 siRNA (B). Time is in minutes. Three different z planes, 4 mm apart are shown. See also Movie S1.
(C) XZ projections of metaphase cells labeled with LifeAct-GFP and histone H2B-mRFP. Confocal Z sections were taken every 200 nm through living
cells covering the full height of the cell.
(D) Graph showing the mean height of cells in interphase and metaphase treated with control siRNA or Ect2 siRNA (n = 10–15 cells per condition). Error bars
show SD.
(E) Confocal micrographs of fixed metaphase HeLa cells stained to show the actin cytoskeleton in control siRNA and Ect2 siRNA cells. Actin is labeled with
phalloidin-TRITC in red, tubulin in green and 40,6-diamidino-2-phenylindole (DAPI) in blue, scale bars 10 mm.
(F) Quantification of the ratio of cortical/cytoplasmic actin in control and Ect2 RNAi cells in interphase and mitosis. Mean signal intensity in a 33 3 pixel box was
measured in the actin channel at two locations: 0.5 mm from the cell edge (cortex) and 5 mm from the cell edge (cytoplasm). Four sites per cell were measured and
the graph shows the mean values for 15 cells per condition with error bars denoting SD.
(G) Diagram of the optical stretcher set-up used to measure cell compliance.
(H) Graph showing mean compliance J(t) (see Experimental Procedures for detail) over time as cells are subjected to optical stretching for 4 s comparing control
siRNA cells in interphase (n = 60 cells) and mitosis (n = 63) and Ect2 siRNA mitotic cells (n = 45). Error bars denote SEM.
See also Figure S2.
Developmental Cell
Ect2 Controls Cell Shape in Early Mitosis
Ect2 Is Phosphorylated throughout MitosisHow is Ect2 able to control distinct processes at different times
in mitosis? Ect2 has previously been shown to be phosphory-
lated at multiple sites during mitosis, including at several Cdk1
target sites (Hara et al., 2006; Niiya et al., 2006; Su et al., 2011;
374 Developmental Cell 23, 371–383, August 14, 2012 ª2012 Elsevie
Yuce et al., 2005). This phosphorylation is required for its GEF
activity (Tatsumoto et al., 1999), and has been proposed to
regulate changes in Ect2 activity. This led us to examine the
phosphorylation status of Ect2 duringmitotic progression. Phos-
phorylated mitotic Ect2 migrates on a gel as a high molecular
r Inc.
0
10
20
30
40
50
60
70
80
rou
nd
ing
tim
e (
min
s)
con Nz RacGAP1 C3 Y-27632 bleb
siRNA
A
C D E
F G H
0% 70%
0
10
20
30
40
50
60
70
-30 -20 -10 0 10 20 30 40 50
DMSO
blebbistatin
Y-27632
C3
time (mins)
len
gth
(µm
)
B
0
2
4
6
8
10
12
control siRNA Ect2 siRNAF
RE
T e
ffic
ien
cy (
%)
Rh
oA
FR
ET
pM
yo
sin
control
control
Ect2 siRNA
Ect2 siRNA
control siRNA Ect2 siRNA
pM
yo
sin
cort
ical/cyto
pla
sm
ic r
atio
p = 0.9
p = 0.15
**
****
**
0
0.5
1
1.5
2
2.5
3
**
Figure 3. Ect2 Controls Mitotic Rounding via RhoA, Rho Kinase, and Myosin II
(A) Box plot comparing rounding times of control cells (n = 22 cells) compared to cells treated with 100 ng/ml nocodozole (Nz) to depolymerize microtubules
(n = 16), RacGAP1 siRNA (n = 20), 2 mg/ml C3 transferase to inhibit Rho (n = 22), 50 mMROK inhibitor Y-27632 (n = 18) and 50 mM blebbistatin to inhibit myosin II
(n = 25). Central line shows median, boxes are quartiles, and whiskers show complete range.
(B) Graph showing the cell length through time for conditions in Figure 3A. Error bars denote SD.
(C and D) Pseudo-colored FRET ratio images showing RhoA activity in cells arrested in prometaphase by treatment with 5 mM STLC, comparing a control siRNA
cell (C) to an Ect2 siRNA treated cell (D).
(E) Graph showing mean total RhoA FRET efficiency in control siRNA cells (n = 20) and Ect2 siRNA (n = 16) cells. FRET efficiency was calculated using acceptor
photo-bleaching (see Experimental Procedures). Error bars denote SD.
(F and G) Representative confocal images of control (F) and Ect2 siRNA (G) prometaphase cells during mitotic rounding stained for phospho-myosin light chain.
Insets show tubulin staining and DNA (DAPI stain, blue).
(H) Quantification of the Ect2 siRNA p-myosin II phenotype. The ratio of cortical/cytoplasmic phospho-myosin was calculated bymeasuring mean signal intensity
in a 33 3 pixel box at four locations at the cortex of the cell, and four locations 5 mm into the cytoplasm. The graph shows themean values for 11 cells per condition
with error bars denoting SD. Scale bars, 5 mm.
See also Figure S3.
Developmental Cell
Ect2 Controls Cell Shape in Early Mitosis
weight band (Tatsumoto et al., 1999) that is rapidly abolished
following the inhibition of Cdk1 activity by Roscovitine treatment
(Figure 4A). Using this gel mobility shift assay, we analyzed the
extent of Ect2 phosphorylation in a synchronized population of
cells following their release from a double thymidine block (Fig-
ure 4B). Phosphorylated Ect2 first appeared as synchronized
Develop
cells entered mitosis 11 hr after block release, consistent with
this form of the protein having an active role in mitotic rounding.
Importantly, Ect2 then remained phosphorylated until 14 hr post-
release, by which time the majority of cells had exited mitosis
(Figure 4C). A similar time course was observed following release
from a metaphase block imposed using nocodozole followed by
mental Cell 23, 371–383, August 14, 2012 ª2012 Elsevier Inc. 375
Ect2
Adaptin γ
Cyclin B1
A
9hr 10hr 11hr 12hr 13hr 14hr 15hr STLC
Time from thymidine releaseB
C
control Mg132 60’ 80’ 100’ 120’ 140’ 160’
Time from mitotic block release
Ect2
Adaptin γ
Ect2
Adaptin γ
No synch +STLC + STLC
+ Ros
0
20
40
60
80
100
Ect2 phosphorylated fraction % cells in mitosis
% cells at anaphase/cytokinesis
9hr 10hr 11hr 12hr 13hr 14hr 15hr STLC
%
D
E
control Mg132 60’ 80’ 100’ 120’ 140’ 160’ 0
20
40
60
80
100% Ect2 phosphorylated fraction % cells in mitosis
% cells at anaphase/cytokinesis
phospho-
histone H3
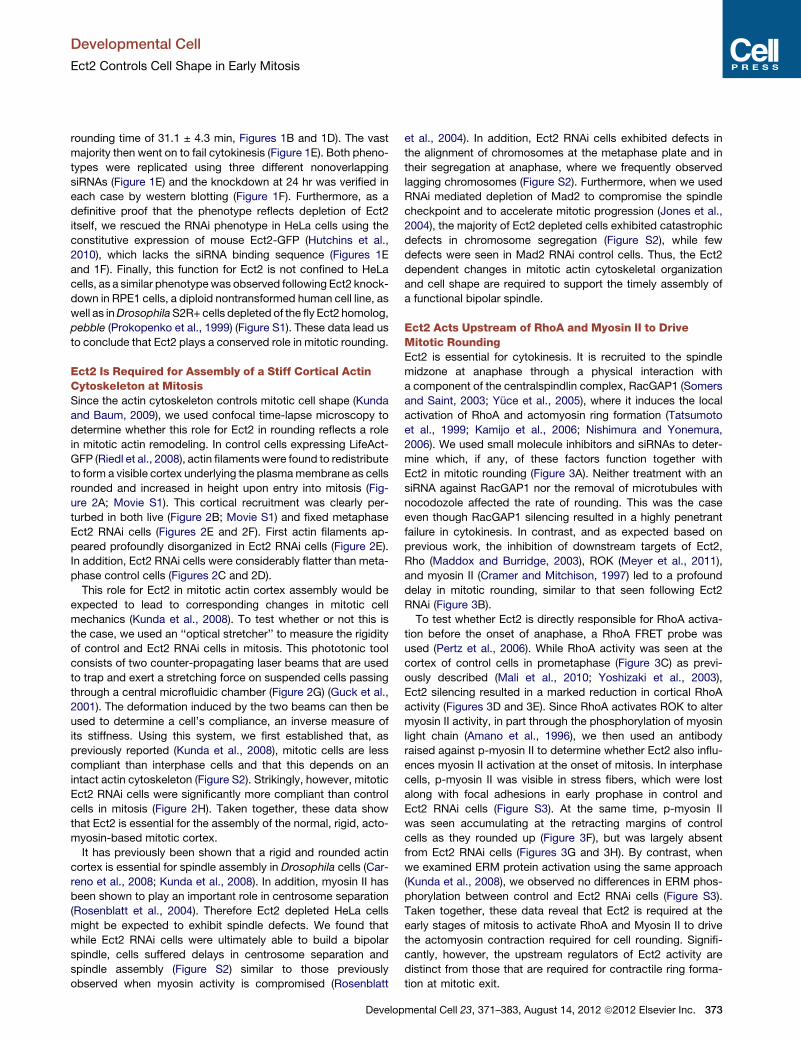
Figure 4. Ect2 Is Phosphorylated throughout
Mitosis
(A) Gel showing the band shift of Ect2 atmitosis comparing
unsynchronized cells (first lane) to cells synchronized at
prometaphase by an 18 hr treatment with 5 mM S-trityl-L-
cysteine (STLC, second lane). This shift is abolished by
addition of 50 mM Roscovitine for 2 hr (third lane), which
also reverses cell rounding.
(B) Band shift of Ect2 protein over a time course from 9 to
15 hr after release from double thymidine block. Image
shown is representative of all experiments (n = 3).
(C) Quantification of the gel in (B), showing the percentage
of Ect2 protein that is phosphorylated and the percentage
of cells in mitosis at each time point. The fraction of phos-
phorylated Ect2 was calculated by normalizing to back-
groundand thendividing thebandvolume for thephospho-
species by the total Ect2 band volume.Mitotic stageswere
determined by visual inspection of the spindle and DNA
following fixation and immunostaining with tubulin and
DAPI of a sample of cells at each time point (n = 79–221
cells for each time point) ‘‘% cells in mitosis’’ includes cells
in prophase, prometaphase, and metaphase.
(D) Phospho-band shift of Ect2 in a synchronized pop-
ulation of cells as they exit mitosis after release from
a metaphase arrest. This experiment was repeated twice
and the image is representative of both experiments.
(E) Quantification of the gel in D, showing the percentage
of Ect2 phosphorylated protein compared to the
percentage of cells in mitosis (prophase, prometaphase,
and metaphase) and at anaphase/cytokinesis.
Developmental Cell
Ect2 Controls Cell Shape in Early Mitosis
MG132 (Figures 4D and 4E). Again, the phospho-shifted form of
Ect2 visible in metaphase remained until almost all cells had
completed anaphase (Figure 4E). These data show that Ect2
remains phosphorylated throughout mitosis.
Ect2 Leaves the Nucleus in Early MitosisTo understand how Ect2 might drive distinct changes in cell
shape at the onset and exit of mitosis, we looked at its subcel-
lular distribution during mitotic progression. In fixed cells stained
with an Ect2 antibody, endogenous Ect2 was found to localize to
the interphase nucleus and nucleolus (Figure 5A). At the onset of
mitosis, Ect2 was then localized in the cytoplasm prior to nuclear
envelope breakdown, where it remained until it was recruited to
the spindle midzone at mitotic exit. We confirmed that this
376 Developmental Cell 23, 371–383, August 14, 2012 ª2012 Elsevier Inc.
dynamic pattern of immunostainingwas specific
using Ect2 RNAi cells (Figure S4). Moreover, this
localization was recapitulated using live imag-
ing of a HeLa cell line constitutively expressing
a BAC-containing mouse Ect2-GFP (Hutchins
et al., 2010) (Figures 5B and 5C; Movie S2) and
transfected with tubulin-RFP (Kobayashi and
Murayama, 2009) as a marker of rounding (Fig-
ure 5B), nuclear envelope breakdown (visualized
by the exclusion of tubulin from the nucleus;
Figure 5C), and spindle morphogenesis. Ect2
could be seen accumulating in the cytoplasm
in early prophase, �6 min before nuclear enve-
lope breakdown and coincident with the onset
of mitotic rounding (Figure 5D). In addition, we
confirmed that the change in Ect2 localization
at prophase was accompanied by the nuclear import of Cyclin
B1, which has previously been shown to correlate with an
increase in Cdk1 activity (Gavet and Pines, 2010a) and followed
shortly after mitotic kinase substrate phosphorylation in the
nucleus, which was detected using a phospho-Ser/Thr-Pro anti-
body (Figure S4). Ect2 contains two Cdk1 consensus sequences
in the vicinity of its nuclear localization sequence (NLS). To test
whether Cdk1 might act through these sites to regulate Ect2
localization, we generated a phospho-mimetic construct (Ect2-
T342D-S366D). This localized to the interphase nucleus (Fig-
ure S4), suggesting that phosphorylation at these sites may not
be sufficient to induce Ect2 nuclear export. However, this does
not rule out the possibility that Cdk1 phosphorylation at other
sites could control nuclear release.
z =
+8
μm z
= 0
B
C
D
Ect2
A
Tu
bu
lin D
AP
I
Interphase Early prophase Late Prophase Prometaphase Anaphase
Time (mins)
Ce
ll len
gth
(μm
)Inte
nsity ra
tio
Nuclear
Cytoplasmic
Cell length Ect2 localisation
Tubulin localisation
0
0.5
1
1.5
2
2.5
-10 -8 -6 -4 -2 0 2 4 6 8 10 12
15
25
35
45
55
Tu
bu
lin-R
FP
m
Ect2
-GF
P
-4’ -3’ -2’ -1’ 0 1’ 2’ 3’
Tu
bu
lin-R
FP
m
Ect2
-GF
P -4’ -3’ -2’ -1’ 0 1’ 2’ 3’
Figure 5. Ect2 Is Exported from the Nucleus in Early Mitosis
(A) Confocal micrograph showing Ect2 localization at each stage of mitosis in fixed cells stained with an antibody against Ect2 (upper panel) and tubulin and DAPI
to show mitotic stage (lower panel). Scale bar applies to all images, 10 mm.
(B and C) Time-lapse confocal images of a HeLa cell entering mitosis expressing mouse Ect2-GFP (upper panels) and tubulin-RFP (lower panels). Mouse Ect2 is
constitutively expressed in a BAC under its endogenous promotor (Hutchins et al., 2010). Two different z planes are shown: the bottom of the cell to show the full
extent of the cytoplasm (B), and 8 mm higher (C) at the level of the nucleus. Time is indicated in minutes, with time point 0 being the frame of nuclear envelope
breakdown as judged by when tubulin dimers first enter the nucleus. Note increase in Ect2 levels in the cytoplasm before nuclear envelope breakdown in
frames �1 and �2. Scale bars, 10 mm.
(D) Quantification of time-lapse images in (B) and (C). Six cells were analyzed and measurements aligned, so that time point 0 represents the frame of nuclear
envelopebreakdown.Mean signal intensitywasmeasured for Ect2 (red line) and tubulin (blue line) in a 63 6pixel box in the nucleus and cytoplasmand the nuclear/
cytoplasmic ratiowas plotted. The black line showsmean cell length to give an indication of the onset ofmitotic rounding. Error bars denote SD.See alsoMovie S2.
See also Figure S4.
Developmental Cell
Ect2 Controls Cell Shape in Early Mitosis
Mislocalization of Ect2 to the Cytoplasm Is Sufficient toDrive Premature RoundingSince the recruitment of Ect2 to the spindle midzone triggers
actomyosin-dependent furrow formation (Chalamalasetty et al.,
2006; Nishimura and Yonemura, 2006; Yuce et al., 2005), we
postulated that its relocation from the nucleus to the cytoplasm
Develop
in prophase could be a key factor in driving mitotic rounding. We
utilized several human Ect2 constructs to test this idea (Fig-
ure 6A). Mammalian Ect2 protein consists of an N-terminal
BRCT repeat domain, which is the site of RacGAP1 binding,
a regulatory S domain that harbors NLS sites, and a C-terminal
catalytic GEF domain (Miki et al., 1993; Saito et al., 2004; Saito
mental Cell 23, 371–383, August 14, 2012 ª2012 Elsevier Inc. 377
B C
D E
F
AEct2-FL-GFP
Ect2-C-GFP
Ect2-dNLS-GFP
Ect2 FL Ect2 - C Ect2 - dNLS
GF
P A
ctin
0%
20%
40%
60%
80%
100%
Ect2FL Ect2-C Ect2dNLS
Spread Round
Actin GFP Actin GFP
Non transfected Ect2 dNLS
Ect2
dN
LS
N
T
0:00 0:03 0:06 0:09 0:12 0:54 GFP
0:00 0:03 0:06 0:09 0:12 0:54 GFP
G
0
5
10
15
20
25
NT Ect2dNLS
Ro
un
din
g t
ime
(m
ins) *
SN CGFP BRCT1 BRCT2 GEF PH
NLS1 NLS2
N CGFP GEF PH
SN CGFP BRCT1 BRCT2 GEF PH
RKRRRLK>RKAAALK PRKRP>PAKAP* *
Figure 6. Cytoplasmic Ect2 Is Sufficient to
Induce Cell Rounding
(A) Three different Ect2 constructs were overex-
pressed in HeLa cells: Ect2-FL-GFP, Ect2-C-GFP,
and Ect2-dNLS-GFP.
(B) Representative confocal micrographs of cells
transfected with Ect2-FL, Ect2-C and Ect2-dNLS
showing the actin cytoskeleton stained with
phalloidin-TRITC (top panel) and Ect2 construct
localization (bottom panel). Note the rounded cell
morphology in Ect2-C and Ect2-dNLS cells.
(C) Quantification of the percentage of interphase
cells displaying the rounded phenotype (n = 80–
149 cells).
(D and E) Representative confocal micrographs
of cells in prophase showing an a nontransfected
cell (D) and a cell transfected with Ect2-dNLS (E).
The actin cytoskeleton was visualized by phalloi-
din staining and an anti-GFP antibody was used
to indicate transfected cells. Inset shows the cell
nucleus, stained with DAPI, to identify mitotic
stage. Note rounded cell morphology in E.
(F) Phase contrast images of a nontransfected (NT)
cell and a cell expressing Ect2-dNLS-GFP at low
levels rounding up in early mitosis. Transfected
cells are indicated by GFP fluorescence in final
panel. See also Movie S3.
(G) Box plot comparing the mitotic rounding time
of nontransfected cells (n = 21 cells) with those
transfected with Ect2-dNLS-GFP (n = 23). To
ensure rounding is mitotic rather than apoptotic,
only cells that later proceeded to cytokinesis were
analyzed. For Ect2-dNLS cells, only cells ex-
pressing low levels of the construct that were not
already rounded in interphase were analyzed. For
box plot, central line shows median, boxes are
quartiles, and whiskers show range. For Ect2
dNLS, the median and lower quartile are the same
value. Scale bars, 20 mm.
See also Figure S5.
Developmental Cell
Ect2 Controls Cell Shape in Early Mitosis
et al., 2003; Yuce et al., 2005). We confirmed first that when
overexpressed, full length human Ect2 (Ect2-FL, (Niiya et al.,
2006) is confined to the nucleus and does not affect cell
morphology (Figure 6B). By contrast, a truncated form of Ect2
(Ect2-C, (Su et al., 2011), which contains the C-terminal catalytic
domain but lacks regulatory regions and can act as a constitu-
tively active form (Saito et al., 2004), is localized to the cytoplasm
and is able to induce profound changes in interphase cell shape
(Figure 6B). Approximately 50% of interphase cells expressing
Ect2-C adopt a small, rounded morphology (Figures 6B and
6C; Figure S5). In this they resemble cells in mitosis, with the
notable exception that they retain stress fibers, which are nor-
mally disassembled in prophase. Thus, the mislocalization of
a constitutively active form of Ect2 is sufficient to induce ectopic
rounding. As seen for mitotic cells, the interphase rounding
induced by ectopic Ect2 is dependent on the activity of ROK
and myosin II since it could be reversed by the addition of small
molecular inhibitors Y-27632 or blebbistatin (Figure S5).
To test the role of nuclear export in the regulation of Ect2-
dependent mitotic rounding, we introduced point mutations
378 Developmental Cell 23, 371–383, August 14, 2012 ª2012 Elsevie
in its two NLS sites (Ect2 dNLS), which have been shown to
prevent Ect2 nuclear import (Saito et al., 2004). Like Ect2-C,
Ect2-dNLS was found to localize to the cytoplasm and to induce
ectopic interphase rounding (Figures 6B and 6C). This demon-
strates that simply mutating five residues in the NLS sequences
is sufficient to induce gross changes in cell morphology. To test
whether the timing of Ect2 export from the nucleus contributes
to mitotic rounding we then arrested cells expressing low levels
of Ect2-dNLS in G2 using the specific Cdk1 inhibitor, RO-3306
(Vassilev et al., 2006) for 14 hr. The inhibitor was washed out
to enable cells to synchronously progress into mitosis in the
presence or absence of Ect2-dNLS (Figures 6D and 6E). As ex-
pected, the presence of low levels of cytoplasmic Ect2-dNLS,
just below the threshold required to cause interphase rounding,
had a significant effect on the kinetics of rounding. Ect2-dNLS
expressing cells already appeared quite spherical in prophase
(Figure 6E) and underwent accelerated rounding upon entry
into mitosis (Figure 6F and 6G; Movie S3). Thus, the appearance
of cytoplasmic Ect2 is rate-limiting for mitotic rounding. Finally,
we confirmed that both rounding and cytokinesis require the
r Inc.
A B C D
E
Nuclear Envelope
BreakdownAnaphase
Cell length
Cdk1 activity
cytoplasmic Ect2centralspindlin complex
assembly
Figure 7. AModel for Ect2 Function through
Mitosis
(A–D) Dynamic changes in Ect2 localiza-
tion (shown in blue) control actin remodeling
throughout mitosis. (A) Ect2 leaves the nucleus in
early prophase. (B) Active Ect2 in the cytoplasm is
able to activate RhoA and drive mitotic rounding.
(C) Ect2 activation of RhoA results in the formation
of a rigid actomyosin cortex that assists meta-
phase spindle assembly (D). At anaphase, Ect2 is
relocalized to the central spindle and removed
from the poles, resulting in the redistribution of
active RhoA and therefore the contractile acto-
myosin machinery to drive furrowing in the center
of the cell.
(E) Export of active, phosphorylated Ect2 into the
cytoplasm at mitotic onset stimulates a decrease
in cell length. At anaphase, Ect2 remains active
but its location is modulated by binding to
RacGAP1 at the spindle midzone, resulting in
elongation of the cell, furrowing, and cytokinesis.
Developmental Cell
Ect2 Controls Cell Shape in Early Mitosis
GEF activity of Ect2, since a full-length Ect2 construct containing
a V566 > D mutation that has shown to be essential for GEF
activity (van Impel et al., 2009) was unable to rescue either
the failures in rounding or cytokinesis induced by Ect2 siRNA
(Figure S5). These data suggest that Ect2 is active throughout
mitosis, and that shifts in its localization regulate distinct
changes in actomyosin organization and cell shape. These begin
with the exit of Ect2 from the nucleus in early prophase, which
functions as a key trigger for actomyosin remodeling as cells
round up as they enter mitosis.
DISCUSSION
In this study we identify Ect2 as a critical link between the cell
cycle machinery, which triggers numerous events that accom-
pany mitotic entry, and the actin-dependent shape changes
that occur in early mitosis. We show that Ect2 is able to induce
changes to both cell shape and cortical mechanics in early
mitosis through the activation of RhoA and remodeling of the
actomyosin cytoskeleton. The timing of mitotic rounding is
crucially dependent on the export of Ect2 from the nucleus in
prophase, because cells lacking Ect2 fail to undergo timely
mitotic rounding, whereas the mislocalization of Ect2 to the
cytoplasm is sufficient, at low levels, to increase the speed of
mitotic rounding and, at high levels, to induce ectopic mitotic-
like rounding in interphase cells.
Together these data allow us to propose a model in which
regulated changes in the localization of Ect2 drive stage-specific
changes in mitotic cell shape (Figure 7). In prophase, Ect2 is
exported from the nucleus and phosphorylated by Cdk1, which
allow it to activate RhoA in the cytoplasm to induce the acto-
myosin reorganization and cell shape changes required for
timely bipolar spindle assembly. It is likely that the resulting
mechanically rigid metaphase cortex also plays an important
role in buffering the spindle from the potentially disruptive influ-
ence of external mechanical forces (Kunda and Baum, 2009).
At mitotic exit, it has been shown that Ect2 is recruited to the
spindle midzone as the result of its binding to a core component
of the centralspindlin complex, RacGAP1 (Burkard et al., 2009;
Develop
Petronczki et al., 2007; Wolfe et al., 2009). There it repositions
RhoA activity to control the formation of a circumferential
actomyosin band across the center of the anaphase spindle
(Chalamalasetty et al., 2006; Nishimura and Yonemura, 2006;
Somers and Saint, 2003; Yuce et al., 2005), ensuring the precise
segregation of contents between the two daughter cells. Thus,
by driving stage-specific changes in the local activation of
RhoA and the contractile actomyosin machinery, Ect2 is able
to remodel mitotic cell shape; driving rounding in early mitosis
and cleavage furrow formation at anaphase. Later, Ect2 is
released from the spindle midzone soon after the onset of cyto-
kinesis, leaving RacGAP1 free to catalyze mid-body maturation
and abscission (Simon et al., 2008). The bulk of the protein is
then degraded by the APC (Liot et al., 2011), while the remainder
is reimported into the newly formed nuclei, to restore interphase
cell shape. In this way, Ect2 resembles other mitotic proteins
that display distinct roles at different times in mitosis, dependent
on stage-specific changes in their localization e.g., Plk1 is known
to associate with centrosomes at prophase, kinetochores at
metaphase and the midzone at anaphase, enabling it to func-
tion in centrosome separation, microtubule attachment and
cytokinesis respectively (Petronczki et al., 2008).
Ect2 has been shown to be phosphorylated on multiple sites
by Cdk1 (Hara et al., 2006; Niiya et al., 2006; Su et al., 2011;
Yuce et al., 2005). It is likely that this phosphorylation is required
for its function in mitotic rounding, since Ect2 actively remodels
the mitotic cortex in early mitosis under conditions of high Cdk1
activity. Previously, one Ect2 Cdk1-dependent phosphorylation
site, T342, was shown to inhibit RacGAP1 binding and become
dephosphorylated in anaphase (Yuce et al., 2005), leading to
the speculation that Cdk1 phosphorylation could inhibit Ect2,
functionally coupling the initiation of contractile ring formation
to mitotic exit. Our data, however, argue that this is unlikely to
be the sole mechanism by which Ect2 is regulated, since we
see little change in the global Ect2 phosphorylation level at
anaphase and it remains in a hyper-phosphorylated state
through until the end of cytokinesis (Figure 4). In line with this,
Ect2 phosphorylation has been shown to relieve an auto-inhibi-
tory interaction between the C- and N-terminal domains of the
mental Cell 23, 371–383, August 14, 2012 ª2012 Elsevier Inc. 379
Developmental Cell
Ect2 Controls Cell Shape in Early Mitosis
protein (Hara et al., 2006; Kim et al., 2005) and to be essential for
its GEF activity (Tatsumoto et al., 1999). These data suggest that
Cdk1 phosphorylation contributes to the activation of Ect2 at
anaphase. A recent study identified a role for the C terminus of
Ect2 in its recruitment to the membrane at anaphase (Su et al.,
2011). This membrane localization was shown to be essential
for cytokinesis. Interestingly it was also suggested that this
change in localization at anaphasemay be triggered by a change
in CDK-mediated phosphorylation at T815. It is clear from our
analysis, however, that Ect2 is able to activate RhoA at the
membrane in metaphase despite its having a largely diffuse
cytoplasmic localization. Thus, the dephosphorylation of Ect2
at this site at anaphase likely induces a change in the rates at
which Ect2 shuttles between the membrane and cytoplasm,
and may function to limit the range of Ect20s action to allow for
polar relaxation (Sedzinski et al., 2011).
If Cdk1-mediated phosphorylation of Ect2 plays a role in the
regulation of its activity at both metaphase and anaphase, an
important unsolved question is how bulk Ect2 phosphorylation
persists following the inactivation of Cdk1/CyclinB at mitotic
exit. This may be the result of Plk1-dependent phosphorylation
of Ect2 at the midzone (Niiya et al., 2006) or the result of
the dynamic regulation of Ect2 dephosphorylation by mitotic
phosphatases (Barr et al., 2011; Bouchoux and Uhlmann,
2011). In addition, there may be subtle changes in the set of
Ect2 phosphorylation sites that accompany mitotic progression
which change the relative potency of Ect2 and/or its specificity
to tune its RhoGEF activity to the generation of a rounded
cortex during mitotic entry or an actomyosin ring at mitotic
exit (Su et al., 2011; Yuce et al., 2005). A comprehensive
dissection of the function and dynamics of Ect2 phosphoryla-
tion through mitosis however is likely to remain a challenge
for some time as it is hampered by the sheer number of sites
revealed in both biochemical studies (Hara et al., 2006; Niiya
et al., 2006; Yuce et al., 2005) and large-scale screens for
mitotic phosphorylation (Beausoleil et al., 2006; Dephoure
et al., 2008).
Although Ect2 provides a critical link between mitotic entry
and cell rounding, it is clear that other factors are important in
the control of mitotic cell shape. These include the loss of
substrate adhesion, which is dependent on Rap1 inhibition
(Dao et al., 2009) together with changes in osmotic pressure
(Stewart et al., 2011). This may explain why Ect2-depleted cells,
although suffering from profound defects in actin organization,
eventually assume a roughly rounded morphology (Figure 1).
Indeed, we observed no defects in the timing of focal adhesion
disassembly in Ect2 RNAi cells (Figure S3), suggesting that
loss of adhesion may allow cells to decrease in length despite
defects in actin organization and myosin contractibility. It is
therefore likely that Cdk1/CyclinB and other mitotic kinases
directly regulate focal adhesion removal and changes to ion
channels in parallel, independently of Ect2, to ensure their coor-
dination. Nevertheless, the involvement of Ect2 in sequential
events during mitosis suggests that it is a central organizer of
the cortex through mitotic progression. Significant changes to
the actomyosin cytoskeleton occur at rounding when actin fila-
ments are rearranged to form a stiff cortical shell (Kunda et al.,
2008) and then at cytokinesis when the symmetry is broken by
furrowing and polar relaxation (Eggert et al., 2006). Since our
380 Developmental Cell 23, 371–383, August 14, 2012 ª2012 Elsevie
data suggest that both processes are controlled by the same
molecular ‘‘toolbox,’’ downstream of Ect2 and RhoA, one might
speculate that they are mechanistically coupled. Thus, the
repositioning of Ect2 at anaphase, may serve to loosen the rigid
actomyosin cortex at the cell poles, coupling cleavage furrow
formation to polar relaxation. In fact, this was long the favored
model for cytokinesis, in which polar relaxation was through to
precede and to drive furrow formation (Roberts, 1961).
There are several similar parallels in evolution where actin
remodeling events required for cytokinesis are initiated before
cell division. In the early Caenorhabditis elegans embryo,
cortical actomyosin flows determine cell polarity before divi-
sion, in a process that is dependent on Ect2 and RhoA (Motegi
and Sugimoto, 2006; Schonegg and Hyman, 2006). Likewise in
fission yeast, preparation for cytokinesis begins before
anaphase with the formation of actin-nucleating nodes at the
onset of mitosis, which later condense to form the contractile
ring (Goyal et al., 2011; Pollard and Wu, 2010). Our data
suggest that a similar mechanism could operate in mammalian
cells, with the events that remodel the actin cortex in prepara-
tion for cell division being initiated by Cdk1-dependent Ect2
activity at the onset of mitosis, rather than by Cdk1 inhibition
at anaphase.
EXPERIMENTAL PROCEDURES
Time-Lapse Microscopy
For live imaging, HeLa stable cell lines expressing LifeAct-GFP/histone2B-
mRFP, histone2B-mRFP/tubulin-GFP (Steigemann et al., 2009), Ect2-GFP
(hela Kyoto -mEct2-GFP-FLAP (Poser et al., 2008; Hutchins et al., 2010), and
a tetracycline-inducible line expressing Cyclin-B1-Venus (Di Fiore and Pines,
2010) were plated on glass-bottomed dishes (MatTek) coated with 10 mg/ml
fibronectin (Sigma). For cell length measurements, cells were imaged every
2min using a Zeiss Axiovert 200Mmicroscope with a 203 objective (numerical
aperture, NA 0.4), and images acquired using a Hamamatsu Orca AG
camera and Volocity software (Perkin Elmer). Cell length was defined as the
furthest distance between two points on the cell perimeter (Feret’s Diameter)
and measured using Fiji. For filming inhibitor treated cells, inhibitors were
dissolved in DMEM + 10% FBS and added one hour prior to commencing
filming, except for C3 transferase, which was added 6 hr before filming began.
Inhibitors were used at the following concentrations: 100 ng/ml nocodozole
(Sigma), 2 mg/ml C3 transferase (Cytoskeleton), 50 mM Y-27632 (Calbiochem),
and 50 mM blebbistatin (Sigma). For time-lapse confocal imaging, an UltraView
Vox (Perkin Elmer) spinning disc system was used with 603 oil immersion
objective (NA 1.4). Images were acquired every 30 s with z slices every 4 mm
covering the height of the cell. Single z plane images are shown.
Immunofluorescence
For immunostaining, cells were plated on fibronectin-coated glass coverslips
and fixed with 4% formaldehyde for 20min, permeablized with 0.2% triton-X in
PBS for 5 min, blocked with 5% bovine serum albumin in PBS for 30 min and
treated with primary and secondary antibodies for 1 hr at room temperature.
Primary antibodies were used at the following dilutions: tubulin 1:400
(DM1A, Sigma-Aldrich), Ect2 1:200 (sc-1005 Santa Cruz), anti-GFP 1:200
(a11122 Molecular Probes), anti-myc 1:500 (9E10 Santa Cruz), phospho-