INTERNATIONAL JOURNAL OF CLIMATOLOGY Int. J. Climatol. (2010) Published online in Wiley InterScience (www.interscience.wiley.com) DOI: 10.1002/joc.2091 Changes in near-surface wind speed in China: 1969–2005 Hua Guo, a† Ming Xu, a,c * and Qi Hu b a Institute of Geographical Sciences and Natural Resources Research, Key Laboratory of Ecosystem Network Observation and Modeling, Chinese Academy of Sciences, Beijing, China 100101 b School of Natural Resources and Department of Geosciences, University of Nebraska-Lincoln, Lincoln, Nebraska 68583-0987 USA c Department of Ecology, Evolution and Natural Resources, Rutgers University, New Brunswick, New Jersey, USA ABSTRACT: This study extends upon previous analyses and details near-surface wind speed change in China and its monsoon regions from 1969 to 2005, using a new dataset consisting of 652 stations. Moreover, causes of wind speed changes are examined. Major results show that most stations in China have experienced significant weakening in annual and seasonal mean wind during the study period. The averaged rate of decrease in annual mean wind speed over China is −0.018 ms −1 a −1 . Decrease in seasonal mean wind differs. The largest rate of decline is in spring at −0.021 ms −1 a −1 and the least is in summer at −0.015 ms −1 a −1 . Spatially, large declines are found in northern China, the Tibetan Plateau and the coastal areas in east and southeast China, while central and south–central China have the least change in their wind speed. Significant weakening of wind speed has occurred primarily in strong wind categories. Decreases in light wind categories are trivial, and light wind has even increased slightly in parts of central China. These changes indicate reduced fluctuations in wind and wind storms in recent decades, contributing to decreased frequency and magnitude of dust storms. The trivial changes in summer winds in east and southeast China suggest fairly steady monsoon winds over the decades. A main cause of the weakening wind is shown to be the weakening in the lower-tropospheric pressure-gradient force, a result pointing to climate variation as the primary source of the wind speed change. Superimposed on the climate effect is the urban effect. While analysis of winds between urban and rural stations reinstate the urban frictional effect, a peculiar stronger increase in wind at urban stations than at rural stations after the abrupt urbanization since 1990 indicates a new aspect of the urban effect on wind speed. Copyright 2010 Royal Meteorological Society KEY WORDS wind speed decline; pressure-gradient force; urban effects; monsoon; climate change; China Received 11 February 2009; Revised 17 December 2009; Accepted 18 December 2009 1. Introduction Wind is an important indicator of the atmospheric circulation. Changes in wind speed are an indication of the circulation change due to either natural or anthro- pogenic processes. As part of the effort to understand the climate and related circulation changes, several recent studies have examined wind speed changes in regions around the world. For example, Pirazzoli and Tomasin (2003) show that the near-surface wind speeds at 17 coastal stations in Italy decreased considerably from 1951 to the mid-1970s, and the decrease has slowed down or leveled-off since 1980. Brazdil et al. (2009) reported more calm surface wind in most of the Czech Repub- lic. Tuller (2004) found that the annual and winter mean winds at stations along the west coasts of Canada weak- ened during the period from the late 1940s to mid-1990s. Stilling winds also have been observed in the contiguous United States during 1973–2005 (Pryor et al., 2009). * Correspondence to: Ming Xu, Institute of Geographical Sciences and Natural Resources Research, Key Laboratory of Ecosystem Network Observation and Modeling, Chinese Academy of Sciences, Beijing, China 100101. E-mail: [email protected]† Nanjing Institute of Geography and Limnology, Chinese Academy of Sciences, Nanjing, China, 210008. Reduction in wind speed was reported over 88% of the weather stations in Australia, with an average trend of −0.009 ms −1 a −1 over 1975–2006 (McVicar et al., 2008). In China, Wang et al. (2004a) examined wind speed change from 1951 to 2000 and also showed weak- ened wind speeds, especially in northwest China during winter. Additional details of these wind speed changes are documented by Xu et al. (2006a), who showed that the wind has weakened from 1969 to 2000 by 28% at an average rate of −0.021 ms −1 a −1 (Figure 1 in Xu et al. (2006a)). The decline occurred in both winter and summer. Weakening surface wind speed also has been referred to as a major factor causing decreases in surface evaporation (Liu et al., 2004; Chen et al., 2006; Shenbin et al., 2006; Xu et al., 2006b; Zhang et al., 2007) and dust storm frequency in China (Qian et al., 2002; Wang et al., 2004b; Liu et al., 2005; Huang et al., 2006; Yin and Wang, 2007). The stilling wind was proposed to result partially from weakening pressure gradient between oceans and the major continents. The latter was attributed to temper- ature increase in land areas in the recent decades due to human-induced increase in aerosol/dust concentration in the atmospheric boundary layer and the subsequent effects on low-level cloud amount and radiation budget Copyright 2010 Royal Meteorological Society
Transcript
INTERNATIONAL JOURNAL OF CLIMATOLOGYInt. J. Climatol. (2010)Published online in Wiley InterScience(www.interscience.wiley.com) DOI: 10.1002/joc.2091
Changes in near-surface wind speed in China: 1969–2005
Hua Guo,a† Ming Xu,a,c* and Qi Hub
a Institute of Geographical Sciences and Natural Resources Research, Key Laboratory of Ecosystem Network Observation and Modeling,Chinese Academy of Sciences, Beijing, China 100101
b School of Natural Resources and Department of Geosciences, University of Nebraska-Lincoln, Lincoln, Nebraska 68583-0987 USAc Department of Ecology, Evolution and Natural Resources, Rutgers University, New Brunswick, New Jersey, USA
ABSTRACT: This study extends upon previous analyses and details near-surface wind speed change in China and itsmonsoon regions from 1969 to 2005, using a new dataset consisting of 652 stations. Moreover, causes of wind speedchanges are examined. Major results show that most stations in China have experienced significant weakening in annualand seasonal mean wind during the study period. The averaged rate of decrease in annual mean wind speed over Chinais −0.018 ms−1a−1. Decrease in seasonal mean wind differs. The largest rate of decline is in spring at −0.021 ms−1a−1
and the least is in summer at −0.015 ms−1a−1. Spatially, large declines are found in northern China, the Tibetan Plateauand the coastal areas in east and southeast China, while central and south–central China have the least change in theirwind speed. Significant weakening of wind speed has occurred primarily in strong wind categories. Decreases in light windcategories are trivial, and light wind has even increased slightly in parts of central China. These changes indicate reducedfluctuations in wind and wind storms in recent decades, contributing to decreased frequency and magnitude of dust storms.The trivial changes in summer winds in east and southeast China suggest fairly steady monsoon winds over the decades.
A main cause of the weakening wind is shown to be the weakening in the lower-tropospheric pressure-gradient force, aresult pointing to climate variation as the primary source of the wind speed change. Superimposed on the climate effect isthe urban effect. While analysis of winds between urban and rural stations reinstate the urban frictional effect, a peculiarstronger increase in wind at urban stations than at rural stations after the abrupt urbanization since 1990 indicates a newaspect of the urban effect on wind speed. Copyright 2010 Royal Meteorological Society
KEY WORDS wind speed decline; pressure-gradient force; urban effects; monsoon; climate change; China
Received 11 February 2009; Revised 17 December 2009; Accepted 18 December 2009
1. Introduction
Wind is an important indicator of the atmosphericcirculation. Changes in wind speed are an indication ofthe circulation change due to either natural or anthro-pogenic processes. As part of the effort to understand theclimate and related circulation changes, several recentstudies have examined wind speed changes in regionsaround the world. For example, Pirazzoli and Tomasin(2003) show that the near-surface wind speeds at 17coastal stations in Italy decreased considerably from 1951to the mid-1970s, and the decrease has slowed downor leveled-off since 1980. Brazdil et al. (2009) reportedmore calm surface wind in most of the Czech Repub-lic. Tuller (2004) found that the annual and winter meanwinds at stations along the west coasts of Canada weak-ened during the period from the late 1940s to mid-1990s.Stilling winds also have been observed in the contiguousUnited States during 1973–2005 (Pryor et al., 2009).
* Correspondence to: Ming Xu, Institute of Geographical Sciences andNatural Resources Research, Key Laboratory of Ecosystem NetworkObservation and Modeling, Chinese Academy of Sciences, Beijing,China 100101. E-mail: [email protected]† Nanjing Institute of Geography and Limnology, Chinese Academy ofSciences, Nanjing, China, 210008.
Reduction in wind speed was reported over 88% ofthe weather stations in Australia, with an average trendof −0.009 ms−1a−1 over 1975–2006 (McVicar et al.,2008). In China, Wang et al. (2004a) examined windspeed change from 1951 to 2000 and also showed weak-ened wind speeds, especially in northwest China duringwinter. Additional details of these wind speed changesare documented by Xu et al. (2006a), who showed thatthe wind has weakened from 1969 to 2000 by 28%at an average rate of −0.021 ms−1a−1 (Figure 1 in Xuet al. (2006a)). The decline occurred in both winter andsummer. Weakening surface wind speed also has beenreferred to as a major factor causing decreases in surfaceevaporation (Liu et al., 2004; Chen et al., 2006; Shenbinet al., 2006; Xu et al., 2006b; Zhang et al., 2007) anddust storm frequency in China (Qian et al., 2002; Wanget al., 2004b; Liu et al., 2005; Huang et al., 2006; Yinand Wang, 2007).
The stilling wind was proposed to result partially fromweakening pressure gradient between oceans and themajor continents. The latter was attributed to temper-ature increase in land areas in the recent decades dueto human-induced increase in aerosol/dust concentrationin the atmospheric boundary layer and the subsequenteffects on low-level cloud amount and radiation budget
Copyright 2010 Royal Meteorological Society
H. GUO et al.
y = -0.025x + 2.83R2 = 0.96
y = -0.006x + 2.40R2 = 0.44
1.8
2
2.2
2.4
2.6
2.8
3
1965 1970 1975 1980 1985 1990 1995 2000 2005 2010
Year
Win
d sp
eed
(ms-1
)
(d)
(1969-1990)
(1991-2005)-0.15
-0.10
-0.05
0.00
0.05
0.10
0.00 2.00 4.00 6.00 8.00 10.00
Annual mean wind speed (ms-1)
Tre
nd o
f ann
ual m
ean
win
d sp
eed
(ms-1
a-1)
(c)
(a) (b)
Figure 1. (a) Station annual mean surface wind speed in China. (b) Trend of stations’ annual mean wind speed change from 1969 to 2005(units: ms−1a−1). A circle indicates the station’s wind speed has decreased; the bigger the circle the larger the decrease. A diamond indicatesthe station’s wind speed has increased; the bigger diamond the larger the increase. A filled diamond or circle indicates that the increase ordecrease of wind speed at the station is statistically significant at the 95% confidence level. (c) Trends in mean wind speed change at the 652stations relative to their mean annual wind speeds (a cross means statistically insignificant and a filled diamond means statistically significant).
(d) Temporal variation and trend (solid line) of annual mean wind speed averaged in China.
at the surface (Nazarenko and Menon, 2005; Huang et al.,2006; Trenberth et al., 2007; Lau et al., 2008).
Changes in the near-surface wind speed could havesome important environmental and socioeconomic con-sequences. Zhou et al. (2006) showed that the declineof wind speed has resulted in reduction in energy sup-plies from wind power in China’s Pearl River Delta.Liu et al. (2005) showed that the expending arid areasin Ordos Plateau of China may have been largely exac-erbated by wind speed and direction changes in recentyears. Investigating the wind changes can thus improveour understanding of climate change and its impacts onenvironmental, ecological and socioeconomic systems inChina and other nations/regions.
This current study expands on the previous analysesof wind changes in China by using an improved datasetwith 652 weather stations, compared with 305 or fewerstations in previous studies (e.g. Xu et al., 2006a).The study period from 1969 to 2005 also is longerthan in previous studies. From examining the extendedwind records, we provide more comprehensive resultsdescribing wind changes across China and its monsoonregions. In addition to providing detailed changes inwind speed at seasonal and annual timescales during1969–2005, we propose a major cause for the wind speed
changes in the past decades. The urban effect on the windspeed changes and its importance relative to the climatechange effect also are examined and discussed.
2. Data and methods
Daily wind speed data in China from 1969 to 2005were originally from the Chinese National Meteorologi-cal Center (CNMC). Feng et al. (2004) examined thesedata from 726 stations, testing the spatial and temporalconsistency, marking the questionable data and givingsuggestions on how to adjust/use them. In their quality-control procedure, Feng et al. (2004) evaluated the effectsof station move/relocation, among other sources of bias,on data continuity. Available metadata and data consis-tency check were used to minimize such effects. Basedon this quality-controlled daily wind dataset of Fenget al. (2004), we further evaluated the stations’ winds,which were measured 10 m above the ground, and madeadditional quality checks on these wind data. Becauseof strong inhomogeneity, 19 of the 726 stations wereexcluded from this analysis. In addition, stations contain-ing less than 30 years of data were removed from thedataset. After applying these additional quality restraints
Copyright 2010 Royal Meteorological Society Int. J. Climatol. (2010)
CHANGES IN NEAR-SURFACE WIND SPEED IN CHINA
we obtained higher-quality data series of daily windspeed at 652 stations for the period from 1969 to 2005(37 years). Among the 652 stations, the mean and stan-dard deviation of the ‘number of years’ are 36.6 yearsand 1.3 years, respectively. These parameters indicate arich and quality dataset for this analysis.
This improved wind dataset was used to analyse windspeed changes. We applied linear regression, combi-nation of cumulative sum charts (CUSUM) and boot-strapping method (Taylor, 2000) to detect wind speedchange and its trend. The statistical significance of windspeed changes was tested using the Student t-test andMann–Kendall test. In addition, effects of urbanizationon wind speed change were evaluated by comparing andcontrasting wind speed change between large urban sta-tions and rural stations over the study period. Changesin wind speed in different speed categories also wereexamined using the method described by Robeson (2004).In this method, daily wind speeds of the 37 years from1969 to 2005 at a station or averaged over a region wereused to calculate the trend of wind speed change for thatday. The trend of wind speed change on each day in amonth was then categorized, according to the daily meanwind speed of that month, into the 5th–95th mean windpercentiles. This analysis procedure was first applied toaveraged wind speed over China and then to winds aver-aged in six sub-regions that have similar wind varia-tion features. These results provide information regardingwind changes in different speed categories across variousregions in China. These sub-regions were identified usinga hierarchical clustering method with average linkagewithin groups; its details are described in Kaufman et al.(1990). Wind changes in these sub-regions help revealmonsoon wind variations in China from 1969 to 2005.
To address the question of what may have caused theobserved wind speed change from 1969 to 2005, weexamined changes in lower-troposphere pressure-gradientforce over the same period using the National Cen-ter for Environmental Prediction–National Center forAtmospheric Research (NCEP–NCAR) reanalysis data(Kalnay et al., 1996). The pressure-gradient force is thelarge-scale driver of the wind speed (Holton, 1979), andthe force represented by the 850-hPa geostrophic windwas calculated to examine how large-scale circulationchanges may have affected the surface wind speed vari-ation from 1969 to 2005. Comparison of changes in thegeostrophic wind and observed wind helps distinguish thelarge-scale forcing effect on observed changes in the windspeed. Differences between the observed and geostrophicwinds may result from turbulent and eddy forcing on thesurface wind. Downward atmospheric momentum trans-fer by turbulent and eddy mixing can often strengthennear-surface wind speed (e.g. Mahrt et al., 1979; Stull,1988). Owing to lack of data, the effect of the verti-cal eddy momentum mixing on surface wind change isnot examined. Because this vertical mixing can affectsurface wind speed, particularly in unstable stratifica-tion with small or negative Richardson number (Mahrtet al., 1979), caution should be observed when using
the 850-hPa geostrophic wind to interpret changes inthe observed surface wind speed. In addition, the urbanfrictional force and local turbulence effects rising fromterrain (Stull, 1988; McVicar et al., 2007) and soil mois-ture heterogeneities (Stull, 1988; Ozdogan et al., 2004,2006) also act to alter the surface winds so that theydiffer from the pressure-gradient force. The urban effectis evaluated in this study from comparisons of surfacewind speed changes between major urban stations andrural stations in China.
3. Results
3.1. Changes of annual mean wind speed in China
Figure 1(a) shows the annual mean wind speeds(1969–2005) at 652 stations in China. Strong winds arefound in the south and southeast coastal regions andShandong Peninsula with the annual mean wind speedranging from 4.0 to 8.2 ms−1. In inland areas, largeannual mean wind speed, ranging from 2.0 to 6.3 ms−1,are shown in northern China from the northeast to InnerMongolia and to the stations in western China includingnorthern part of the Xinjiang Autonomous Region andnorthern slope of the Tibetan Plateau. In contrast, weakannual mean winds are in the middle-reach of the YangtzeRiver basin, especially in the Sichuan Basin.
Changes in the annual mean wind speeds at individ-ual stations are shown in Figure 1(b) by the linear trendof wind change over the period from 1969 to 2005.Inspecting Figure 1(b), we find significant decrease ofwind speed in most areas in China over the study period.There are 469 stations showing significant decrease inwind speed (hereafter ‘significant’ refers to statisticallysignificant at the 95% confidence level). Only 30 stationsshow significant increase in wind speed. The averagedrate of decrease in annual mean wind speed in Chinais −0.018 ms−1a−1 for the study period. Comparison ofFigure 1(a) and (b) indicates that significant decrease inwind speed has occurred at stations with strong meanwind. As further shown in Figure 1(c), decrease in windspeed at rates greater than −0.07 ms−1a−1 occurred onlyat stations with annual mean wind speed greater than2.0 ms−1. Stations with weak mean wind (<2.0 ms−1),such as those in the Sichuan Basin, have smaller rates ofdecrease, around −0.01 ms−1a−1.
The change in averaged wind speed over all the sta-tions is summarized in Figure 1(d), showing decreasingwind at a nearly constant rate of −0.025 ms−1a−1 from1969 to about 1990. After 1990 (which is determined bythe CUSUM and bootstrapping methods), the decrease inwind weakened. This recent leveling-off in wind speedis coherent with similar slow-down in decrease trendof solar radiation and pan evaporation found in manyareas in China (e.g. Wild et al., 2005; Liu et al., 2004).Even with this consistency in check, cautions should beobserved in interpreting this recent weakening in windspeed change as a possible indication of climate variation
Copyright 2010 Royal Meteorological Society Int. J. Climatol. (2010)
H. GUO et al.
because of the rather short wind records from 1991 to2005.
3.2. Urban effect on wind speed
Many factors may have affected these observed annualmean wind speed changes. One of them is the urbaniza-tion in China and associated massive housing construc-tions, which could modify local landscapes and influencethe wind speed. To examine this effect, we selected 63stations in urban areas of population >0.5 million and100 stations in rural areas of population <10 000, basedon the population survey in 2000, and compared and con-trasted average wind speeds changes between these twogroups of stations. To optimally evaluate the urban effect,these urban and rural stations were selected from stationsin the same region (similar climate environment) in cen-tral part of China between 92° and 122 °E, where stationsalso are densely located (Figure 1(a)).
The changes in averaged wind speed at these urbanand rural stations are shown in Figure 2. A similar rateof decrease in wind speed is shown in both the ruraland urban stations from 1969 to 1990. These decreasesare statistically significant at the 95% confidence level.Although the wind weakening has the same rate, theaverage speeds of the wind are quite different, withthe rural wind stronger than the urban wind by anaverage of 0.3 ms−1. Furthermore, different changesalso emerged after 1990 between the rural and urbanstations. The averaged wind at the urban stations brokethe decrease trend and became strengthening from 1990to 1995 and has since remained nearly steady around2.3 ms−1. On the other hand, wind at the rural stationshas continued decreasing though at a much smaller rate.These differences in changes of wind speed between theurban and rural stations during 1990–2005 indicate a newaspect of urban effect on wind. If the wind speed changein rural stations could be regarded as the natural windspeed change, the strong strengthening in wind speedin urban stations since 1990 would indicate an urbaneffect on wind speed. This effect is however contraryto what we know about the urban frictional drag. AsXu et al. (2006a) indicated the urban constructions in
Figure 2. Variations of wind speed averaged over rural and large urbanstations for 1969–2005. The rates of wind decrease and their R2 values
are shown in the margin.
China peaked in the late 1980s and early 1990s. If theurbanization had a strong drag effect to weaken the windspeed we should have had seen a larger decrease in windspeed in the urban stations since 1990. The observedstrengthening wind at the urban stations, compared tothe continuing decreasing wind at rural stations, suggestsa new aspect of urban influences on their wind speedchanges. This specific influence may be further examinedand identified using detailed modelling studies and suchwork is beyond the scope of this study. It is interestingto point out that similar increase in wind speed also hasbeen observed following the urbanization in southeastQueensland and northeast New South Wales in Australia(McVicar et al., 2008).
3.3. Seasonal wind speed change
Because wind varies considerably among seasons, it isnecessary to examine seasonal wind changes and theirdifference. Such difference may shed light on changesin the monsoon climate in China. For example, largedecrease in summer wind would indicate the weakeningof the monsoons which strongly influence precipitationin southern and eastern China.
Seasonal wind changes in China are shown in Figure 3.Average wind speed of each of the four seasons hasdecreased from 1969 to 2005, and the decrease isstatistically significant at the 95% confidence level. Thelargest decrease, at the rate of −0.021 ms−1a−1, occurredin spring which also has the strongest wind among allseasons. The weaker winds in the other three seasons,with the weakest in autumn, have relatively weakerdecreases. Summer wind has the smallest decrease at−0.015 ms−1a−1, and the decrease in winter wind is−0.019 ms−1a−1.
A comparison of the seasonal wind variations inFigure 3 with the annual mean wind speed change inFigure 1(d) indicates a similar weakening in decreaseof wind speed since the early 1990s. This weakening isparticularly strong in winter.
1.8
2
2.2
2.4
2.6
2.8
3
3.2
3.4
1965 1970 1975 1980 1985 1990 1995 2000 2005 2010
Year
Win
d sp
eed
(ms-1
)
SpringSummerAutumnWinter
Spr
WinSumAut Spr
WinSum
Aut(1969-1990) (1991-2005)
Figure 3. Temporal variations and trends (solid lines) of seasonal meanwind speed averaged in China, 1969–2005. The trends of seasonalwind speed change before and after 1990 are shown by separate lines(winter contains the months of December, January and February; springhas March, April and May; summer has June, July and August; and
autumn has September, October and November).
Copyright 2010 Royal Meteorological Society Int. J. Climatol. (2010)
CHANGES IN NEAR-SURFACE WIND SPEED IN CHINA
5
15
25
35
45
55
65
75
85
95
J F A JM M J A OS N D
Per
cent
ile
Month
-0.040
-0.035
-0.030
-0.025
-0.020
-0.015
-0.010
-0.005
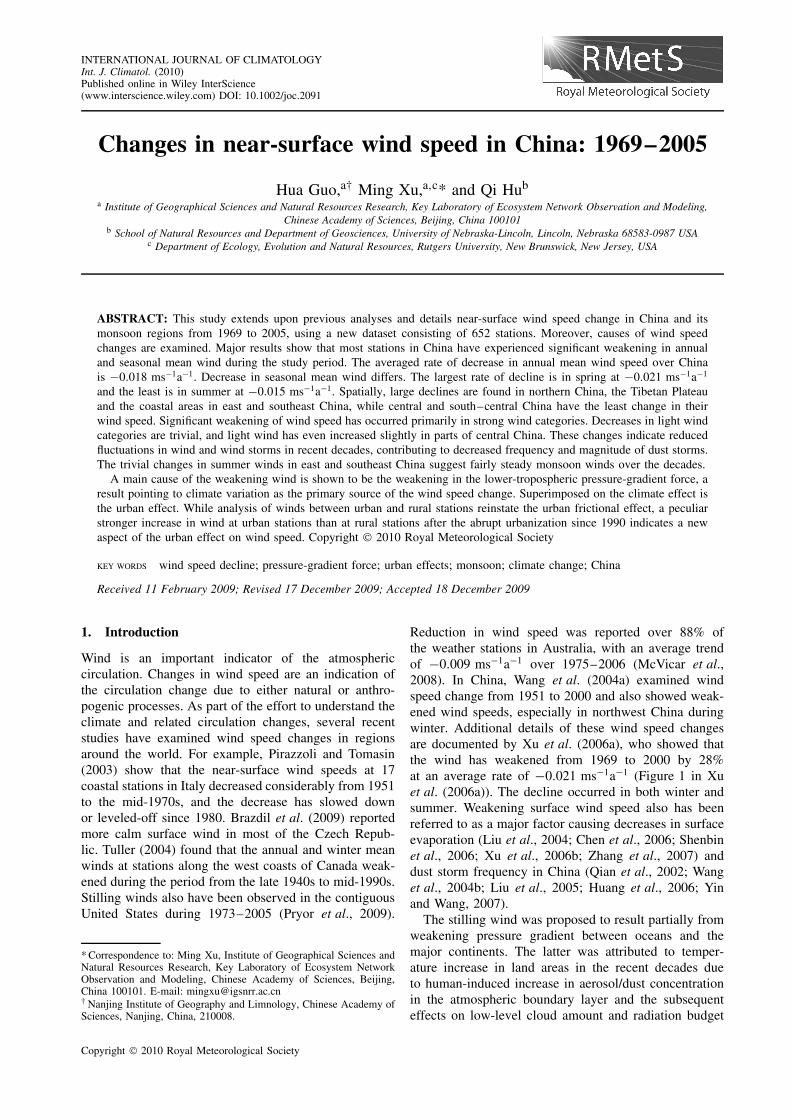
Figure 4. Trend of monthly mean wind speed change averaged inChina in different wind speed percentiles, 1969–2005. Trend values
are shown by the scale bar on the right, units: ms−1a−1.
3.4. Monthly wind speed change in different windspeed percentiles
The change in seasonal and annual mean wind speed is acollective effect of wind changes in various wind speedcategories. It is important to examine wind speed changein different wind speed categories because of differentimplications of these changes. Weakening in strong windcategory would suggest reduced wind storms and less-frequent dust storms. Stilling of wind in mid-strengthwind categories could indicate more calm days whichhave impact on air quality and surface evaporation. Tounderstand these details, we evaluated the changes ofwind speed in different wind speed categories. Figure 4shows the changes of monthly wind, averaged overChina from 1969 to 2005, at different wind speedpercentiles. Examining the variations in Figure 4 wefind that wind has decreased in China in all categoriesof wind speed. Again, larger decreases are observed instronger wind categories at rate ranging from −0.02 to−0.04 ms−1a−1. The largest decrease has occurred instrong wind categories in late winter and spring months,from September through May of the following year.
Summer has the least decrease in wind speed in nearlyall speed categories.
3.5. Wind speed change in different regions
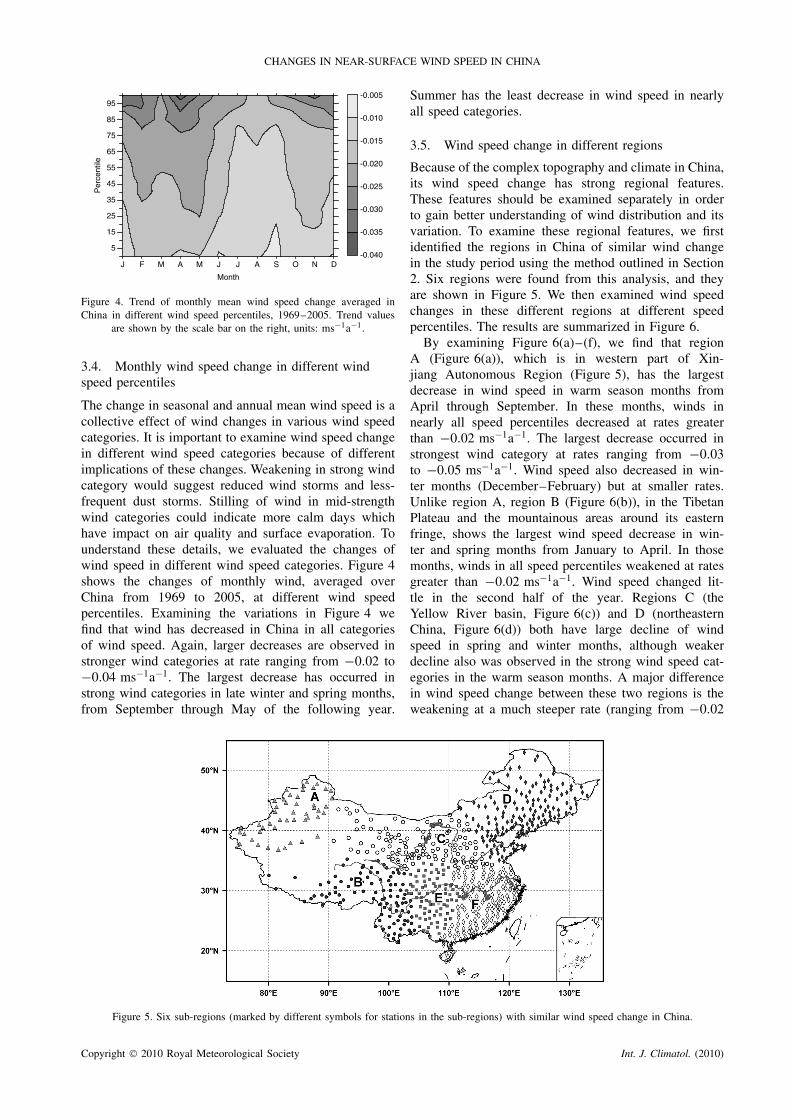
Because of the complex topography and climate in China,its wind speed change has strong regional features.These features should be examined separately in orderto gain better understanding of wind distribution and itsvariation. To examine these regional features, we firstidentified the regions in China of similar wind changein the study period using the method outlined in Section2. Six regions were found from this analysis, and theyare shown in Figure 5. We then examined wind speedchanges in these different regions at different speedpercentiles. The results are summarized in Figure 6.
By examining Figure 6(a)–(f), we find that regionA (Figure 6(a)), which is in western part of Xin-jiang Autonomous Region (Figure 5), has the largestdecrease in wind speed in warm season months fromApril through September. In these months, winds innearly all speed percentiles decreased at rates greaterthan −0.02 ms−1a−1. The largest decrease occurred instrongest wind category at rates ranging from −0.03to −0.05 ms−1a−1. Wind speed also decreased in win-ter months (December–February) but at smaller rates.Unlike region A, region B (Figure 6(b)), in the TibetanPlateau and the mountainous areas around its easternfringe, shows the largest wind speed decrease in win-ter and spring months from January to April. In thosemonths, winds in all speed percentiles weakened at ratesgreater than −0.02 ms−1a−1. Wind speed changed lit-tle in the second half of the year. Regions C (theYellow River basin, Figure 6(c)) and D (northeasternChina, Figure 6(d)) both have large decline of windspeed in spring and winter months, although weakerdecline also was observed in the strong wind speed cat-egories in the warm season months. A major differencein wind speed change between these two regions is theweakening at a much steeper rate (ranging from −0.02
Figure 5. Six sub-regions (marked by different symbols for stations in the sub-regions) with similar wind speed change in China.
Copyright 2010 Royal Meteorological Society Int. J. Climatol. (2010)
Figure 6. (a)–(f) shows, respectively, the trends of monthly mean wind speed change in different speed percentiles for sub-regions a, b, c, d, eand f, shown in Figure. 5, respectively. Trend values are shown by the scale bar on the bottom, units: ms−1a−1.
to −0.07 ms−1a−1) and a spread in nearly all speedcategories in the spring wind in region D.
Region E (Figure 6(e)), in central China and themiddle-reach of the Yangtze River basin, has the least
change in wind speed (less than −0.01 ms−1a−1 in nearlyall speed percentiles) in all seasons. In fact, the region’swinds in weak speed categories have strengthened inthe last 3 decades. Finally, region F (Figure 6(f)), in
Copyright 2010 Royal Meteorological Society Int. J. Climatol. (2010)
CHANGES IN NEAR-SURFACE WIND SPEED IN CHINA
southeast China and the lower reach of the YangtzeRiver, shows larger decline in wind speed in high speedpercentiles during the cold season months, opposite tothe changes occurring in region A.
It is interesting to note that the wind change in regionsC and D (Figure 6(c) and (d)) shows strong decreasein spring, though with different magnitudes between theregions. The stronger decrease in region D could be aresult from earlier arrival of spring season with warmertemperatures, hence reducing temperature gradient withthe regions in the south (e.g. Hu et al., 2006). Whiledepicting an aspect of regional climate change, the largedecease in spring winds in these arid (region C) andsemiarid (north of region D) regions may have partiallycontributed to the decrease of spring and early summerdust storms in these regions (Wang et al., 2004b; Xuet al., 2006b; Yin and Wang, 2007). In this regard, therecent change in climate may be alleviating the dust stormand their influence on major cities downwind in centraland eastern China, and beyond (Duce et al., 1980).
In region F (Figure 6(f)), except for some largedecreases in very strong wind categories, the smallchange in summer wind speed suggests minor changes inmonsoon wind intensities during the study period. Thisresult suggests fairly steady Asian summer monsoon sys-tems in the recent decades.
3.6. A cause of the wind speed change
A cause of the dominant trend of wind speed decreaseacross China may originate from continental-scale cli-mate variations and may also be related to the tem-perature increases in China and the Eurasian continentin recent decades (e.g. Zhai et al., 1999; Yan et al.,2002; Ren et al., 2005; Gadgil, 2007; Trenberth et al.,2007). Increase of temperatures in land areas in win-ter, for example, could reduce the atmospheric pressureat near-surface levels and weaken the temperature andpressure gradients between the land and adjacent oceans.Weakened pressure-gradient force drives weaker winds,resulting in the observed wind speed decline, as shown inFigure 6. The weaker winter winds in the coastal areas ofChina (region F) could have been caused by weakeningin the pressure gradient between the land and the oceansto the south and the east. Away from the coastal areas, theinland area of region E shares similar land-cover and cli-mate with the region to the east and has the least changein spatial temperature as well as pressure-gradient vari-ations. Thereby, it has the least change in wind speedof all seasons. As we will show next, in accordance tothe warming temperatures in mid- and high-latitude landareas in China and the Eurasian continent the lower-troposphere as well as surface pressure-gradient forceshave weakened. This weakening can explain a large por-tion of the observed weakening winds in China from 1969to 2005. The weakening lower-tropospheric pressure-gradient force and (geostrophic) winds also cause down-ward eddy mixing to weaken horizontal momentum,compared with the strong lower-tropospheric wind sit-uation. Thus, the eddy mixing is likely to contribute
to weakening of the surface wind. On the other hand,more localized changes in surface temperature and there-fore horizontal temperature gradient and thermal wind inthe lower-troposphere, owing to terrain and land-coverheterogeneities, cause deviations of surface wind fromthe large-scale pressure-gradient force effect and mayeven increase the near-surface wind speed. Interactions ofthese competing processes result in rich variations in sur-face wind changes across geographical regions in China.
To examine changes in the pressure-gradient force, weused the NCEP–NCAR reanalysis of geopotential heightand calculated 850-hPa geostrophic wind from 1969 to2005. The geostrophic wind, �Vg, was used to describe thepressure-gradient force because (1) it is a direct functionof the pressure-gradient force, i.e. f k × �Vg = ∇�, wherek is the unit vector in the vertical direction, f theCoriolis’ parameter in s−1, � the geopotential heightin m2s−2, and ∇� is the pressure-gradient force inthe pressure coordinates (Holton, 1979) and (2) �Vg hasa similar magnitude to the actual wind. The 850-hPapressure-gradient force may be used as a proxy of thesurface pressure-gradient force because it is above yetclose to the surface in most of the regions in China(except for the Tibetan Plateau). The calculated �Vg foreach season from 1969 to 2005 was further used to
compute the trend of �Vg, i.e.∂| �Vg|∂t
. These results areshown in Figure 7.
Figure 7(a)–(d) shows the trends of stations’ springand summer wind in China observed for the two periods,1969–1990 and 1991–2005, when the surface windshave different rates of change (Figure 3). Figure 7(e)–(h)shows the trends of 850-hPa geostrophic wind speed incorrespondence to Figure 7(a)–(d). Comparisons of thesepairs of figures, i.e. Figure 7(a) vs (e), (b) vs (f), and soforth, show strong decrease in | �Vg|850 in regions wherethe observed wind weakened significantly. For example,Figure 7(e) shows trend of weakening spring | �Vg|850
in China from 1969 to 1990, except for the middle-reach of the Yangtze River and most of the TibetanPlateau. The strongest decrease is in northern China fromsouthern Xinjiang to Inner Mongolia and east–centralChina. These are also the regions where the strongestdecrease in wind speed was observed in the same period(Figure 7(a)). The leveling-off or weakening in decreaseof spring wind from 1991 to 2005 shown in Figure 7(b)(compared to Figure 7(a)) is also supported by increasein spring | �Vg|850, particularly in northeastern China.
In summer, strong trend of decreasing | �Vg|850 during1969–1990 is shown in north and east–central China(Figure 7(g)), similar to that in spring for the same period(Figure 7(e)). In accordance with these trends in | �Vg|850,the observed winds in these regions (Figure 7(c)) showlarge rates of decrease in wind speed. Similar consistentand comparable trends between Figure 7(h) and (d)also suggests a strong role of the lower-troposphericpressure-gradient force in the observed surface windspeed changes.
Copyright 2010 Royal Meteorological Society Int. J. Climatol. (2010)
H. GUO et al.
In autumn and winter seasons, changes in sign and spa-tial pattern of | �Vg|850 also are consistent with the sign andpattern of the trends of observed wind speed changes.Quantitatively, the average trend of | �Vg|850 in China is−0.0059 ms−1a−1 for autumn and is −0.0098 ms−1a−1
for winter during 1969–1990, smaller but compara-ble to the observed average trend (Figure 3). Thesecoherent changes in | �Vg|850 and the observed windspeed support the notion that weakening in the lower-tropospheric pressure-gradient force has been a primarycause of the decrease of observed surface winds in recentdecades.
4. Summary and concluding remarks
We improved a quality dataset of near-surface windfrom 652 stations in China based on the work of Fenget al. (2004), and examined variations of the wind speedchange from 1969 to 2005. Our results show that moststations in mainland China have experienced statisticallysignificant decline of annual mean wind in this studyperiod, except for some stations in central China. Theaverage rate of decrease in annual mean wind speed overChina is −0.018 ms−1a−1, and greater decrease occurredat stations with stronger winds. The decrease was at amuch faster rate from 1969 to 1990 and weakened after
1990. While some of these results are consistent with thefinding by Xu et al. (2006a), who used 305 stations intheir analysis, our in-depth analyses of this new winddataset and the NCEP-NCAR reanalysis data providemore comprehensive understandings of the wind speedchanges and a cause of such changes.
The wind speed averaged for each season also hasdecreased significantly from 1969 to 2005. The largestdecrease rate is in spring season at −0.021 ms−1a−1,followed by winter at −0.019 ms−1a−1. Summer andautumn have smaller decrease rates at −0.015 ms−1a−1
and −0.016 ms−1a−1, respectively. Wind change alsohas distinct regional features. In western and northernXinjiang Autonomous Region, strong decrease in windspeed occurred in the warm season months from Aprilthrough October. Over the Tibetan Plateau, significantdecrease was found in late winter and early spring.Relatively mild weakening in wind occurred in winter andspring months in north–central China, while northeastChina has the largest decrease in wind speed in Chinawith strongest weakening in winter and spring winds.The areas across the middle-reach of the Yangtze Riverand the Sichuan Basin have the least change in windspeed in China. Moreover, in all these regions, largerdecreases have always occurred in the stronger windcategories. Large decrease in strong wind categories
Figure 7. Trends of seasonal mean wind speed changes at stations for (a) spring of 1969–1990, (b) spring of 1991–2005, (c) summer of1969–1990 and (d) summer of 1991–2005 (units: ms−1a−1). Filled circles or diamonds show trends significant at the 95% confidence level.Trends of seasonal mean geostrophic wind speed change for (e) spring of 1969–1990, (f) spring of 1991–2005, (g) summer of 1969–1990 and(h) summer of 1991–2005 (units: ms−1a−1). Shading indicates decreasing wind speed, and darker shading indicates decrease significant at the95% confidence level. Blank indicates increasing wind speed, and stippled areas have increasing wind speed significant at the 95% confidence
level.
Copyright 2010 Royal Meteorological Society Int. J. Climatol. (2010)
CHANGES IN NEAR-SURFACE WIND SPEED IN CHINA
Figure 7. (Continued).
and small decrease or increase in light wind categoriesindicate that the wind speed fluctuations at monthlyto seasonal timescales have reduced during the studyperiod.
The large decrease in strong winds of spring monthsin north and northeast China is consistent with and mayhave contributed to the recent decline in the number ofdust storms in China. Yet, this decrease in strong windsalso may lower the potential for wind energy harvest inChina. From climate perspective, the small decrease inwind speed in the warm season months in southeast aswell as southern part of northeast China would suggestthat both the Indian and East Asian summer monsoonwinds only changed (weakened) slightly in the past 3decades.
A physical process contributing to the observed weak-ening winds is the change in the large-scale atmosphericcirculation in China and surrounding regions in theEurasian continent. This notion is tested and supportedby the results from our analysis of the lower-tropospherepressure-gradient force in the past 3 decades. Significantdecreases in pressure-gradient force at 850 hPa, a proxyfor the near-surface gradient force, are found from 1969to 1990, and a ‘slowing down’ of this weakening trendalso emerged after 1990. While the large-scale circulationis certainly a primary cause of these pressure-gradientchanges, the strong increase in surface temperature, par-ticularly in high-latitude regions, may have influenced thecirculation and contributed to weakening the pressure-gradient force. Weakened lower-tropospheric pressure-gradient force further reduces downward momentum
transport by vertical eddy mixing, also weakening thesurface winds. Identifying these sources helps us com-prehend the regional climate variations in the context ofthe global change.
Superimposed on the circulation and climate effectson the changing wind speed is the human-inducedurban effect. It is intriguing that while the urbanwinds are much weaker than the rural winds theirdifference narrowed substantially from 1991 to 2005by much stronger weakening decrease rate of surfacewind in urban stations than in rural stations when theurbanization actually boomed in China. This observa-tion which cannot be interpreted by the urban fric-tional effect on wind suggests a new effect from fasturban development on wind change and deserves furtherinvestigation.
Acknowledgements
We thank China Meteorological Administration for someclimatic data used in this study. Valuable comments andsuggestions from two anonymous reviewers and the edi-tor helped improve this manuscript and are appreciated.This work was supported by the Natural Science Foun-dation of China (#30770411), Chinese Academy of Sci-ences (CAS) project to the Institute of Geographical Sci-ences and Natural Resources Research (06 W60270SZ),and a grant to Dr. H. Guo from the China PostdoctoralScience Foundation.
Copyright 2010 Royal Meteorological Society Int. J. Climatol. (2010)
H. GUO et al.
References
Brazdil R, Chroma K, Dobrovolny P, Tolasz R. 2009. Climate fluctu-ations in the Czech Republic during the period 1961–2005. Interna-tional Journla of Climatology 29: 223–242, DOI:10.1002/joc.1718.
Chen S, Li Y, Thomas A. 2006. Climatic change on the TibetanPlateau: potential evapotranspiration trends from 1961–2000.Climatic Change 76: 291–319.
Duce RA, Unni CK, Ray BJ, Prospero JM, Merrill JT. 1980. Longrange atmospheric transport of soil dust from Asia to the tropicalNorth Pacific: temporal variability. Science 809: 1522–1524.
Feng S, Hu Q, Qian W. 2004. Quality control of daily meteorologicaldata in China, 1951–2000: a new dataset. International Journla ofClimatology 24: 853–870, DOI: 10.1002/joc.1047.
Gadgil S. 2007. The Indian monsoon: 3. Physics of the monsoon.Resonance 12: 4–20.
Holton JR. 1979. The Planetary Boundary Layer. An Introduction toDynamic Meteorology. Academic Press: New York, 101–118.
Hu Q, Weiss A, Feng S, Baenziger PS. 2006. Earlier winter wheatheading dates and warmer spring in the Great Plains of the UnitedStates. Agricultural and Forest Meteorology 135: 284–290.
Huang J, Minnis P, Lin B, Wang T, Yi Y, Hu Y, Sun-Marck S,Ayers K. 2006. Possible influences of Asian dust aerosols oncloud properties and radiative forcing observed from MODISand CERES. Geophysical Research Letters 33: L06824, DOI:10.1029/2005GL024724.
Kalnay E, and Co-authors. 1996. The NCEP/NCAR 40-year reanalysisproject. Bulletin of the American Meteorological Society 77:437–471.
Kaufman L, Rousseeuw PJ. 1990. Finding Groups in Data. AnIntroduction to Cluster Analysis. Wiley Series in Probability andMathematical Statistics. Applied Probability and Statistics . Wiley:New York.
Lau KM, Ramanathan V, Wu G, Li Z, Tsay SC, Hsu C, Sikka R,Holben B, Lu D, Tartari G, Chin M, Koudelova P, Chen H, Ma Y,Huang J, Taniguchi K, Zhang R. 2008. The joint aerosol-monsoonexperiment – a new challenge for monsoon climate research.Bulletin of the American Meteorological Society 3: 369–383,DOI:10.1175/BAMS-89-3-369.
Liu L, Skidmore E, Hasi E, Wagner L, Tatarko J. 2005. Dune sandtransport as influenced by wind directions, speed and frequencies inthe Ordos Plateau, China. Geomorphology 67: 283–297.
Liu B, Xu M, Henderson M, Gong W. 2004. A spatial analysis of panevaporation trends in China, 1955–2000. Journal of GeophysicalResearch: Atmospheres 109: D15102, DOI: 10.1029/2004JD004511.
Mahrt L, Heald RC, Lenschow DH, Stankov BB, Troen I. 1979. Anobservational study of the structure of the nocturnal boundary layer.Boundary Layers Meteorology 17: 247–264.
McVicar TR, Van Niel TG, Li L, Hutchinson MF, Mu X, Liu Z.2007. Spatially distributing monthly reference evapotranspirationand pan evaporation considering topographic influences. Journal ofHydrology 338: 196–220.
McVicar TR, Van Niel TG, Li LT, Roderick ML, Rayner DP,Ricciardulli L, Donohue RJ. 2008. Wind speed climatology andtrends for Australia, 1975–2006: capturing the stilling phenomenonand comparison with near-surface reanalysis output. GeophysicalResearch Letters 35: L20403, DOI:10.1029/2008GL035627.
Nazarenko L, Menon S. 2005. Varying trends in surface energy fluxesand associated climate between 1960 and 2002 based on transientclimate simulations. Geophysical Research Letters 32: L22704, DOI:10.1029/2005GL024089.
Ozdogan M, Salvucci GD. 2004. Irrigation-induced changes inpotential evapotranspiration in southeastern Turkey: Test andapplication of Bouchet’s complementary hypothesis. WaterResources Research 40: W04301, DOI:10.1029/2003WR002822.
Ozdogan M, Salvucci GD, Anderson BT. 2006. Examination of theBouchet-Morton complementary relationship using a mesoscaleclimate model and observations under a progressive irrigationscenario. Journal of Hydrometeorology 7: 235–251.
Pirazzoli PA, Tomasin A. 2003. Recent near-surface wind changes inthe central Mediterranean and Adriatic areas. International Journlaof Climatology 23: 963–973.
Pryor SC, Barthelmie RJ, Young DT, Takle ES, Arritt RW, Flory D,Gutowski WJ Jr, Nunes A, Roads J. 2009. Wind speed trends overthe contiguous United States. Journal of Geophysical Research:Atmospheres 114: D14105, DOI:10.1029/2008JD011416.
Qian W, Quan L, Shi S. 2002. Variations of the dust storm in Chinaand its climatic control. Journal of Climate 15: 1216–1229, DOI:10.1175/1520-0442.
Ren G, Guo J, Xu M, Chu Z, Zhang L, Zou X, Li Q, Liu X. 2005.Climate changes of China’s mainland over the past half century.Acta Meteorologica Sinica 63: 942–956 (in Chinese).
Robeson SM. 2004. Trends in time-varying percentiles of daily mini-mum and maximum temperature over North America. GeophysicalResearch Letters 31: L04203, DOI: 10.1029/2003GL019019.
Shenbin C, Yunfeng L, Thomas A. 2006. Climatic change onthe Tibetan Plateau: Potential Evapotranspiration Trends from1961–2000. Climatic Change 76: 291–319.
Stull RB. 1988. An Introduction to Boundary Layer Meteorology.Kluwer Academic Publishers: Dordrecht.
Taylor AW. 2000. Change-Point Analyzer 2.0 Shareware Program.Taylor Enterprises: Libertyville, Illinois. http://www.variation.com/cpa/[accessed year 2008].
Trenberth KE, Jones PD, Ambenje P, Bojariu R, Easterling D, KleinTank A, Parker D, Rahimzadeh F, Renwick JA, Rusticucci M,Soden B, Zhai P. 2007. Observations: Surface and AtmosphericClimate Change. In: Climate Change 2007: The Physical ScienceBasis, Contribution of Working Group I to the Fourth AssessmentReport of the Intergovernmental Panel on Climate Change,Solomon S, Qin D, Manning M, Chen Z, Marquis M, Averyt KB,Tignor M, Miller HL (eds.)Cambridge University Press: Cambridge,United Kingdom and New York, 237–336.
Tuller SE. 2004. Measured wind speed trends on the west coast ofCanada. International Journal of Climatology 24: 1359–1374, DOI:10.1002/joc.1073.
Wang J, Ding Y, He Z, Yu J. 2004a. An updating analysis of theclimate change in recent 50 years. Acta Meteorologica Sinica 62(2):228–236 (in Chinese).
Wang X, Dong Z, Zhang J, Liu L. 2004b. Modern dust storms inChina: an overview. Journal of Arid Environments 58: 559–574.
Wild M, Gilgen H, Roesch A, Ohmura A, Long CN, Dutton EG,Forgan B, Kallis A, Russak V, Tsvetkov A. 2005. From dimmingto brightening: decadal change in solar radiation at Earth’s surface.Science 308: 847–850.
Xu M, Chang C, Fu C, Qi Y, Robock A, Robinson D, Zhang H.2006a. Steady decline of east Asian monsoon winds, 1969–2000:evidence from direct ground measurements of wind speed.Journal of Geophysical Research: Atmospheres 111: D24111, DOI:10.1029/2006JD007337.
Xu X, Levy JK, Lin Z, Chen H. 2006b. An investigation of sand-dust storm events and land surface characteristics in China usingNOAA/NDVI data. Global and Planetary Change 52: 182–196.
Yan Z, Jones PD, Davies TD, Moberg A, Bergstrom H, Camuffo D,Cocheo C, Maugeri M, Demaree GR, Verhoeve T, Thoen E, Bar-riendos M, Rodrıguez R, Martın-vide J, Yang C. 2002. Trends ofextreme temperatures in Europe and China based on daily observa-tion. Climatic Change 53: 355–392.
Yin X, Wang S. 2007. Fractal characteristics and trend forecast of dust-storms and severe dust-storms in Northern China. Journal of DesertResearch 27: 130–136 (in Chinese).
Zhai P, Sun A, Ren F, Liu X, Gao B, Zhang Q. 1999. Changes ofclimate extremes in China. Climatic Change 42: 203–218.
Zhang YQ, Liu CM, Tang YH, Yang YH. 2007. Trends in panevaporation and reference and actual evapotranspiration across theTibetan Plateau. Journal of Geophysical Research: Atmospheres 112:D12110, DOI:10.1029/2006JD008161.
Zhou W, Yang H, Fang Z. 2006. Wind power potential andcharacteristic analysis of the Pearl River Delta region, China.Renewable Energy 31: 739–753.
Copyright 2010 Royal Meteorological Society Int. J. Climatol. (2010)