Changes in Ownership and Changes in Ownership and Value of Housing Stock Value of Housing Stock Over Time Over Time Evds 697.10 Evds 697.10 Sara O’Neill Sara O’Neill Nicole McLellan Nicole McLellan Brier Ferguson Brier Ferguson Marcelo Figueira Marcelo Figueira Submitted to: Dr. R. Levy
Transcript
Changes in Ownership and Changes in Ownership and Value of Housing Stock Over Value of Housing Stock Over
•Majority of housing in the S-SE is constructed within the past 35 years
Single Detached vs. All Single Detached vs. All OtherOther19861986
S-SE
Calgary
Single Detached vs. All Single Detached vs. All OtherOther19911991
S-SE
Calgary
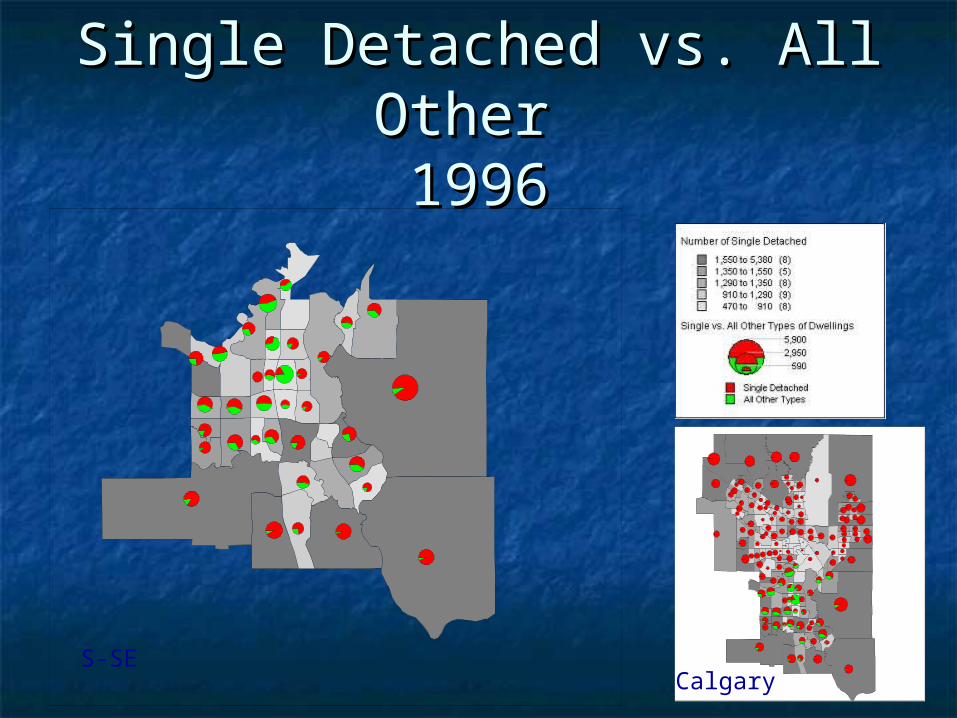
Single Detached vs. All Single Detached vs. All Other Other 19961996
S-SECalgary
Single Detached vs. All Single Detached vs. All Other 2001Other 2001
S-SE Calgary
Single Detached DwellingsSingle Detached Dwellings
68 68 70 71
57 5561
58
0
10
20
30
40
50
60
70
80
90
100
1986 1991 1996 2001
%S-SECity
AnalysisAnalysis
Proportion of Single Proportion of Single Detached compared to Detached compared to All Other Dwellings has All Other Dwellings has not changed not changed substantially between substantially between 1986 and 2001, in both 1986 and 2001, in both the S-SE and the City.the S-SE and the City. Further from the City Centre in the S-SE the Further from the City Centre in the S-SE the majority of housing types is Single Detached.majority of housing types is Single Detached.
Appears to be a more diverse housing stock in Appears to be a more diverse housing stock in the City Centre.the City Centre.
Average Dwelling Values & Average Dwelling Values & Ownership 1991Ownership 1991
S-SE
Calgary
Average Dwelling Values & Average Dwelling Values & Ownership Ownership 19961996
S-SECalgary
Average Dwelling Values & Average Dwelling Values & Ownership Ownership 20012001
S-SE
Calgary
72 74 77 81
28 26 23 19
0
10
20
30
40
50
60
70
80
90
100
1986 1991 1996 2001
% RentedOwned
58 60 6471
42 40 3629
0
10
20
30
40
50
60
70
80
90
100
1986 1991 1996 2001
% RentedOwnedCity
S-SE
Owned vs. Rented
AnalysisAnalysis
Percentage of owned Percentage of owned housing has increased housing has increased between 1986 and 2001, between 1986 and 2001, for both the S-SE and for both the S-SE and the City.the City.
At greater distances At greater distances from the City Centre the from the City Centre the proportion of Owned proportion of Owned dwellings is higher.dwellings is higher.
Proximity to major Proximity to major highways (ex. MacLeod highways (ex. MacLeod Trail) appears to Trail) appears to increase the ratio of increase the ratio of rented dwellings.rented dwellings.
Average Value of Dwellings in Average Value of Dwellings in S-SES-SE
0%
10%
20%
30%
40%
50%
60%
70%
0 50 100 150 200 250 300 350 400 450 500
Value of Dwellings (x1000)
1991
1996
2001
Average Value of Dwellings Average Value of Dwellings City WideCity Wide
0%
10%
20%
30%
40%
50%
60%
70%
0 50 100 150 200 250 300 350 400 450 500
Value of Dwellings (x1000)
1991
1996
2001
AnalysisAnalysis In both the S-SE and In both the S-SE and
the City the values are the City the values are unchanged during the unchanged during the 1991 and 1996 census 1991 and 1996 census tracts.tracts.
In 2001 there appears In 2001 there appears to be a large increase to be a large increase in the average value of in the average value of dwellings.dwellings.
Also, for both the S-SE Also, for both the S-SE and the City there is a and the City there is a wider distribution wider distribution around the higher around the higher values.values.
ConclusionsConclusions
The S-SE area is The S-SE area is predominately single predominately single detached dwellings.detached dwellings.
Ownership in the S-Ownership in the S-SE has increased, SE has increased, and the majority of and the majority of dwellings are owned.dwellings are owned.
Average value of Average value of dwellings in both the dwellings in both the City and the S-SE has City and the S-SE has increased between increased between 1996 and 2001.1996 and 2001.