32
“CHANGES IN U.S. PROPANE SUPPLY” Presented by: Ajey Chandra Muse, Stancil & Co. January 21, 2015
“CHANGES IN U.S. PROPANE SUPPLY”
Presented by:
Ajey ChandraMuse, Stancil & Co.
January 21, 2015
2
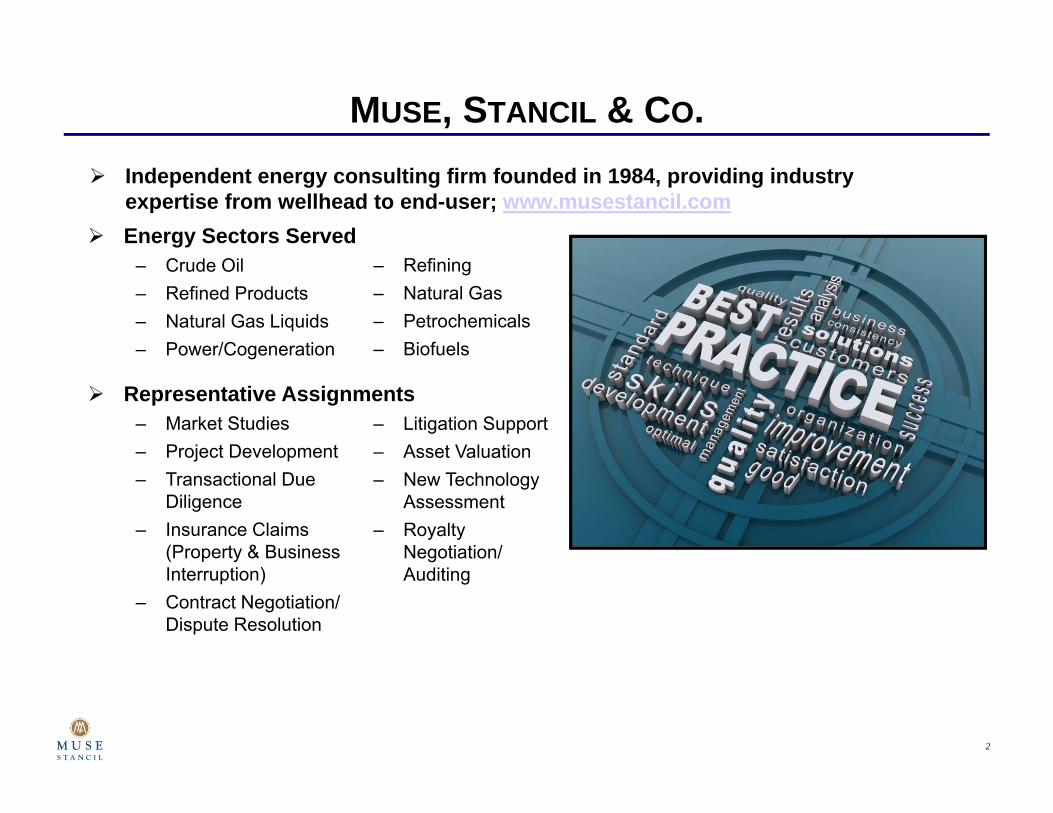
MUSE, STANCIL & CO. Independent energy consulting firm founded in 1984, providing industry
expertise from wellhead to end-user; www.musestancil.com
Energy Sectors Served– Crude Oil– Refining – Refined Products– Natural Gas– Natural Gas Liquids– Petrochemicals– Biofuels– Power/Cogeneration
Representative Assignments– Market Studies– Project Development– Transactional Due
Diligence– Insurance Claims
(Property & Business Interruption)
– Contract Negotiation/Dispute Resolution
Energy Sectors Served– Crude Oil– Refined Products– Natural Gas Liquids– Power/Cogeneration
– Refining – Natural Gas– Petrochemicals– Biofuels
– Litigation Support– Asset Valuation– New Technology
Assessment– Royalty
Negotiation/Auditing
3
AGENDA How the Shale Revolution is changing the NGL landscape in North America
Current and Projected Propane Production
Minnesota Propane Supply– Where does it come from – How does it get to here
Export markets and their effect on propane markets
Impact of the Panama Canal Expansion

4
THE SHALE REVOLUTION HAS CHANGEDEVERYTHING FOR U.S. ENERGY MARKETS
5
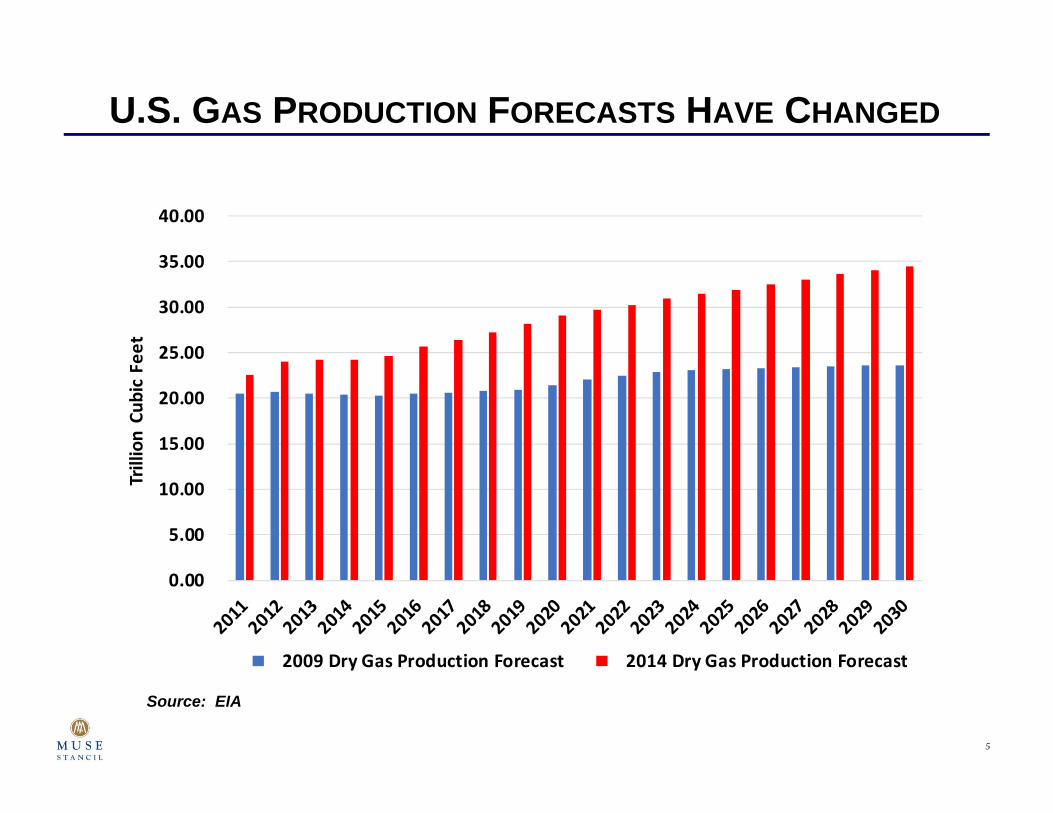
U.S. GAS PRODUCTION FORECASTS HAVE CHANGED
Source: EIA
0.00
5.00
10.00
15.00
20.00
25.00
30.00
35.00
40.00
Trillion Cu
bic Feet
2009 Dry Gas Production Forecast 2014 Dry Gas Production Forecast

6
MORE NATURAL GAS = MORE NATURAL GAS LIQUIDS
Source: EIA
‐
100
200
300
400
500
600
700
800
900
1,000
Million Ba
rrels

7
U.S. PROPANE PRODUCTION HAS SURGED
0
200
400
600
800
1000
1200
2000 2001 2002 2003 2004 2005 2006 2007 2008 2009 2010 2011 2012 2013
Barrels pe
r day
Gas Plant and Refinery Production (Propane)
Gas Plant Production ‐ Propane Refinery Production ‐ Propane
8
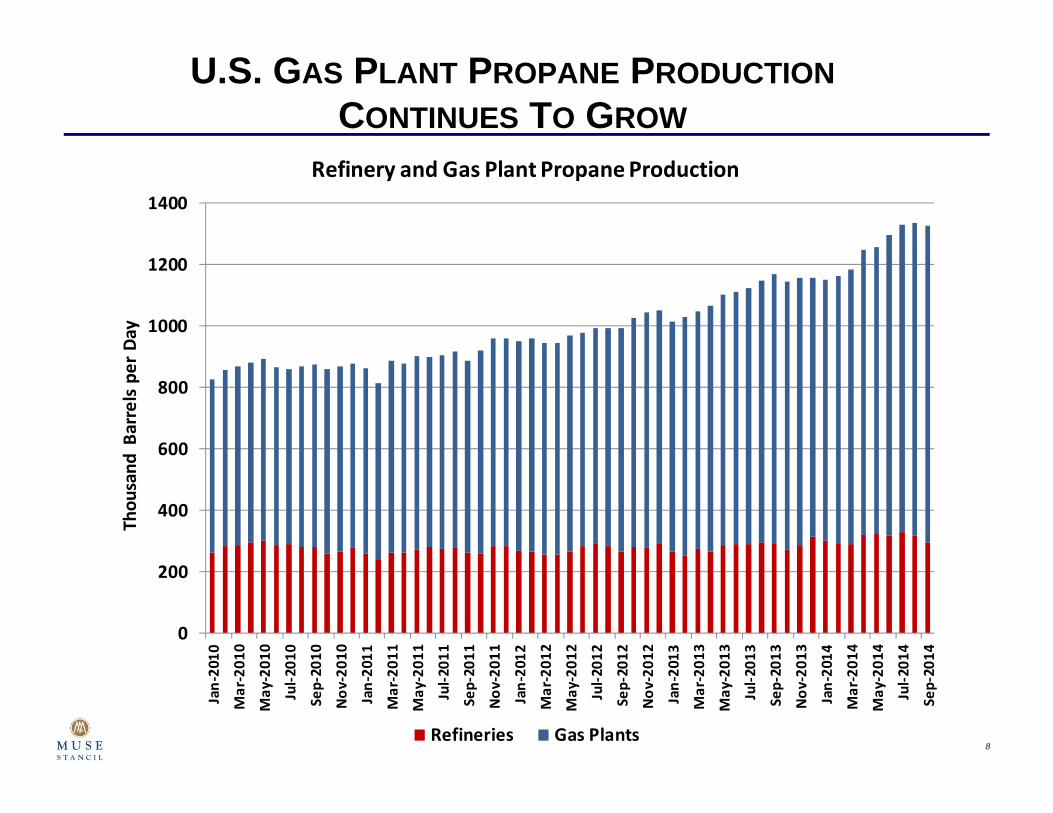
U.S. GAS PLANT PROPANE PRODUCTIONCONTINUES TO GROW
0
200
400
600
800
1000
1200
1400Jan‐2010
Mar‐201
0
May
‐201
0
Jul‐2
010
Sep‐2010
Nov
‐201
0
Jan‐2011
Mar‐201
1
May
‐201
1
Jul‐2
011
Sep‐2011
Nov
‐201
1
Jan‐2012
Mar‐201
2
May
‐201
2
Jul‐2
012
Sep‐2012
Nov
‐201
2
Jan‐2013
Mar‐201
3
May
‐201
3
Jul‐2
013
Sep‐2013
Nov
‐201
3
Jan‐2014
Mar‐201
4
May
‐201
4
Jul‐2
014
Sep‐2014
Thou
sand
Barrels pe
r Day
Refinery and Gas Plant Propane Production
Refineries Gas Plants
9
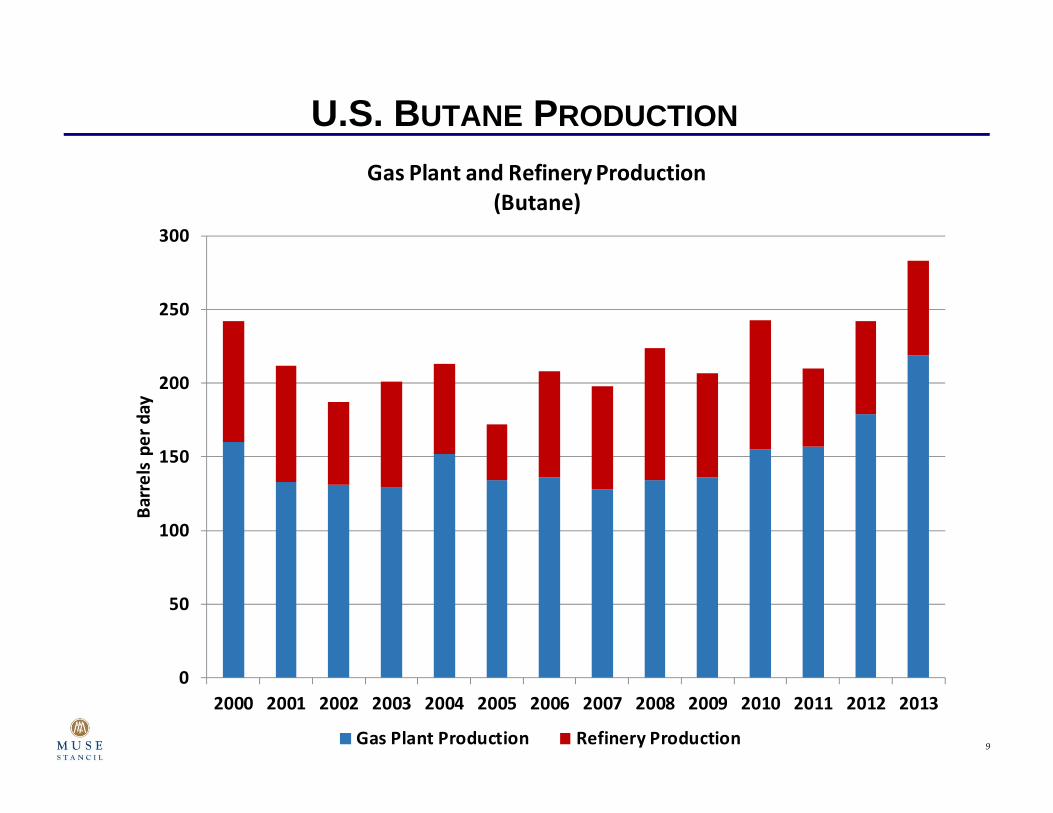
U.S. BUTANE PRODUCTION
0
50
100
150
200
250
300
2000 2001 2002 2003 2004 2005 2006 2007 2008 2009 2010 2011 2012 2013
Barrels pe
r day
Gas Plant and Refinery Production (Butane)
Gas Plant Production Refinery Production

10
U.S. EXPORTS ARE GROWING SUBSTANTIALLY
0
200
400
600
800
1000
1200
1400
1600Jan‐2010
Mar‐201
0
May
‐201
0
Jul‐2
010
Sep‐2010
Nov
‐201
0
Jan‐2011
Mar‐201
1
May
‐201
1
Jul‐2
011
Sep‐2011
Nov
‐201
1
Jan‐2012
Mar‐201
2
May
‐201
2
Jul‐2
012
Sep‐2012
Nov
‐201
2
Jan‐2013
Mar‐201
3
May
‐201
3
Jul‐2
013
Sep‐2013
Nov
‐201
3
Jan‐2014
Mar‐201
4
May
‐201
4
Jul‐2
014
Sep‐2014
Thou
sand
Barrel p
er Day
Propane and Propylene Production and Trade Trends
Imports Exports Production
11
Mont Belvieu
Hobbs
Conway
NM
TXLA
MSAL
AR
GA
FL
SC
TN
KY
NC
VAWV
PA
NJ
NY
ME
VT
NH
MACT RI
OHIN
IL
MO
WIMI
MN
ND
SDWY
CO
NE
KS
MT
MD DE
OK
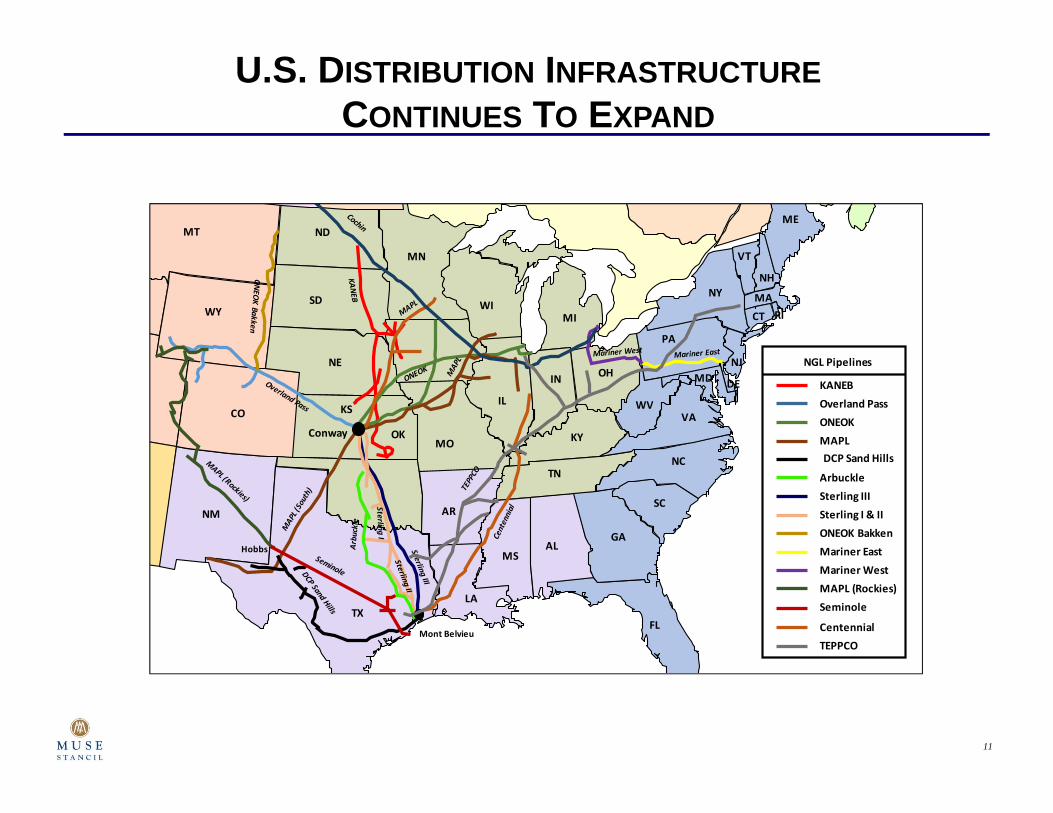
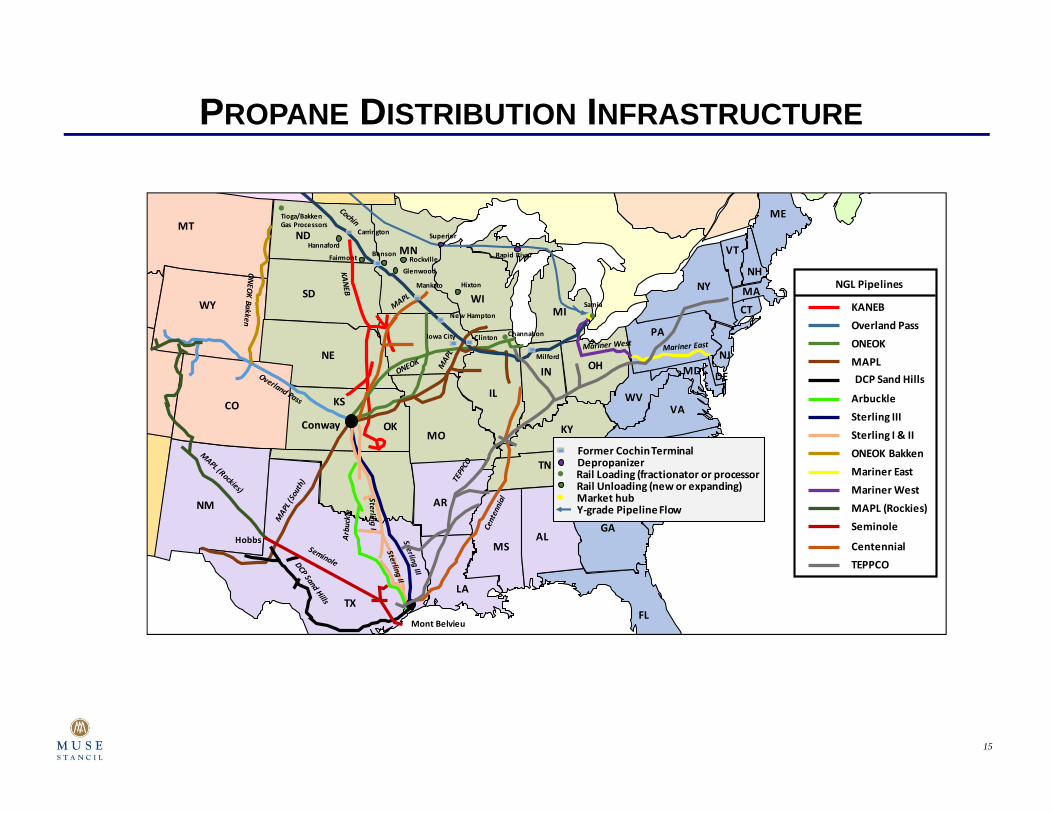
KANEBOverland PassONEOKMAPL
NGL Pipelines
DCP Sand Hills
ArbuckleSterling IIISterling I & IIONEOK BakkenMariner EastMariner WestMAPL (Rockies)Seminole
CentennialTEPPCO
U.S. DISTRIBUTION INFRASTRUCTURECONTINUES TO EXPAND
12
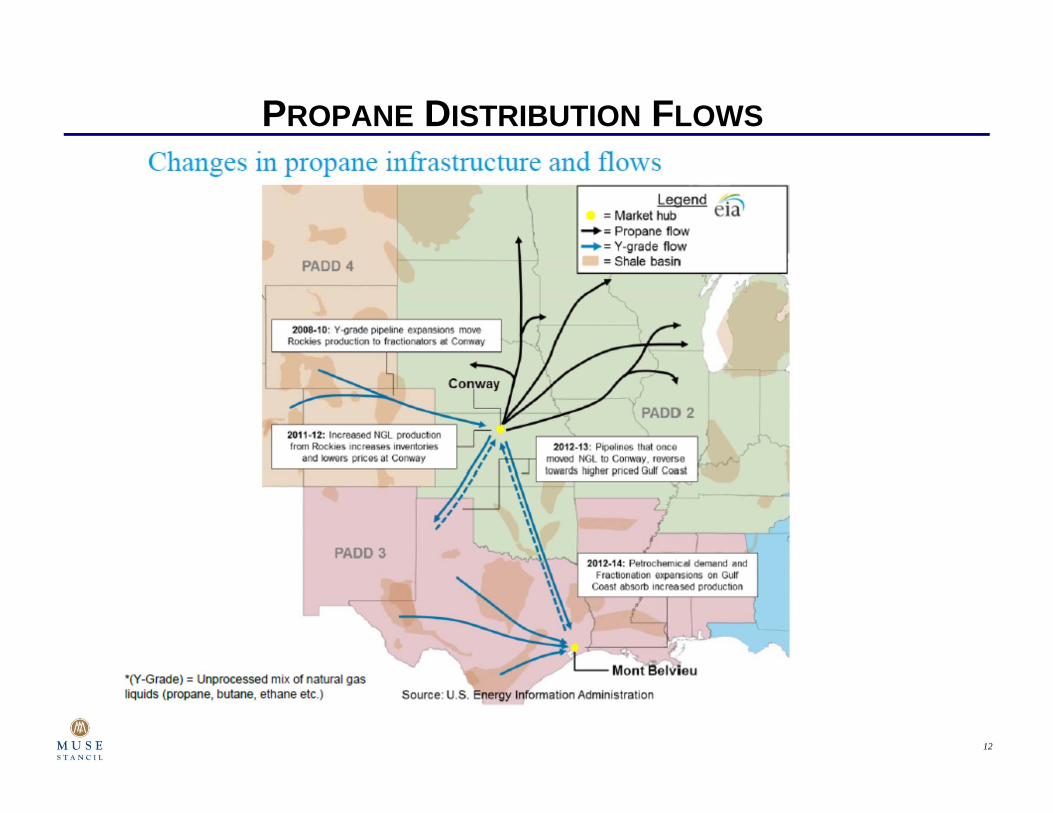
PROPANE DISTRIBUTION FLOWS
13
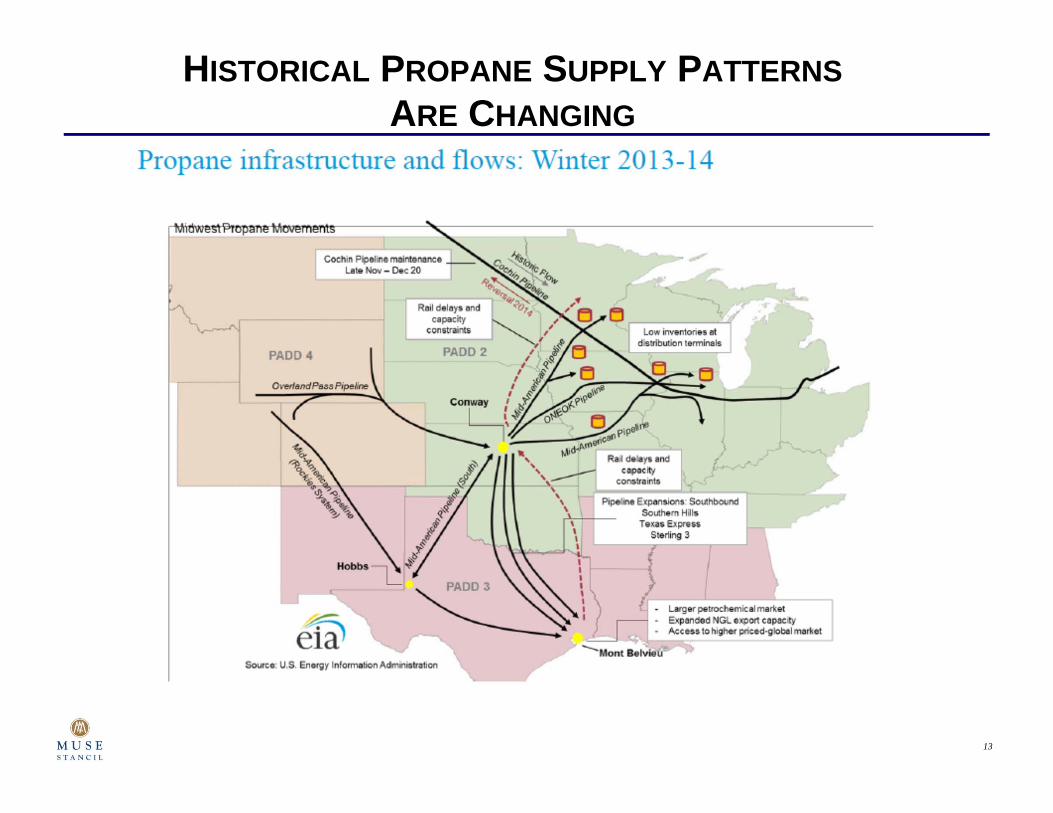
HISTORICAL PROPANE SUPPLY PATTERNSARE CHANGING
14
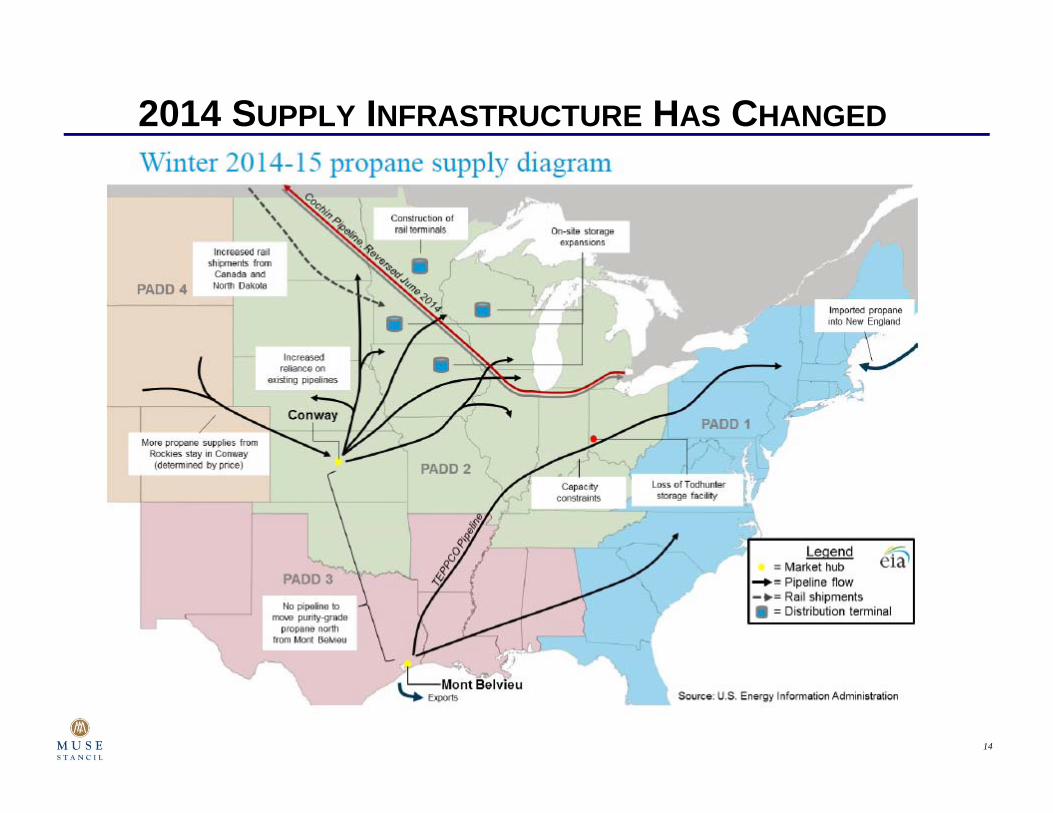
2014 SUPPLY INFRASTRUCTURE HAS CHANGED
15
Mont Belvieu
Hobbs
Conway
NM
TXLA
MSAL
AR
GA
FL
SC
TN
KY
NC
VAWV
PA
NJ
NY
ME
VT
NH
MACT RI
OHIN
IL
MO
WIMI
MNND
SDWY
CO
NE
KS
MT
MD DE
OK
KANEBOverland PassONEOKMAPL
NGL Pipelines
DCP Sand Hills
ArbuckleSterling IIISterling I & IIONEOK BakkenMariner EastMariner WestMAPL (Rockies)Seminole
CentennialTEPPCO
Carrington
New Hampton
Hannaford
Fairmont BensonRockville
Glenwood
Mankato Hixton
Iowa City Clinton Channahon
Milford
Sarnia
Rapid River
Superior
Tioga/BakkenGas Processors
Former Cochin TerminalDepropanizerRail Loading (fractionator or processor
Market hubRail Unloading (new or expanding)
Y‐grade Pipeline Flow
PROPANE DISTRIBUTION INFRASTRUCTURE
16
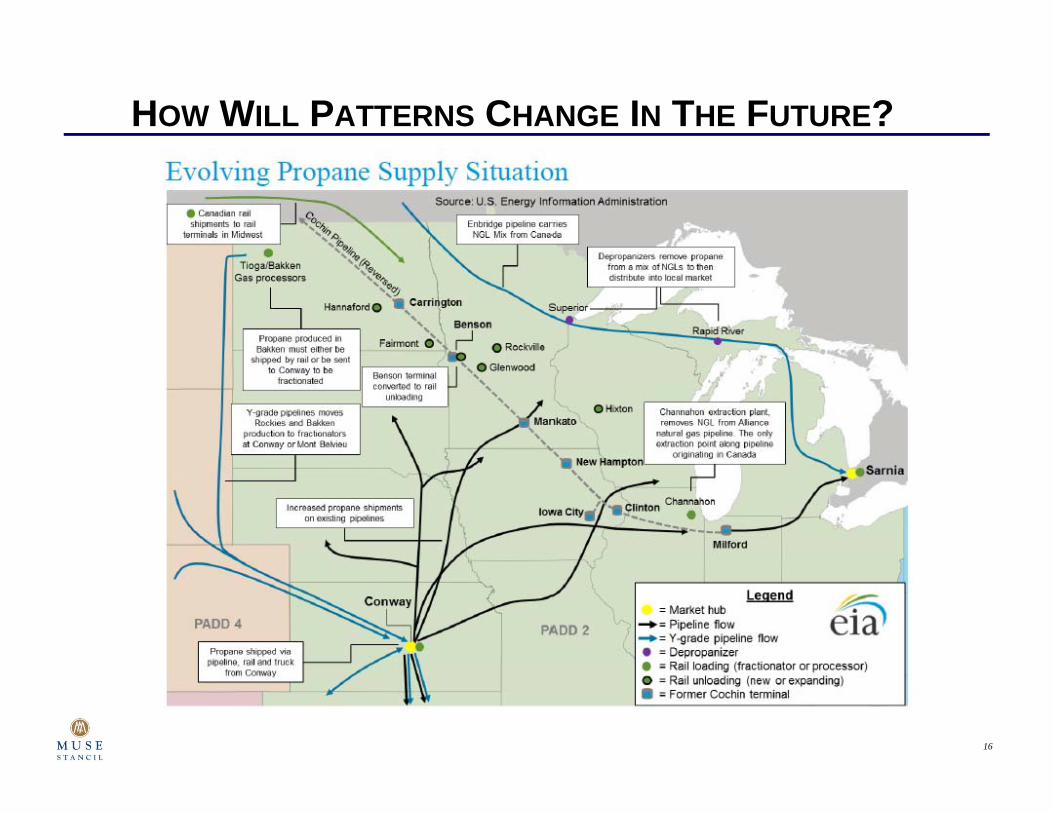
HOW WILL PATTERNS CHANGE IN THE FUTURE?
17
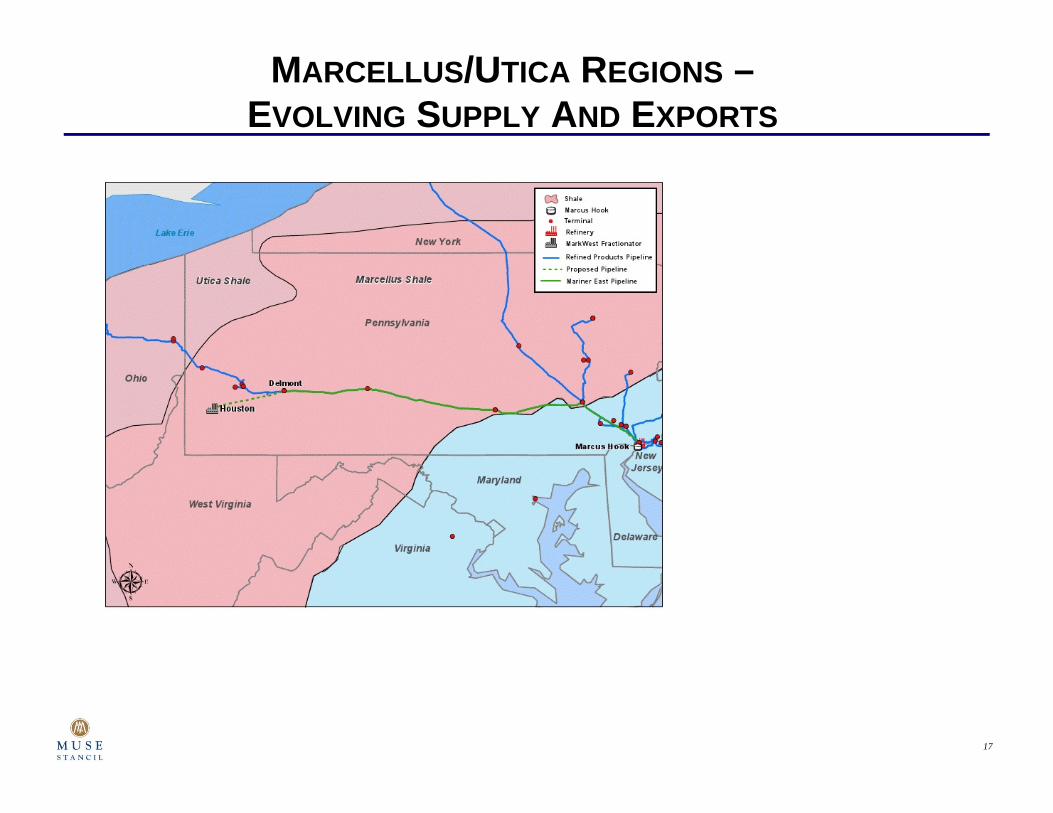
MARCELLUS/UTICA REGIONS –EVOLVING SUPPLY AND EXPORTS
18
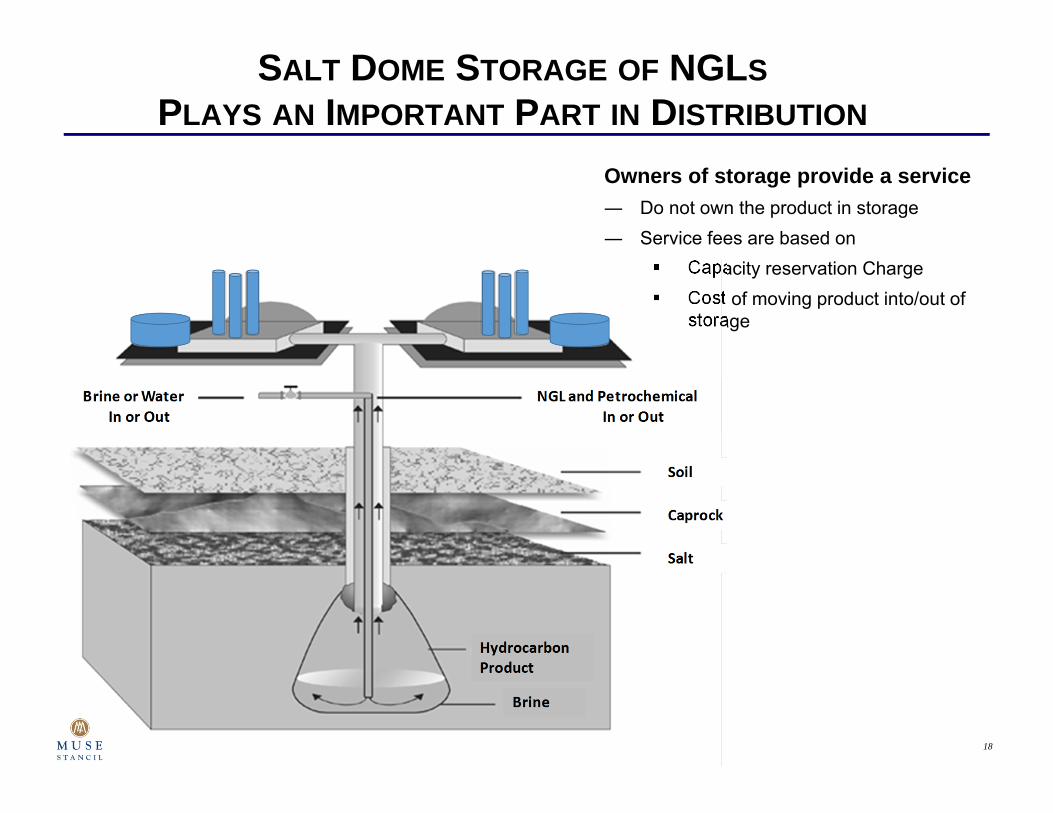
SALT DOME STORAGE OF NGLSPLAYS AN IMPORTANT PART IN DISTRIBUTION
Owners of storage provide a service― Do not own the product in storage― Service fees are based on
Capacity reservation Charge Cost of moving product into/out of
storage
19
ALLOCATION OF PRODUCT Why do pipelines go on “allocation”
– Need to balance supply and demand
What does this mean for the propane distributor– Why can’t you get all the propane that you need when you need it?
Who determines how much propane you get?– Key elements of pipeline allocation
What is the total capacity of the system? When capacity is limited, what is a “fair” way to distribute this capacity? Who has paid for the capacity? Who has historically used the capacity? What about “new” shippers
Will rail shipments play a larger role in the future?
20
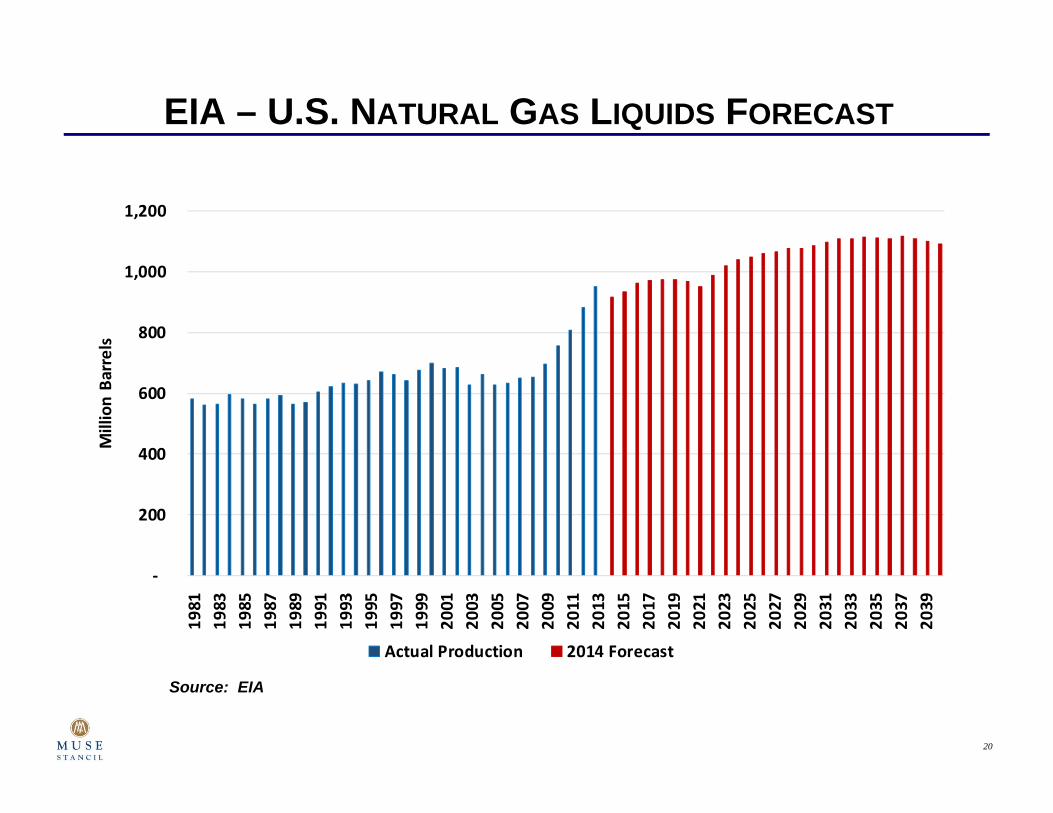
EIA – U.S. NATURAL GAS LIQUIDS FORECAST
‐
200
400
600
800
1,000
1,20019
8119
8319
8519
8719
8919
9119
9319
9519
9719
9920
0120
0320
0520
0720
0920
1120
1320
1520
1720
1920
2120
2320
2520
2720
2920
3120
3320
3520
3720
39
Million Ba
rrels
Actual Production 2014 Forecast
Source: EIA
21
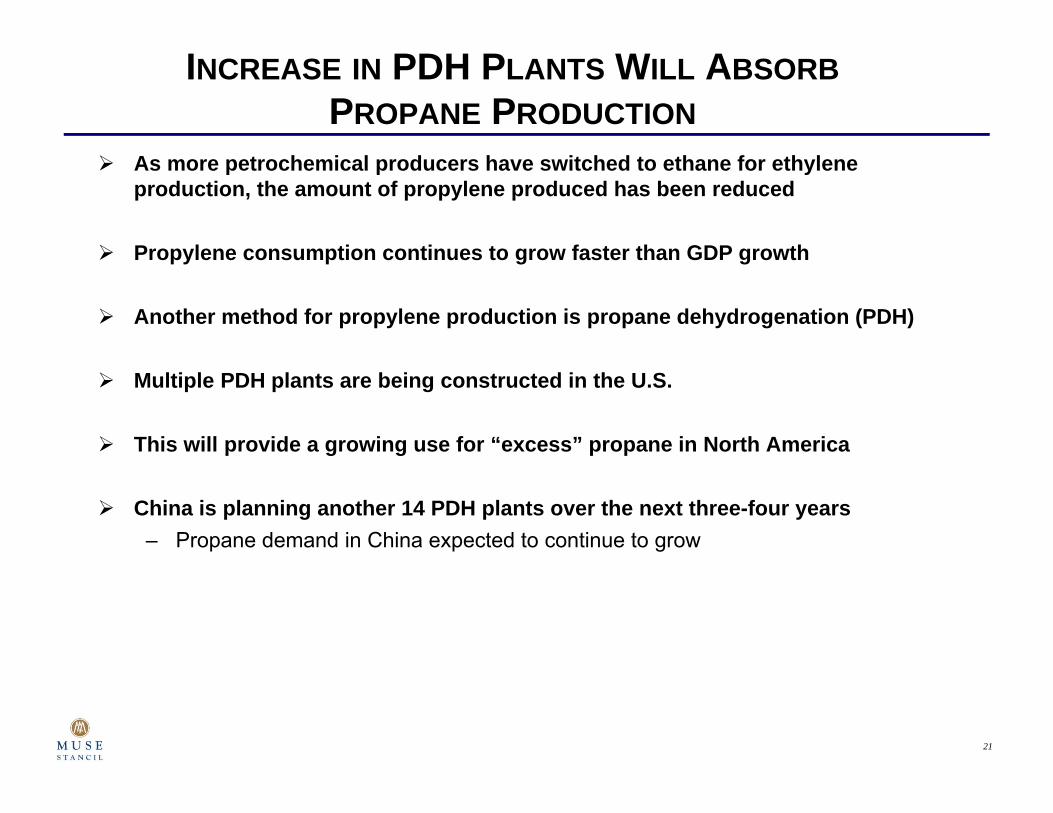
INCREASE IN PDH PLANTS WILL ABSORBPROPANE PRODUCTION
As more petrochemical producers have switched to ethane for ethylene production, the amount of propylene produced has been reduced
Propylene consumption continues to grow faster than GDP growth
Another method for propylene production is propane dehydrogenation (PDH)
Multiple PDH plants are being constructed in the U.S.
This will provide a growing use for “excess” propane in North America
China is planning another 14 PDH plants over the next three-four years– Propane demand in China expected to continue to grow

22
NEW PROJECTS FOR LPG EXPORTS
0
200
400
600
800
1000
1200
1400
1600
2012 2013 2014 2015 2016 2017 2018
Mb/d
LPG Export Projects
Exisiting Approved

23
U.S. LPG TERMINAL PROJECTS
Corpus Christi
PortlandMONTANA
WYOMING
IDAHO
WASHINGTON
OREGON
NEVADA
UTAH
CALIFORNIA
ARIZONA
NORTH DAKOTA
SOUTH DAKOTA
NEBRASKA
COLORADO
NEW MEXICO
TEXAS
OKLAHOMA
KANSAS
ARKANSAS
LOUISIANA
MISSOURI
IOWA
MINNESOTA
WISCONSIN
ILLINOIS INDIANA
KENTUCKY
TENNESSEE
MISS ALABAMA
GEORGIA
FLORIDA
SOUTHCAROLINA
NORTH CAROLINA
VIRGINIAWV
OHIO
MICHIGAN
NEW YORK
PENNSYLVANIA
MARYLANDDELAWARE
NEWJERSEY
CONNRI
MASS
MAINE
VT
NH
Freeport Houston Ship Channel
Galena Park Nederland
Longview
Ferndale
Marcus Hook
Existing
Expansion Projects

24
EAST COAST PROPANE EXPORTSWILL CHANGE THE COMPETITIVE LANDSCAPE
VAWV
PA
NJ
NY
ME
VT
NH
MACT
OHIN
IL
WIMI
MN
MD DE
New Hampton
Rockville
Glenwood
Mankato Hixton
Iowa City Clinton Channahon
Milford
Sarnia
Rapid River
Superior
ONEOKMAPL
NGL Pipelines
Mariner EastMariner WestCentennialTEPPCO
Former Cochin TerminalDepropanizer
Rail Loading (fractionator or processor
Market hubRail Unloading (new or expanding)
Y-grade Pipeline Flow
25
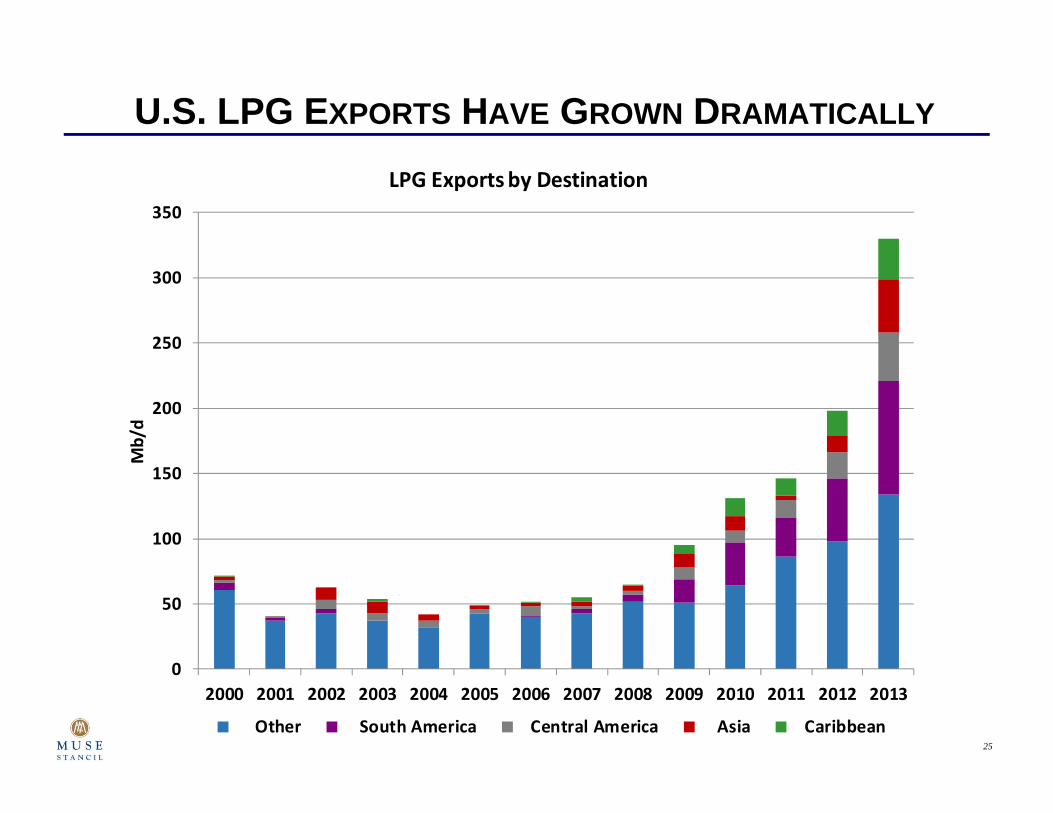
U.S. LPG EXPORTS HAVE GROWN DRAMATICALLY
0
50
100
150
200
250
300
350
2000 2001 2002 2003 2004 2005 2006 2007 2008 2009 2010 2011 2012 2013
Mb/d
LPG Exports by Destination
Other South America Central America Asia Caribbean
26
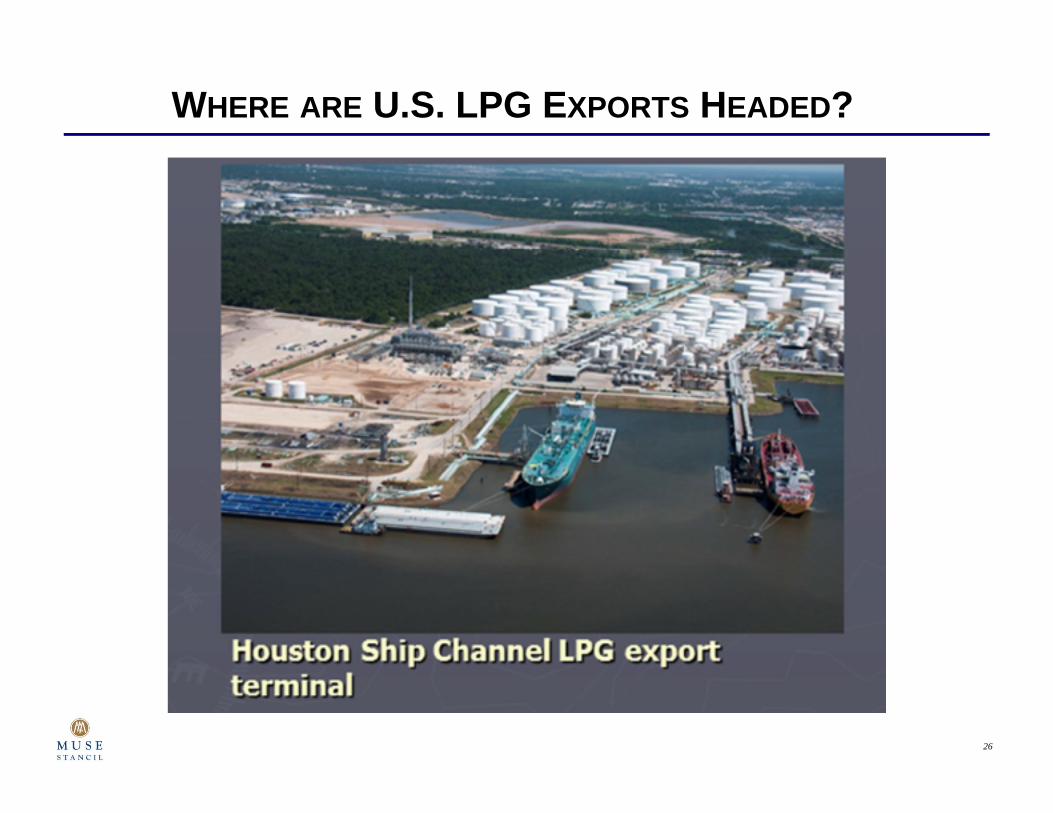
WHERE ARE U.S. LPG EXPORTS HEADED?
27
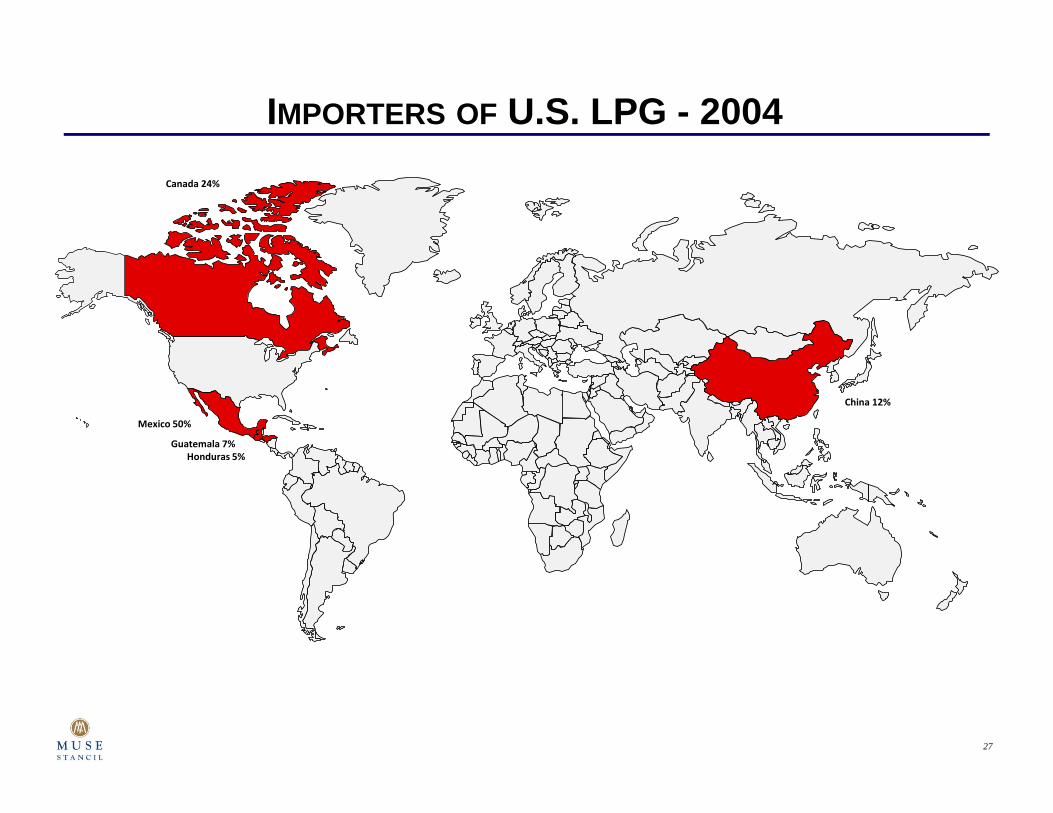
IMPORTERS OF U.S. LPG - 2004
Mexico 50%
Canada 24%
China 12%
Guatemala 7%Honduras 5%

28
IMPORTERS OF U.S. LPG - 2013
Japan 10%
Brazil 13%
Mexico 15%
The Netherlands
14%
Canada 7%
Dominican Republic 6%
Chile 5%
Panama 5%
Ecuador 4%
Venezuela 4%Aruba 2%
China 2%
Guatemala 2%
United Kingdom 2%
Gibraltar 1%Morocco 1%
Portugal 1%
Belgium <1%
Costa Rica 1%
Ghana <1%
Jamaica <1%
Korea <1%Spain <1%Switzerland <1%
Honduras 4%

29
PANAMA CANAL EXPANSION
Source: www.micanaldepanama.com
Third Set of Locks
Pacific Access Channel
Dredging
Improved Water Supply
Source: www.micanaldepanama.com
Percent Complete:– Design & Construction of 3rd Locks, 77%– Pacific Access Channel, 80%– Pacific Entrance Dredging, 100%– Atlantic Entrance Dredging, 100%– Dredging, Gatun Lake & Culebra Cut, 88%– Raising Operating Level Gatun Lake, 93%– Expected In-Service : 1Q 2016
30
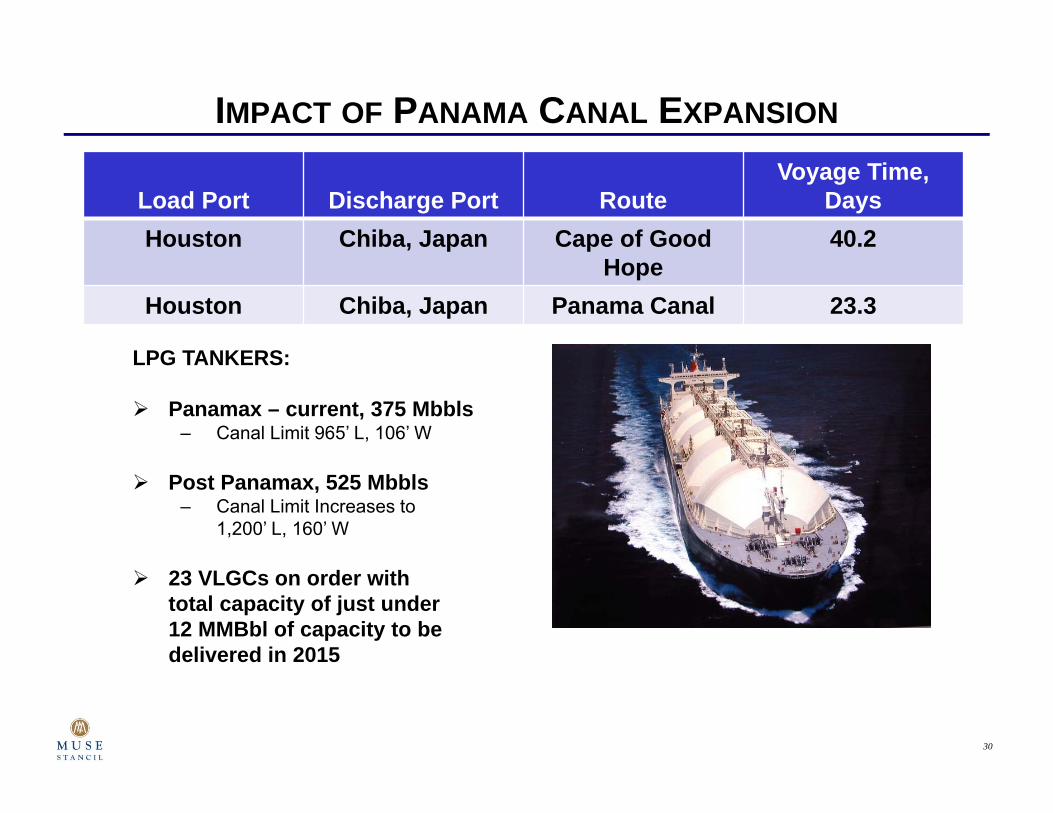
IMPACT OF PANAMA CANAL EXPANSION
Load Port Discharge Port RouteVoyage Time,
DaysHouston Chiba, Japan Cape of Good
Hope40.2
Houston Chiba, Japan Panama Canal 23.3
LPG TANKERS:
Panamax – current, 375 Mbbls– Canal Limit 965’ L, 106’ W
Post Panamax, 525 Mbbls– Canal Limit Increases to
1,200’ L, 160’ W
23 VLGCs on order with total capacity of just under 12 MMBbl of capacity to be delivered in 2015
31
IMPACT OF THE PANAMA CANAL EXPANSION Significant reduction in transportation costs
– Larger ships will be able to transit the locks– Significantly shortens transit time to the Asia Pacific region– Thus, overall transport costs will see a large reduction
Will allow large refrigerated cargos to move to Japan, China, and India– All of these economics continue to grow and are importing more LPG for domestic use
Asia Pacific region continues to require new supply sources
Security of supply is an issue– U.S. is politically more stable that other LPG producing areas of the world
32
CONCLUSIONS U.S. Propane continues to grow dramatically due to increase in shale oil and gas
production
Infrastructure to move additional NGLs is rapidly catching up in the new shale areas
U.S. propane consumption is not increasing as quickly as production, and exports will be needed to balance supply and demand
Timing of these exports are lining up well with the new export terminal projects and expansion of Panama Canal
Economies in Asia are looking for supply security through diversification of sources


