Changes in protein profile detected in seedlings of Caesalpinia peltophoroides (Fabaceae) after exposure to high concentration of cadmium
L.M.C. Gomes1, A.S. Gesteira2, A.-A.F. de Almeida1, A.V. de Castro1,L.O. Dias1, C.P. Pirovani1 and F.P. Gomes1
1Departamento de Ciências Biológicas,Universidade Estadual de Santa Cruz, Ilhéus, BA, Brasil2Centro Nacional de Pesquisa de Mandioca e Fruticultura,Empresa Brasileira de Pesquisa Agropecuária,Cruz das Almas, BA, Brasil
Genet. Mol. Res. 11 (3): 2694-2707 (2012)Received January 27, 2012Accepted May 14, 2012Published June 27, 2012DOI http://dx.doi.org/10.4238/2012.June.27.4
ABSTRACT. Sibipiruna (Caesalpinia peltophoroides Benth) is a tree of the Brazilian Atlantic Forest. It is a flowering ornamental tree wide-ly planted throughout Brazil and indicated for restoration of degraded areas. We examined protein profile changes in leaves of seedlings of C. peltophoroides grown in nutrient solution under greenhouse condi-tions, after exposure to cadmium (Cd; 32 mg/L). A two-dimensional gel was used to analyze proteins expressed in response to stress 24 and 72 h after initiation of treatment with Cd. Various protein bands were identified that were related to stress response and/or metabolic adjust-ments, including proteins involved with resistance to stress, including detoxification, degradation, antioxidant, transport, signal transduc-tion, photosynthesis, electron transport, biosynthesis reactions, and
Effect of cadmium on protein profile of C. peltophoroides 2695
transcription regulation. After 24 h of Cd exposure, the genes of most of these proteins were upregulated. These putative proteins were as-sociated with resistance to stress, including heat shock proteins, heat stress transcriptional factor and other transcriptional factors, aquapo-rins, glutathione transferase and choline monooxygenase. Most of the putative proteins observed after 72 h of exposure to Cd were down-regulated. They were mainly photosynthetic process proteins, such as NAD(P)H-quinone oxidoreductase, photosystem I assembly, and photosystem II CP47 chlorophyll apoprotein. There were also pro-teins involved with degradation, biosynthesis and antioxidant activity, such as ATP-dependent Clp protease, methylthioribose-1-phosphate and glutathione peroxidase 2. Based on preliminary proteomic analy-sis, we conclude that proteins related to photosynthetic activity are inhibited, decreasing plant performance under stress conditions and that several proteins related to defense mechanisms are activated, in-ducing the plant defense response.
Key words: Abiotic stress; Heavy metals; Photosynthesis; Phytotoxicity; Stress resistance; Woody species
INTRODUCTION
Environmental contamination by heavy metals is a worldwide problem and poses a significant threat to ecosystems. Anthropogenic action is the main cause of the increase in this environmental pollution, mainly after the industrial revolution, along with the urban and agri-cultural growth of last decades (Tavares and Carvalho, 1992; Jadia and Fulekar, 2009). These highly toxic pollutants remain in the environment for a long time and may accumulate to toxic levels, resulting in the contamination of aquatic and terrestrial life, affecting mainly plants, animals and humans (Gratão et al., 2005). Among the heavy metals, cadmium (Cd) is the most phytotoxic, even at low concentrations, because of its high water solubility (Das et al., 1997; Pinto et al., 2004; Zacchini et al., 2009). Therefore, it is easily taken up and translocated to different plant parts (Oliveira et al., 2001; Souza et al., 2009). Once accumulated in the plant, Cd promotes several physiological and biochemical changes, such as in photosynthesis and in several enzyme activities, affecting plant growth and development (Sanità di Toppi and Gab-brielli, 1999; Clemens, 2006; Pietrini et al., 2010). Plant adaptation to environmental stresses is based on the signal transduction network, from the perception of stress signals to response from gene expression, resulting in metabolic changes (Saibo et al., 2009; Visioli et al., 2010). Cd can cause a decrease of up to 50% in dry matter production in some species (Almeida et al., 2010; Pietrini et al., 2010).
Plants are sessile organisms and they need to acclimate to changing environmental conditions (Schützendübel and Polle, 2002). Some plant species show variable ability to ac-cumulate Cd in relation to the concentration found in the substrate in which they grow (Vas-silev et al., 2002). Woody species are less effective than herbaceous species in taking up heavy metals, such as Cd. However, trees may be more efficient because they have a larger root surface for the uptake of these metals (Zacchini et al., 2009). Also, they have a high
capacity to allocate metals in the trunk permanently, tempering the bioavailability of metals in the environment (Almeida et al., 2010). Thus, the use of woody species is promising for phytoremediation, as they represent an important way of recovering contaminated areas viably (ecologically and economically).
The objective of this study was to analyze the protein profile of Caesalpinia peltopho-roides (sibipiruna). This is a woody species with great adaptive capacity to adverse conditions such as flooded soils, with low pH and low fertility. This tree of the Brazilian Atlantic Forest is indicated for restoration of degraded areas, especially riparian areas (Lorenzi and Souza, 2001; Mielke et al., 2003). Proteomics is a valuable tool that is becoming increasingly im-portant, complementing the understanding of biochemical and physiological mechanisms in stress response. Recent molecular advances have shown the expression of a wide variety of stress-inducible genes (Kieffer et al., 2009; Amudha and Balasubramani, 2011). Abiotic stress responses are correlated with the synthesis of stress proteins and signaling molecules (Sanità di Toppi and Gabbrielli, 1999). Different transcription factors regulate the expression of these genes (Zhang et al., 2006; Amudha and Balasubramani, 2011). The combination of the inter-esting characteristics of environmental adaptation of C. peltophoroides and proteomic analysis represents an important strategy to identify a variety of protein responses to stress.
MATERIAL AND METHODS
Plant material and growth conditions
The experiments were conducted in a greenhouse at the Universidade Estadual de Santa Cruz (UESC), Ilhéus, Bahia, Brazil (14°47’ S, 39°10’ W), between April and June of 2008. Seedlings of C. peltophoroides were obtained from the Instituto Biofábrica de Cacau, Ilhéus, Bahia, Brazil. Plants were grown in a monitored environment during the experimental period. SLIA-M003 quantum sensors, coupled to a HOBO weather station (Onset Computer, Bourne, Massachusetts, USA), were used to monitor photosynthetically active radiation (PAR), and Hobo H8 ProSeries sensors (Onset Computer) monitored air temperature (Tair) and relative humidity (RH). During the experimental period daily PAR was 4.12 mol·m-2·day-1, average air temperature (Tair) ranged from 19° to 31.5°C (Tmean 24.5°C), and RH ranged from 49.3 to 100% (mean RH 86.2%). The plants were grown for eight weeks in nutrient solution containing half-strength Hoagland’s solution No. 2 (Hoagland and Arnon, 1950) before they were exposed to Cd for 96 h. The experimental setup was designed based on two groups: a control group and a group exposed to a final concentration of 32 mg/L Cd (in the form of CdCl2) in the nutrient solution. Each group was composed of 3 biological replicates, and each replicate contained at 8 plants. After this period of exposure, leaves of each replicate were harvested, snap-frozen in liquid nitrogen and stored at -80°C until protein extraction.
Protein extraction
Leaves of seedlings exposed to Cd were harvested after exposure for 0, 6, 12, 24, 48, 72, and 96 h. Leaf samples were freeze-dried and ground in liquid nitrogen for total pro-tein extraction. Leaf protein extraction was based on the protocol described by Pirovani et al. (2008) with modifications. The plant powder was washed three or four times with 10% TCA in
Effect of cadmium on protein profile of C. peltophoroides 2697
acetone/0.07% 2-mercaptoethanol (2-ME) until the loss of coloration. At every step described above, the pellet was completely resuspended by sonication (4 pulses of 10 s each at 10 s in-tervals on ice, at an output of 70%) using an Ultrasonic processor (GEX 130, 130 W), and then centrifuged at 13,600 g for 10 min at 4°C. Finally, the powder was washed once in 10% TCA in water and 0.07% 2-ME, sonicated (3 pulses of 7 s each at 5 s intervals on ice, at an output of 50%), and then washed once in 80% acetone. The final pellet was dried at room temperature and depending on the following use, the pellets were resuspended in the electrophoresis buffer or in distilled water. A spectrophotometer plate reader (VERSAmax) with the microplate format was used to quantify total protein (480 nm). Three repetitions for each sample were carried out using the 2-D Quanti kit (GE Healthcare), according to manufacturer recommendations.
SDS-PAGE and two-dimensional electrophoresis (2D-PAGE)
For 1-DE analysis (SDS-PAGE), protein samples were denatured at 95○C for 5 min and resolved on SDS-gels (12.5%), at 150 V, in a BioRad mini-Protean II apparatus. For vi-sualization of proteins, gels were placed immediately in colloidal Coomassie G 250 solution (Neuhoff et al., 1988).
For two-dimensional electrophoresis (2-DE), first-dimensional electrophoresis was performed on an Ettan IPGphor system (GE Healthcare). Protein samples were applied in 250 µL 2-DE rehydratation solution by reswelling 13 cm Immobiline DryStrip (pH 4-7, GE Healthcare) for 12 h. Isoelectric focusing (IEF) was performed for 5 h on the same apparatus under the following conditions: step and hold at 500 V for 1 h, gradient 1000 V for 1 h, gradi-ent 8000 V for 2.5 h, and step and hold 8000 V for 55 min. After IEF, the strips were stored at -80○C until second-dimensional analysis.
The second dimension in 12.5% SDS-PAGE was performed using a Ruby SE 600 system (GE Healthcare) with 80 V/200 mA. Before that, the strips were incubated for 15 min in equilibration buffer (7.5 mM Tris-HCl, pH 8.8, 29.3% glycerol, 6 M urea, 2% SDS, 0.002% bromophenol blue, ultrapure H2O) with 1% (w/v) DTT, and for another 15 min in equilibration buffer with 2.5% (w/v) iodoacetamide. The strips were then transferred to a vertical 12.5% SDS-PAGE gel. After electrophoresis, proteins were visualized with 0.1% (w/v) colloidal Coomassie G 250 (Neuhoff et al., 1988).
Image acquisition and data analysis
Gel images were processed using Image Scanner II (GE Healthcare). Image analysis program, the Melanie 7.0 software (GeneBio), was used for finding proteins differentially ex-pressed after Cd exposure for 24 and 72 h. The gels were matched, and spot detection and spot matching were performed. The criteria for defining the expression pattern were as follows: appear, newly detected; disappear, disappeared under the limit of detection; increase, increase in amount; decrease, decrease in amount.
The isoelectric point (pI) and relative molecular mass (Mw) of each protein were calculated using protein molecular weight markers as the reference proteins. The most in-tense spots were analyzed in silico using Expasy TagIdent (http://web.expasy.org/tagident/), a protein identification program based on Mw and pI. TagIdent allows the generation of a list of proteins using pI and Mw against proteins in SWISS-PROT/TrEMBL databases. The
estimated Mw and pI values were obtained for each targeted spot. These values were entered into the ExPASy TagIdent database to obtain a preliminary identification. The error ranges for Mw and pI were set at 20% and 0.5 pH unit, respectively. Taxonomic group and key words (Spermatophyta, Populus, stress) were used to search in the protein database. If no matches were found, a general search for proteins in the approximate pI x Mw range was conducted.
RESULTS AND DISCUSSION
Separation of the soluble leaf proteins from C. peltophoroides was performed for time periods of 6, 12, 24, 48, 72, and 96 h, using 1-DE (Figure 1). Preliminary analysis of proteins revealed multiple bands between 14 and 66.2 kDa, when compared to the control (no Cd). Both the large and small subunits of ribulose-1, 5-bisphosphate carboxylase/oxygenase (Rubisco) were visualized in the gel, approximately 56 kDa and 15 kDA, respectively.
Figure 1. The one-dimensional gel electrophoresis (1-DE) analysis of leaf protein from Caelsalpinia peltophoroides, using varying treatments: control, no Cd (Ct) and treatment with Cd (Tr). The 1-DE was stained with Coomassie G 250 solution. Lane MW = molecular mass marker indicated on the left in kDa; lane Ct6 = control (no Cd) performed for time 6 h after exposure start of experiment; lane Tr6 = treatment (32 mg/L) for time 6 h; lane Ct12 = control 12 h; lane Tr12 = treatment 12 h; lane Ct24 = control 24 h; lane Tr24 = treatment 24 h; lane Ct48 = control 48 h; lane Tr48 = treatment 48 h; lane Ct72 = control 72 h; lane Tr72 = treatment 72 h; lane Ct96 = control 96 h; lane Tr96 = treatment 96 h. Arrows at right of figure indicate both the large and small subunit of Rubisco, respectively; write and black arrows indicate presence or absence of protein bands between 14 and 45 kDa, for time 24 and 72 h after exposure to Cd.
Effect of cadmium on protein profile of C. peltophoroides 2699
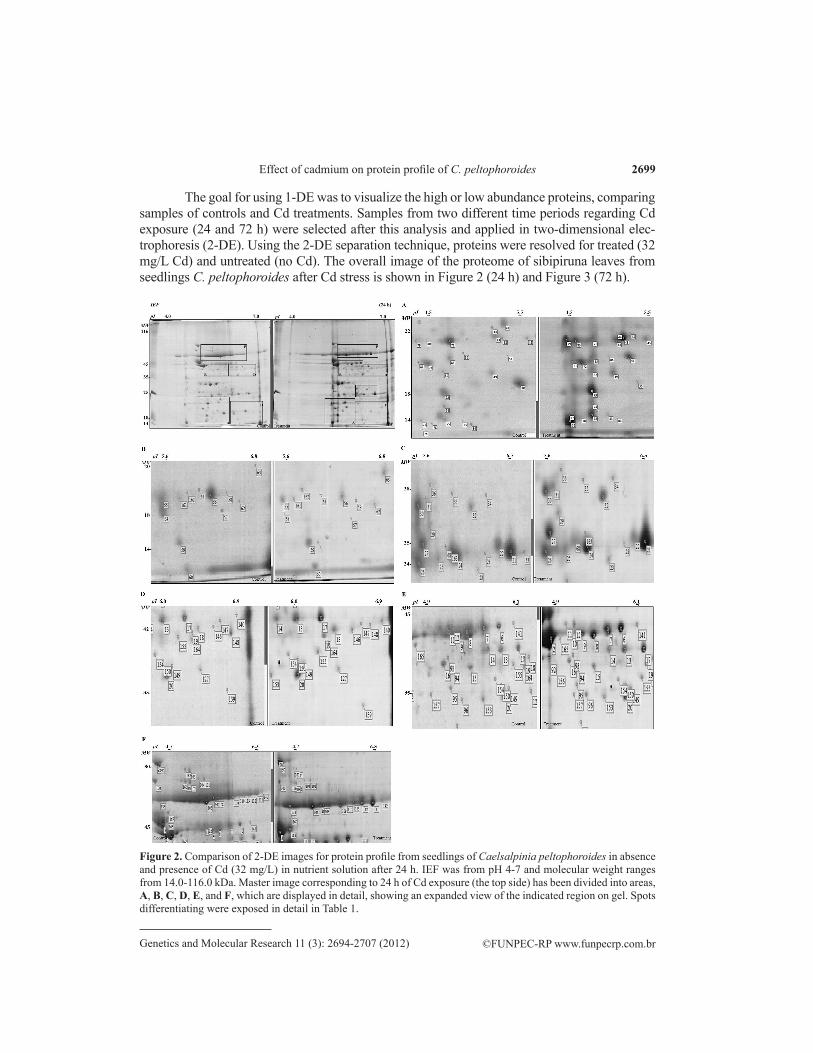
Figure 2. Comparison of 2-DE images for protein profile from seedlings of Caelsalpinia peltophoroides in absence and presence of Cd (32 mg/L) in nutrient solution after 24 h. IEF was from pH 4-7 and molecular weight ranges from 14.0-116.0 kDa. Master image corresponding to 24 h of Cd exposure (the top side) has been divided into areas, A, B, C, D, E, and F, which are displayed in detail, showing an expanded view of the indicated region on gel. Spots differentiating were exposed in detail in Table 1.
The goal for using 1-DE was to visualize the high or low abundance proteins, comparing samples of controls and Cd treatments. Samples from two different time periods regarding Cd exposure (24 and 72 h) were selected after this analysis and applied in two-dimensional elec-trophoresis (2-DE). Using the 2-DE separation technique, proteins were resolved for treated (32 mg/L Cd) and untreated (no Cd). The overall image of the proteome of sibipiruna leaves from seedlings C. peltophoroides after Cd stress is shown in Figure 2 (24 h) and Figure 3 (72 h).
Analysis of the 2-DE gels using the Melanie software, followed by visual confirma-tion, revealed a variable number of spots. Several significant changes in protein expression profiles were observed comparing untreated and Cd-treated samples. A total of 132 differen-tially expressed spots were identified, obtained by cross-checking of the Mw/pI (molecular weight/isoelectric point) values acquired by gels, associated with information contained in the proteomic database (www.ExPASy.org).
Figure 3. Comparison of 2-DE images for protein profile from seedlings of Caelsalpinia peltophoroides in absence and presence of Cd (32 mg/L) in nutrient solution after 72 h. IEF was from pH 4-7 and molecular weight ranges from 14.0-116.0 kDa. Master image corresponding to 72 h of Cd exposure (the top side) has been divided into areas, A, B, C, D, E, F, and G, which are displayed in detail, showing an expanded view of the indicated region on gel. Spots differentiating were exposed in detail in Table 2.
Effect of cadmium on protein profile of C. peltophoroides 2701
Many of the spots matched using TagIdent had potentially hundreds of candidate pro-tein identities matched to a specific pI and Mw range. However, some systematic patterns were used in all analysis, considering, mainly similarity of the Mw and pI, conditions of abiotic stress and related species. Thus, it was possible deduce the categories and possible functions of the differential spots. These significant spots with their pI and Mw are summarized in Table 1 and Table 2. The result of TagIdent searching showed differential proteins related to stress response and/or metabolic adjustments. Ten deduced categories of significant spots were ob-tained: i) resistance to stress; ii) detoxification; iii) degradation; iv) antioxidant; v) transport; vi) signal transduction; vii) photosynthesis; viii) electron transport; ix) biosynthetic reactions, and x) transcription regulation (UniProtKB/Swiss-Prot and UniProtKB/TrEMBL databases).
In 2-DE gel analysis of seedlings treated with Cd for 24 h, 61 spots were selected (Figure 2). The expression of 44 spots increased or appeared (newly detected). All biologi-cal categories deduced for these spots were related to stress resistance in plants. As shown in Table 1, almost half of these proteins are heat shock proteins (HSP) or heat stress transcrip-tional factors (HSF). Increased transcription of a set of genes in response to abiotic stress such as heat or toxic agents is a highly conserved biological response (Waters et al., 1996). This response is mediated by HSF, which can bind to promoters of heat shock genes. In Table 1, different spots are related to HSFs (11 spots) and HSP (9 spots). In addition to the identifica-tion of HSPs and HSFs, identification of aquaporins corroborates the findings of (Kamal et al., 2010). Dehydration stress is Cd-induced due to biochemical impediments and effects on the function of aquaporins (transport pore), which play a vital role in the transport of molecules in plants (Kaldenhoff and Fischer, 2006; Visioli et al., 2010). Cd induces oxidative stress and activates a complex antioxidant defense system (Amudha and Balasubramani, 2011). An in-crease in antioxidant proteins was observed in these samples.
Among the 61 spots, only 17 spots decreased or disappeared (under the limit of de-tection), all related to different biological processes, mainly photosynthetic activity but also electron transport, protein degradation, biosynthetic processes or cell division (Table 1). Cad-mium can interfere with numerous biochemical and physiological processes, including photo-synthesis, respiration and protein metabolism (Zhang et al., 2010). Negative effects on protein activity, such as the photosystem I assembly protein ycf3 (spots 50 and 55), photosystem Q(B) protein (spot 16), NAD(P)H-quinone oxidoreductase subunit 3, chloroplastic (spots 22, 56, 57, 75, and 163), and cytochrome b6-f complex subunit 4 (spot 54), compromised the per-formance of photosynthetic activity. Reduction in net photosynthetic rate is one of the factors that cause a decrease in growth and productivity in plants (MacFarlane and Burchett, 2001; Almeida et al., 2007; Zhang et al., 2010). There may be changes in the growth of shoots and roots and in chlorophyll biosynthesis, lower rates of transpiration, photosynthesis and stoma-tal conductance, induction of premature senescence of leaves, and leaf chlorosis (Clemens, 2006). After 72 h of exposure to Cd, 71 significant spots differentially expressed were selected in 2-DE gel analysis (Figure 3). Only 19 spots increased or appeared, all associated with biological processes of stress resistance and oxidative stress, as shown in Table 2. Thirteen of these spots are related to HSP and HSF, according TagIdent database. This shows that Cd con-tinues to stimulate the expression of these genes. It is known that a high concentration of Cd in plant cells induces the accumulation of reactive oxygen species (ROS). Cd2+ ions bind to sulf-hydryl groups of proteins and replace divalent cations such as Zn2+ and Fe2+ in redox-reactive enzymes, which may cause release of these potentially harmful molecules (Yamaguchi et al.,
Effect of cadmium on protein profile of C. peltophoroides 2703
Spot Gel MWb pIb TagIdent Protein namec Pattern Biological processd
Noa areaa (kDa) IDc
1 E 42 5.1 Q49KU3 NAD(P)H-quinone oxidoreductase Decrease Photosynthesis, electron transport subunit 1, chloroplastic*2 A 13 4.4 Q14FF2 NAD(P)H-quinone oxidoreductase Decrease Photosynthesis, electron transport subunit 3, chloroplastic*4 A 16 5.1 P85801 Thioredoxin H-type* Decrease Electron carrier activity and oxidoreductase activity5 A 21 4.3 A0A388 NAD(P)H-quinone oxidoreductase Decrease Transport subunit 6, chloroplastic*7 G 29 5.2 A4GYP6 ATP synthase subunit a, chloroplastic* Decrease Ion transport, regulated photosynthesis8 G 29 5.4 A4GYS3 Chloroplast envelope membrane protein* Decrease Hydrogen ion transport, photosynthesis10 G 29 5.0 Q338B0-2 Isoform 2 of heat stress transcription Increase Stress response and transcription regulation factor A-2c OS11 G 28 5.0 Q14FG9 ATP synthase subunit a, chloroplastic* Decrease Ion transport, regulated photosynthesis12 G 23 5.3 Q09MF2 ATP-dependent Clp protease Decrease Proteaolytic enzyme proteolytic subunit*13 G 24 5.5 O65084 Proteasome subunit beta type-3* Decrease Proteaolytic enzyme14 A 21 5.5 A4GYR1 Photosystem I assembly protein ycf3* Decrease Photosynthesis15 A 20 5.5 P30236 22.0-kDa class IV heat shock protein Increase Stress response, signal16 A 19 5.4 Q14FF6 Photosystem I assembly protein ycf3* Decrease Photosynthesis18 A 13 5.1 A9P8G6 Thioredoxin* Decrease Electron carrier activity and oxidoreductase activity20 B 18 5.6 O04922 Probable glutathione peroxidase 2 Increase Stress response, oxireductase, peroxidase21 B 18 6.3 P29830 17.6-kDa class II heat shock protein Increase Stress response, signal24 B 18 5.9 P04794 17.5-kDa class I heat shock protein Increase Stress response, signal26 B 18 6.6 Q05832 18.3-kDa class I heat shock protein Increase Stress response, signal
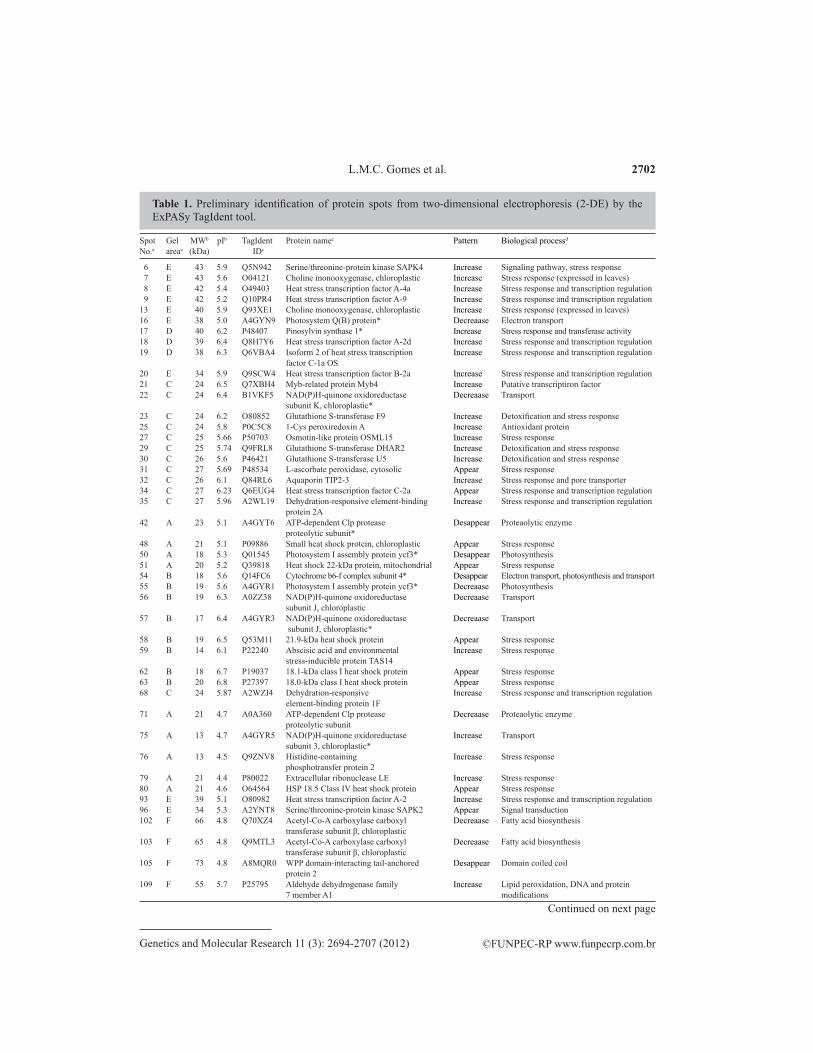
Table 2. Preliminary identification of protein spots from two-dimensional electrophoresis (2-DE) by the ExPASy TagIdent tool.
111 F 56 6.3 P35480 Chaperonin CPN60, mitochondrial Increase Stress response112 F 56 6.1 Q94BZ5 Heat stress transcription factor A-5 Increase Stress response and transcription regulation113 F 56 5.9 O82289 Probable inactive poly [ADP-ribose] Increase Stress response polymerase SRO1139 D 31 7.8 P30302 Aquaporin PIP2-3 Appear Stress response and pore transporter140 D 40 6.9 Q657C0 Heat stress transcription factor A-6a Appear Stress response and transcription regulation141 E 44 6.1 P48408 Pinosylvin synthase 2* Increase Stress response and transferase activity146 D 39 6.6 Q7XHZ0 Heat stress transcription factor B-4b Appear Stress response and transcription regulation148 D 38 6.9 A9PFT0 ATP-dependent Clp protease Desappear Proteaolytic enzyme proteolytic subunit*149 D 35 6.2 A0MES8 Ethylene-responsive transcription Appear Transcription regulation, plant defense, factor ABI4 signaling155 D 36 6.2 Q6VBA4 Heat stress transcription factor C-1a Increase Stress response and transcription regulation161 B 19 5.7 P30236 22.0-kDa class IV heat shock protein Appear Stress response162 B 19 5.8 B7EZJ7 23.6-kDa heat shock protein, mitochondrial. Appear Stress response163 C 24 5.9 A0A389 NAD(P)H-quinone oxidoreductase subunit I, Desappear Oxidorredutase chloroplastic*164 D 37 6.3 B9HCR2 Methylthioribose-1-phosphate isomerase* Desappear Amino-acid biosynthesis165 E 41 4.8 A8Y909 D3-type cyclin* Desappear Cell cycle regulator168 F 46 4.7 P41152 Heat shock factor protein HSF30 Increase Stress response and transferase activity
Spot Gel MWb pIb TagIdent Protein namec Pattern Biological processd
No.a areaa (kDa) IDc
Table 1. Continued.
aAs given in Figure 2 (Melanie 7.0 software analysis); bvalues estimated from the 2-DE gel (Melanie 7.0 software analysis); caccession Nos. and possible function of the spots in downloaded UniProtKB/Swiss-Prot (Expasy); ddeduce caategories based of ExPaSy TagIdent database. Differentially expressed protein spots between control [no cadimium (Cd)] and seedling of Caelsalpinia peltophoroides after exposure to Cd in nutrient solution for 24 h are shown. The spot numbers can be tracked to their location on the image in Figure 2. The table shows TagIdent IDs and protein names based on molecular weight (MW) and isoelectric point (pI). Deduced proteins related with woody species are preceded by asterisks.
Effect of cadmium on protein profile of C. peltophoroides 2705
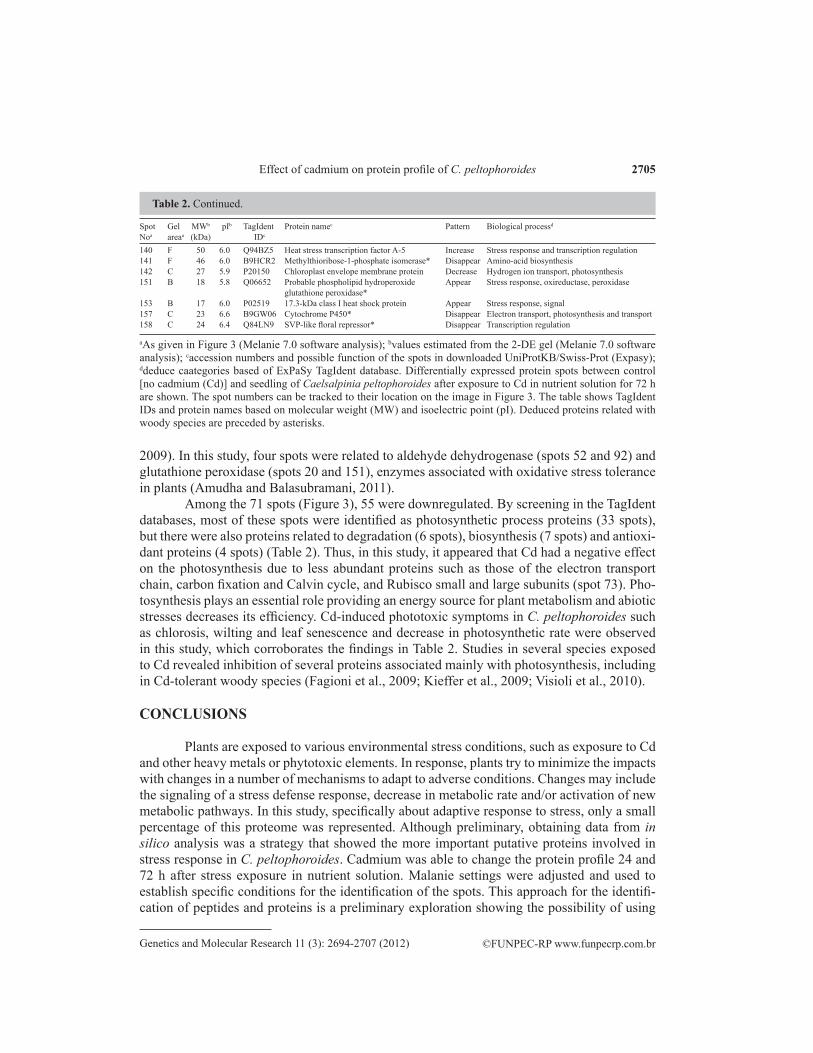
2009). In this study, four spots were related to aldehyde dehydrogenase (spots 52 and 92) and glutathione peroxidase (spots 20 and 151), enzymes associated with oxidative stress tolerance in plants (Amudha and Balasubramani, 2011).
Among the 71 spots (Figure 3), 55 were downregulated. By screening in the TagIdent databases, most of these spots were identified as photosynthetic process proteins (33 spots), but there were also proteins related to degradation (6 spots), biosynthesis (7 spots) and antioxi-dant proteins (4 spots) (Table 2). Thus, in this study, it appeared that Cd had a negative effect on the photosynthesis due to less abundant proteins such as those of the electron transport chain, carbon fixation and Calvin cycle, and Rubisco small and large subunits (spot 73). Pho-tosynthesis plays an essential role providing an energy source for plant metabolism and abiotic stresses decreases its efficiency. Cd-induced phototoxic symptoms in C. peltophoroides such as chlorosis, wilting and leaf senescence and decrease in photosynthetic rate were observed in this study, which corroborates the findings in Table 2. Studies in several species exposed to Cd revealed inhibition of several proteins associated mainly with photosynthesis, including in Cd-tolerant woody species (Fagioni et al., 2009; Kieffer et al., 2009; Visioli et al., 2010).
CONCLUSIONS
Plants are exposed to various environmental stress conditions, such as exposure to Cd and other heavy metals or phytotoxic elements. In response, plants try to minimize the impacts with changes in a number of mechanisms to adapt to adverse conditions. Changes may include the signaling of a stress defense response, decrease in metabolic rate and/or activation of new metabolic pathways. In this study, specifically about adaptive response to stress, only a small percentage of this proteome was represented. Although preliminary, obtaining data from in silico analysis was a strategy that showed the more important putative proteins involved in stress response in C. peltophoroides. Cadmium was able to change the protein profile 24 and 72 h after stress exposure in nutrient solution. Malanie settings were adjusted and used to establish specific conditions for the identification of the spots. This approach for the identifi-cation of peptides and proteins is a preliminary exploration showing the possibility of using
Table 2. Continued.
Spot Gel MWb pIb TagIdent Protein namec Pattern Biological processd
Noa areaa (kDa) IDc
140 F 50 6.0 Q94BZ5 Heat stress transcription factor A-5 Increase Stress response and transcription regulation141 F 46 6.0 B9HCR2 Methylthioribose-1-phosphate isomerase* Disappear Amino-acid biosynthesis142 C 27 5.9 P20150 Chloroplast envelope membrane protein Decrease Hydrogen ion transport, photosynthesis151 B 18 5.8 Q06652 Probable phospholipid hydroperoxide Appear Stress response, oxireductase, peroxidase glutathione peroxidase*153 B 17 6.0 P02519 17.3-kDa class I heat shock protein Appear Stress response, signal157 C 23 6.6 B9GW06 Cytochrome P450* Disappear Electron transport, photosynthesis and transport158 C 24 6.4 Q84LN9 SVP-like floral repressor* Disappear Transcription regulation
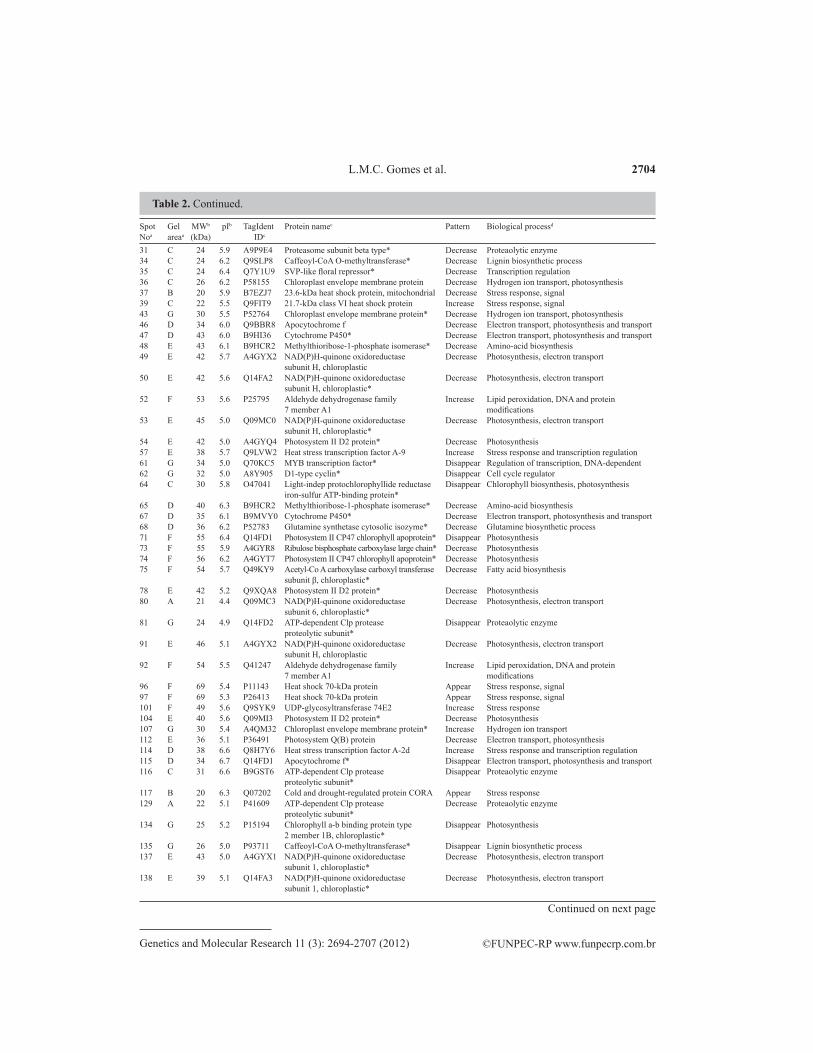
aAs given in Figure 3 (Melanie 7.0 software analysis); bvalues estimated from the 2-DE gel (Melanie 7.0 software analysis); caccession numbers and possible function of the spots in downloaded UniProtKB/Swiss-Prot (Expasy); ddeduce caategories based of ExPaSy TagIdent database. Differentially expressed protein spots between control [no cadmium (Cd)] and seedling of Caelsalpinia peltophoroides after exposure to Cd in nutrient solution for 72 h are shown. The spot numbers can be tracked to their location on the image in Figure 3. The table shows TagIdent IDs and protein names based on molecular weight (MW) and isoelectric point (pI). Deduced proteins related with woody species are preceded by asterisks.
2-DE gel image to predict proteins. The analysis of putative proteins showed the suppression of several proteins associated with photosynthetic activity, decreasing the plant’s performance under stress conditions. However, there was an increase in proteins related to defense mecha-nisms for this species (HSP, HSF, aquaporins, and peroxidases). In tolerant plants submitted to stress, the expression of these genes is common. Further studies may help determine and characterize the genes expressed during exposure of C. peltophoroides to Cd. Comparing the protein profile in the absence and presence of heavy metals and understanding the changes in woody plants can facilitate decision-making and the deployment of species in multiple areas of phytoremediation in the future.
ACKNOWLEDGMENTS
Research supported by the Universidade Estadual de Santa Cruz (UESC) and seed-lings provided by the Instituto Biofábrica de Cacau (IBC). L.M.C. Gomes was supported by Fundação de Amparo à Pesquisa do Estado da Bahia (FAPESB) and Coordenação de Aperfei-çoamento de Pessoal de Nível Superior (CAPES). A-A.F. de Almeida, A.S. Gesteira, and F.P. Gomes thank CNPq for research fellowships (Scientific Productivity).
REFERENCES
Almeida A-AF, Valle RR, Mielke MS and Gomes FP (2007). Tolerance and prospection of phytoremediator woody species of Cd, Pb, Cu and Cr. Braz. J. Plant Physiol. 19: 83-98.
Almeida A-AF, Mielke MS, Gomes FP and Gomes LMC (2010). Handbook of Phytoremediation. In: Phytoremediation of Cd, Pb and Cr by Woody Plants (Golubev IA, ed.). Nova Science Publishers, Environmental Science, Engineering and Technology, New York, 529-550.
Amudha J and Balasubramani G (2011). Recent molecular advances to combat abiotic stress tolerance in crop plants. Biotechnol. Mol. Biol. Rev. 6: 31-58.
Clemens S (2006). Toxic metal accumulation, responses to exposure and mechanisms of tolerance in plants. Biochimie 88: 1707-1719.
Das P, Samantaray S and Rout GR (1997). Studies on cadmium toxicity in plants: a review. Environ. Pollut. 98: 29-36.Fagioni M, D’Amici GM, Timperio AM and Zolla L (2009). Proteomic analysis of multiprotein complexes in the thylakoid
membrane upon cadmium treatment. J. Proteome Res. 8: 310-326.Gratão PL, Prasad MNV, Cardoso PF, Lea PJ, et al. (2005). Phytoremediation: green technology for the clean up of toxic
metals in the environment. Braz. J. Plant Physiol. 17: 53-64.Hoagland DR and Arnon DI (1950). The Water-Culture Method for Growing Plants Without Soil. The California
Agricultural Experiment Station, Riverside.Jadia CD and Fulekar MH (2009). Phytoremediation of heavy metals: recent techniques. Afr. J. Biotechnol. 8: 921-928.Kaldenhoff R and Fischer M (2006). Functional aquaporin diversity in plants. Biochim. Biophys. Acta 1758: 1134-1141.Kamal AHM, Kim K-H, Shin K-H, Choi J-S, et al. (2010). Abiotic stress responsive proteins of wheat grain determined
using proteomics technique. Aust. J. Crop Sci. 4: 196-208.Kieffer P, Schroder P, Dommes J, Hoffmann L, et al. (2009). Proteomic and enzymatic response of poplar to cadmium
stress. J. Proteomics 72: 379-396.Lorenzi H and Souza HM (2001). Plantas Ornamentais no Brasil: Arbustivas, Herbáceas e Trepadeiras. 3ª ed. Editora
Plantarum, Nova Odessa.MacFarlane GR and Burchett MD (2001). Photosynthetic pigments and peroxidase activity as indicators of heavy metal
stress in the Grey mangrove, Avicennia marina (Forsk.) Vierh. Mar. Pollut. Bull. 42: 233-240.Mielke MS, de Almeida A-AF, Gomes FP, Aguilar MAG (2003). Leaf gas exchange, chlorophyll fluorescence and growth
responses of Genipa americana seedlings to soil flooding. Environ. Exp. Bot. 50: 221-231.Neuhoff V, Arold N, Taube D and Ehrhardt W (1988). Improved staining of proteins in polyacrylamide gels including
isoelectric focusing gels with clear background at nanogram sensitivity using Coomassie Brilliant Blue G-250 and R-250. Electrophoresis 9: 255-262.
Effect of cadmium on protein profile of C. peltophoroides 2707
Oliveira JA, Cambraia J, Cano MAO and Jordão CP (2001). Absorção e acúmulo de cádmio e seus efeitos sobre o crescimento relativo de plantas de aguapé e de salvínia. Rev. Bras. Fisiol. Veg. 13: 329-341.
Pietrini F, Zacchini M, Iori V, Pietrosanti L, et al. (2010). Spatial distribution of cadmium in leaves and its impact on photosynthesis: examples of different strategies in willow and poplar clones. Plant Biol. 12: 355-363.
Pinto AP, Mota AM, de Varennes A and Pinto FC (2004). Influence of organic matter on the uptake of cadmium, zinc, copper and iron by sorghum plants. Sci. Total Environ. 326: 239-247.
Pirovani CP, Carvalho HA, Machado RC, Gomes DS, et al. (2008). Protein extraction for proteome analysis from cacao leaves and meristems, organs infected by Moniliophthora perniciosa, the causal agent of the witches’ broom disease. Electrophoresis 29: 2391-2401.
Saibo NJ, Lourenco T and Oliveira MM (2009). Transcription factors and regulation of photosynthetic and related metabolism under environmental stresses. Ann. Bot. 103: 609-623.
Sanità di Toppi L and Gabbrielli R (1999). Response to cadmium in higher plants. Environ. Exp. Bot. 41: 105-130.Schützendübel A and Polle A (2002). Plant responses to abiotic stresses: heavy metal-induced oxidative stress and
protection by mycorrhization. J. Exp. Bot. 53: 1351-1365.Souza VL, Silva DC, Santana KB, Mielke MS, et al. (2009). Efeitos do cádmio na anatomia e na fotossíntese de duas
macrófitas aquáticas. Acta Bot. Bras. 23: 343-354.Tavares TM and Carvalho FM (1992). Avaliação de exposição de populações humanas a metais pesados no ambiente:
exemplos do reconcavo baiano. Química Nova 15: 147-154.Vassilev A, Vangronsveld J and Yordanov I (2002). Cadmium phytoextraction: present state, biological backgrounds and
research needs. Bulgarian J. Plant Physiol. 28: 68-95.Visioli G, Marmiroli M and Marmiroli N (2010). Two-dimensional liquid chromatography technique coupled with mass
spectrometry analysis to compare the proteomic response to cadmium stress in plants. J. Biomed. Biotechnol. 2010: 1-11.Waters ER, Lee GJ and Vierling E (1996). Evolution, structure and function of the small heat shock proteins in plants. J.
Exp. Bot. 47: 325-338.Yamaguchi S, Miura C, Kikuchi K, Celino FT, et al. (2009). Zinc is an essential trace element for spermatogenesis. Proc.
Nat. Acad. Sci. U. S. A. 106: 10859-10864.Zacchini M, Pietrini F, Mugnozza GS, Iori V, et al. (2009). Metal tolerance, accumulation and translocation in poplar and
willow clones treated with cadmium in hydroponics. Water Air Soil Pollut. 197: 23-34.Zhang R-Q, Tang C-F, Wen S-Z, Liu Y-G, et al. (2006). Advances in research on genetically engineered plants for metal
resistance. J. Integr. Plant Biol. 48: 1257-1265.Zhang X, Li C and Nan Z (2010). Effects of cadmium stress on growth and anti-oxidative systems in Achnatherum
inebrians symbiotic with Neotyphodium gansuense. J. Hazard. Mater. 175: 703-709.