42
Changes in Securities Trading Since 2000 James J. Angel, Ph.D., CFA Georgetown University

Changes in Securities Trading Since 2000
James J. Angel, Ph.D., CFA Georgetown University

About me At Georgetown since 1991
Former Visiting Academic Fellow NASD 1999-2000
Former Chair, Nasdaq Economic Advisory Board
Visiting Economist Shanghai Stock Exchange 2004
Member, Board of Directors of Direct Edge Stock Exchange since 2010 All comments are mine and not necessarily those of Direct Edge.
Warned US SEC 5 times in writing prior to the Flash Crash that US markets were vulnerable to such events.
Work experience PGandE, BARRA (later part of Morgan Stanley)
Education B.S. Caltech, MBA Harvard, Ph.D. Berkeley
Summary Economics of markets Equity exchanges solve the “prisoners dilemma” of trading Derivative markets guarantee settlement The Network IS the market!
Technology and regulation drive changes Network economics collapses when networks combine Toward a competitive market structure or regulated utility?
US & Europe Open architecture market networks Rise of dark pools
Rise of HFT
Consolidation of exchanges Scale economies in exchange IT
Markets are better, but different Need to understand differences and vulnerabilities

Exchange economics

Why do we have stock exchanges at all? Most goods and services trade quite nicely without a formal
regulated institution. We don’t send orders to The Paperclip Exchange.
Even most financial products trade without an exchange. FX, Debt, OTC derivatives
So why bother with an exchange?
Answer: Information! Information about trading interest is more valuable in equities.
“Prisoner’s dilemma”: Everyone wants to know what everyone else is doing. No one wants to give up their own information.
Everyone better off with some information sharing.
Exchanges force this sharing. Derivative exchanges guarantee settlement.

Network Economics The utility of some products increases when more people use
them.
Telephones, fax machines, computer operating systems
When two incompatible networks compete
The bigger network wins!
Technology format wars
Winner takes all.

Traditional view Exchanges were natural monopolies
Needed to be regulated like old fashioned electric utilities
Non-profit ownership by members also takes care of this.
Role of regulator was to tame the monopoly to achieve competitive results
Just as in telecom, the role of the regulator is to force interconnection between networks that do not want to cooperate.
US: Regulation NMS
Europe: MiFID

Technology changes Better computers
Better communication
New trading systems for exchanges
New ways to trade
New products
New trading technology for traders
New corporate forms of organization
Different regulatory philosophies
Globalization, deregulation, and reregulation

Algorithmic trading has reduced information content Order flow not as informative as it once was.
Many algo traders prefer to split orders across competing limit order books.
No longer a “gravitational pull” that brings everything to one book
Indeed, there is an “electric repulsion” that will drive a permanent fragmentation.
Less dominance for any one node in the network.
OPPORTUNITY FOR ENTRANTS!

Demutualization Transformation from member owned non-profits to
shareholder driven listed companies.
More flexible and efficient exchanges
BUT:
Regulators promote competition to prevent monopolistic abuses.

Government is now the solver of the Prisoner’s Dilemma Rules set by governments for entire network, not by trading
platform companies.
Self regulation is fading away.

Results: Competitive landscape Faster, cheaper markets
.
Merger incentives
Platforms are scalable
Big savings in IT from rationalization of global exchange industry.

Bad news for existing exchanges Easy entry has turned equity trading into a cutthroat commodity
business NYSE Market Share (Feb 2012):
NYSE 20.7% NYSE-ARCA 9.3 NASDAQ 16.7 BATS 9.4 DIRECTEDGE 9.2 Dealers and Darks 34.7
NASDAQ Market Share NASDAQ 29.5% NYSE-ARCA 11.4 BATS 11.7 DIRECTEDGE 10.4 Dealers and Darks 37.0
Source: Barclays

Source: Chi-X
Shifting liquidity from the market of listing in Europe as well
Royal Dutch Shell A, 18th May 2010
Chi-X42.4%
NASDAQ OMX2.9%
Turquoise6.4%
BATS12.1%
LSE36.3%
Royal Dutch Shell B, 6th May 2010
Chi-X46.7%
NASDAQ OMX3.5%Turquoise
6.8%
BATS8.9%
LSE33.2%
NYSE ARCA1.0%
Figures for entire day up to 4.30 pm (closing auction not included)
G4S, 12th May 2010
Chi-X43.1%
NYSE ARCA0.9%
NASDAQ OMX1.3%
Turquoise4.0%
BATS11.0%
LSE39.6%

Lower barriers to entry in equities
There will always be room for another platform at the margin, keeping prices perpetually low.
To enter, need:
Faster trading platform
Cheap prices
Good relations/connections with liquidity providers on Day One.
Sustainable competitive advantage
Low cost producer
Technical leader
Niche players

Self cannibalization Exchanges launch new platforms
Different trading rules
Nasdaq relaunched PHLX with size as a secondary priority rule
NYSE and Nasdaq each have three stock exchanges
BATS and DE both have two exchanges
Different pricing models appeal to different market segments
Maker taker pricing versus taker maker pricing

Exchange pricing Rise of “maker taker” pricing
Exchanges pay rebates to limit orders that provide liquidity
Charge full fees to market orders that take liquidity
Provides incentives to post liquidity
Rise of “taker maker” pricing
Pay rebates to market orders that take liquidity
Charge full fees to limit orders that post liquidity
Attractive to traders who want to be first in line for execution.

“Dark” pools fill a need Traders still face traditional problem: Need to reveal some information to find counterparty.
But revealing too much information will result in poor execution.
Trading decisions Size: How much of a large order should be executed at a time?
Aggressiveness How aggressive should the trader be?
Display How much of the trading desire (if any) should be displayed, and to whom?
Displaying only to serious traders reduces information leakage and may result in better execution.
THESE ARE NOT SOLVED PROBLEMS
No “one size fits all” market structure solution.

Dark pool flavors Block trading systems
ITG Posit
Liquidnet
Pipeline
Broker internalization engines
Permits large orders to execute against broker flow
Mostly a way around exchange fee structures
Great if flow uninformed.
Bad if not
Smart traders will sense the lurking order and front run it.
The Rise of High Frequency Trading (HFT)

Computerized trading Most HFT trading follows traditional strategies
Market making
Provides liquidity and lowers trading costs
Arbitrage
Keeps prices in proper alignment
News reaction
Incorporates information in price
Pattern recognition
Try to figure out where market is going
Manipulation
Trigger other people to trade at a loss.
Bluffing, spoofing, order ignition.

The need for speed These strategies are not new.
There has always been a race for speed.
In a race, the second place finisher loses Even if only by a nano-second.
Result: race for speed. Co-location in data centers to avoid signal delays
This is not new!
Traders have traditionally paid up for closer access to trading. Exchange memberships
Offices close to exchange
Even if colo were banned, traders would pay up to place servers next to exchange data center.

Changes in US market quality

US Executions Are Faster
0.0
5.0
10.0
15.0
20.0
25.0
30.0
Sep-
01
Jan-
02
May
-02
Sep-
02
Jan-
03
May
-03
Sep-
03
Jan-
04
May
-04
Sep-
04
Jan-
05
May
-05
Sep-
05
Jan-
06
May
-06
Sep-
06
Jan-
07
May
-07
Sep-
07
Jan-
08
May
-08
Sep-
08
Jan-
09
May
-09
Sep-
09
Market Order Execution Speed
NYSE-listed Nasdaq-listed

Volumes Increased
0
2,000
4,000
6,000
8,000
10,000
12,000
14,000
Jan-03 Jan-04 Jan-05 Jan-06 Jan-07 Jan-08 Jan-09
Daily U.S. Equity Share Volume
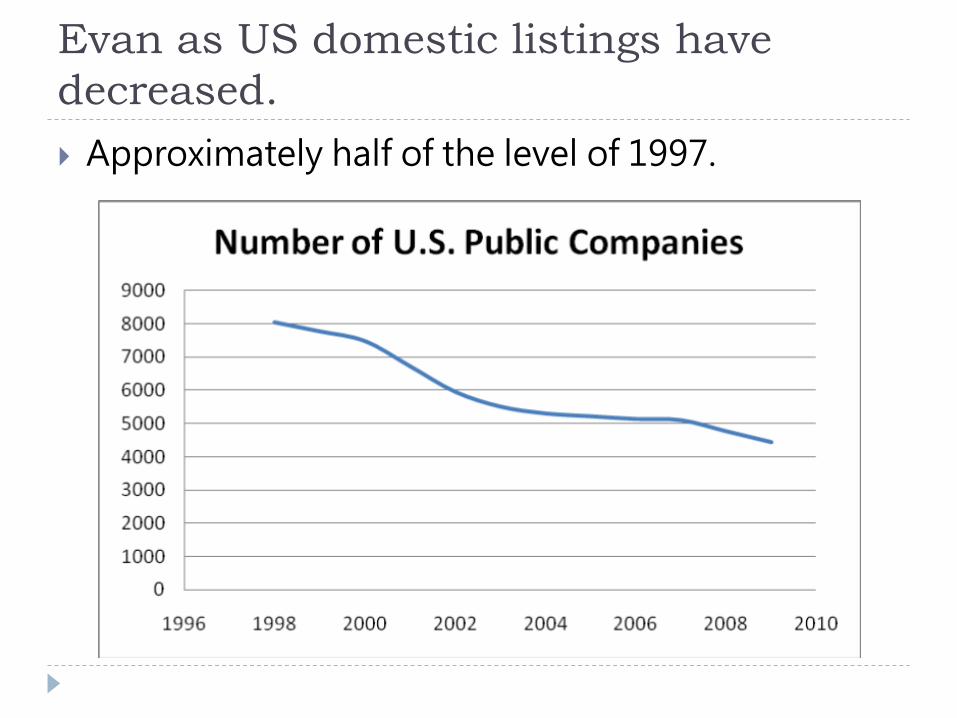
Evan as US domestic listings have decreased. Approximately half of the level of 1997.

Spreads Decreased
-
0.0050
0.0100
0.0150
0.0200
0.0250
0.0300
5/1/
2003
8/1/
2003
11/1
/200
3
2/1/
2004
5/1/
2004
8/1/
2004
11/1
/200
4
2/1/
2005
5/1/
2005
8/1/
2005
11/1
/200
5
2/1/
2006
5/1/
2006
8/1/
2006
11/1
/200
6
2/1/
2007
5/1/
2007
8/1/
2007
11/1
/200
7
2/1/
2008
5/1/
2008
8/1/
2008
11/1
/200
8
2/1/
2009
5/1/
2009
8/1/
2009
11/1
/200
9
$
Median S&P 500 Bid-Ask Spreads

Quotation Sizes Increased
-
10,000
20,000
30,000
40,000
50,000
60,000
70,000
11/1
/200
3
2/1/
2004
5/1/
2004
8/1/
2004
11/1
/200
4
2/1/
2005
5/1/
2005
8/1/
2005
11/1
/200
5
2/1/
2006
5/1/
2006
8/1/
2006
11/1
/200
6
2/1/
2007
5/1/
2007
8/1/
2007
11/1
/200
7
2/1/
2008
5/1/
2008
8/1/
2008
11/1
/200
8
2/1/
2009
5/1/
2009
8/1/
2009
11/1
/200
9
Ave
rag
e D
epth
(Bid
+ O
ffer
)
Average Displayed Depth at NBBO
S&P 500 NBBO
Russell 2000 NBBO
All Stocks NBBO

29
Listings are competitive NYSE vs Nasdaq The Official Switch Scoreboard – A Changing Tide Issuer Advisory Group LLC
0
10
20
30
40
50
60
70
1998
1999
2000
2001
2002
2003
2004
2005
2006
2007
2008
2009
2010
2011
01020
3040
5060
7080
90
1998
1999
2000
2001
2002
2003
2004
2005
2006
2007
2008
2009
2010
2011
Number of Companies
Market Cap of Companies ($ in Billions)
NYSE in Blue / Nasdaq in Red IAG Note: To ensure comparability between periods, only companies with greater than $100 million in market cap have been included (eliminates AMEX confusion). Totals also include only the domestic market cap of Vodafone (global mc = $132B).

But there are complaints … Buy side complains Trading more complicated Losing control of executions
Don’t know where order is executed Harder to control information leakage
Phantom liquidity Excessive(?) cancellations
“Predatory” algos Increase market impact
Sell side complains Costly to connect to multiple destinations
Retail suspects new world order is stacked against them Is co-location unfair?
30
Crashes Happen
31
32
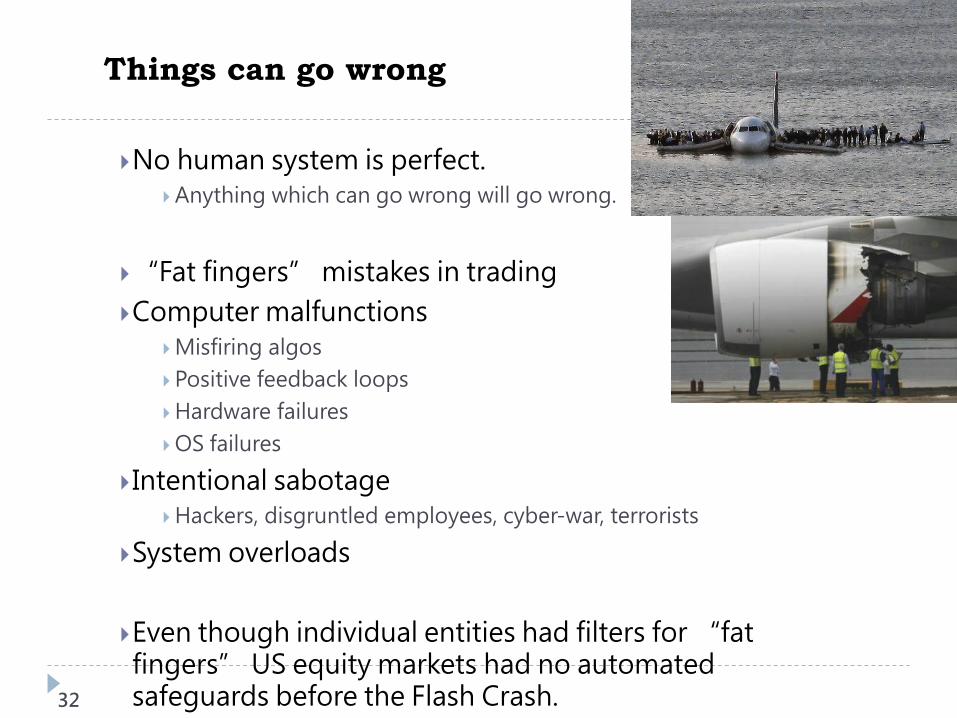
Things can go wrong
No human system is perfect. Anything which can go wrong will go wrong.
“Fat fingers” mistakes in trading Computer malfunctions
Misfiring algos Positive feedback loops Hardware failures OS failures
Intentional sabotage Hackers, disgruntled employees, cyber-war, terrorists
System overloads Even though individual entities had filters for “fat fingers” US equity markets had no automated safeguards before the Flash Crash.

It has happened before computers There are numerous accounts in financial history
of market gyrations. Jitters over financial conditions Stocks drop rapidly. Confusion in market over price
Latency and data integrity issues are not new! Ticker tape running late
33

Many times… May 2, 1906
34

NY Times. August 8,
1919
35

36
More historical parallels
Market mechanisms broke down at previous times of high stress October 1929 May 29, 1962
Ticker ran 2 hours 29 minutes after market closed. IBM fell 5.3% in 19 minutes
October 19, 1987 “Large scale breakdowns in automated trading systems”
http://www.sec.gov/news/studies/tradrep.htm
Printers jammed on NYSE floor Phones unanswered at brokers

Dendreon: April 28, 2009
37

38
What happened on “Tornado The The “Flash Crash”

Not one but three ****storms
Three major problems on May 6 Tornado in S&P futures
Large sell order in E-minis? Index quickly recovered from downdraft. Arbitrage activity spilled into cash market for S&P500
Flood of market data overwhelmed participants Market centers became disconnected Data integrity issues pushed liquidity providers off line
Erroneous trades in non S&P stocks Arca-listed ETFs bore brunt of damage ACN at a penny
39

40
Chronology of May 6, 2010
Market already jittery because of concerns over Greece. Down day with very heavy volume Reports of data problems in various places 2:00- 2:30 Over 200 NYSE stocks hit LRPs
NYSE slow motion mode
2:30 – 3:00 E-mini volume 10x ADV 2:32 “Large trader” starts to sell 75,000 E-mini contracts 2:37 NASDAQ invokes “self help” against NYSE Arca
BATS, NSE, and BSE also invoke self-help Apparently ARCA was not responding quickly enough to other exchanges.
Fault of ARCA or data linkages between exchanges?
2:40 PM decline accelerates 2:45:28 CME halts E-mini for 5 seconds
Stop logic functionality
Spread widens dramatically as depth drops on E-mini 78,412 E-mini contracts trade during that minute!
2:45- 2:55 Armageddon and rebound 2:47 Accenture trades at 1 cent on CBOE
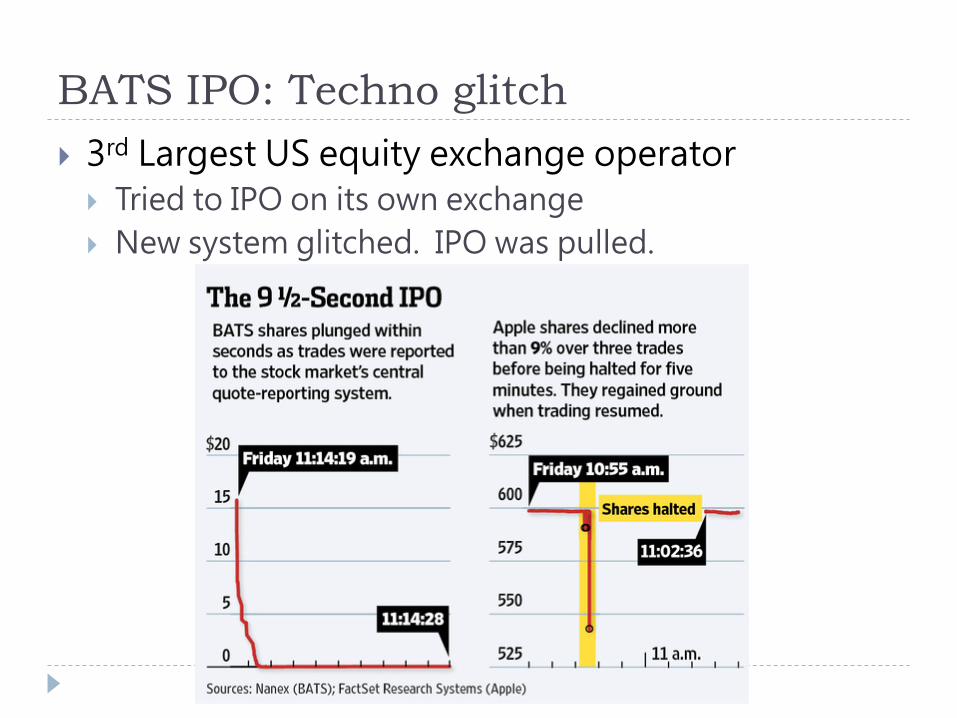
BATS IPO: Techno glitch 3rd Largest US equity exchange operator Tried to IPO on its own exchange New system glitched. IPO was pulled.

Summary Technology has changed. Electronic trading and private ownership From natural monopolies to competitive networks
Our markets are mostly better We need to be prepared for glitches
42


