Changes in the microbial communities during co-composting of digestates q Ingrid H. Franke-Whittle a,⇑ , Alberto Confalonieri b , Heribert Insam a , Mirko Schlegelmilch c , Ina Körner c a University of Innsbruck, Institute of Microbiology, Technikerstraße 25, 6020 Innsbruck, Austria b Scuola Agraria del Parco di Monza,Viale Cavriga 3, 20900 Monza, Italy c Hamburg University of Technology, Bioconversion and Emission Control Group, Eissendorfer Str. 42, 21073 Hamburg, Germany article info Article history: Received 1 August 2013 Accepted 5 December 2013 Available online 21 January 2014 Keywords: Composting Anaerobic digestion COMPOCHIP Microarray Nitrogen compounds abstract Anaerobic digestion is a waste treatment method which is of increasing interest worldwide. At the end of the process, a digestate remains, which can gain added value by being composted. A study was conducted in order to investigate microbial community dynamics during the composting process of a mixture of anaerobic digestate (derived from the anaerobic digestion of municipal food waste), green wastes and a screened compost (green waste/kitchen waste compost), using the COMPOCHIP microarray. The com- posting process showed a typical temperature development, and the highest degradation rates occurred during the first 14 days of composting, as seen from the elevated CO 2 content in the exhaust air. With an exception of elevated nitrite and nitrate levels in the day 34 samples, physical–chemical parameters for all compost samples collected during the 63 day process indicated typical composting conditions. The microbial communities changed over the 63 days of composting. According to principal component anal- ysis of the COMPOCHIP microarray results, compost samples from the start of the experiment were found to cluster most closely with the digestate and screened compost samples. The green waste samples were found to group separately. All starting materials investigated were found to yield fewer and lower signals when compared to the samples collected during the composting experiment. Ó 2014 The Authors. Published by Elsevier Ltd. All rights reserved. 1. Introduction In order to reduce negative impacts on the environment, the European Landfill Directive (1999/31/EC) states that by 2016, the disposal of biodegradable municipal waste should be reduced by 75%, compared to 1995 values. Composting of municipal, agricultural and industrial wastes is among the most commonly used biowaste treatment options employed across Europe. Another increasingly used technology is anaerobic digestion (AD), whereby organic substrates are converted into a methane rich biogas, suit- able for heat and electricity production. A digestate remains at the end of the process, which contains both undegraded and non- degradable organic compounds as well as nutrients (Körner et al., 2010). Recently, the combination of both anaerobic digestion and composting for biowaste treatment has been increasingly pro- moted. The advantage is the combined generation of energy and material products – biogas and compost as a soil improver. This combination increases the efficiency of bioresource utilisation. However, before integrating an anaerobic digestion unit into an existing composting facility, the economic framework and technical setup has to be evaluated and optimised. Process optimisation is important for both anaerobic digestion and composting facilities, as well as for plants integrating both processes. Digestates are often characterised by a high biogas po- tential, indicating an inefficient anaerobic digestion process. For in- stance, Linke et al. (2007) reported a remaining biogas potential in digestates from a dry fermentation plant using maize silage and turkey manure from approximately 25 NL biogas per kg digestate fresh matter. For comparison, the actual biogas production during anaerobic digestion was around 100 NL biogas per kg fresh input. Balsari et al. (2010) investigated the methane yields from the mechanically separated solid fractions of digestates from 6 biogas plants and found variations from 50 L methane production per kg volatile solids of up to around 210 L. They suggested reuse in the biogas plant to increase the overall process efficiency. The remaining, undegraded organic products can also be subjected to composting, although composting could as well be con- ducted with more efficiently treated digestates. The composting of 0956-053X/$ - see front matter Ó 2014 The Authors. Published by Elsevier Ltd. All rights reserved. http://dx.doi.org/10.1016/j.wasman.2013.12.009 q This is an open-access article distributed under the terms of the Creative Commons Attribution License, which permits unrestricted use, distribution, and reproduction in any medium, provided the original author and source are credited. ⇑ Corresponding author. Tel.: +43 512 507 51322; fax: +43 512 507 2928. E-mail addresses: [email protected](I.H. Franke-Whittle), a.confalonieri@ monzaflora.it (A. Confalonieri), [email protected](M. Schlegelmilch), [email protected](I. Körner). Waste Management 34 (2014) 632–641 Contents lists available at ScienceDirect Waste Management journal homepage: www.elsevier.com/locate/wasman
Changes in the microbial communities during co-compostingof digestates q
0956-053X/$ - see front matter � 2014 The Authors. Published by Elsevier Ltd. All rights reserved.http://dx.doi.org/10.1016/j.wasman.2013.12.009
q This is an open-access article distributed under the terms of the CreativeCommons Attribution License, which permits unrestricted use, distribution, andreproduction in any medium, provided the original author and source are credited.⇑ Corresponding author. Tel.: +43 512 507 51322; fax: +43 512 507 2928.
Ingrid H. Franke-Whittle a,⇑, Alberto Confalonieri b, Heribert Insam a, Mirko Schlegelmilch c, Ina Körner c
a University of Innsbruck, Institute of Microbiology, Technikerstraße 25, 6020 Innsbruck, Austriab Scuola Agraria del Parco di Monza,Viale Cavriga 3, 20900 Monza, Italyc Hamburg University of Technology, Bioconversion and Emission Control Group, Eissendorfer Str. 42, 21073 Hamburg, Germany
a r t i c l e i n f o
Article history:Received 1 August 2013Accepted 5 December 2013Available online 21 January 2014
Anaerobic digestion is a waste treatment method which is of increasing interest worldwide. At the end ofthe process, a digestate remains, which can gain added value by being composted. A study was conductedin order to investigate microbial community dynamics during the composting process of a mixture ofanaerobic digestate (derived from the anaerobic digestion of municipal food waste), green wastes anda screened compost (green waste/kitchen waste compost), using the COMPOCHIP microarray. The com-posting process showed a typical temperature development, and the highest degradation rates occurredduring the first 14 days of composting, as seen from the elevated CO2 content in the exhaust air. With anexception of elevated nitrite and nitrate levels in the day 34 samples, physical–chemical parameters forall compost samples collected during the 63 day process indicated typical composting conditions. Themicrobial communities changed over the 63 days of composting. According to principal component anal-ysis of the COMPOCHIP microarray results, compost samples from the start of the experiment were foundto cluster most closely with the digestate and screened compost samples. The green waste samples werefound to group separately. All starting materials investigated were found to yield fewer and lower signalswhen compared to the samples collected during the composting experiment.
� 2014 The Authors. Published by Elsevier Ltd. All rights reserved.
1. Introduction
In order to reduce negative impacts on the environment, theEuropean Landfill Directive (1999/31/EC) states that by 2016, thedisposal of biodegradable municipal waste should be reduced by75%, compared to 1995 values. Composting of municipal,agricultural and industrial wastes is among the most commonlyused biowaste treatment options employed across Europe. Anotherincreasingly used technology is anaerobic digestion (AD), wherebyorganic substrates are converted into a methane rich biogas, suit-able for heat and electricity production. A digestate remains atthe end of the process, which contains both undegraded and non-degradable organic compounds as well as nutrients (Körner et al.,2010). Recently, the combination of both anaerobic digestion andcomposting for biowaste treatment has been increasingly pro-
moted. The advantage is the combined generation of energy andmaterial products – biogas and compost as a soil improver. Thiscombination increases the efficiency of bioresource utilisation.However, before integrating an anaerobic digestion unit into anexisting composting facility, the economic framework and technicalsetup has to be evaluated and optimised.
Process optimisation is important for both anaerobic digestionand composting facilities, as well as for plants integrating bothprocesses. Digestates are often characterised by a high biogas po-tential, indicating an inefficient anaerobic digestion process. For in-stance, Linke et al. (2007) reported a remaining biogas potential indigestates from a dry fermentation plant using maize silage andturkey manure from approximately 25 NL biogas per kg digestatefresh matter. For comparison, the actual biogas production duringanaerobic digestion was around 100 NL biogas per kg fresh input.Balsari et al. (2010) investigated the methane yields from themechanically separated solid fractions of digestates from 6 biogasplants and found variations from 50 L methane production per kgvolatile solids of up to around 210 L. They suggested reuse in thebiogas plant to increase the overall process efficiency.
The remaining, undegraded organic products can also besubjected to composting, although composting could as well be con-ducted with more efficiently treated digestates. The composting of
digestates differs from the composting of common substrates, sincethe digestates are often characterised by very low dry matter content(dry matter content of 20–26% for digestates investigated by Linkeet al. (2007). In a study conducted by Bustamante et al. (2013), thecomposting of pig slurry digestate with different bulking agentswas investigated, and stable and mature composts were obtained.A similar study by Bustamante et al. (2012) used the solid fractionof a digestate from the anaerobic co-digestion of cattle slurry and si-lage, with or without vine shoot prunings as a bulking agent, in acomposting experiment. The composts obtained showed adequatedegrees of stability and maturity, suitable physical properties foruse as growing media, and were capable of the suppression of theplant pathogen Fusarium oxysporum f. sp. melonis.
Aerobic conditions are needed for composting processes(Körner, 2008), and the addition of aerobic microorganisms fromco-substrates can help in the composting process. Mixing com-posts with drier and more bulky materials is necessary to providesuitable composting conditions. Since microorganisms play a ma-jor role in anaerobic digestion as well as composting, knowledgeon the behaviour and dynamics of microbial communities is neces-sary for any kind of process optimisation (Sundberg et al., 2011).This is because the presence of different bacteria can positivelyor negatively affect the composting process, and modification ofthe type and amount of input materials can change the microbialcommunities, and the composting process. In recent years, themicrobiology of composting processes has been heavily investi-gated, both with classical (Kausar et al., 2011; Lv and Yu, 2013),physiological (Mondini and Insam, 2005) and molecular (Tiquiaet al., 2005; Franke-Whittle et al., 2009; Yamamoto et al., 2011) ap-proaches. However, knowledge regarding the microbial communi-ties involved in anaerobic digestion is still limited, and that ofcombined processes is even more limited.
A microarray targeting plant, animal and human pathogens,plant disease suppressive bacteria, as well as microorganisms thathave been previously reported in the composting process, wasdeveloped by Franke-Whittle et al. (2005, 2009). The COMPOCHIPmicroarray allows the quick detection of many different microor-ganisms in a single test, and has been used in several compostingstudies (Danon et al., 2008; Cayuela et al., 2009; Sundberg et al.,2011, 2013; Fritz et al., 2012).
The aim of this study was to investigate the changes in micro-bial communities in a composting experiment using the COMPO-CHIP microarray. Three input substrates were selected: amunicipal food waste digestate, a green waste and a screened com-post produced from green waste and kitchen waste. Of interest wasto determine how the microbial composition would evolve duringthe composting process.
2. Materials and methods
2.1. Substrates for composting
Fresh green waste (Gw), screened compost (Co) and digestate(Dig) were used as input substrates for the experiment (Table 1).
Table 1Physical and chemical parameters of original substrates and of the mixture used in the co
Note: fm – fresh matter; dm – dry matter; TKN – Total Kjeldahl nitrogen; TOC – Total orTotal water soluble N refer to the content in the eluate (both are water soluble fraction
Gw was produced from wood chips, yard trimmings and tree cuttingsand taken from a composting facility. It was shredded to a size appro-priate for laboratory reactor trials. Gw was expected to contain ubiq-uitous microrganisms. Co was produced from separately collectedorganic waste (green waste and kitchen waste) by means of an en-closed reactor technology, following the guidelines of the Germanbiowaste ordinance (BioAbfV, 1998). After composting, it wasscreened and the 20–50 mm fraction was used in this study. Cowas used in order to introduce a variety of aerobic microorganismsinto the mixture, which are typical for composting. Dig was pro-duced by an industrial mesophilic anaerobic digestion process. Thedigester was fed with the liquid fraction derived from shredded foodwaste separated by means of a mash-separator, as well as with oilresidues from the olive oil industry. The mixing ratio (food waste li-quid: olive residues) was 9:1 (fresh weight). Dig was expected tocontain a predominantly anaerobic microbial flora.
A mixture of the three substrates was manually prepared for thecomposting experiment. One of the purposes of the mixing was tointroduce a significant share of microorganisms from all fractionsinto the composting substrate. The water content of the ISM (initialstarting material) was adjusted to 64% by the addition of theanaerobic digestate, as seen in Table 1.
2.2. Composting and sampling
Composting was carried out in an insulated 100-L steel tankcomposting unit, which is described in detail in Körner (2008).The schematic set-up of the whole unit, including peripheralequipment is presented in Fig. 1. In total, three composting exper-iments were carried out, each in duplicate. All experiments showedthe typical course of composting. Samples from one of the experi-ments was chosen for investigation of the microbial consortia.
The composting reactor was filled with 55.6 kg fresh matter(fm) of the substrate mixture and was aerated at a rate of100 L h�1. For that purpose, compressed air was bubbled fromunderneath the mixture to oxygenate the substrate. The gas flowswere manually adjusted and continuously monitored during com-posting by means of a mass flow meter. The composting periodlasted 63 days and during this period, the substrate mixture wasturned three times (after 8, 20 and 34 days). Turnings were per-formed by emptying the reactor and manually mixing the material.Three representative samples were taken after mixing and reactorswere refilled. The samples were either analysed directly, or stored(4 �C and �20 �C) for future analyses.
The weight losses along the composting process were deter-mined by weighing the whole reactor on each turning day. Further-more, the amounts of leachate were measured upon turning. Thetemperature profiles of the substrate mixtures during compostingand of the gaseous phase above the substrate were monitored sev-eral times a day with PT 100 temperature probes. No additionalheat was provided. The exhaust air was captured at the top ofthe reactor and sent to a waste gas treatment system. The gastreatment system consisted of a condenser and an acid trap, andthe condensate and acidic solution were analysed on demand
regarding NH3-content. An air stream was firstly conductedthrough bottles placed in a refrigerator to remove NH3-containingcondensed water. Air was then led through 2 bottles with gas dis-pensers which contained 0.5 N H2SO4 as a scrubbing solution and acolor indicator to show when the solution became saturated. Aftersaturation, the scrubbing solution was exchanged. The composi-tion of the remaining gaseous emissions (CO2, O2, CH4, N2, H2,N2O) was measured every 2–3 days by gas chromatography.
Samples were collected for analysis at the start of the experi-ment (ISM), after 8 days, after 20 days (fresh compost; FC), after34 days (slightly matured compost; SMC) and after 63 days(matured compost; MC). Furthermore, the three substrates(Gw, Dig, and Co) were analysed prior to mixing.
2.3. Physical–chemical parameters
The dry matter content (dm) of triplicate samples was assessedaccording to DIN EN 12880 (2001). The drying step was performedat 105 �C for at least 24 h and dried samples were ground to a par-ticle size <0.25 mm. Total Kjehldahl nitrogen (TKN) of samples wasdetermined using a Kjeldahl catalyst at 380 �C to mineralise organ-ic N to ammonia, followed by a distillation step under a vaporstream, basification with NaOH and N titration in a H3BO3 solution.Total organic carbon (TOC) was measured by the dry combustionmethod at 550 �C.
Ammonia/ammonium, nitrate, nitrite concentration and pHwere determined in eluates prepared using demineralised water(DIN 38414-4, 1984). pH was measured according to DIN 38404-5(2005), ammonia/ammonium concentration according to DIN ENISO 11732 (2005), nitrate and nitrite concentration according toDIN EN ISO 10304-1 (2009), and total soluble nitrogen accordingto DIN 38409-H 28 (1992).
The ammonia/ammonium concentrations in the condensedwater and acidic trap solution were determined using a gas sensi-tive electrode as described for the eluates. The gas composition inthe exhaust gas was measured by gas chromatography. The meth-ods are explained in more detail in Körner (2008).
2.4. Molecular methods for determination of microorganisms
The starting substrates Gw, Dig, Co and the samples from thecomposting processes ISM, FC, SMC and MC were analysed regard-ing their microbial composition using molecular methods. TheCOMPOCHIP microarray, spotted with 414 probes targeting com-post-relevant microorganisms, including plant, animal and humanpathogens, and bacteria related to plant disease suppression, wasused. The PowerSoil DNA Isolation Kit (MO BIO Laboratories, Carls-bad, California, USA) was used to extract DNA from the differentcomposts and starting materials. For a few target microorganisms,only one or two probes were printed on the array, but for most tar-get microorganisms, at least three probes were printed on thearray.
The specificity of all probes was assessed using the ARB pro-gram (Ludwig et al., 2004). The majority of probes printed on themicroarray were tested using pure cultures of microorganisms,and shown to work well with only a low percentage of non-specifichybridisations (Franke-Whittle et al., 2005, 2009). All the probesincluded on the COMPOCHIP microarray were designed to havesimilar melting temperatures, and probe sequences ranged inlength from 17 to 25 nucleotides.
DNA extraction from substrate and compost samples, fluores-cence labelling of target DNA, hybridisation, scanning of arrayswere conducted as described by Franke-Whittle et al. (2005,2009). Principal component analysis (PCA) of the total signal-to-
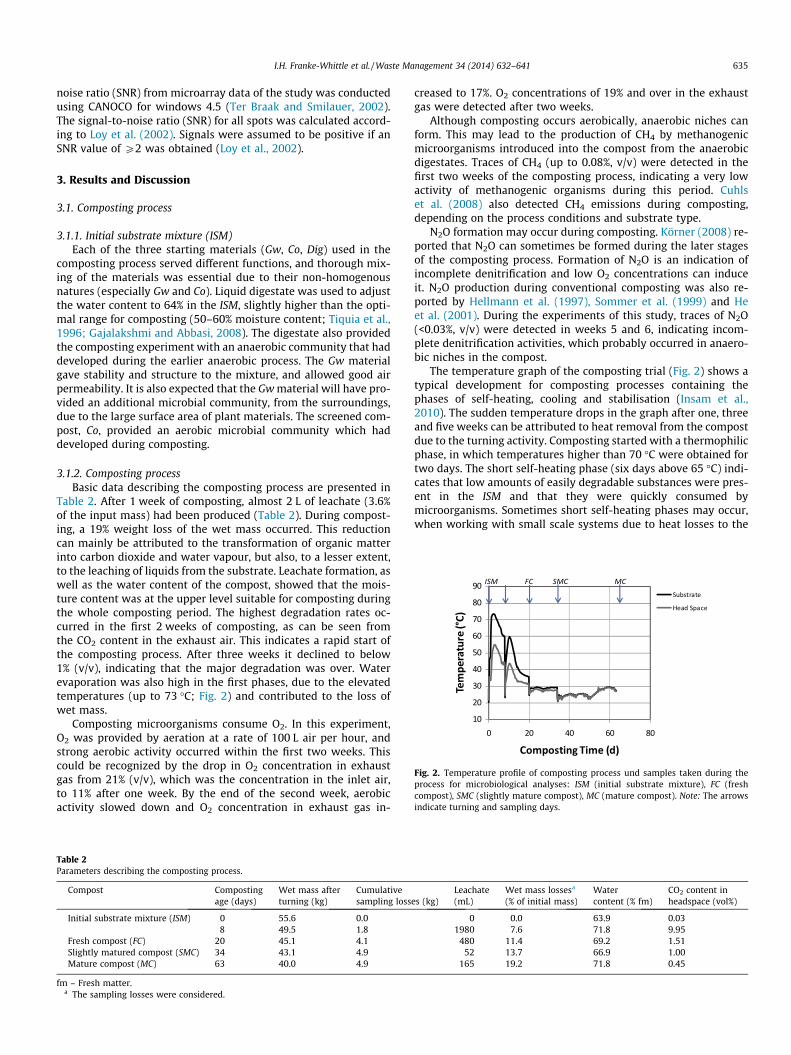
Fig. 2. Temperature profile of composting process und samples taken during theprocess for microbiological analyses: ISM (initial substrate mixture), FC (freshcompost), SMC (slightly mature compost), MC (mature compost). Note: The arrowsindicate turning and sampling days.
noise ratio (SNR) from microarray data of the study was conductedusing CANOCO for windows 4.5 (Ter Braak and Smilauer, 2002).The signal-to-noise ratio (SNR) for all spots was calculated accord-ing to Loy et al. (2002). Signals were assumed to be positive if anSNR value of P2 was obtained (Loy et al., 2002).
3. Results and Discussion
3.1. Composting process
3.1.1. Initial substrate mixture (ISM)Each of the three starting materials (Gw, Co, Dig) used in the
composting process served different functions, and thorough mix-ing of the materials was essential due to their non-homogenousnatures (especially Gw and Co). Liquid digestate was used to adjustthe water content to 64% in the ISM, slightly higher than the opti-mal range for composting (50–60% moisture content; Tiquia et al.,1996; Gajalakshmi and Abbasi, 2008). The digestate also providedthe composting experiment with an anaerobic community that haddeveloped during the earlier anaerobic process. The Gw materialgave stability and structure to the mixture, and allowed good airpermeability. It is also expected that the Gw material will have pro-vided an additional microbial community, from the surroundings,due to the large surface area of plant materials. The screened com-post, Co, provided an aerobic microbial community which haddeveloped during composting.
3.1.2. Composting processBasic data describing the composting process are presented in
Table 2. After 1 week of composting, almost 2 L of leachate (3.6%of the input mass) had been produced (Table 2). During compost-ing, a 19% weight loss of the wet mass occurred. This reductioncan mainly be attributed to the transformation of organic matterinto carbon dioxide and water vapour, but also, to a lesser extent,to the leaching of liquids from the substrate. Leachate formation, aswell as the water content of the compost, showed that the mois-ture content was at the upper level suitable for composting duringthe whole composting period. The highest degradation rates oc-curred in the first 2 weeks of composting, as can be seen fromthe CO2 content in the exhaust air. This indicates a rapid start ofthe composting process. After three weeks it declined to below1% (v/v), indicating that the major degradation was over. Waterevaporation was also high in the first phases, due to the elevatedtemperatures (up to 73 �C; Fig. 2) and contributed to the loss ofwet mass.
Composting microorganisms consume O2. In this experiment,O2 was provided by aeration at a rate of 100 L air per hour, andstrong aerobic activity occurred within the first two weeks. Thiscould be recognized by the drop in O2 concentration in exhaustgas from 21% (v/v), which was the concentration in the inlet air,to 11% after one week. By the end of the second week, aerobicactivity slowed down and O2 concentration in exhaust gas in-
Table 2Parameters describing the composting process.
fm – Fresh matter.a The sampling losses were considered.
creased to 17%. O2 concentrations of 19% and over in the exhaustgas were detected after two weeks.
Although composting occurs aerobically, anaerobic niches canform. This may lead to the production of CH4 by methanogenicmicroorganisms introduced into the compost from the anaerobicdigestates. Traces of CH4 (up to 0.08%, v/v) were detected in thefirst two weeks of the composting process, indicating a very lowactivity of methanogenic organisms during this period. Cuhlset al. (2008) also detected CH4 emissions during composting,depending on the process conditions and substrate type.
N2O formation may occur during composting. Körner (2008) re-ported that N2O can sometimes be formed during the later stagesof the composting process. Formation of N2O is an indication ofincomplete denitrification and low O2 concentrations can induceit. N2O production during conventional composting was also re-ported by Hellmann et al. (1997), Sommer et al. (1999) and Heet al. (2001). During the experiments of this study, traces of N2O(<0.03%, v/v) were detected in weeks 5 and 6, indicating incom-plete denitrification activities, which probably occurred in anaero-bic niches in the compost.
The temperature graph of the composting trial (Fig. 2) shows atypical development for composting processes containing thephases of self-heating, cooling and stabilisation (Insam et al.,2010). The sudden temperature drops in the graph after one, threeand five weeks can be attributed to heat removal from the compostdue to the turning activity. Composting started with a thermophilicphase, in which temperatures higher than 70 �C were obtained fortwo days. The short self-heating phase (six days above 65 �C) indi-cates that low amounts of easily degradable substances were pres-ent in the ISM and that they were quickly consumed bymicroorganisms. Sometimes short self-heating phases may occur,when working with small scale systems due to heat losses to the
surroundings. This was not the case in our study, since the 100 Lreactors utilised were well insulated and contained a water filleddouble wall. The wall temperature represented the temperaturein the middle of the substrate mixture and automatic heating tookplace when heat losses occurred. The set-up simulated self-heatingof larger systems. The reason for the short self-heating phase hasrather to be found in the substrate, as shown also by the compari-son with the temperature profiles in experiments composting dif-ferent mixtures of substrates (Bustamante et al., 2012). After theeasily degradable substances were consumed, temperature de-creased slowly to air temperature over a period of approximatelytwo weeks. The recommendation for hygienisation of compostsaccording to BioAbfV (1998) state that temperatures >65 �C shouldbe sustained for at least seven days or >55 �C for 14 days. Takinginto account that this guideline refers to commercial compostingfacilities treating non-homogenous materials, we can consider thatthe compost produced in this lab trial was hygienically acceptable.
No significant degradation was seen in the compost during thestabilisation phase (day 20 until the end of composting), but pre-sumably, organic compound rearrangement reactions (humifica-tion) occurred. The stabilisation phase commonly takes place atambient temperatures (Insam et al., 2010). A slight temperature in-crease occurred in the experiment at the end of the stabilisationphase, indicative of a microbiologically active community. This in-crease can probably be attributed to the development of a fungalflora which was able to metabolise the more recalcitrant compo-nents. The metabolites arising from these breakdown processescan in turn also be metabolised by bacteria, and this metabolismprobably resulted in the temperature increase that can be seen inFig. 2.
Table 3 shows selected physical–chemical parameters of thedifferent samples from the composting process. The dry mattercontent decreased during the thermophilic phase and again in-creased with the cooling of the substrate. These values are relative,and not absolute values. The dry matter decrease is attributed torelative water enrichment due to substrate degradation and gener-ation of process water formation. The dry matter increases areattributed to water losses due to aeration. The water content wasat the upper limit for optimal aerobic processes. This indicates thatthere were enough niches present for both aerobic as well asanaerobic microorganisms.
The highest pH values were found during the thermophilic andearly cooling phases. Nonetheless, pH values were in a suitablerange (between 7 and 8.5) for the optimal growth of many micro-organisms for the duration of the composting process. Included areammonifiers (5.0–8.0), autotrophic nitrifiers (6.5–8.0) and denitri-fiers (6.0–8.0) (Knowles, 1982; Scheffer and Schachtschabel, 2002;Körner, 2008).
Water soluble nitrogen comprises ammonia/ammonium, ni-trate and nitrite (Table 3). Nitrate and nitrite were not detectedin any of the starting substrates or any compost, with the excep-
Table 3Physical–chemical parameters of samples taken during composting.
Note: fm – fresh matter; dm – dry matter; nd – not detected; nm-not measured.NHþ4 , NO�2 , NO�3 and total soluble N refer to the content in the eluate; all are water solu
a Samples from composting process used in COMPOCHIP analyses.
tion of the compost collected on day 34. NO�3 is produced by thenitrification of ammonia, while NO�2 is an intermediate productin this process. Autotrophic and heterotrophic nitrifying microor-ganisms are known to be active in composting processes (Körner,2008). The lack of NO�3 or NO�2 does not necessarily mean that nit-rifiers were inactive; more likely, NO�3 was being simultaneouslydenitrified into N2. The NO�3 accumulation at day 34 was likely aresult of the very narrow milieu conditions regarding temperature,O2 content and organic N concentration in the compost. Tempera-tures between 25 and 35 �C, O2 >19%, and organic N >2% ofcompost dm, as seen at day 34, provide optimal conditions forNO�3 accumulation in compost (Körner, 2008). Prior to day 34, tem-peratures were too high.
Ammonia/ammonium is formed from the ammonification ofproteins, and the process increases also the soluble organic nitro-gen in compost. In common composting processes, maximumammonia/ammonium levels occur during the thermophilic phaseand generally range between 0.09% and 1.8% of the dm. The levelpredominantly depends on the organic N content of the initial sub-strate (Körner, 2008). In this experiment, the ammonia/ammoniumlevels were already relatively high at the start of the compostingprocess as a result of the digestate which was rich in ammonia/ammonium (Table 1). The maximum ammonia/ammonium peakwas 0.36% of the dm at day 20, while at the end of the compostingprocess, the value was 0.03% of the dm. According to Körner(2008), typical final ammonia/ammonium values are between0.02% and 1.0% of the dm, indicating normal ammonia amountsin the mature compost in this study.
The slight increase in the total organic nitrogen content (TKN) inthe compost is a result of N-losses via exhaust air and leachate on theone hand, and N enrichment due to carbon degradation on the other.In this experiment, the N peak was at day 63, with 2.1% of dm.
The total organic carbon (TOC) in the material decreased clearlywithin the first week, and showed no drastic changes in theremaining period (Table 3). This indicates that degradation pro-cesses were most significant in the first week. The changes in massrelated to initial wet matter are given in Table 2. The highestchanges also occurred during the first week. Beside organic matterdegradation, a further influencing factor was the formation ofleachate. To evaluate organic matter degradation, the degradationrate of the initial dry matter content was calculated at 28% in thefirst week, and increased up to 37% by the end of the compostingperiod.
3.2. Microarray analysis
The COMPOCHIP 16S rRNA gene microarray was applied to di-rectly determine which microorganisms were present in the differ-ent compost samples. The microarray contains a limited set ofprobes (414) specific to microorganisms known to be pathogens,as well as microorganisms considered to be important in compost-
ing processes. In total, 96 different microorganisms were detectedin the 7 samples (Table 4). Because a linear correlation between tar-get concentrations and signal intensities of the various probes hasbeen reported by others (Taroncher-Oldenburg et al., 2003; Tiquiaet al., 2004), the results can be considered semi-quantitative. Thesignal-to-noise ratios (SNRs) obtained after hybridisation of theCOMPOCHIP microarray were determined, and are presented inTable 4.
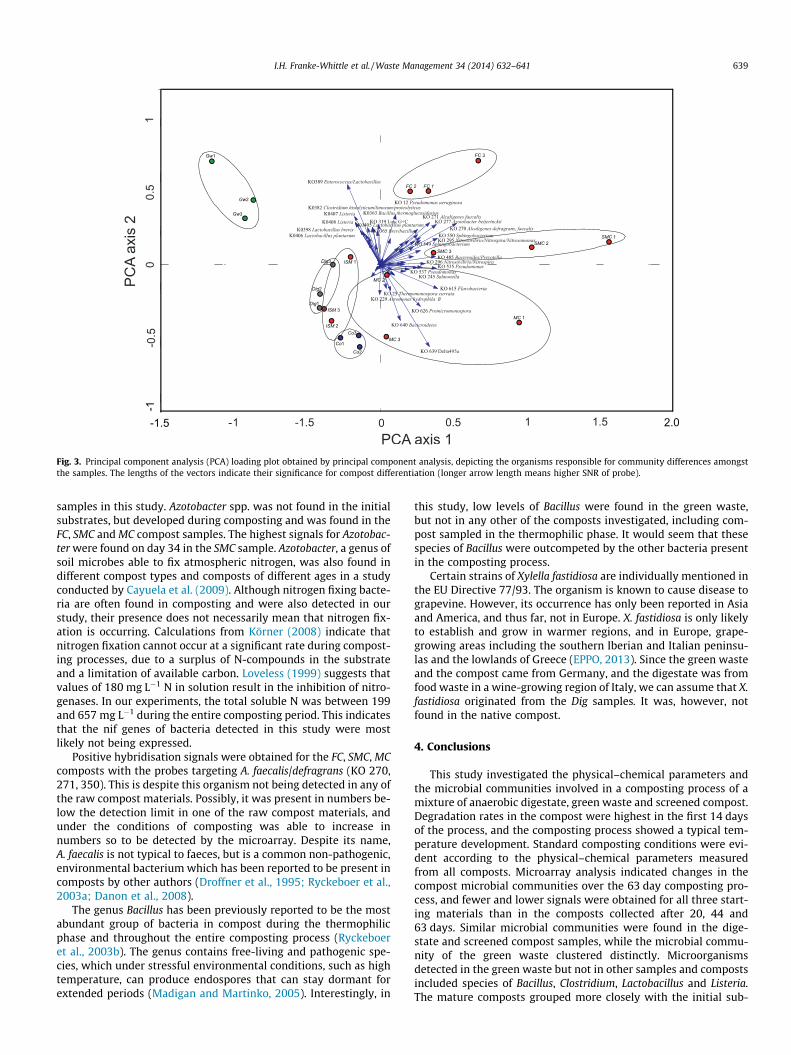
Fig. 3 shows an ordination graph, where the two relevant axesexplain 56.9% of the variance. The plot indicates the organisms(probes) which were responsible for community differencesamongst the composts and starting materials (indicated by ar-rows). Multivariate analysis revealed that the bacterial communitycompositions of the various starting materials differed, and thatthe composts made from them changed over time. Replicate sam-ples were found to mostly group closely together.
The probes KO 389 (Enterococcus/Lactobacillus), KO 639 (Deltaproteobacteria), KO 277 (Azotobacter beijerinckii), KO 270 and KO271 (Alcaligenes defragrans, faecalis) and KO 295 Nitrosovibrio/Nitro-spira/Nitrosomonas had the highest discriminatory capacity of allprobes, and allowed the differentiation of samples.
The freshly prepared ISM samples (day 0) were found to clustermost closely with the digestate and screened compost samples,indicating similar microbial communities. Interestingly, the micro-bial communities of the green waste samples were found to bemore different, despite the ISM samples being comprised of52.4% (fm) green waste. One possible explanation for this findingis that a majority of the organisms found in green waste did nothave probes represented on the array.
Fewer and lower signals were detected in the starting materials(Co, Dig, Gw) and ISM samples (day 0) compost than in the othercompost samples (FC, SMC, MC) collected during the experiment.This would indicate lower bacterial numbers and diversity; how-ever, it is also possible that probes specific for many of the micro-organisms present in these samples were not present on themicroarray. Another explanation is that these starting materialscontain diverse communities of microorganisms of which themajority are present in numbers below the detection limit of themicroarray. As green waste composts are higher in recalcitrant lig-nocellulosic materials, it would be expected that diverse communi-ties of degrading bacteria and fungi should be present.
The microbial communities of the composts were seen tochange over the 63 days of composting. Interestingly, there weremore and higher signals upon hybridisation of the array withDNA extracted from the composts after 20 and 34 days of compost-ing (FC, SMC) than in all other composts and input materials inves-tigated. Again, it is possible that these mesophilic organisms arerepresented on the COMPOCHIP to a higher degree than microor-ganisms found in the very early and late stages of the compostingprocess.
Of concern was the finding of Salmonella in the FC and SMC com-posts. The presence of these microorganisms in an end productwould indicate an inefficient sanitation step, as animal, humanand plant pathogens should normally be eliminated through hightemperatures and through microbial succession in the compostingprocess (Sundberg et al., 2013). The short thermophilic hygienisa-tion phase which occurred in the composting process is most likelythe reason for the survival of this pathogen. However, signals be-low the detection limit for the Salmonella probe were found inthe two of the three MC compost samples. This indicates that be-sides temperature, other factors may be important for hygienisa-tion. One such factor may be the production of antibiotics byactinobacteria. Thermomonospora, a genus in the phylum Actino-bacteria, was indeed detected in the mature compost samples.On the other hand, Listeria, a genus which also contains humanpathogens, was present in the green waste samples, but was
quickly reduced during the process and completely eliminatedfrom the final compost products. It would seem that Listeria ismore heat sensitive than Salmonella.
Various Clostridium probes (Cl. fallax/perfringens-KO 264, Cl.formicoaceticum-KO 380, KO 381 and Cl. histolyticum/limosum/pro-teolyticum KO 382) gave positive hybridisation signals in the start-ing materials. Clostridium is a genus of obligate anaerobic, sporeforming organisms, and their presence in soil and composts innot unusual. During composting, the conditions were in generalaerobic due to the aeration applied. However anaerobic zonesmay have formed due to inhomogeneous air flow, evidenced bythe detection of methane during the first two weeks, and thedetection of N2O in weeks 5 and 6. The genus Clostridium containsdifferent pathogens. However, with the exception of the Cl. fallax/perfringens probe, no signals above the detection limit were de-tected in the compost after 63 days, thus alleviating potential con-cerns. Cl. botulinum was not detected in any sample. This organismhas been reported to occur occasionally in composts and can causeserious illness, including death (Böhnel et al., 2002).
Different Lactobacillus probes were found to yield signals in thegreen waste (Lactobacillus-KO 320, L. brevis-KO 398 and L. planta-rum-KO 405, KO 406) and in the digestate (L. panis-KO 506). Lacto-bacillus species are typically found in the very early phases ofcomposting (Alfreider et al., 2002; Partanen et al., 2010) and pro-duce large amounts of lactic acid. Lactic acid and other acid pro-ducing bacteria have also been reported in anaerobic digestionprocesses (Shin et al., 2010; Probst et al., 2013; Sundberg et al.,2013).
The probes targeting the autotrophic nitrification bacteria Nitro-spira, Nitrosovibrio and Nitrosomonas were found to hybridise withDNA from the FC, SMC and MC composts, as well as with the com-post starting material (Co). These bacteria have also been reportedin composts from other studies (Kowalchuk et al., 1999; Danonet al., 2008; Cayuela et al., 2009; Bougnom et al., 2012). They areknown to be active in the first step of autotrophic nitrification inwhich NHþ4 becomes oxidised to NO�2 . Nitrospira is also active inthe second step of autotrophic nitrification, where NO�2 is oxida-tively converted into NO�3 (Rheinheimer et al., 1988; Körner,2008). As long as NHþ4 and O2 are contained in the substrate, auto-trophic nitrifiers should be active. The accumulation of NO�3 in theday 34 compost is most likely the result of the milieu conditionslimiting denitrification of NO�3 into N2 (Körner, 2008).
Nitrification can also occur in heterotrophic microorganisms.Fungi such as Aspergillus and Penicillium, and species of the bacteriaPseudomonas, Bacillus and Streptomyces are known heterotrophicnitrifiers (Verstraete, 1975; Killham, 1986; Körner, 2008). Bacillusspecies occurred in Gw only and lower SNR values for this bacte-rium were obtained in the composts as the process continued.Streptomyces was only detected (low SNR) in the MC sample. Pseu-domonas species were not found in Gw, but in Dig and Co. They in-creased during the composting process and yielded the highestSNR values in the SMC sample. This sample was also the only onewhich also contained NO�3 (Table 3). Pseudomonas species are ubiq-uitous in the environment and have been previously reported inmature compost bacterial communities (Ryckeboer et al., 2003a;Danon et al., 2008). Pseudomonas strains are capable of N2 fixation,denitrification and the degradation of pollutants (Lalucat et al.,2006), and several strains are known to confer plant-disease sup-pressiveness (Haas and Défago, 2005).
The genera Azotobacter and Clostridium include members thatare capable of asymbiotic nitrogen fixation (Müller, 1965; Schleeand Kleber, 1991; Körner, 2008). Nitrogen fixing bacteria werefound in composting samples by de Bertoldi et al. (1983), Safwat(1980) and Diaz-Ravina (1989). Probes targeting both Azotobacter(KO 276, KO 277, KO 278) and Clostridium (KO 264, 380, 381,382, 383, 225) were found to hybridise with DNA from various
Table 4Microarray results showing SNR values of the different starting materials and compost samples. The green represents hybridisation signals with SNR values above the threshold of 2.
Target GW 1 GW 2 GW 3 Dig 1 Dig 2 Dig 3 Co 1 Co 2 Co 3 ISM 1 ISM 2 ISM 3 FC 1 FC 2 FC 3 SM C 1 SM C 2 SM C 3 M C 1 M C 2 M C 3
Fig. 3. Principal component analysis (PCA) loading plot obtained by principal component analysis, depicting the organisms responsible for community differences amongstthe samples. The lengths of the vectors indicate their significance for compost differentiation (longer arrow length means higher SNR of probe).
samples in this study. Azotobacter spp. was not found in the initialsubstrates, but developed during composting and was found in theFC, SMC and MC compost samples. The highest signals for Azotobac-ter were found on day 34 in the SMC sample. Azotobacter, a genus ofsoil microbes able to fix atmospheric nitrogen, was also found indifferent compost types and composts of different ages in a studyconducted by Cayuela et al. (2009). Although nitrogen fixing bacte-ria are often found in composting and were also detected in ourstudy, their presence does not necessarily mean that nitrogen fix-ation is occurring. Calculations from Körner (2008) indicate thatnitrogen fixation cannot occur at a significant rate during compost-ing processes, due to a surplus of N-compounds in the substrateand a limitation of available carbon. Loveless (1999) suggests thatvalues of 180 mg L�1 N in solution result in the inhibition of nitro-genases. In our experiments, the total soluble N was between 199and 657 mg L�1 during the entire composting period. This indicatesthat the nif genes of bacteria detected in this study were mostlikely not being expressed.
Positive hybridisation signals were obtained for the FC, SMC, MCcomposts with the probes targeting A. faecalis/defragrans (KO 270,271, 350). This is despite this organism not being detected in any ofthe raw compost materials. Possibly, it was present in numbers be-low the detection limit in one of the raw compost materials, andunder the conditions of composting was able to increase innumbers so to be detected by the microarray. Despite its name,A. faecalis is not typical to faeces, but is a common non-pathogenic,environmental bacterium which has been reported to be present incomposts by other authors (Droffner et al., 1995; Ryckeboer et al.,2003a; Danon et al., 2008).
The genus Bacillus has been previously reported to be the mostabundant group of bacteria in compost during the thermophilicphase and throughout the entire composting process (Ryckeboeret al., 2003b). The genus contains free-living and pathogenic spe-cies, which under stressful environmental conditions, such as hightemperature, can produce endospores that can stay dormant forextended periods (Madigan and Martinko, 2005). Interestingly, in
this study, low levels of Bacillus were found in the green waste,but not in any other of the composts investigated, including com-post sampled in the thermophilic phase. It would seem that thesespecies of Bacillus were outcompeted by the other bacteria presentin the composting process.
Certain strains of Xylella fastidiosa are individually mentioned inthe EU Directive 77/93. The organism is known to cause disease tograpevine. However, its occurrence has only been reported in Asiaand America, and thus far, not in Europe. X. fastidiosa is only likelyto establish and grow in warmer regions, and in Europe, grape-growing areas including the southern Iberian and Italian peninsu-las and the lowlands of Greece (EPPO, 2013). Since the green wasteand the compost came from Germany, and the digestate was fromfood waste in a wine-growing region of Italy, we can assume that X.fastidiosa originated from the Dig samples. It was, however, notfound in the native compost.
4. Conclusions
This study investigated the physical–chemical parameters andthe microbial communities involved in a composting process of amixture of anaerobic digestate, green waste and screened compost.Degradation rates in the compost were highest in the first 14 daysof the process, and the composting process showed a typical tem-perature development. Standard composting conditions were evi-dent according to the physical–chemical parameters measuredfrom all composts. Microarray analysis indicated changes in thecompost microbial communities over the 63 day composting pro-cess, and fewer and lower signals were obtained for all three start-ing materials than in the composts collected after 20, 44 and63 days. Similar microbial communities were found in the dige-state and screened compost samples, while the microbial commu-nity of the green waste clustered distinctly. Microorganismsdetected in the green waste but not in other samples and compostsincluded species of Bacillus, Clostridium, Lactobacillus and Listeria.The mature composts grouped more closely with the initial sub-
strate mixtures, than with the fresh and semi-mature composts.Probes specific for Enterococcus/Lactobacillus, Delta proteobacteria,Azotobacter beijerinckii, Alcaligenes defragrans, faecalis andNitrosovibrio/Nitrospira/Nitrosomonas had the highest discrimina-tory capacity of all probes, and allowed the differentiation of sam-ples. This study has shown the feasibility of using a combination ofanaerobic digestion and composting for the treatment of organicwaste products. However, it is important that the period ofself-heating is long enough to ensure sufficient hygienisation ofthe input materials used.
Acknowledgments
IFW was funded by the Fonds zur Förderung der wissenschaft-lichen Forschung (FWF) Austria (Project FP200010). The compost-ing experiment was carried out in the frame of the NIREC-projectfunded by the European commission.
References
Alfreider, A., Peters, S., Tebbe, C.C., Rangger, A., Insam, H., 2002. Microbialcommunity dynamics during composting of organic matter as determined by16S ribosomal DNA analysis. Compost Sci. Util. 10, 303–312.
Balsari, P., Gioelli, F., Menardo, S., Paschetta, E. 2010. The (re)use of mechanicalseparated solid fraction of digested or not digested slurry in anaerobic digestionplants. In: Marques dos Santos Cordovil, C.S.C., Ferreira, L., (Eds.), RAMIRAN2010 – Treatment and use of organic residues in Agriculture-Challenges andopportunities towards sustainable management, Proceedings of the 14thinternational Conference, ISA-Press, Lissabon, Portugal, Art. 0256.
BioAbfV, 1998: Verordnung über die Verwertung von Bioabfällen auflandwirtschaftlich, forstwirtschaftlich und gärtnerisch genutzten Böden(Bioabfallverordnung) vom 21. September 1998. BGBl. I, pp. 2955
Böhnel, H., Briese, B.-H., Gessler, F., 2002. Methods for health risk assessment byClostridium botulinum in biocompost. In: Insam, H., Riddech, N., Klammer, S.(Eds.), Microbiology of Composting. Springer-Verlag, Berlin, Germany, pp. 517–526.
Bougnom, B.P., Greber, B., Franke-Whittle, I.H., Casera, C., Insam, H., 2012. Soilmicrobial dynamics in organic (biodynamic) and integrated apple orchards. Org.Agric. 2, 1–11.
Bustamante, M.A., Alburquerque, J.A., Restrepo, A.P., de la Fuente, C., Paredes, C.,Moral, R., Bernal, M.P., 2012. Co-composting of the solid fraction of anaerobicdigestates, to obtain added-value materials for use in agriculture. BiomassBioenergy 43, 26–35.
Bustamante, M.A., Restrepo, A.P., Alburquerque, J.A., Perez-Murcia, M.D., Paredes, C.,Moral, R., Bernal, M.P., 2013. Recycling of anaerobic digestates by composting:effect of the bulking agent used. J. Clean. Prod. 47, 61–69.
Cayuela, M.L., Mondini, C., Insam, H., Sinicco, T., Franke-Whittle, I.H., 2009. Plantand animal wastes composting: effects of the N source on process performance.Bioresour. Technol. 100, 3097–3106.
Cuhls, C., Mähl, B., Clemens, J., 2008. Emissionen aus der Kompostierung undVergärung von Bioabfällen im Vergleich. In: Biomasse-Forum 2008;Witzenhausen-Institut für Abfall, Umwelt und Energie GmbH.
Danon, M., Franke-Whittle, I.H., Insam, H., Chen, Y., Hadar, Y., 2008. Molecularanalysis of bacterial community succession during prolonged compost curing.FEMS Microbiol. Ecol. 65, 133–144.
de Bertoldi, M., Vallini, G., Pera, A., 1983. The biology of composting – a review.Waste Manage. Res. 1, 157–176.
DIN 38404-5, 2005. German Standard Methods for the Examination of Water, WasteWater and Sludge – Physical and Physico-chemical Characteristics (group C);Part 5: Determination of pH Value (C 5). Beuth Verlag, Berlin.
DIN 38409-H 28, 1992. German Standard Methods for the Examination of Water,Waste Water and Sludge; Parameters Characterizing Effects and Substances(group H); Determination of Bound Nitrogen – Method Using Devard’s Alloyand Catalytical Decomposition for Reduction German Version DIN 38409-H28:1992. Beuth Verlag, Berlin.
DIN 38414–4, 1984. German Standard Methods for the Examination of Water,Waste Water and Sludge – Sludges and Sediments (group S); Determination ofLeachability by Water (S 4). Beuth Verlag, Berlin.
DIN EN 12880, 2001. Characterization of Sludges – Determination of Dry Residueand Water Content; German Version EN 12880:2000. Beuth Verlag, Berlin.
DIN EN ISO 10304-1, 2009. Water Quality – Determination of Dissolved Anions byLiquid Chromatography of Ions; Part 1: Determination of Bromide, Chloride,Fluoride, Nitrate, Nitrite, Phosphate and Sulfate (ISO 10304–1:2007); GermanVersion EN ISO 10304–1:2009. Beuth Verlag, Berlin.
DIN EN ISO 11732, 2005. Water Quality – Determination of Ammonium Nitrogen –Method by Flow Analysis (CFA and FIA) and Spectrometric Detection(ISO 11732:2005); German Version EN ISO 11732:2005. Beuth Verlag, Berlin.
Droffner, M.L., Brinton, W.F., Evans, E., 1995. Evidence for the prominence of wellcharacterized mesophilic bacteria in thermophilic (50–70 �C) compostingenvironments. Biomass Bioenergy 8, 191–195.
EPPO, 2013: Data Sheets on Quarantine Pests Xylella fastidiosa Prepared by CABI andEPPO for the EU under Contract 90/399003; <http://www.eppo.int/QUARANTINE/bacteria/Xylella_fastidiosa/XYLEFA_ds.pdf>; (studied in January2013).
Franke-Whittle, I.H., Klammer, S.H., Insam, H., 2005. Design and application of anoligonucleotide microarray for the investigation of compost microbialcommunities. J. Microbiol. Methods 62, 37–56.
Franke-Whittle, I.H., Knapp, B.A., Fuchs, J., Kaufmann, R., Insam, H., 2009.Application of COMPOCHIP microarray to investigate the bacterialcommunities of different composts. Microb. Ecol. 57, 510–521.
Fritz, J.I., Franke-Whittle, I.H., Haindl, S., Insam, H., Braun, R., 2012. Microbiologicalcommunity analysis of vermicompost tea and its influence on the growth ofvegetables and cereals. Can. J. Microbiol. 58, 836–847.
Gajalakshmi, S., Abbasi, S.A., 2008. Solid waste management by composting: state ofthe art. Rev. Environ. Sci. Technol. 38, 311–400.
Haas, D., Défago, G., 2005. Biological control of soil-borne pathogens by fluorescentpseudomonads. Nat. Rev. Microbiol. 3, 307–319.
He, Y., Inamori, Y., Mizuochi, M., Kong, H., Iwami, N., Sun, T., 2001. Nitrous oxideemissions form aerated composting of organic waste. Environ. Sci. Technol. 11,2347–2351.
Hellmann, B., Zelles, L., Palojärvi, A., Bai, Q., 1997. Emission of climate-relevant tracegases and succession of microbial communities during open windrowcomposting. Appl. Environ. Microbiol. 63, 1011–1018.
Insam, H., Franke-Whittle, I.H., Goberna, M., 2010. Microbes in aerobic andanaerobic waste treatment. In: Insam, H., Franke-Whittle, I.H., Goberna, M.(Eds.), Microbes at Work From Wastes to Resources. Springer-Verlag,Heidelberg, Germany, pp. 1–36.
Kausar, H., Sariah, M., Saud, H.M., Alam, M., Ismail, M., 2011. Isolation and screeningof potential actinobacteria for rapid composting of rice straw. Biodegradation22, 367–375.
Killham, K., 1986. Heterotrophic nitrification. In: Prosser, J.I. (Ed.), Nitrification. IRLPress, Oxford, pp. 117–126.
Knowles, R., 1982. Denitrification. Microbiol. Rev. 46, 43–70.Körner, I., 2008. Stickstoffhaushalt bei der Kompostierung – Bilanzen, Gehalte,
Umsetzungs- und Austragsprozesse. In: Stegmann, R. (Ed.), Hamburger Berichte33, Verlag Abfall aktuell, Stuttgart, ISBN 978-3-9812867-0-0.
Körner, I., Amon, B., Bade, O., Balsari, P., Bioteau, T., Dabert, P., Dach, J., Deipser, A.,Kupper, T., Ferreira, L.J.M., Moller, H., Mantovi, P., Schnüre, A., Soldano, M.,Ward, A., Fabbri, C., 2010. Anaerobic digestion and digestate utilization inEurope. In: Marques dos Santos Cordovil, C.S.C., Ferreira, L., (Eds.), RAMIRAN2010 – Treatment and use of organic residues in agriculture-challenges andopportunities towards sustainable management, Proceedings of the 14thInternational Conference, ISA-Press, Lissabon, Portugal, Art. 0177.
Kowalchuk, G.A., Naoumenko, Z.S., Derikx, P.J.L., Felske, A., Stephen, J.R.,Arkhipchenko, I.A., 1999. Molecular analysis of ammonia-oxidizing bacteria ofthe beta subdivision of the class Proteobacteria in compost and compostedmaterials. Appl. Environ. Microbiol. 65, 396–403.
Lalucat, J., Bennasar, A., Bosch, R., Garcia-Valdes, E., Palleroni, N.J., 2006. Biology ofPseudomonas stutzeri. Microbiol. Mol. Biol. Rev. 70, 510–547.
Linke, B., Heiermann, M., Loock, R., Kessler, U., 2007. Ergebnisse aus derwisenschaftlichen Begleitung der Pilotanlage Pirow. In ETIArbeitsgruppensitzung, Friedersdorf. <http://www.eti-brandenburg.de/fileadmin/user_upload/Vortraege2007/ETI-AG_Biogas_21.02.07/Prof-Linke-Pirow.pdf> (studied in November 2013).
Loveless, T.M., Saah, J.R., Bishop, P.E., 1999. Isolation of nitrogen-fixing bacteriacontaining molybdenum-independent nitrogenases from natural environments.Appl. Environ. Microbiol. 65, 4223–4226.
Loy, A., Lehner, A., Lee, N., Adamczyk, J., Meier, H., Ernst, J., Schleifer, K.-H., Wagner,M., 2002. Oligonucleotide microarray for 16S rRNA gene-based detection of allrecognized lineages of sulfate-reducing prokaryotes in the environment. Appl.Environ. Microbiol. 68, 5064–5081.
Ludwig, L., Strunk, O., Westram, R., Richter, L., Meier, H., Yadhukumar, A., Buchner,A., Lai, T., Steppi, S., Jobb, G., Foerster, W., Brettske, I., Gerber, S., Ginhart, A.W.,Gross, O., Grumann, S., Hermann, S., Jost, R., Koenig, A., Liss, T., Lussmann, R.,May, M., Nonhoff, B., Reichel, B., Strehlow, R., Stamatakis, A., Stuckmann, N.,Vilbig, A., Lenke, M., Ludwig, T., Bode, A., Schleifer, K.-H., 2004. ARB: a softwareenvironment for sequence data. Nucleic Acids Res. 32, 1363–1371.
Lv, W., Yu, Z., 2013. Isolation and characterization of two thermophilic cellulolyticstrains of Clostridium thermocellum from a compost sample. J. Appl. Microbiol.114, 1001–1007.
Madigan, M., Martinko, J., 2005. Brock Biology of Microorganisms, eleventh ed.Prentice Hall.
Mondini, C., Insam, H., 2005. Effect of inoculum standardization on communitylevel physiological profiles of compost samples. Compost Sci. Util. 13,27–33.
Müller, G., 1965. Bodenbiologie. VEB Verlag G, Fischer, Jena.Partanen, P., Hultman, J., Paulin, L., Auvinen, P., Romantschuk, M., 2010. Bacterial
diversity at different stages of the composting process based on analysis of the16S gene. BMC Microbiol. 10, 94.
Probst, M., Fritschi, A., Wagner, A., Insam, H., 2013. Biowaste: A Lactobacillushabitat and lactic acid fermentation substrate. Bioresour. Technol. 143, 647–652.
Rheinheimer, G., Hegemann, W., Baff, J., Sekoulov, I., 1988. Stickstoffkreislauf imWasser. R. Oldenbourg Verlag, München, ISBN 3 486 26296 3.
Ryckeboer, J., Mergaert, J., Vaes, K., Klammer, S., De Clercq, D., Coosemans, J., Insam,H., Swings, J., 2003a. A survey of bacteria and fungi occurring duringcomposting and self-heating processes. Ann. Microbiol. 53, 349–410.
Ryckeboer, J., Mergaert, J., Coosemans, J., Deprins, K., Swings, J., 2003b.Microbiological aspects of biowaste during composting in a monitoredcompost bin. J. Appl. Microbiol. 94, 127–137.
Scheffer, F., Schachtschabel, P., 2002. Lehrbuch der Bodenkunde (15. Aufl.).Spektrum Akademischer Verlag, Heidelberg, ISBN 978 38 2741 324 6.
Schlee, D., Kleber, H.-P., 1991. Biotechnologie - Wörterbuch der Biologie. Aufl., Bd. 1und 2, Gustav Fischer Verlag, Jena, 1, ISBN 3 334 00311 6.
Shin, S.G., Han, G., Lim, J., Lee, C., Hwang, S., 2010. A comprehensive microbialinsight into two-stage anaerobic digestion of food waste-recycling wastewater.Water Res. 44, 4838–4849.
Sommer, S.G., Dahl, P., 1999. Nutrient and carbon balance during the composting ofdeep litter. J. Agric. Eng. Res. 74, 145–153.
Sundberg, C., Franke-Whittle, I.H., Kauppi, S., Yu, D., Romantschuk, M., Insam, H.,Jönsson, H., 2011. Characterisation of source-separated household wasteintended for composting. Bioresour. Technol. 102, 2859–2867.
Sundberg, C., Yu, D., Franke-Whittle, I.H., Kauppi, S., Smårs, S., Insam, H.,Romantschuk, M., Jönsson, H., 2013. Effects of pH and microbial compositionon odour in food waste composting. Waste Manage. (Oxford) 33, 204–211.
Taroncher-Oldenburg, G., Griner, E.M., Francis, C.A., Ward, B.B., 2003.Oligonucleotide microarray for the study of functional gene diversity in thenitrogen cycle in the environment. Appl. Environ. Microbiol. 69, 1159–1171.
ter Braak, C.J.F., Šmilauer, P., 2002. CANOCO Reference Manual and CanoDraw forWindows User’s Guide: Software for Canonical Community Ordination (version4.5). Microcomputer Power, Ithaca.
Tiquia, S.M., 2005. Microbial community dynamics in manure composts based on16S and 18S rDNA T-RFLP profiles. Environ. Technol. 26, 1101–1113.
Tiquia, S.M., Tam, N.F.Y., Hodgkiss, I.J., 1996. Microbial activities during compostingof spent pig-manure sawdust litter at different moisture contents. Bioresour.Technol. 55, 201–206.
Verstraete, W., 1975. Heterotrophic nitrification in soils and aqueous media – areview. Biol. Bull. Acad. Sci. USSR 2, 515–530.
Yamamoto, N., Asano, R., Yoshii, H., Otawa, K., Nakai, Y., 2011. Archaeal communitydynamics and detection of ammonia-oxidizing archaea during composting ofcattle manure using culture-independent DNA analysis. Appl. Microbiol.Biotechnol. 90, 1501–1510.