This article was downloaded by: [Cornell University Library] On: 03 October 2013, At: 17:25 Publisher: Routledge Informa Ltd Registered in England and Wales Registered Number: 1072954 Registered office: Mortimer House, 37-41 Mortimer Street, London W1T 3JH, UK Journal of Southern African Studies Publication details, including instructions for authors and subscription information: http://www.tandfonline.com/loi/cjss20 Changes in the racial division of labour during the apartheid era Owen Crankshaw a a Centre for Policy Studies, Johannesburg Published online: 24 Feb 2007. To cite this article: Owen Crankshaw (1996) Changes in the racial division of labour during the apartheid era, Journal of Southern African Studies, 22:4, 633-656, DOI: 10.1080/03057079608708516 To link to this article: http://dx.doi.org/10.1080/03057079608708516 PLEASE SCROLL DOWN FOR ARTICLE Taylor & Francis makes every effort to ensure the accuracy of all the information (the “Content”) contained in the publications on our platform. However, Taylor & Francis, our agents, and our licensors make no representations or warranties whatsoever as to the accuracy, completeness, or suitability for any purpose of the Content. Any opinions and views expressed in this publication are the opinions and views of the authors, and are not the views of or endorsed by Taylor & Francis. The accuracy of the Content should not be relied upon and should be independently verified with primary sources of information. Taylor and Francis shall not be liable for any losses, actions, claims, proceedings, demands, costs, expenses, damages, and other liabilities whatsoever or howsoever caused arising directly or indirectly in connection with, in relation to or arising out of the use of the Content. This article may be used for research, teaching, and private study purposes. Any substantial or systematic reproduction, redistribution, reselling, loan, sub-licensing, systematic supply, or distribution in any form to anyone is expressly forbidden. Terms & Conditions of access and use can be found at http://www.tandfonline.com/ page/terms-and-conditions
Transcript
This article was downloaded by: [Cornell University Library]On: 03 October 2013, At: 17:25Publisher: RoutledgeInforma Ltd Registered in England and Wales Registered Number: 1072954Registered office: Mortimer House, 37-41 Mortimer Street, London W1T 3JH, UK
Journal of Southern African StudiesPublication details, including instructions for authors andsubscription information:http://www.tandfonline.com/loi/cjss20
Changes in the racial division oflabour during the apartheid eraOwen Crankshaw aa Centre for Policy Studies, JohannesburgPublished online: 24 Feb 2007.
To cite this article: Owen Crankshaw (1996) Changes in the racial division of labourduring the apartheid era, Journal of Southern African Studies, 22:4, 633-656, DOI:10.1080/03057079608708516
To link to this article: http://dx.doi.org/10.1080/03057079608708516
PLEASE SCROLL DOWN FOR ARTICLE
Taylor & Francis makes every effort to ensure the accuracy of all the information (the“Content”) contained in the publications on our platform. However, Taylor & Francis,our agents, and our licensors make no representations or warranties whatsoeveras to the accuracy, completeness, or suitability for any purpose of the Content. Anyopinions and views expressed in this publication are the opinions and views of theauthors, and are not the views of or endorsed by Taylor & Francis. The accuracyof the Content should not be relied upon and should be independently verifiedwith primary sources of information. Taylor and Francis shall not be liable for anylosses, actions, claims, proceedings, demands, costs, expenses, damages, and otherliabilities whatsoever or howsoever caused arising directly or indirectly in connectionwith, in relation to or arising out of the use of the Content.
This article may be used for research, teaching, and private study purposes. Anysubstantial or systematic reproduction, redistribution, reselling, loan, sub-licensing,systematic supply, or distribution in any form to anyone is expressly forbidden.Terms & Conditions of access and use can be found at http://www.tandfonline.com/page/terms-and-conditions
Journal of Southern African Studies, Volume 22, Number 4, December 1996 633
Changes in the Racial Division of LabourDuring the Apartheid Era1
OWEN CRANKSHAW
(Centre for Policy Studies, Johannesburg)
Scholarly attempts to address the dual impact of economic growth and apartheid labourpolicies on the racial division of labour in the 1970s and 1980s produced markedlydivergent estimates of the extent to which the colour bar was being eroded by employmentgrowth. This study revisits the debate by applying new concepts about the division of labourto South African employment statistics. The reason why scholars came up with suchdifferent estimates of the size of the African middle class is that they relied on inappropriateneo-Marxist theories of class and on official occupational categories. On the other hand,I argue for a more eclectic conceptualisation of occupational groups that incorporatesneo-Weberian class schemes and labour process theory. The result is an occupationalclassification that tries to be sensitive to the ways in which the racial division of labour wasshaped by the legal and institutional mechanisms of racial discrimination, by the level ofcertification of the population, and by workplace dynamics. I go on to demonstrate theutility of this occupational taxonomy by applying it to the Manpower Survey results. Oneimportant finding is that African advancement into professional jobs during this period waslargely restricted to semi-professional occupations such as those of schoolteachers, nurses,technicians and priests -- a result that points to the state's role in expanding the size of theAfrican middle class. A second finding is that African advancement into private sectorclerical and sales jobs was far greater than into the skilled trades. These results point tothe role of white trade unions and the character of the labour process in shaping the racialdivision of labour during the apartheid era.
Introduction
At the end of the 1960s, after South African capitalism had experienced a decade ofunprecedented economic growth, scholars were deeply divided over its impact on racialinequality. Although the deepest differences of opinion were between liberal scholars whoargued that economic growth would erode racial inequality and revisionists who argued theconverse, there was little agreement even among revisionists on the extent and pattern ofchanges to the racial division of labour in South Africa. The aim of this study is thereforeto contribute to the debate on the relationship between economic growth and its impact onthe racial division of labour during the Apartheid period. Although new evidence ispresented here, the thrust of this contribution is to draw out the implications of class andlabour process theory for how we think about and measure the changing racial andoccupational division of labour in society.
I shall argue that the reasons why scholars have produced such different estimates of theextent and pattern of African advancement are due to the limitations inherent in neo-Marxist
1 I am grateful to Ben Fine, Steven Friedman and Colin Murray for their critical comments. Many of the ideasin this study are also a direct result of co-operative work with Doug Hindson.
theories of class and of the sources of data used by revisionists. To provide a reliableestimate of the extent and pattern of African advancement that overcomes some of theselimitations, I have relied on a somewhat eclectic classification scheme that incorporatesinsights from labour process theory and Weberian class theory. Following the example ofSimkins and Hindson, I have also relied on ithe Manpower Survey data instead of thePopulation Census because it provides a more detailed occupational classification and timeseries.2
The results of my analysis are restricted to the formal urban workforce. Because thisstudy is principally concerned with the question of how to measure changes in the racialdivision of labour and not with the broader question of racial inequality per se, I have notdealt with the question of unemployment. The rising unemployment rate among Africanssince the early 1970s has probably eroded ths gains that Africans made through occu-pational advancement and rising real wages. However, the analysis of the relationshipbetween occupational advancement and unemployment deserves a separate study which Ihave undertaken elsewhere.3
During the late 1960s, the shortage of white artisans led to a concerted campaign byemployers to fragment the skilled trades and to promote African workers into these newlycreated operative jobs. Liberal scholars interpreted these changes in the racial division oflabour as an important advance for African workers and a sign that the colour bar wasbeginning to erode. Revisionists, however, argued that these developments meant thatAfricans were effectively performing the work of white artisans, but at cheap wages.4
Trapido went so far as to say that 'as unorganised African workers came to do workpreviously undertaken by Whites, job fragmentation takes place and African wages remainunchanged'.5 Furthermore, they argued that this form of African advancement was noteroding the colour bar because, as Africans were promoted into semi-skilled positions, sowhites were promoted ahead of them. For example, Legassick argued that the upwardmobility of Africans into semi-skilled jobs was 'simply a means of dynamically modifyingthe system of racial differentiation in changing economic conditions. Non-whites mayindeed move into more jobs, more skilled jobs in manufacturing industry, and may receivemarginally increased wages. But the whites move upwards even further'.6 In fact, revision-ists predicted that this 'floating' of the colour bar would lead to even greater racialinequality.7 In the early 1970s the evidence supported the revisionist argument: the wagegap between white and African workers widened during the preceding decade of the 1960s.8
In the mid-1970s, however, Lipton and Nattrass countered this revisionist argument withnew evidence that the wage gap between white and African workers had narrowed across
2 C. Simkins, and D. Hindson, 'The Division of Labour in South Africa, 1969-1977', Social Dynamics, 5, 2 (1979),pp. 1-12.
3 O. Crankshaw, Race, Class and the Changing Division of Labour Under Apartheid (London, 1996).4 M. Legassick and D. Innes, 'Capital Restructuring and Apartheid: A Critique of Constructive Engagement',
African Affairs, 76, 305 (1977), pp. 448-449; Wolpe, 'South Africa: Class, Race and Occupational Structure',Collected Seminar Paper No. 12, The Societies of Southern Africa in the 19th and 20th Centuries, Vol. 2 (Instituteof Commonwealth Studies, University of London, 1971), p. 103.
5 S. Trapido, 'South Africa in a Comparative Study of Industrialization', Journal of Development Studies, 7, 3(1971), pp. 316-317.
6 M. Legassick, 'South Africa: Forced labour, industrialization, and racial differentiation', in R. Harris (ed), ThePolitical Economy of Africa (New York, 1975), pp. 262-263.
7 R. First, J. Steele. and C. Gurney, The South African Connection: Western Investment in Apartheid (London,1973), p. 62.
8 F. Johnstone, 'White Prosperity and White Supremacy in South Africa Today', African Affairs, 69, 274 (1970),p. 135.
Dow
nloa
ded
by [
Cor
nell
Uni
vers
ity L
ibra
ry]
at 1
7:25
03
Oct
ober
201
3
Racial Division of Labour 635
Table 1. Estimates of the size of the African middle class
all sectors between mid-1964 and mid-1974.9 They attributed this emerging trend ofdeclining Racial inequality to economic growth which raised the overall skills of theworkforce through mechanisation. Conversely, they argued that the effect of economicrecession would be to increase racial inequality.10
The revisionist response to the initial findings by liberal scholars on the narrowing ofthe Racial wage gap was one of scepticism. Legassick and Innes considered that the wagedata from which Lipton drew her conclusions were unreliable. They also argued, quitecorrectly, that Lipton produced no evidence of upward African mobility leading to anerosion of the colour bar." A similar position was advanced by Davies at a time when itwas evident that both employers and the state were keen on reforming the racial divisionof labour in South Africa. Davies argued that the scope for deracialisation was limited andthat all that could be expected was 'some blurring of the racist hierarchy at the skilledmanual working class and lower mental/supervisory levels'.12 Similarly, in support of hisargument that the apartheid state would not be able to expand its support base by creatingan African middle class, Nolutshungu presented evidence that just less than one per cent ofall Africans were middle class in 1970.13
At the end of the 1970s, however, two dissenting contributions argued that the racialdivision of labour had undergone unexpectedly dramatic changes. In a study directed at thequestion of the political significance of the African middle class, Wolpe argued that therehad been an 'enormous increase in the African middle class between 1960 and 1970'.14
Similarly, Simkins and Hindson presented evidence of 'substantial and increasing penetra-tion by "Coloureds", Asians and Africans' into 'clerical, white-collar technical andnon-manual' jobs and also noted an increase in the African share of 'skilled' employmentduring the 1970s.15 More recently, Charney has argued that, 'contrary to widespread belief,
9 M. Lipton, 'British Investment in South Africa: Is Constructive Engagement Possible?', South African LabourBulletin, 3, 3 (1976), p. 18; J. Nattrass, 'The Narrowing of Wage Differentials in South Africa', South AfricanJournal of Economics, 45, 4 (1977), p. 418.
10 M. Lipton, 'The Debate About South Africa: Neo-Marxists and neo-Liberals', African Affairs, 78, 310 (1979),p. 69; Nattrass, 'The Narrowing of Wage Differentials', p. 415.
11 Legassick and Innes, 'Capital Restructuring and Apartheid', pp. 443-447.12 R. Davies, 'Capital Restructuring and the Modification of the Racial Division of Labour in South Africa', Journal
of Southern African Studies, 5, 2 (1979), p. 194.13 S. Nolutshungu, Changing South Africa: Political Considerations (Cape Town, 1983), p. 116.14 H. Wolpe, 'The Changing Class Structure of South Africa: The African petit-bourgeoisie', P. Zarembka (ed.),
Research in Political Economy, Vol. 1: An Annual Compilation of Research (Greenwich, Connecticut, 1977),p. 153.
15 Simkins and Hindson, 'The Division of Labour in South Africa', p. 9. The occupational categories do not comprisethe same occupations as my categories of the same names.
Dow
nloa
ded
by [
Cor
nell
Uni
vers
ity L
ibra
ry]
at 1
7:25
03
Oct
ober
201
3
636 Journal of Southern African Studies
'the African petit bourgeoisie has in the past few decades been sizeable and rapidlygrowing'.16
To what extent were these differences of opinion on the changing racial division of laboura result of interpretation and to what extent were they due to different empirical findings?Clearly, there is always room for interpretation of the significance of the extent of Africanadvancement. This is clear from the contrasting positions of Davies, on the one hand, and ofCharney, Simkins and Hindson, on the other. Although these authors based their interpretationson basically similar evidence, they disagreed sharply on whether or not significant Africanadvancement had taken place or, indeed, would take place in the future (Table 1).
Notwithstanding these differences of interpretation, there were also substantial differ-ences in the empirical measurement of the size of the African middle class. WhereasNolutshungu's estimate of the size of the African middle class in 1970 was as low as121,948, Wolpe's estimate was over ten times as much at 1,315,800 (Table 1). Charney,Davies, Simkins and Hindson placed the size of the African middle class at about twice thesize estimated by Nolutshungu (Table 1). These widely divergent estimates of the size ofthe African middle class indicate that there was little agreement on the way that Africanadvancement should be conceptualised and measured.
There are two related reasons why these estimates of the size of the African middle classvary so widely. The first is that the conceptvial definitions of the middle class are notuniform and nor are they uniformly applied. Ths second is that certain official employmentstatistics are not readily translated into the categories demanded by class theories. As faras the conceptual definitions of the middle class are concerned most of these authors haverelied, to a greater or lesser extent, on the class theories proposed by Carchedi, Poulantzasand Wright. These class theories were developed to explain why large sections of thepopulations of advanced capitalist countries did not support working class political parties.As such, they placed particular emphasis on the boundary between the working class andwhat they variously termed the 'new middle class', the 'petty bourgeoisie' and 'semi-auton-omous employees'. Specifically, these models of class determination proposed a tighterdefinition of the working class which excluded, variously, managerial, non-manual, non-productive (tertiary sector) and semi-autonomous occupations from the working class.17
Depending upon which occupational classes they included in or excluded from the workingclass, so these theories produced different estimates of the size of the middle class. Themost striking example of this is provided by a comparison of Poulantzas' model, whichincludes all non-productive manual service workers in the middle class, and Wright's modelwhich includes them in the working class. As applied to South African employmentstatistics, Poulantzas' middle class is twice the size of Wright's middle class.18
Although these theories of class determination clearly influenced debates on the size ofthe African middle class in South Africa, they were not always faithfully applied byscholars. Wolpe, for example, relied on Carchedi's definition of the 'new middle class'which includes all those wage earners who peiform the 'global function of capital'. Such'new middle class' wage earners perform the tasks of surveillance and control, as well asthe otherwise proletarian 'function' of non-supervisory labour (be it in the state or servicesectors). It is odd, therefore, that on the basis of this definition Wolpe chose to include
16 C. Charney, 'Janus in Blackface? The African petit beurgeoisie in South Africa', Con-Text, 1, 1988, p. 7.17 G. Carchedi, 'On the Economic Identification of the New Middle Class', Economy and Society, 4, 1, 1975, pp.
1-86; N. Poulantzas, Classes in Contemporary Capitalism (London, 1975); E. Wright, 'Class Boundaries inAdvanced Capitalist Societies', New Left Review, 98 (1976), pp. 3-42.
18 O. Crankshaw, 'Theories of Class and the African "Middle Class" in South Africa, 1969-1983', AfricaPerspective, 1, 1&2 (1986), pp. 3-33; Davies, 'Capital Restructuring'; Wolpe, 'The Changing Class Structureof South Africa'.
Dow
nloa
ded
by [
Cor
nell
Uni
vers
ity L
ibra
ry]
at 1
7:25
03
Oct
ober
201
3
Racial Division of Labour 637
clerks, sales workers and service sector workers in the middle class, since these occupationshave no managerial or administrative functions of a supervisory or coercive character.Wolpe's middle class is in fact much closer to Poulantzas' classification which includes allservice sector and state employees in the middle class. Conversely, although Charneyexplicitly adopts Poulantzas' classification, he incorrectly excludes manual wage earners inthe service sector from the middle class.19 Davies and Nolutshungu do not explicitly usetheories of class to draw the boundary between the working and middle classes. Nonethe-less, their criteria are closer to the models of Carchedi and Wright. Davies excludednon-productive service sector wage earners from the middle class, but included clerical andsales workers. Nolutshungu's middle class is restricted to the Population Census definitionof 'Professional, Technical and Related Workers'. Since this definition excludes all clericaland sales workers as well as manual service sector occupations, his estimate of the Africanmiddle class is the lowest of all.
Wolpe's and Charney's inconsistent classification of service sector wage earners asmiddle class is partly explained by their reliance on the broad occupational categoriespublished in certain Population Census reports. There are two problems with theseoccupational categories that render these data most unsuitable for an analysis of Africanadvancement. First, some of the occupational groups are not only based on sectoral ratherthan occupational criterion, but they are also too broad for the application of neo-Marxistclass theories. Although the occupational categories of 'managerial, executive & adminis-trative' and 'professional, semi-professional & technical', as reported in the PopulationCensus, are unambiguously middle class according to these class theories, the categoriesof 'clerical & sales', 'transport, delivery & communication' and 'service, sport &recreation' comprise both middle class and working class occupations (as classified byPoulantzas' and Carchedi's models). The absolute employment figures provided by Wolpeand Davies differ because of the ways that they resolved this problem. Whereas Davieschose to include only three employment categories in his estimate of the size of theAfrican middle class, namely 'managerial, executive & administrative', 'professional,semi-professional & technical' and 'clerical & sales', Wolpe chose to include these threecategories as well as the category of 'service, sport & recreation'. As Wolpe noted, theoccupational category of 'service, sport & recreation' comprises a wide range of occupa-tions ranging from relatively skilled and well-paid occupations such as 'barber', 'under-taker' and 'photographer' to the least skilled and worst-paid service sector jobs such as'cleaner' and 'waiter'.20 This is also true, however, for the occupational category of'clerical & sales' which includes occupations as different as 'stockbroker' and 'petrolfilling station attendant'. Wolpe chose to include the 'service, sport & recreation' categoryon the basis that a significant proportion of these occupations are middle class in character.Equally, however, a great many of them are undoubtedly working class jobs and it istherefore quite reasonable to exclude this occupational category in order to avoidoverestimating the size of the African middle class. However, by doing so, one is still leftwith the problem of a large number of unskilled menial workers, such as 'petrol pumpattendants' who are included in the middle class. A further problem with the category of'service, sport & recreation' is that it is a very large occupational category: according toWolpe's estimate, this group alone makes up almost half of all 'new middle class'employment.
This review of existing estimates of the size of the African middle class suggests thatthere are two problems which have weakened the study of African occupational advance-
19 Charney, 'Janus in Blackface?', p. 7 footnote 1 and p. 8.20 Wolpe, 'The Changing Class Structure', p. 153.
Dow
nloa
ded
by [
Cor
nell
Uni
vers
ity L
ibra
ry]
at 1
7:25
03
Oct
ober
201
3
638 Journal of Southern African Studies
ment in South Africa. The first is that the use of neo-Marxist class theories to classifyoccupations is quite inappropriate. This is because they generate broadly-defined classesthat simply do not provide the detail that is required for an understanding of the preciseways in which the racial division of labour may be eroding in South Africa. Clearly, in astudy of racial inequality it would be crucial to know whether or not the increase of theAfrican middle class was due, for example, to the expansion of African employment inteaching and nursing jobs or in middle management jobs. Without such information it isimpossible to draw reliable comparisons of the African middle class with its whitecounterpart, since their occupational compositions might differ substantially. Anotherproblem with using these broadly-defined occupational classes is that they compriseoccupations which are often reproduced by entirely different, and even contradictory,processes. For example, the working class comprises unskilled manual labourers, semi-skilled machine operatives and skilled artisans. The fortunes of these different occupationalgroups within the working class have undergone important shifts with the development ofcapitalist production from simple manufacture to machinofacture, yet class theories take noaccount of these changes.
The second problem that has bedevilled the study of African advancement is the systemof occupational classification which has been followed in official publications. Althoughquite different from the occupational categories generated by neo-Marxist class theory, theofficial classification scheme suffers from similar limitations. Both these problems will bediscussed in turn below.
Class Theory and Occupational StructureAt face value, neo-Weberian class schemes such as that proposed by Goldthorpe wouldappear to be more suitable for the study of African advancement because they use a moredetailed occupational breakdown than most neo-Marxist models.21 A further advantage ofGoldthorpe's scheme is that, unlike those of Marxist scholars, it retains occupationaldescriptions as the basis for allocating individuals to different classes. Since the ManpowerSurveys are based on occupational descriptions, this method suits the terms of my study.However, the disadvantage of Goldthorpe's scheme is that occupations are grouped togethersolely on the basis of the similarity or dissimilarity of the market and work situations oftheir incumbents.22 Although this method is quite acceptable for classifying occupationswithin an occupational structure, it does not provide any basis for understanding how theoccupational structure is itself reproduced and changed. Since the study of Africanadvancement should be able to offer an explanation of trends in the racial division oflabour, I have turned to labour process theory and research for insights into how thedynamics of capitalist production have shaped the division of labour.
Unlike neo-Marxist and neo-Weberian models of class structure, labour process theoryapproaches the problem of class boundaries from the point of view of the labour processand how its dynamics develop and change the division of labour.23 For example, althoughBraverman's seminal study of the labour process was concerned with understanding thestructure of the working class, his approach was to investigate how the class boundary ofthe proletariat has been shaped historically by changes in the organisation of work.24 In
21 J. Goldthorpe, Social Mobility and Class Structure in Modern Britain, 2nd edn (Oxford, 1987), pp. 40-43.22 Goldthorpe, Social Mobility and Class Structure, p. 40.23 G. Mackenzie, 'Class Boundaries and the Labour Process', in A. Giddens and G. Mackenzie (eds), Social Class
and the Division of Labour (Cambridge, 1982), pp. 76-77.24 H. Braverman, Labor and Monopoly Capital: The Degradation of Work in the Twentieth Century (New York,
1974), p. 25.
Dow
nloa
ded
by [
Cor
nell
Uni
vers
ity L
ibra
ry]
at 1
7:25
03
Oct
ober
201
3
Racial Division of Labour 639
summary, Braverman argues that, in pursuit of higher productivity, the organisation ofproduction has been transformed by the ever-increasing division of labour whereby tasksare sub-divided into increasingly simpler and more routine tasks. The de-skilling of workby this process of fragmentation has been accompanied by both mechanisation and agrowing division of labour between the conception, management and execution of work.Braverman's formulation therefore provides a rationale for identifying divisions betweenartisans, semi-skilled machine operators and unskilled manual labourers employed in theprimary and secondary sectors. Similarly, his scheme also identifies the emergence in thetwentieth century of routine white-collar workers as a class distinct from managers andcommercial professionals such as accountants.25
Mackenzie has argued that these insights into the way that labour process dynamicsshape the division of labour can be enriched by an understanding of how segmented labourprocesses give rise to segmented labour markets.26 Such an approach to understanding howthe division of labour in production gives rise to distinct labour markets is found in thework of Edwards who argues that the labour process creates the demand for workers withdifferent levels of education and skill. So, although these different levels of education andskill determine the individual's position in the labour market, they are nonetheless rootedin workplace dynamics.27 Edwards' theory of labour market segmentation has been used byWebster to understand the labour market in South African foundries. On the basis of hisresearch into the organisation of work in the foundries, Webster identified important labourmarket divisions between (i) unskilled and lower semi-skilled African manual labourers, (ii)higher semi-skilled coloured machine operatives and (iii) skilled white artisans. Mostimportantly, for the purposes of this discussion, Webster showed how these three labourmarkets were structured by the organisation of production and forms of managerial controlin the workplace.28
This brief tour of the debates on class structure has come full circle. Since Edwards'formulation of how to understand and operationalise class divisions is concerned with bothworkplace and labour market dynamics, it has a lot in common with class schemesadvanced by neo-Weberian scholars. Indeed, the class schemes which one would constructon the basis of these different approaches differ largely in terms of the emphasis on thecauses of the class structure rather than its form. On this basis I have chosen to pursue aneclectic classification scheme which incorporates both workplace and labour marketdynamics. I have therefore classified all occupations listed by the Manpower Surveysaccording to two types of criteria. The first is concerned with labour market conditionswhich control access to employment in specific occupations. These conditions are, effec-tively, the level of education, training and experience which is required for particularoccupations as well as racially restrictive legislation which prevented the employment ofAfricans in specific jobs. The second type of criteria are those concerned with workplacedynamics. These include differences between managers and non-managers as well asbetween different levels of management. They also consider the divisions which are causedby the formation, growth and decline of positions within the division of labour. The firsttype of criterion is therefore closer to that used in a neo-Weberian model of class structurethan in a neo-Marxist one. This is because neo-Weberian models are concerned toincorporate the dynamics of market forces which structure the individual's access to
25 Braverman, Labor and Monopoly Capital, chaps 8-10, 15.26 Mackenzie, 'Class Boundaries and the Labour Process', p. 85.27 R. Edwards, Contested Terrain: The Transformation of the Workplace in the Twentieth Century (New York,
1979), chaps 9, 10.28 Webster, Cast in a Racial Mould, pp. 195-206.
Dow
nloa
ded
by [
Cor
nell
Uni
vers
ity L
ibra
ry]
at 1
7:25
03
Oct
ober
201
3
640 Journal of Southern African Studies
different types of work. The second type of criterion is seldom discussed under the rubricof class theory, however. Instead, the most useful contributions on the social dynamicswhich change the division of labour are usually termed 'labour process' studies and arecloser to neo-Marxist concerns.
South African Employment StatisticsThus far I have been concerned to identify the conceptual problems of measuring Africanadvancement. As mentioned earlier, however, conceptual problems in the definition ofoccupational groups are not the only obstacle to the analysis of African advancement. Thelimitations of the occupational groups reported in official publications also pose severelimitations for this sort of study. The official convention, until recently, classified occupa-tions into only eight broad groups. To disaggregate these occupational categories intosmaller units requires complete re-analysis of the original data sets. This is a time-consum-ing and expensive exercise which involves specialist programming skills and is thereforenot one that can be readily undertaken by most sociologists. However, I have been fortunateto have access to the facilities and the specialist expertise necessary to undertake this task.Specifically, this has involved access to the Manpower Survey data tapes, a mainframecomputer and the skills of specialist computer programmers. The aim of my analysis of theManpower Survey data was to classify the 600-odd occupations into categories whichwould reflect sensitively the changes brought about by the dynamics of economic growthand apartheid labour policies. This technique therefore provided quantitative results whichallowed me to identify the detailed pattern of African advancement which would providethe basis for an explanation of these trends.
Altiiough the Manpower Surveys are the only source of quantitative information whichprovides occupational details of employment :?ince the mid-1960s, their coverage is notcomprehensive. Specifically, the sample does not include the agricultural sector nor does itinclude domestic servants employed by individual households. A further limitation is thatcompanies and Government bureaucracies within the boundaries of the so-called 'indepen-dent' homelands were excluded from the survey: Bophuthatswana and Transkei wereexcluded from 1979 and Venda and the Ciskei were excluded, respectively, from 1981 and1983.29
Apart from these weaknesses, however, the Manpower Surveys are the most suitablesource for studying long-term changes in the occupational and racial division of labour.Quite uniquely, these surveys record employment by race and sex for some 600 occupa-tions. Furthermore, they are the only source for this complete period which distinguishes theemployment of artisans and apprentices from other manual occupations. Another importantfeature of the surveys is that they are conducted biennially, which allows for a preciseperiodisation of changes in the occupational and racial division of labour. The surveysample is based on official lists of companies, namely those of the Compensation Fund andthe Unemployment Commissioner. The Manpower Surveys were conducted by the Depart-ment of Manpower from 1965 to 1985. From 1987, the Surveys were conducted by theCentral Statistical Service. When the surveys were managed by the Department ofManpower, the sample of companies was 250,000. After the Central Statistical Service tookover, the sample was rationalised in 1989 to 12,800 companies. Since the questionnaire is
29 Summary of the Results of Manpower Survey No. 13, 27th April 1979: All Industries and Occupations(Department of Manpower, Pretoria, 1980), p. 1; Summary of the Results of Manpower Survey No. 14, 24th April1981: All Industries and Occupations (Department of Manpower, Pretoria, 1982), p. 1; Summary of the Resultsof Manpower Survey No. 15, 29th April 1983: All Industries and Occupations (Department of Manpower,Pretoria, 1984), p. 1.
Dow
nloa
ded
by [
Cor
nell
Uni
vers
ity L
ibra
ry]
at 1
7:25
03
Oct
ober
201
3
Racial Division of Labour 641
sent to company managers, the realisation rate of the sample is very high and usuallyapproaches 90 per cent.30 As far as the reliability of the Manpower Surveys are concerned,the results clearly show some movement in employment levels which must reflect surveyerrors rather than real changes in employment.31 However, these fluctuations are onlymarked in the most recent survey results and therefore do not vitiate the long-term trendswhich remain evident.
The published reports of the Manpower Surveys provide useful aggregations of greateroccupational detail than Population Census reports of the same period by distinguishingbetween artisans, semi-skilled operatives and unskilled (heavy) manual labourers. However,clerical and sales workers of all kinds are grouped together as are many non-manual andsupervisory jobs in the service and transport sectors. In addition, managers, professionals,semi-professionals and technicians are also grouped together. In order to improve on thisclassification system, I have allocated each occupation to one of the following categories:
(a) top management;(b) middle management;(c) supervisors and foremen;(d) professionals;(e) semi-professionals;(f) routine white-collar workers;(g) routine security and protection workers;(h) menial service workers;(i) artisans and apprentices;(j) machine operatives and semi-skilled workers;(k) unskilled manual labourers.
Through this classification I have aimed to provide a breakdown of employment byoccupation which would not be so complex that it would be difficult to interpret, but wouldnonetheless distinguish between occupations which are affected in different ways bychanges in the demand and supply of labour. It is worth discussing the rationale for thissystem of classification because such a discussion provides important background infor-mation on the composition of each of these categories.
Managers, Professionals and Semi-Professionals
Most scholars who have analysed South African employment statistics prefer to group'managers', 'professionals' and 'semi-professionals' into a single occupational category.32
This is partly because this is the form in which the Manpower Survey and PopulationCensus data are published. However, there are important reasons why these occupationsshould be distinguished from one another. In the first place, there are substantial differencesin the roles that these occupations play in the division of labour and also in the salaries thatthey attract. Many 'semi-professionals' are teachers, nurses or technicians. Compared tomanagerial and 'professional' occupations, these jobs are poorly paid and offer limitedprospects of upward occupational mobility. Managerial jobs are also distinguished by their
30 This information is based on an interview conducted by Doug Hindson and myself with Mrs Brelage at theDepartment of Manpower and Mrs de Jager at the Central Statistical Service, Pretoria.
31 A. Roukens de Lange, Manpower Supply and Demand in South Africa: A Study of Trends and Interactions withthe Economy (Institute for Futures Research, University of Stellenbosch, 1992), p. 23.
32 Report of the National Manpower Commission on High-level Manpower in South Africa, pp. 5, 7, 13-18; Roukensde Lange, Employment in South Africa, p. 33; Wolpe, 'The Changing Class Structure of South Africa', p. 153.
Dow
nloa
ded
by [
Cor
nell
Uni
vers
ity L
ibra
ry]
at 1
7:25
03
Oct
ober
201
3
642 Journal of Southern African Studies
role of leadership and command: a role which, more than any other occupation, isinfluenced by the racial hierarchy of South African society at large. In the second place,these occupations are also distinguished by the kinds of qualifications required for entry. Incontrast to 'professional' jobs which require at least one university degree, most 'semi-pro-fessional' jobs require only a diploma from teaching, nursing or technical colleges. Thisdistinction between 'professionals' and 'semi-professionals' is not so much one of thequality or type of training but of access to these different tertiary institutions. Not only areentrance requirements to colleges lower than those of universities, but finance to study atcolleges is also more readily available. Similarly, unlike 'professional' and 'semi-pro-fessional' jobs, many managerial jobs do not require tertiary certification.
This system of classification also distinguishes the front-line management jobs of'supervisor and foremen' from 'middle management' and 'top management'. The mainreason for distinguishing these occupations is that they entail substantially different levelsof education, skill and authority. Consequently, the racial composition of these differentclasses of management is substantially different.
Routine White-Collar and Security Workers
White-collar occupations of a routine character are usually classified within a broadercategory which includes all non-'managerial' and non-'professional' occupations in thesales, commercial and financial sectors. The we;ikness of this classification is that a numberof certificated employees, such as stockbrokers;, estate agents and insurance salespersons,are not distinguished from ordinary clerical workers, cashiers, shop assistants and switch-board operators. There are many reasons for distinguishing the former group from the latter,not least of which are differences in earnings. However, the criterion which I have appliedto make this distinction is whether or not the occupation requires post-matric certification.It is commonly the case that many high-level sales jobs require in-house training andcertification. In addition, such training and certification is sometimes controlled by 'pro-fessional' associations rather than by state-run tertiary educational institutions.33 All'routine white-collar' jobs in my classification are therefore jobs which require a Standard8 or matric certificate. Other commercial or sales occupations which require post-matriccertification are grouped with other 'semi-professionals'. Finally, I have chosen to dis-tinguish 'routine security and protection workers' from 'semi-professional' and 'routinewhite-collar' workers. These occupations include non-managerial occupations in the policeand defence forces and in fire and rescue departments.
Artisans, Semi-Skilled Operatives and Unskilled Labourers
One of the advantages of using the data supplied by the Manpower Surveys is that theydistinguish between employment in the skilled trades, in machine operative work and inunskilled jobs.34 The importance of these distinctions to an analysis of the changing racialand occupational division of labour cannot be: underestimated. As individual employershave sought to increase their productivity by investing in more capital-intensive methods of
33 For example, the Training Institute of Personnel Consultants which offers a one year diploma. My Career/MyLoopbaan 1991 (Department of Manpower, Pretoria, 1991), p. 757.
34 As I will use them here, the terms 'skilled', 'semi-skilled' and 'unskilled' do not refer to the ability or skill ofworkers but to the kinds of work that they do. Even 'unskilled' workers exercise a variety of skills in their work.My choice of these terms is constrained by convention which uses them to refer to particular places in a divisionof labour: E. Webster, and J. Leger, 'Reconceptualising Skill Formation in South Africa', Perspectives inEducation, 13, 2 (1992), p. 54.
Dow
nloa
ded
by [
Cor
nell
Uni
vers
ity L
ibra
ry]
at 1
7:25
03
Oct
ober
201
3
Racial Division of Labour 643
production, so the demand for labour has changed. The pre-capitalist labour process whichwas based on a division of labour between skilled artisans and unskilled manual labourershas been transformed into one which is today based on a division of labour dominated bysemi-skilled machine operatives. This transformation lies at the heart of an understandingof the relationship between racial and class relationships in the manufacturing, constructionand mining sectors in South Africa. Curiously, with only some exceptions, this importantdivision between machine operative and unskilled heavy manual labour has been over-looked by statisticians and economists. Where the distinction between machine operativeand unskilled manual employment has been made, unskilled manual labourers are groupedwith unskilled service sector workers.35 The error in this categorisation is that theemployment of cleaners and servants in the service sector is conflated with the employmentof manual labourers in the mining, manufacturing and construction industries. Clearly,trends in the employment of these two types of unskilled labour are governed by quitedifferent processes. For this reason I have created a separate category of 'menial serviceworkers' to distinguish them from 'unskilled manual labourers'.
The Extent of African AdvancementThe application of this occupational classification to the results of the Manpower Surveysprovides the following contribution to the debate on African advancement during theapartheid period. First, by distinguishing semi-professional occupations from the moregeneral category of professional, technical and related employment, a more qualifiedestimate of African advancement into the ranks of the professionals is possible. Second, bydistinguishing routine white-collar wage earners from menial, professional and othernon-manual wage earners in the financial, commercial and service sectors, this analysisprovides a reliable estimate of the extent of African advancement into these occupations.Third, by isolating skilled artisans/apprentices and semi-skilled machine operatives fromother occupations which are loosely defined as 'skilled' and 'semi-skilled', this analysisprovides a basis for understanding the forces which retarded the advancement of Africansinto the skilled trades.
Managerial, Professional and Semi-Professional Employment
By drawing a distinction between professional and semi-professional occupations, thisanalysis shows just how uneven the advancement of Africans into these occupations hasbeen. The almost insignificant extent of African advancement into managerial and pro-fessional occupations (at a mere 3 and 11 per cent, respectively, in 1990) contrasts with theextensive advancement of Africans into semi-professional occupations. The African pro-portion of semi-professional employment grew from 24 per cent in 1965 to 41 per cent, alevel that was only 4 per cent less than the white proportion of semi-professionals (Figure1). These results therefore indicate the importance of distinguishing between professionaland semi-professional occupations in order to understand the significance and the causes ofAfrican advancement. On the face of it, Wolpe's early finding that 28 per cent of'professional, technical and related' wage earners were African by 1970 does appearunlikely. Once the pattern of African employment in the professions is revealed, thisbecomes much easier both to interpret and to understand.
35 A. Roukens de Lange, and P. Van Eeghen, Employment in South Africa: Evaluation and Trend Analysis (Institutefor Futures Research, Bellville, 1984), p. 33.
Dow
nloa
ded
by [
Cor
nell
Uni
vers
ity L
ibra
ry]
at 1
7:25
03
Oct
ober
201
3
644 Journal of Southern African Studies
100 J
90 --
8 0 - •
70 --
a, 6° +ag 50
£ 40
3 0 - •
20 --
10 -
1 "" Whites
- - - - - - Coloureds
^ ~ ~ ^ ^ ~ Africans
~~ — "~ ~ Indians
•+-vt t - o \ r*\D VO VO f-ON ON ON ON
S 5
Years
Trends with estimates for employment in Transkei, Bophuthatswana, Venda andCiskei included.
A detailed examination of the 1990 Manpower Survey results for semi-professionalemployment shows that, as a proportion of total employment in each occupation, highproportions of Africans are found only in the occupations of 'nurse' (43 per cent), 'matron'(23 per cent), 'schoolteacher' (54 per cent), 'school principal/inspector' (62 per cent),'priest' (29 per cent) and 'technician's assistant' (20 per cent). By contrast, Africanemployment in the occupations of 'pharmacist', 'technician', 'technologist', 'computerprogrammer' and 'unregistered accountant' does not exceed 4 per cent of all employmentin these occupations (Table 2). The relatively large proportion of Africans who areemployed in semi-professional occupations is therefore mainly a function of the highnumbers of African schoolteachers and nurses. Since most teachers and nurses areemployed in state schools and hospitals, these results therefore show that the state playedan important role in expanding semi-professional employment for Africans.
At first glance, this pattern of employment distribution, in which Africans are restrictedto only a limited number of occupations, does seem to contradict the general finding thatthere has been extensive African advancement into semi-professional employment as awhole. The reason for this apparent contradiction is that a high proportion of semi-profes-sionals of all races is employed as school teachers, technicians or nurses. In 1990, schoolteachers, principals and inspectors made up 36 per cent of all semi-professional employ-ment.36 Technicians made up 17 per cent and nurses made up 14 per cent. Altogether, these
36 This proportion only increases to 37 per cent of all semi- professional employment if an estimate of employmentin the 'National States' of Transkei, Bophuthatswana Venda and Ciskei is included.
Dow
nloa
ded
by [
Cor
nell
Uni
vers
ity L
ibra
ry]
at 1
7:25
03
Oct
ober
201
3
Racial Division of Labour 645
Table 2. Racial and sexual division of labour across semi-professional occupations, 1990 (percentage distribution)
three occupations therefore account for just over two thirds (67 per cent) of all semi-pro-fessional employment.
In addition to inequalities in the racial division of labour within semi-professionalemployment revealed by the Manpower Survey data, there is also significant inequalitybetween black and white school-teachers. Apart from the fact that it was state policy untilthe late 1970s to pay African, coloured and Indian school-teachers less than whiteschool-teachers, it is also true that white teachers on average hold higher educationalqualifications than teachers of other races and, accordingly, receive higher salaries. By 1982only 3 per cent of all white school-teachers did not hold at least a post-matric teachingdiploma. In contrast 85 per cent of all African school-teachers did not hold such aqualification.37 Although the educational profile of African school-teachers has improvedsubstantially since then, by the late 1980s 42 per cent still did not hold a post-matricteaching diploma or degree. Instead, these less qualified teachers have usually completedonly standard 8 and a short teaching diploma or, alternatively, have completed matric buthave not completed a teaching diploma.38
Routine White-Collar Employment
This analysis of the Manpower Survey data suggests that the African proportion of routinewhite-collar employment doubled between 1965 and 1990, rising from 15 per cent to 31 percent (Figure 2). In absolute terms, the numbers of African wage earners in routine
37 This figure excludes employment in the Transkei, Bophuthatswana, Venda and Ciskei: Survey of Race Relationsin South Africa: 1982 (South African Institute of Race Relations, Johannesburg, 1983), p. 466.
38 These estimates are based on 1988 data published in: Race Relations Survey: 1988/89 (South African Instituteof Race Relations, Johannesburg, 1989), pp. 839-841. Figures for Bophuthatswana, Venda and Ciskei pertainingto 1991 were supplied by the Institute for Education Planning, University of the Orange Free State.
Dow
nloa
ded
by [
Cor
nell
Uni
vers
ity L
ibra
ry]
at 1
7:25
03
Oct
ober
201
3
646 Journal of Southern African Studies
90 -
80 -
70 -
60 -
50 -
40 -
30 -
20 -
10 -
0 -
L—-—-—- i.-i'—"— ~ — - " * - • —
• i ' i ' i • i ' i • i •
- - a - "
—
y—i—L_.—1—i 1 . 1—.—1—.
Whites
—~^~^^~ Africans
Coloureds
""" ~~ Indians
Years
Trends with estimates for employment in Transkei, Bophuthatswana, Venda andCiskei included.
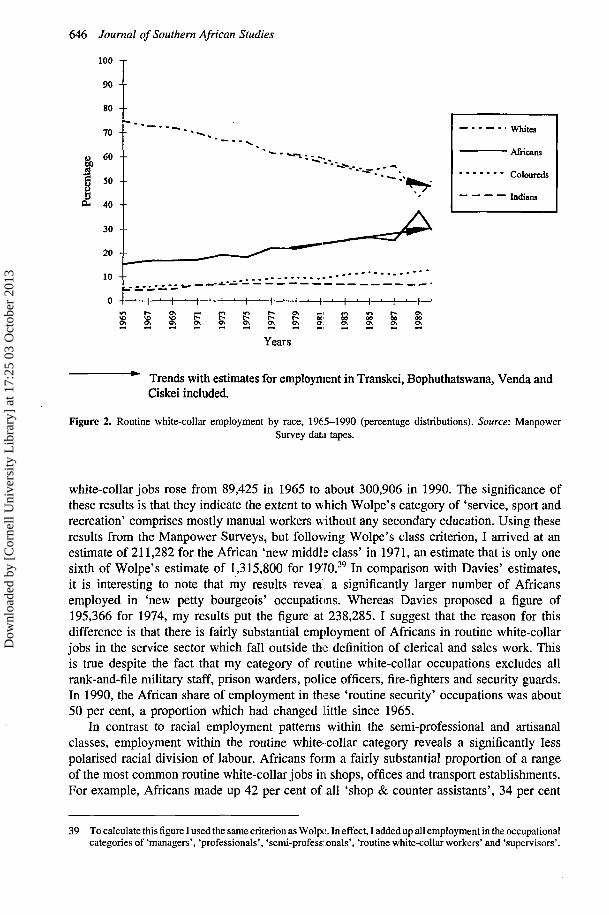
Figure 2. Routine white-collar employment by race, 1965-1990 (percentage distributions). Source: ManpowerSurvey data tapes.
white-collar jobs rose from 89,425 in 1965 to about 300,906 in 1990. The significance ofthese results is that they indicate the extent to which Wolpe's category of 'service, sport andrecreation' comprises mostly manual workers without any secondary education. Using theseresults from the Manpower Surveys, but following Wolpe's class criterion, I arrived at anestimate of 211,282 for the African 'new middls class' in 1971, an estimate that is only onesixth of Wolpe's estimate of 1,315,800 for 1970.39 In comparison with Davies' estimates,it is interesting to note that my results reveal a significantly larger number of Africansemployed in 'new petty bourgeois' occupations. Whereas Davies proposed a figure of195,366 for 1974, my results put the figure at 238,285. I suggest that the reason for thisdifference is that there is fairly substantial employment of Africans in routine white-collarjobs in the service sector which fall outside the definition of clerical and sales work. Thisis true despite the fact that my category of routine white-collar occupations excludes allrank-and-file military staff, prison warders, police officers, fire-fighters and security guards.In 1990, the African share of employment in these 'routine security' occupations was about50 per cent, a proportion which had changed little since 1965.
In contrast to racial employment patterns within the semi-professional and artisanalclasses, employment within the routine white-collar category reveals a significantly lesspolarised racial division of labour. Africans foim a fairly substantial proportion of a rangeof the most common routine white-collar jobs in shops, offices and transport establishments.For example, Africans made up 42 per cent of all 'shop & counter assistants', 34 per cent
39 To calculate this figure I used the same criterion as Wolpe. In effect, I added up all employment in the occupationalcategories of 'managers', 'professionals', 'semi-professionals', 'routine white-collar workers' and 'supervisors'.
Dow
nloa
ded
by [
Cor
nell
Uni
vers
ity L
ibra
ry]
at 1
7:25
03
Oct
ober
201
3
Racial Division of Labour 647
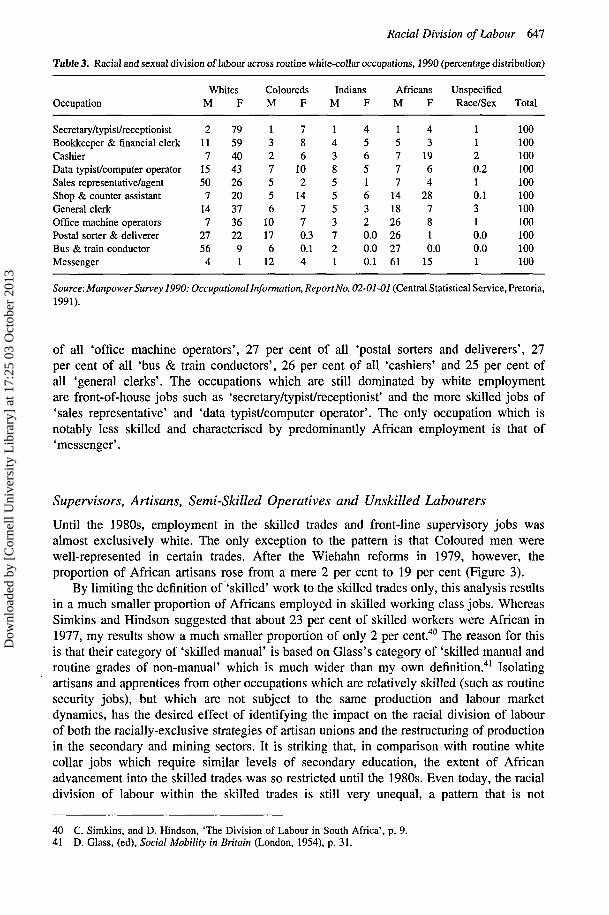
Table 3. Racial and sexual division of labour across routine white-collar occupations, 1990 (percentage distribution)
of all 'office machine operators', 27 per cent of all 'postal sorters and deliverers', 27per cent of all 'bus & train conductors', 26 per cent of all 'cashiers' and 25 per cent ofall 'general clerks'. The occupations which are still dominated by white employmentare front-of-house jobs such as 'secretary/typist/receptionist' and the more skilled jobs of'sales representative' and 'data typist/computer operator'. The only occupation which isnotably less skilled and characterised by predominantly African employment is that of'messenger'.
Supervisors, Artisans, Semi-Skilled Operatives and Unskilled Labourers
Until the 1980s, employment in the skilled trades and front-line supervisory jobs wasalmost exclusively white. The only exception to the pattern is that Coloured men werewell-represented in certain trades. After the Wiehahn reforms in 1979, however, theproportion of African artisans rose from a mere 2 per cent to 19 per cent (Figure 3).
By limiting the definition of 'skilled' work to the skilled trades only, this analysis resultsin a much smaller proportion of Africans employed in skilled working class jobs. WhereasSimkins and Hindson suggested that about 23 per cent of skilled workers were African in1977, my results show a much smaller proportion of only 2 per cent.40 The reason for thisis that their category of 'skilled manual' is based on Glass's category of 'skilled manual androutine grades of non-manual' which is much wider than my own definition.41 Isolatingartisans and apprentices from other occupations which are relatively skilled (such as routinesecurity jobs), but which are not subject to the same production and labour marketdynamics, has the desired effect of identifying the impact on the racial division of labourof both the racially-exclusive strategies of artisan unions and the restructuring of productionin the secondary and mining sectors. It is striking that, in comparison with routine whitecollar jobs which require similar levels of secondary education, the extent of Africanadvancement into the skilled trades was so restricted until the 1980s. Even today, the racialdivision of labour within the skilled trades is still very unequal, a pattern that is not
40 C. Simkins, and D. Hindson, 'The Division of Labour in South Africa', p. 9.41 D. Glass, (ed), Social Mobility in Britain (London, 1954), p. 31.
Dow
nloa
ded
by [
Cor
nell
Uni
vers
ity L
ibra
ry]
at 1
7:25
03
Oct
ober
201
3
648 Journal of Southern African Studies
1
90 -
80 -
70 -
60 -
50 -
40 -
30 -
20 -
10 -
0 -
-
**>
i— i— T— • r • K * ' i ' T '
\
' 1 ' 1 ' 1 ' 1 ' 1 ' 1 '
Whites
" " " " " " " Coloured^
~~~~~ Africans
"" — ~" "~ Indians
<n t*» O\ ^^ f j >n
Gn w OS O\ ON V\
Years
Figure 3. Artisanal employment by race, 1965-1990 (percentage distributions). Source: Manpower Survey data tapes.
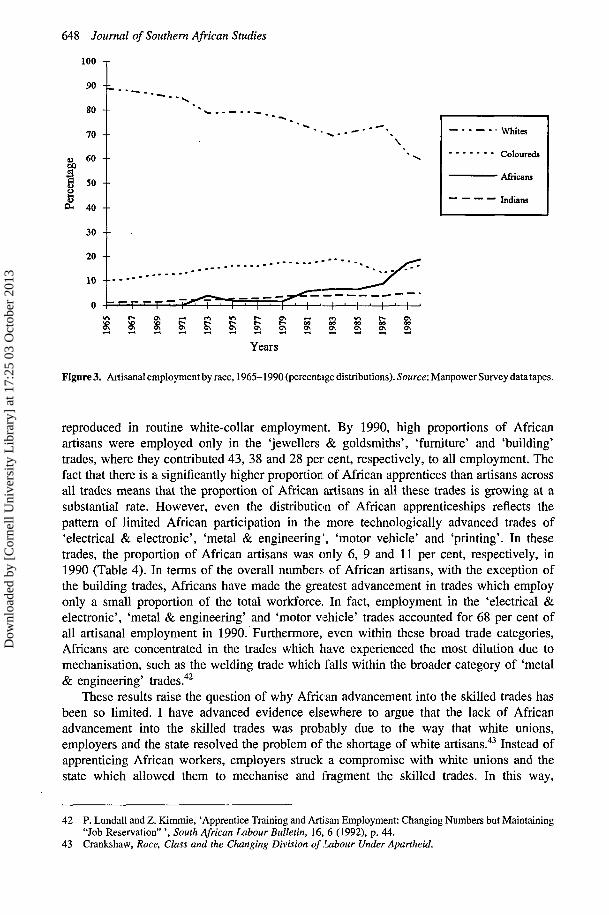
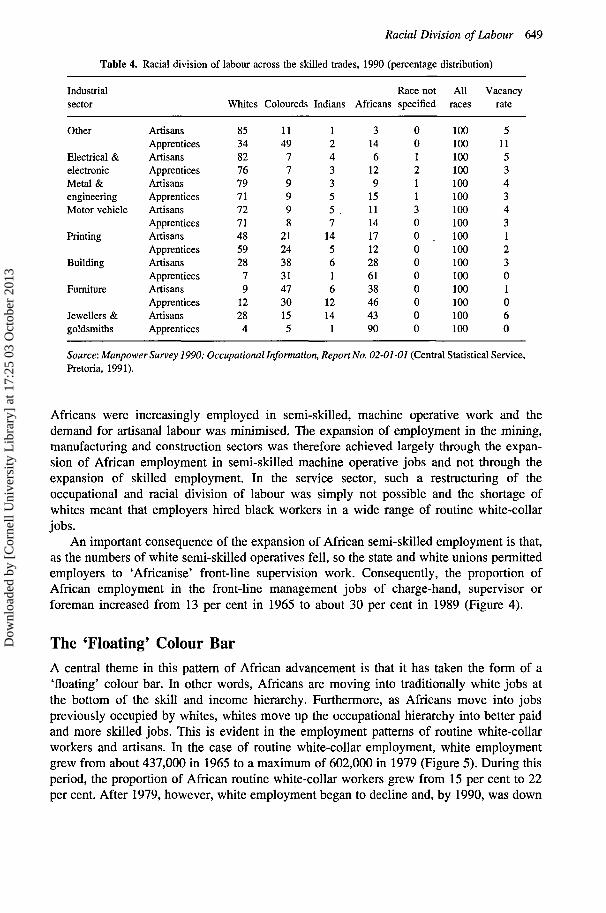
reproduced in routine white-collar employment. By 1990, high proportions of Africanartisans were employed only in the 'jewellers & goldsmiths', 'furniture' and 'building'trades, where they contributed 43, 38 and 28 per cent, respectively, to all employment. Thefact that there is a significantly higher proportion, of African apprentices than artisans acrossall trades means that the proportion of African artisans in all these trades is growing at asubstantial rate. However, even the distribution of African apprenticeships reflects thepattern of limited African participation in the more technologically advanced trades of'electrical & electronic', 'metal & engineering', 'motor vehicle' and 'printing'. In thesetrades, the proportion of African artisans was only 6, 9 and 11 per cent, respectively, in1990 (Table 4). In terms of the overall numbers, of African artisans, with the exception ofthe building trades, Africans have made the greatest advancement in trades which employonly a small proportion of the total workforce. In fact, employment in the 'electrical &electronic', 'metal & engineering' and 'motor vehicle' trades accounted for 68 per cent ofall artisanal employment in 1990. Furthermore, even within these broad trade categories,Africans are concentrated in the trades which have experienced the most dilution due tomechanisation, such as the welding trade which falls within the broader category of 'metal& engineering' trades.42
These results raise the question of why African advancement into the skilled trades hasbeen so limited. I have advanced evidence elsewhere to argue that the lack of Africanadvancement into the skilled trades was probably due to the way that white unions,employers and the state resolved the problem of the shortage of white artisans.43 Instead ofapprenticing African workers, employers struck a compromise with white unions and thestate which allowed them to mechanise and fragment the skilled trades. In this way,
42 P. Lundall and Z. Kimmie, 'Apprentice Training and Artisan Employment: Changing Numbers but Maintaining"Job Reservation" ', South African Labour Bulletin, 16, 6 (1992), p. 44.
43 Crankshaw, Race, Class and the Changing Division of Labour Under Apartheid.
Dow
nloa
ded
by [
Cor
nell
Uni
vers
ity L
ibra
ry]
at 1
7:25
03
Oct
ober
201
3
Racial Division of Labour 649
Table 4. Racial division of labour across the skilled trades, 1990 (percentage distribution)
Africans were increasingly employed in semi-skilled, machine operative work and thedemand for artisanal labour was minimised. The expansion of employment in the mining,manufacturing and construction sectors was therefore achieved largely through the expan-sion of African employment in semi-skilled machine operative jobs and not through theexpansion of skilled employment. In the service sector, such a restructuring of theoccupational and racial division of labour was simply not possible and the shortage ofwhites meant that employers hired black workers in a wide range of routine white-collarjobs.
An important consequence of the expansion of African semi-skilled employment is that,as the numbers of white semi-skilled operatives fell, so the state and white unions permittedemployers to 'Africanise' front-line supervision work. Consequently, the proportion ofAfrican employment in the front-line management jobs of charge-hand, supervisor orforeman increased from 13 per cent in 1965 to about 30 per cent in 1989 (Figure 4).
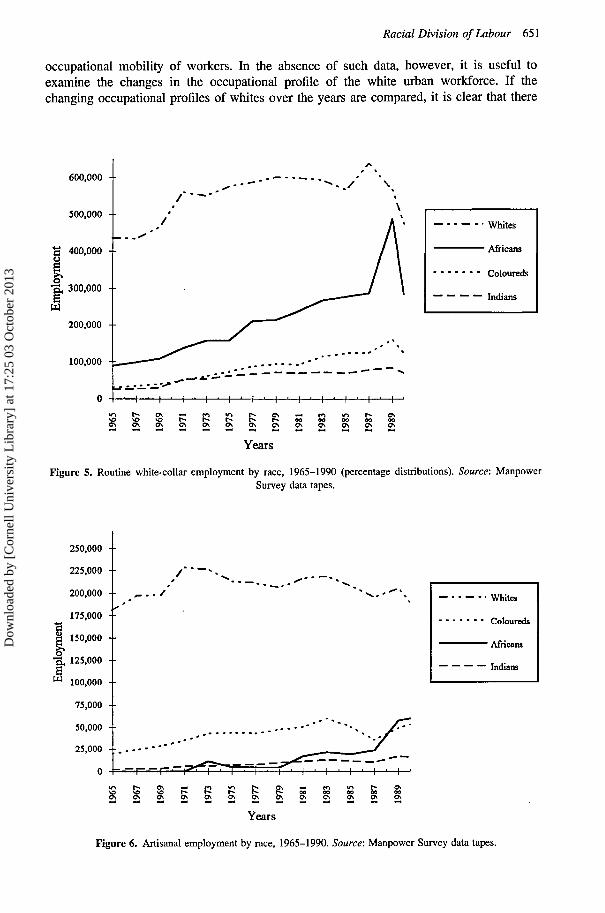
The 'Floating' Colour BarA central theme in this pattern of African advancement is that it has taken the form of a'floating' colour bar. In other words, Africans are moving into traditionally white jobs atthe bottom of the skill and income hierarchy. Furthermore, as Africans move into jobspreviously occupied by whites, whites move up the occupational hierarchy into better paidand more skilled jobs. This is evident in the employment patterns of routine white-collarworkers and artisans. In the case of routine white-collar employment, white employmentgrew from about 437,000 in 1965 to a maximum of 602,000 in 1979 (Figure 5). During thisperiod, the proportion of African routine white-collar workers grew from 15 per cent to 22per cent. After 1979, however, white employment began to decline and, by 1990, was down
to 475.000.44 In contrast, African employment continued to grow in both absolute andrelative terms to about 301,000 in 1990. The decline of white employment in the skilledtrades began much earlier. The employment of white artisans increased steadily during the1960s, reaching its zenith at 228,000 in 1971 (Figure 6). Thereafter white employmentdeclined slowly to about 190,000 in 1990. Most of the further growth in employment ofartisans, which continued until 1983, was supplied by coloured and African labour.
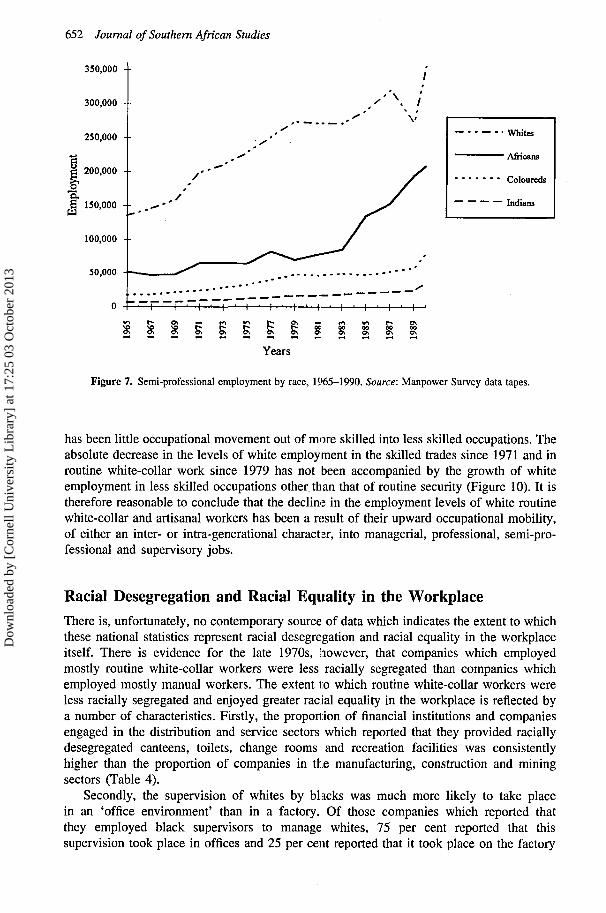
There are also indications of such trends in the employment of supervisors and routinesecurity work, but the results are inconclusive. In the case of supervisors, this is becausethe dramatic decline in African employment and corresponding rise in white employmentafter 1987 is probably the result of survey error.45 In the case of routine securityemployment the trends are only evident from 1983 to 1987. After 1987, the figures forwhite employment are probably also wrong. The exceptions to this pattern of 'blackeningfrom below' are employment trends in semi-professional, professional and managerialemployment in which increased African employment has been associated with increases inwhite employment (Figures 7-9).
These trends in absolute employment levels therefore suggest that African advancementinto artisanal and white-collar employment is; being accompanied by the movement ofwhites into more skilled and better-paid occupations. Of course, the limitation of theseemployment data is that they do not provide any insight into the inter- or intra-generational
44 The 1987 figure of 636,670 for white employment is an outlier to the general trend and is probably due to surveyerror.
45 This occupational category comprises relatively few occupations with the result that changes in occupationaldefinitions or even survey errors result in large fluctuations. Moreover, a new sample was drawn by the CentralStatistical Service when they took over the Manpower Survey from the Department of Manpower in 1987. Thisis probably the cause of the discontinuities in the series.
Dow
nloa
ded
by [
Cor
nell
Uni
vers
ity L
ibra
ry]
at 1
7:25
03
Oct
ober
201
3
Racial Division of Labour 651
occupational mobility of workers. In the absence of such data, however, it is useful toexamine the changes in the occupational profile of the white urban workforce. If thechanging occupational profiles of whites over the years are compared, it is clear that there
5
600,000 •
500,000 -
400,000 -
300,000 -
200,000 -
100,000 -
0 -
/*
-. '
• 1 • 1
. . - - ' ^
•'
1 1 ' 1 ' 1 ' 1 ' 1 ' 1 ' 1 '
1 »
. / ' \ %
\
Aj \
' ' * •
i • i ' i •
— - - — -• Whites
~~~^—~ Africans
Coloureds
~~ ~" ~~ — Indians
t*- ON .-«*O VO P -O N O N Q\
Years
Figure 5. Routine white-collar employment by race, 1965-1990 (percentage distributions). Source: ManpowerSurvey data tapes.
250,000 -
225,000 -
200,000 -
175,000 -
a 150,000 -
"§, 125,000 -
W 100,000 -
75,000 -
50,000 -
25,000 -
0 -
- . • '*
r '"F^T1—K3—1—'—1—'—I-
• , * --^
- - ' " - - . r?-
_ ^ ^ -—'—1—^H—'—1—'—1—'—1—'—1—'
• Whites
. . . . . . . Coloureds
^ — • — — Africans
™~ "" ™~ "" Indians
Years
Figure 6. Artisanal employment by race, 1965-1990. Source: Manpower Survey data tapes.
Dow
nloa
ded
by [
Cor
nell
Uni
vers
ity L
ibra
ry]
at 1
7:25
03
Oct
ober
201
3
652 Journal of Southern African Studies
350,000 - •
I ' [ • l • i • l • I • I • i • i • i ' i '
Years
Figure 7. Semi-professional employment by race, 1965-1990. Source: Manpower Survey data tapes.
has been little occupational movement out of more skilled into less skilled occupations. Theabsolute decrease in the levels of white employment in the skilled trades since 1971 and inroutine white-collar work since 1979 has not been accompanied by the growth of whiteemployment in less skilled occupations other than that of routine security (Figure 10). It istherefore reasonable to conclude that the decline in the employment levels of white routinewhite-collar and artisanal workers has been a result of their upward occupational mobility,of either an inter- or intra-generational character, into managerial, professional, semi-pro-fessional and supervisory jobs.
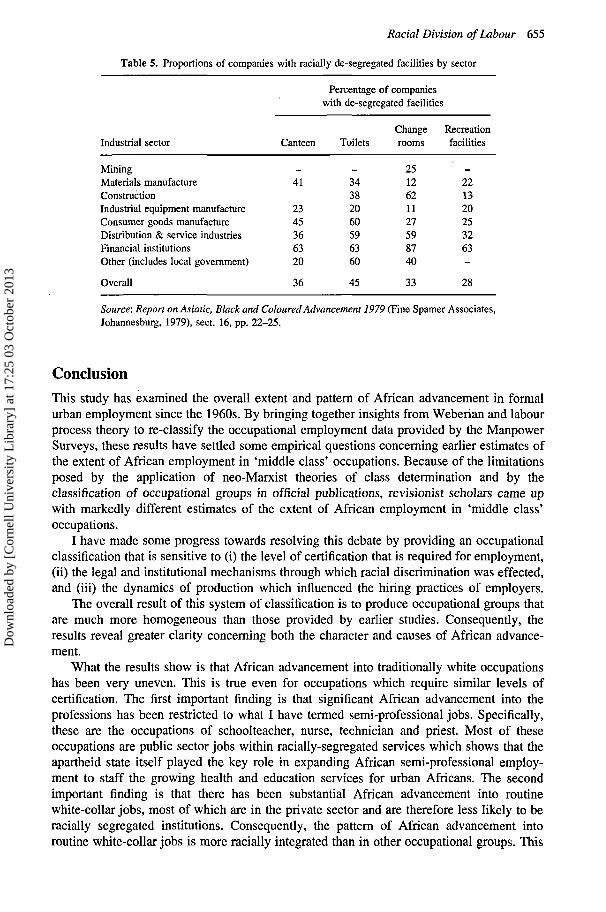
Racial Desegregation and Racial Equality in the WorkplaceThere is, unfortunately, no contemporary source of data which indicates the extent to whichthese national statistics represent racial desegregation and racial equality in the workplaceitself. There is evidence for the late 1970s, however, that companies which employedmostly routine white-collar workers were less racially segregated than companies whichemployed mostly manual workers. The extent to which routine white-collar workers wereless racially segregated and enjoyed greater racial equality in the workplace is reflected bya number of characteristics. Firstly, the proportion of financial institutions and companiesengaged in the distribution and service sectors which reported that they provided raciallydesegregated canteens, toilets, change rooms and recreation facilities was consistentlyhigher than the proportion of companies in the manufacturing, construction and miningsectors (Table 4).
Secondly, the supervision of whites by blacks was much more likely to take placein an 'office environment' than in a factory. Of those companies which reported thatthey employed black supervisors to manage whites, 75 per cent reported that thissupervision took place in offices and 25 per cent reported that it took place on the factory
Dow
nloa
ded
by [
Cor
nell
Uni
vers
ity L
ibra
ry]
at 1
7:25
03
Oct
ober
201
3
Racial Division of Labour 653
140,000 j
120,000 -•
100,000 - •
I 80,000
I* 60,000 -
40,000 ->-
20,000 - •
* / ^ r * * o \ " - * c i ^ > f * i * O Nt^ ^^ t ^ 00 0O 00 00 00
Years
Figure 8. Professional employment by race, 1965-1990. Source: Manpower Survey data tapes.
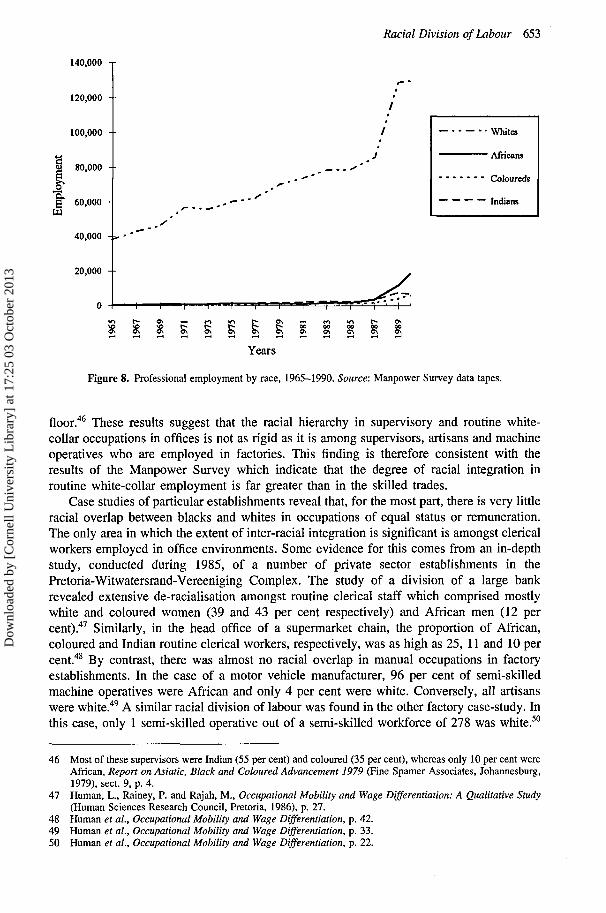
floor.46 These results suggest that the racial hierarchy in supervisory and routine white-collar occupations in offices is not as rigid as it is among supervisors, artisans and machineoperatives who are employed in factories. This finding is therefore consistent with theresults of the Manpower Survey which indicate that the degree of racial integration inroutine white-collar employment is far greater than in the skilled trades.
Case studies of particular establishments reveal that, for the most part, there is very littleracial overlap between blacks and whites in occupations of equal status or remuneration.The only area in which the extent of inter-racial integration is significant is amongst clericalworkers employed in office environments. Some evidence for this comes from an in-depthstudy, conducted during 1985, of a number of private sector establishments in thePretoria-Witwatersrand-Vereeniging Complex. The study of a division of a large bankrevealed extensive de-racialisation amongst routine clerical staff which comprised mostlywhite and coloured women (39 and 43 per cent respectively) and African men (12 percent).47 Similarly, in the head office of a supermarket chain, the proportion of African,coloured and Indian routine clerical workers, respectively, was as high as 25, 11 and 10 percent.48 By contrast, there was almost no racial overlap in manual occupations in factoryestablishments. In the case of a motor vehicle manufacturer, 96 per cent of semi-skilledmachine operatives were African and only 4 per cent were white. Conversely, all artisanswere white.49 A similar racial division of labour was found in the other factory case-study. Inthis case, only 1 semi-skilled operative out of a semi-skilled workforce of 278 was white.50
46 Most of these supervisors were Indian (55 per cent) and coloured (35 per cent), whereas only 10 per cent wereAfrican, Report on Asiatic, Black and Coloured Advancement 1979 (Fine Spamer Associates, Johannesburg,1979), sect. 9, p. 4.
47 Human, L., Rainey, P. and Rajah, M., Occupational Mobility and Wage Differentiation: A Qualitative Study(Human Sciences Research Council, Pretoria, 1986), p. 27.
48 Human et al., Occupational Mobility and Wage Differentiation, p. 42.49 Human et al., Occupational Mobility and Wage Differentiation, p. 33.50 Human et al.. Occupational Mobility and Wage Differentiation, p. 22.
Dow
nloa
ded
by [
Cor
nell
Uni
vers
ity L
ibra
ry]
at 1
7:25
03
Oct
ober
201
3
654 Journal of Southern African Studies
200,000 - •
175,000 -•
150,000 --
I 125,000 -•
"S. 100,000
I75,000 --
50,000 -•
25,000 --
0
" Africans
Whites
Indians
r - r — r^r"1!1"1!" i"1' i =
Gr\ O\ G\ O\ G\ O\ G\ O\
Years
wt r- o\o? c£ o\
Figure 9. Managerial employment by race, 1965-1990. Source: Manpower Survey data tapes.
Occupational Group
Figure 10. Occupational profile of the white workforce, 1971, 1979 and 1990. Source: Author's own analysis of theManpower Survey data tapes.
Dow
nloa
ded
by [
Cor
nell
Uni
vers
ity L
ibra
ry]
at 1
7:25
03
Oct
ober
201
3
Racial Division of Labour 655
Table 5. Proportions of companies with racially de-segregated facilities by sector
Industrial sector
MiningMaterials manufactureConstructionIndustrial equipment manufactureConsumer goods manufactureDistribution & service industriesFinancial institutionsOther (includes local government)
Source: Report on Asiatic, Black and Coloured Advancement 1979 (Fine Spamer Associates,Johannesburg, 1979), sect. 16, pp. 22-25.
ConclusionThis study has examined the overall extent and pattern of African advancement in formalurban employment since the 1960s. By bringing together insights from Weberian and labourprocess theory to re-classify the occupational employment data provided by the ManpowerSurveys, these results have settled some empirical questions concerning earlier estimates ofthe extent of African employment in 'middle class' occupations. Because of the limitationsposed by the application of neo-Marxist theories of class determination and by theclassification of occupational groups in official publications, revisionist scholars came upwith markedly different estimates of the extent of African employment in 'middle class'occupations.
I have made some progress towards resolving this debate by providing an occupationalclassification that is sensitive to (i) the level of certification that is required for employment,(ii) the legal and institutional mechanisms through which racial discrimination was effected,and (iii) the dynamics of production which influenced the hiring practices of employers.
The overall result of this system of classification is to produce occupational groups thatare much more homogeneous than those provided by earlier studies. Consequently, theresults reveal greater clarity concerning both the character and causes of African advance-ment.
What the results show is that African advancement into traditionally white occupationshas been very uneven. This is true even for occupations which require similar levels ofcertification. The first important finding is that significant African advancement into theprofessions has been restricted to what I have termed semi-professional jobs. Specifically,these are the occupations of schoolteacher, nurse, technician and priest. Most of theseoccupations are public sector jobs within racially-segregated services which shows that theapartheid state itself played the key role in expanding African semi-professional employ-ment to staff the growing health and education services for urban Africans. The secondimportant finding is that there has been substantial African advancement into routinewhite-collar jobs, most of which are in the private sector and are therefore less likely to beracially segregated institutions. Consequently, the pattern of African advancement intoroutine white-collar jobs is more racially integrated than in other occupational groups. This
Dow
nloa
ded
by [
Cor
nell
Uni
vers
ity L
ibra
ry]
at 1
7:25
03
Oct
ober
201
3
656 Journal of Southern African Studies
pattern contrasts starkly with African advancement into the skilled trades. Not only wereAfricans excluded from employment in the skilled trades until the 1980s, but since thenAfrican advancement has been very uneven and. is still concentrated in the least skilled andworst paid trades.
African advancement, although fairly extensive in these three occupational categories,therefore still follows the pattern of the 'floating' colour bar, whereby African advancementonly takes place when whites move upwards into more skilled and better paid jobs.Employment trends in the skilled trades and routine white collar jobs reveal that whiteemployment in these occupations has declined in absolute terms as they have beenincreasingly filled by Africans and other black workers. Although the racial occupationalhierarchy has been fractured as many whites have been overtaken by upwardly mobileAfricans, the general pattern is one in which whites have moved up the occupationalhierarchy ahead of Africans.
OWEN CRANKSHAW
Centre for Policy Studies, New Doornfontein 2028 Johannesburg, South Africa