Page 1
Changes in Western Pacific Tropical Cyclones Associated with theEl Nino–Southern Oscillation Cycle
RICHARD C. Y. LI AND WEN ZHOU
Guy Carpenter Asia-Pacific Climate Impact Centre, School of Energy and Environment, City University of Hong Kong,
Hong Kong, China
(Manuscript received 28 July 2011, in final form 6 March 2012)
ABSTRACT
This study examines the interannual variability of three groups of tropical cyclones (TCs)—super typhoons
(STYs), typhoons (TYs), and tropical storms and tropical depressions (TSTDs)—and their relationship with
the El Nino–Southern Oscillation (ENSO). Both wavelet analysis and correlation studies of upper-ocean heat
content reveal significant differences for the three types of TCs. In particular, an increase (decrease) in the
frequency of STYs is usually associated with the mature phase of El Nino (La Nina) events, while the converse
is true for TSTDs. In contrast, the frequency of TYs increases (decreases) during the transition period from
La Nina to El Nino (El Nino to La Nina) events. The results suggest that the timing with which ENSO impacts
STYs, TYs, and TSTDs varies and that their corresponding changes in frequency closely follow the evolution
of the ENSO cycle.
Empirical orthogonal function analysis is also conducted to investigate the impact of different environ-
mental factors influenced by ENSO on TCs. The vertical wind shear and moist static energy associated with
ENSO are identified as the dominant factors that control the frequency of STYs. In comparison, the frequency
of TYs is found to be closely related to the relative vorticity and vertical wind shear associated with both the
transition phase of ENSO and with other types of climate variability.
1. Introduction
Over the past few decades, many studies have focused
on the relationship between western North Pacific
(WNP) tropical cyclones (TCs) and the El Nino–
Southern Oscillation (ENSO) (Chia and Ropelewski
2002; Wang and Chan 2002; Camargo and Sobel 2005;
Chan 2007; Huang and Xu 2010; Kim et al. 2011). For
example, Wang and Chan found that a southeastward
(northwestward) shift in the positions of TC genesis in
the WNP occurs during El Nino (La Nina) years, which
in turn may favor (suppress) the development of intense
TCs. Camargo and Sobel (2005) discovered that the
accumulated cyclone energy (ACE) (Bell et al. 2000) is
positively correlated with ENSO indices, suggesting that
stronger (weaker) and longer-lasting (shorter lived) TCs
tend to form during an El Nino (La Nina) event. Fol-
lowing this, Camargo et al. (2007b,a) investigated the
impacts of ENSO on the tracks and genesis locations of
TCs. Making use of a genesis potential index (Emanuel
and Nolan 2004), they suggested that vorticity and rel-
ative humidity play an important role in the eastward
shift in the mean genesis location of TCs in the WNP.
Chan (2007) also pointed out that interannual variations
in intense typhoons (TYs) in the WNP are unlikely to be
determined by local sea surface temperature (SST) but
are related to changes in planetary-scale atmospheric
circulation (vorticity and wind shear) and thermodynamic
structure [moist static energy (MSE)] associated with the
El Nino phenomenon. More recently, Huang and Xu
(2010) attributed the increase in the number of super
typhoons (STYs) in El Nino years to changes in SST, the
monsoon trough, and vertical wind shear (VWS).
These studies focused mainly on the effect of ENSO on
intense TCs (Chan 2007; Huang and Xu 2010) or con-
sidered all TCs as a whole regardless of their intensity
(Chia and Ropelewski 2002; Wang and Chan 2002;
Camargo et al. 2007a; Kim et al. 2011). Thus, the effect of
ENSO on weaker typhoons or tropical depressions is
unclear, and the connection between ENSO and TCs
with different intensities remains uncertain. In addition,
Corresponding author address: Wen Zhou, School of Energy and
Environment, City University of Hong Kong, Hong Kong Science
Park, Hong Kong 00852, China.
E-mail: [email protected]
5864 J O U R N A L O F C L I M A T E VOLUME 25
DOI: 10.1175/JCLI-D-11-00430.1
� 2012 American Meteorological Society
Page 2
less effort has been focused on studying the TC–ENSO
relationship during the ENSO transition phase. Frank
and Young (2007) recently suggested that the variance
in factors that control the formation of TCs can ulti-
mately result in storms with different degrees of in-
tensity. Thus, the impact of ENSO on TCs with different
intensities is also expected to vary.
In contrast to most ENSO–TC studies that use
anomalies in SST in the Nino-3 or Nino-3.4 regions as
a method of diagnosing the impact of ENSO, the present
study uses upper-ocean heat content (OHC) as a proxy
for ENSO since previous studies have shown that this
factor also serves as an important indicator of ENSO
(Kessler 1990; Kinter et al. 2002; Zhou and Chan 2007).
Wang et al. (1999) indicated that the strongest ENSO
signal occurs in the subsurface as a result of wind stress
driven by ENSO. However, few previous investigations
have used OHC to study the impact of ENSO on TCs. A
recent study by Wada and Chan (2008) suggested that
a decrease in OHC in the WNP is related to the passage
of TCs, though they did not delve deeply into the re-
lationship between OHC, ENSO, and TCs. Therefore,
this study uses OHC to examine the impact of ENSO on
TCs with different intensities.
Section 2 describes the datasets used and the classifi-
cation of different groups of TCs. Sections 3 and 4 in-
vestigate the interannual variability of different groups
of TCs and their relationship with ENSO. Section 5
examines the connection of TC frequency with large-
scale environmental parameters. Finally, a discussion
and summary are given in section 6.
2. Datasets and definitions
The TC datasets of the WNP were obtained from the
Joint Typhoon Warning Center (http://www.usno.navy.
mil/JTWC/), which records the location and intensity of
all TCs at 6-h intervals. July–November (JASON) is
taken to be the TC season, during which about 80% of
the total number of TCs in the WNP (08–308N, 1208E–
1808) occur. The study period from 1965 to 2006 was
chosen based on the availability of routine satellite ob-
servations. Tropical cyclones formed during this period
are categorized into one of the three groups according to
their maximum attainable intensity. The super typhoon
(STY) group includes TCs that reach at least 114 knots
(kt, 1 kt 5 0.51 m s21; Category 4 and 5 on the Saffir–
Simpson Hurricane Wind Scale), accounting for about
26% (223/850) of the total number of TCs and repre-
senting the most intense TCs. The typhoon (TY) group
comprises moderately strong TCs with a maximum sus-
tained wind speed between 64 and 114 kt (Category 1–3
on the Saffir–Simpson Hurricane Wind Scale) and
accounts for a further 37% of the total frequency (316/
850). The remaining 37%, with a maximum sustained
wind speed of less than 64 kt (311/850), is classified as
the tropical storm and tropical depression (TSTD) group
and corresponds to the weakest type of TC.
Monthly atmospheric data for temperature, sea level
pressure, 500-hPa omega, 600-hPa relative humidity,
and 850-hPa and 200-hPa wind for the period 1965–2006
were obtained from the National Centers for Environ-
mental Prediction–National Center for Atmospheric
Research (NCEP–NCAR) reanalysis (Kalnay et al.
1996). The monthly National Oceanic and Atmospheric
Administration 28 3 28 Extended Reconstructed SST
dataset (Smith and Reynolds 2004) was also used to
compute the Nino-3.4 index for comparison with the
upper-ocean heat content (OHC). Monthly upper-
ocean temperatures for depths of 0–400 m from the
Scripps Institution of Oceanography Joint Environ-
mental Data Analysis Center for the period 1965–2003
were used to compute the OHC, with standard depths 0,
20, 40, 60, 80, 120, 160, 200, 240, 300, and 400 m and
a horizontal resolution of 58 3 28. Following Zhou and
Chan (2007), the upper OHC for the first 400 m was
computed by
OHC 5
ð0
2hrCpT dz,
where Cp is the specific heat capacity at constant pres-
sure, r is the density of the fluid, and T is temperature of
the mixed layer.
3. Interannual variability of TCs inassociation with OHC
a. Variability of TCs with different intensities
During 1965–2006 an average of 5.31 STYs, 7.52 TYs,
and 7.40 TSTDs formed in the WNP, with a standard
deviation of 2.35, 2.70, and 2.78, respectively. Figure 1
shows the corresponding standardized time series of the
STY, TY, and TSTD frequencies in the WNP during the
TC season (JASON). Interannual as well as interdecadal
variations are noted for all three TC groups. However, it
should be pointed out that the interrelationship between
these three groups of TCs is weak, such that no signifi-
cant correlation can be revealed (Table 1). In other
words, a higher occurrence of a certain TC group does
not necessarily imply a higher frequency of the others.
For example, in the period 2002–06, a below-average
number of TSTDs and TYs were recorded in the WNP
(Figs. 1b and 1c), while more STYs were actually noted
during this period (Fig. 1a).
1 SEPTEMBER 2012 L I A N D Z H O U 5865
Page 3
To clearly identify the dominant modes of variabil-
ity, the real-valued Mexican hat wavelet, the second
derivation of a Gaussian (DOG; derivative m 5 2), was
also applied to the three frequency time series (Fig. 2).
This method has also been employed in previous TC
studies (Chan 2008; Chan and Xu 2009) for mode iden-
tification, and further details can be found in Torrence
and Compo (1998). Consistent with the aforementioned
weak correlations between the three TC groups, the
wavelet power spectra of the three groups of TCs
demonstrate different features. For instance, the 2–7-yr
signal is more prominent in the late 1990s for STYs
(Fig. 2a) in a way similar to that in Chan (2008), whereas
it appears before the 1990s in the TY spectrum (Fig. 2b).
For the weaker TSTDs, the 2–7-yr band is much smaller
and the 16–32-yr band dominates in the 1990s (Fig. 2c).
The results again suggest that variations exist among
different groups of TCs.
b. The impact of OHC on TC intensity
The aforementioned wavelet spectra of different
groups of TCs show differences in power in the 2–7-yr
band. As the 2–7-yr band is often linked to ENSO, the
impact of ENSO on different groups of TCs is also
expected to vary.
As discussed in the introduction, the OHC, rather
than SST anomalies, was used as a proxy for ENSO.
Therefore, so as to obtain a general picture of how OHC
is related to ENSO, a correlation map between the
Nino-3.4 SST with basinwide OHC was first computed
(Fig. 3). The correlation pattern exhibits a distinct east–
west dipole in the Pacific with a significant positive
(negative) correlation in the eastern (western) Pacific,
which is similar to the pattern found by Zhou and Chan
(2007). Such a pattern is consistent with the accumula-
tion of warm water in the eastern Pacific associated with
El Nino events. The results here support the previous
view that OHC is a good indicator of ENSO (Kessler
1990; Kinter et al. 2002; Zhou and Chan 2007) and is thus
suitable to use in the present study.
To investigate the relationship with OHC and its
possible linkage to ENSO, a lead–lag correlation was
computed for different TC intensity groups (Figs. 4, 6,
and 7), in which year 0 denotes simultaneous correlation
while year 21 (11) represents the correlation when
OHC leads (lags) the TC by one year. For the frequency
of STYs (Fig. 4), the correlation is rather weak in the
Pacific in year 21 and year 1, while a prominent east–
west dipole pattern similar to that in Fig. 3 is found in
year 0. As implied by the dipole pattern between OHC
TABLE 1. Correlation coefficients between frequencies of dif-
ferent TC intensity groups during JASON obtained by calculating
the correlations between the 32-yr time series of the frequency of
each group of TCs with that of the other groups.
STY TY TSTD
STY — 20.23 20.14
TY 20.23 — 0.17
TSTD 20.14 0.17 —
FIG. 1. Standardized time series of JASON (a) STY, (b) TY, and
(c) TSTD frequencies in the period 1965–2006. For each TC group,
the standardized time series is calculated by first removing the
mean and then dividing the resultant deviations from the mean by
the standard deviation. The means (standard deviations) are 5.31
(2.35), 7.53 (2.70), and 7.40 (2.78) for STY, TY, and TSTD, re-
spectively. The dotted line denotes the 10-yr running mean of the
standardized time series.
5866 J O U R N A L O F C L I M A T E VOLUME 25
Page 4
and ENSO, this similar dipole pattern for OHC and
STYs in year 0 suggests that the frequency of STYs
might be related to ENSO in such a way that more
(fewer) STYs tend to develop during an El Nino (La
Nina) event. This result agrees well with previous stud-
ies (Wang and Chan 2002; Camargo and Sobel 2005;
Camargo et al. 2007b) that showed that stronger and
longer-lasting TCs tend to form during an El Nino event.
One important point that needs to be addressed here is
that the significant negative correlation in the western
Pacific is mainly a response to ENSO, rather than the
cooling effect due to the passage of STYs. This is con-
firmed by the partial correlation after removal of the
ENSO effect (Fig. 5), which is calculated based on the
following formula:
rxy,z
rxy 2 (rxz)(ryz)ffiffiffiffiffiffiffiffiffiffiffiffiffiffiffiffiffiffiffiffiffiffiffiffiffiffiffiffiffiffiffiffiffiffiffiffiffiffiffi(1 2 r2
xz)(1 2 r2yz)
q ,
where r is the simple correlation coefficient and the
subscripts x, y, and z represent the STY frequency, the
OHC, and the OHC in the Nino-3.4 region, respectively.
This allows us to determine the correlation between
variables x and y with the effect of z removed. In con-
trast to the significant negative correlation in the west-
ern Pacific shown in Fig. 4b, the local correlation is
greatly weakened in both magnitude and spatial extent
in Fig. 5, indicating that the significant negative corre-
lation is mainly contributed by ENSO. This is consistent
with previous results (Chan 2007) that showed a weak
relationship between local SST (in this case, the local
OHC) and TCs compared with ENSO.
In contrast to STYs, the correlation between OHC
and TYs shows different patterns (Fig. 6). Instead, in
year 0, the correlation with an ENSO-like dipole pattern
appears in both year 21 and year 1, which suggests that
the frequency of TYs tends to increase (decrease) during
the transition from La Nina to El Nino (El Nino to La
Nina) events. These results imply that different phases
of ENSO affect STYs and TYs in different ways. Mod-
ulation of STYs tends to occur during the mature phase
of ENSO, while that of TYs appears to be related to the
transition phase. Finally, the simultaneous correlation
for the TSTD group (Fig. 7) appears to be similar to that
of the STY group, although the sign in year 0 is reversed
and the correlations in year 21 and year 1 are weak. All
of these findings imply that the timing with which ENSO
impacts STYs, TYs, and TSTDs differs and that the
corresponding changes in their frequencies appear to
follow the ENSO cycle closely.
4. The TC–ENSO relationship
To confirm the aforementioned correlation results be-
tween the frequency of different TC groups and OHC,
composite analysis is also carried out to illustrate the
impact of ENSO on different groups of TCs. The OHC
FIG. 2. The normalized wavelet power spectrum of JASON
(a) STY, (b) TY, and (c) TSTD frequency over the period 1965–
2006. The cross-hatched region represents the cone of influ-
ence, and the thick solid line denotes values that are over 95%
confidence.
FIG. 3. Correlation between Nino-3.4 SST and OHC in JASON
for the period 1965–2003. The contour represents values over 95%
confidence.
1 SEPTEMBER 2012 L I A N D Z H O U 5867
Page 5
anomaly composites are based on the more/fewer TC
years (denoted by year 0), when the JASON standard-
ized TC frequency is more/less than 1/21 (refer to Table 2
for the selected years). In addition, the evolution of
OHC anomalies two years before and after year 0 (de-
noted by year 22 and year 2, respectively) are also
shown. Figure 8a shows the longitude–time sections of
OHC anomaly composites along the equator for the
fewer-STY case. In year 22, positive (negative) OHC
anomalies appear in the eastern (western) Pacific, which
is typical of the El Nino pattern. Accordingly, a gener-
ally higher-than-normal STY frequency can be found
during this period, which agrees well with the significant
positive correlation of STYs and OHC as revealed in
section 3b. The negative OHC anomalies in the western
Pacific begin to propagate eastward in year 21. The
variation in number of STYs during this period is small,
while a generally below-average total TC number is
recorded. The negative OHC anomalies finally reach the
eastern Pacific in early year 0, which signifies the mature
stage of the La Nina event, during which the occurrence
of STYs is significantly reduced. At the same time, it is
FIG. 4. Correlation between OHC and STY frequency: (a) OHC
leads STY by one year, (b) simultaneous correlation, and (c) OHC
lags STY by one year during JASON for the period 1965–2003. The
contour represents values over 95% confidence.
FIG. 5. Simultaneous partial correlation between OHC and STY
frequency during JASON for the period 1965–2003 after removal
of the ENSO effect. The contour represents values over 95%
confidence.
FIG. 6. As in Fig. 4, but for the correlation between OHC and
TY frequency.
FIG. 7. As in Fig. 4, but for the correlation between OHC and
TSTD frequency.
5868 J O U R N A L O F C L I M A T E VOLUME 25
Page 6
also interesting to note that the number of total TCs
during this period is generally above normal, which
again suggests that the increase in total TC formation
does not necessarily support greater STY development.
Finally, in year 1, the positive anomalies in the western
Pacific start to move eastward and the whole cycle is
repeated. The reverse is generally true for the years with
a greater number of STYs, as shown in Fig. 8b, although
the OHC anomalies and the reduction in STY number in
year 22 are less prominent. The aforementioned results
further confirm that the frequency of STYs follows the
ENSO cycle, with greater (reduced) frequency during
the mature phase of El Nino (La Nina), while the vari-
ation in frequency is relatively smaller during the tran-
sition phase. These results conform well to previous
studies (Camargo and Sobel 2005; Chan 2007), which
found that El Nino favors the development of intense
TCs.
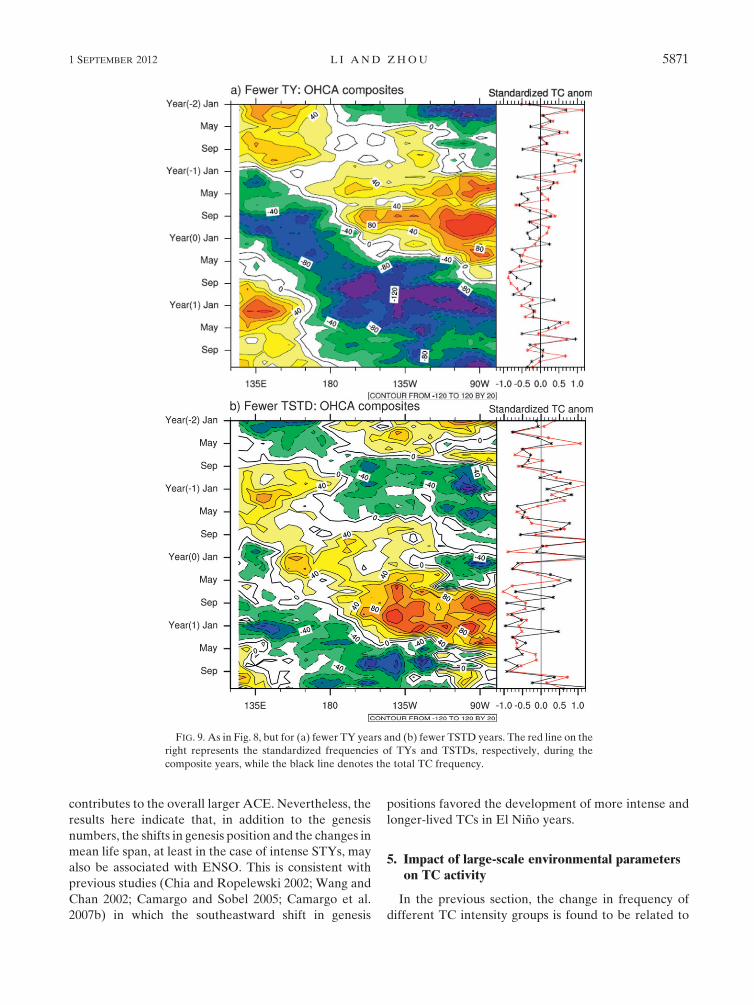
A similar analysis is also applied to TYs (Fig. 9a). The
OHC anomalies depict an El Nino–like dipole pattern in
year 21, indicating the mature stage of an El Nino event,
which differs from the case of STYs (Fig. 8a). Year 0 is
the transition phase when the negative OHC anomalies
in the western Pacific begin to migrate eastward. During
this period, the TY frequency shows a significant de-
crease, consistent with the previous correlation result
that fewer TYs will generally be found during an El Nino
to La Nina transition. Moreover, an above-normal TY
number can be observed in year 22, which is the tran-
sition phase from a La Nina to an El Nino event. The
reverse is also found for years with a greater frequency
of TYs (figure not shown), which indicates that ENSO
impacts TYs mainly during transition phases.
Finally, the pattern of OHC anomalies for the fewer
TSTDs (Fig. 9b) is almost the reverse of that for STYs
(Fig. 8a), with significant reduction (increase) in year
0 (22) corresponding to the mature phase of an El Nino
(La Nina) event, though the OHC anomalies appear to
be weaker and less organized. While for years with
a greater TSTD frequency, the OHC pattern is generally
the reverse of that of the fewer-TSTD case (figure not
shown). This indicates that the weaker TSTDs generally
exhibit activity opposite to that of intense STYs during
the mature phase of an ENSO event.
To summarize, TCs of different intensities are mod-
ulated during different phases of an ENSO cycle. In par-
ticular, the increase (decrease) in the frequency of intense
STYs is usually found to be associated with a mature
El Nino (La Nina) event, while the converse is found for
the weak TSTD group. This is in agreement with Camargo
and Sobel (2005) and Camargo et al. (2007b). In contrast,
modulation of the number of TYs occurs mainly during
the transition period of an ENSO cycle. The results here
suggest that weak and intense TCs could respond differ-
ently to external forcing induced by an ENSO event,
which will be discussed in detail in section 5.
As an extension, we also investigate other TC pa-
rameters, including genesis position, TC lifetime, and
accumulated cyclone energy (ACE) so as to achieve
a more comprehensive understanding of the interannual
variability of TCs in the WNP. Differences in these pa-
rameters between the high and low occurrence years are
considered to be significant when exceeding 95% con-
fidence based on the Student’s t test. Figure 10 shows
the genesis positions of STYs in the WNP during the
high and low occurrence years. The average number of
STYs formed in the high occurrence years is 8.75, which is
about 5.5 times greater than that in the low occurrence
years (1.6), while the total TC number remains approxi-
mately the same (22.1 versus 21). In addition to the
number of STYs generated, another noticeable feature is
the difference in the genesis positions, whereby the TCs
formed in the years with a higher occurrence of STYs
exhibit a clear shift to the southeast (08–158N, 1408E–
1808). In fact, such a shift in genesis positions is closely
related to changes in atmospheric circulation influenced
by ENSO (refer to section 5). Consistent with previous
studies (Chia and Ropelewski 2002; Wang and Chan
2002; Camargo and Sobel 2005; Camargo et al. 2007b),
the increase in the number of STYs, together with the
southeastward shift in genesis locations, results in TCs
with a much longer life span and contributes to a signifi-
cant increase in ACE in high occurrence years (Table 3).
With regard to TYs, the average number recorded in
the high occurrence years is 11.25, compared with 3.2 in
the years with a lower occurrence, which also contrib-
utes to a significant difference in total TC number during
the two periods (22.75 versus 15.8). In contrast to STYs,
no prominent shift in the genesis position (Fig. 11) or
changes in life span (Table 3) can be observed. This means
TABLE 2. More (fewer) TC and STY years selected when the
JASON standardized anomalies are greater (less) than or equal to
1 (21).
More STY
years (8 yr)
1965, 1968, 1987, 1991, 1992, 1994, 1997, 2004
Fewer STY
years (5 yr)
1966, 1974, 1978, 1985, 1999
More TY
years (8 yr)
1967, 1971, 1974, 1978, 1985, 1990, 1993, 2001
Fewer TY
years (6 yr)
1970, 1976, 1983, 1988, 1998, 2006
More TSTD
years (7 yr)
1966, 1967, 1978, 1989, 1995, 1996, 1999
Fewer TSTD
years (4 yr)
1985, 1997, 2003, 2005
1 SEPTEMBER 2012 L I A N D Z H O U 5869
Page 7
that the significant increase in ACE is mainly associated
with an increase in the number of TYs during high oc-
currence years. Finally, for the TSTD group (Fig. 12),
the significant change in their number (11.9 versus 3.25)
in the high and low occurrence years does not lead to
a prominent difference in ACE. This is because ACE is
mainly dominated by intense TCs, while weak TSTDs
make only a minor contribution (Bell et al. 2000). Indeed,
the average TC life span in the low occurrence years is
longer than that in the high occurrence years, which
FIG. 8. Longitude–time section of OHC anomaly composites (108 J m22) averaged over
58S–58N for (a) fewer STY years and (b) more STY years, where year 0 refers to the less and
more STY years, respectively, and year 2n (n) refers to n years before (after) year 0. The red
(black) line on the right represents the standardized frequencies of STYs (total TCs) during the
composite years.
5870 J O U R N A L O F C L I M A T E VOLUME 25
Page 8
contributes to the overall larger ACE. Nevertheless, the
results here indicate that, in addition to the genesis
numbers, the shifts in genesis position and the changes in
mean life span, at least in the case of intense STYs, may
also be associated with ENSO. This is consistent with
previous studies (Chia and Ropelewski 2002; Wang and
Chan 2002; Camargo and Sobel 2005; Camargo et al.
2007b) in which the southeastward shift in genesis
positions favored the development of more intense and
longer-lived TCs in El Nino years.
5. Impact of large-scale environmental parameterson TC activity
In the previous section, the change in frequency of
different TC intensity groups is found to be related to
FIG. 9. As in Fig. 8, but for (a) fewer TY years and (b) fewer TSTD years. The red line on the
right represents the standardized frequencies of TYs and TSTDs, respectively, during the
composite years, while the black line denotes the total TC frequency.
1 SEPTEMBER 2012 L I A N D Z H O U 5871
Page 9
different phases of ENSO events. Therefore, ENSO
must exert its impact on TC activity through differences
in the modulation of large-scale environmental param-
eters. In this section, the six TC-related parameters
suggested by Gray (1979) are investigated, including
four dynamic parameters [850-hPa relative vorticity,
200–850-hPa total vertical wind shear (VWS), 200-hPa
divergence, and 500-hPa omega] and two thermody-
namic parameters [600-hPa relative humidity and 1000–
500-hPa average moist static energy (MSE)]. Following
the method of Chan and Liu (2004), empirical orthog-
onal function (EOF) analysis is first applied to the
standardized time series of the different parameters
during the TC season. Correlations are then computed
for the principal component (PC) time series of each
mode with the Pacific dipole index (PDI) and the TC
frequency. The correlation results are summarized in
Tables 4 and 5, respectively. Similar to Zhou and Chan
(2007), the PDI is defined as the difference in OHC
FIG. 10. Composite distribution of TCs in (a) more STY and (b)
fewer STY years. The black dots represent STY genesis positions,
while the triangles represent genesis positions other than STY. The
numbers within parentheses (top-left corner) indicate the number
of total TCs and STYs, respectively, formed during the composite
years.
TABLE 3. Accumulated cyclone energy (ACE) and average life
span of TCs in different years. Bold values indicate the differences
between the more and fewer TC years are significant at 95%
confidence based on a Student’s t test.
ACE yr21
(104 kt2)
Average life span
(days)
More STY years 397 9.8
Fewer STY years 173 6.9
More TY years 251 7.6
Fewer TY years 183 7.0
More TSTD years 251 7.8
Fewer TSTD years 293 9.5
Climatology 256 8.0
FIG. 11. As in Fig. 10, but for (a) more TY and (b) fewer TY years.
FIG. 12. As in Fig. 10, but for (a) more TSTD and (b) fewer
TSTD years.
5872 J O U R N A L O F C L I M A T E VOLUME 25
Page 10
averaged over the eastern region (68S–48N, 1108–1508W)
minus the western region (08–108N, 1308–1708E) to re-
flect the dipole pattern during an ENSO event. Thus,
a large positive (negative) value of the PDI corresponds
to the warm (cold) phase of ENSO. This was shown
previously (Zhou and Chan 2007) to be a good index to
represent ENSO, with a correlation of 0.91 (over 99%
confidence) with the Nino-3.4 index in this case. Finally,
stepwise regressions are performed to determine the
relative contribution of each environmental parameter
to the prediction of TC frequency.
a. Dynamic factors
EOF1 of the low-level relative vorticity reveals a
north–south dipole pattern (Fig. 13), with a maximum
positive center situated in the southeastern part of the
western Pacific. Such a pattern is consistent with that
found by Chan and Liu (2004) and explains 22.4% of the
total variance. This represents the interannual variabil-
ity of the strength of the monsoon trough in the WNP.
The corresponding PC time series reveals a significant
positive (negative) correlation of 0.34 (20.36) at 95%
confidence with the STY (TSTD), while it correlates only
weakly with the TY frequency (0.076). At the same time,
the PC time series shows a significant positive correlation
(0.85 at 99% confidence) with the PDI, indicating that it is
closely linked to ENSO. The importance of a monsoon
trough and relative vorticity associated with the east-
ward shift in the mean genesis location has also been
mentioned in previous studies (Wu et al. 2004; Camargo
et al. 2007b,a; Kim et al. 2011). Consistently the EOF1
pattern here suggests that an increase in low-level relative
vorticity, with a maximum in the southeast region asso-
ciated with the strengthening of the monsoon trough,
favors (suppresses) formation of intense STYs (weaker
TSTDs) during an El Nino event.
In contrast, the PC time series of EOF2 depicts
a much more significant correlation with TY frequency
(0.33 at 95% confidence) compared with that of STY
(0.24) and TSTD (0.12). The positive center migrates
northward to about 208N, 1558E. This pattern was not
discussed by Chan and Liu. Instead of showing significant
simultaneous correlations, the time series of PC2 reveals
a significant lag-1 correlation (20.30 at 90% confidence)
as well as a lead-1 correlation (0.26 at 90% confidence)
with the PDI. This suggests that a positive (negative)
EOF2 pattern usually occurs during La Nina to El Nino
(El Nino to La Nina) transitions, which in turn affects
the formation of TYs. Therefore, a change in the num-
ber of TYs during the transition phase, as revealed in the
previous section, can be attributed partly to a concomi-
tant change in low-level vorticity induced by ENSO.
The first EOF of the total VWS shows an alternating
pattern with a positive–negative–positive orientation
(Fig. 14). This pattern is found to be significantly cor-
related only with STY frequency (0.31 at 95% confi-
dence), while at the same time being closely linked to
the PDI (0.64 at 99% confidence). This implies that
a weaker wind shear in the southeast (58–158N, 1658E–
1808) during an El Nino event is particularly favorable
for STY development, even though a higher-than-normal
value appears in the western region. The pattern is
consistent with that in Camargo et al. (2007b) and Kim
et al. (2011), who have similarly found a reduction in
shear near the date line during El Nino years.
Although the time series of PC2 is found to be sig-
nificantly correlated with the frequency of TYs (20.46 at
99% confidence), it reveals no significant relationship
with the PDI. This suggests that the significant impact of
TABLE 4. Correlation coefficients between PC time series of different environmental parameters with the frequencies of different TC
groups. Bold values indicate the correlation is significant at least at the 90% confidence level.
PC1 with STY PC2 with STY PC1 with TY PC2 with TY PC1 with TSTD PC2 with TSTD
850-hPa relative vorticity 0.34 (95%) 0.25 0.076 0.33 (95%) 20.36 (95%) 0.12
VWS 0.31 (95%) 20.063 0.22 20.46 (99%) 20.24 20.23
500-hPa omega 20.25 0.41 (99%) 0.053 0.24 20.078 20.24
200-hPa divergence 0.22 20.21 0.012 20.36 (95%) 20.16 20.12
600-hPa relative humidity 0.58 (99%) 0.11 0.028 0.23 20.14 20.21
Average MSE 20.019 0.55 (99%) 20.004 0.13 20.18 20.26 (90%)
TABLE 5. Correlation coefficients between PC time series of
different environmental parameters with the PDI at different leads
and lags. PC lags (leads) refers to the correlation when the PC time
series lags (leads) the PDI by one year. Only values over the 90%
confidence level are shown. Single (double) asterisks denote the
correlation between the PDI with the time series of PC1 (PC2) of
the parameter.
PC lags Simultaneous PC leads
850-hPa vorticity 20.30** 0.85* 0.26**
Total vertical wind shear — 0.64* —
500-hPa omega — 0.71** —
200-hPa divergence — 0.71* —
600-hPa relative humidity 20.31** 0.52* —
Moist static energy — 0.72** —
1 SEPTEMBER 2012 L I A N D Z H O U 5873
Page 11
EOF2 on TY frequency is related to factors other than
ENSO. This may be due to a weaker ENSO forcing
during the transition phase compared with the mature
phase, such that other types of climate variability may
also play a role in affecting the number of TYs. How-
ever, determination of the exact nature of this climate
variability is beyond the scope of this study and requires
future investigation.
With regard to midlevel vertical motion (Fig. 15), only
the EOF2 mode with a southeast–northwest dipole
pattern reveals a significant correlation with the fre-
quency of STYs, while EOF1 does not show any signif-
icant relationship with any of the TC groups. In addition,
the time series of PC2 also correlates positively with the
simultaneous PDI (0.71 at 99% confidence). This sug-
gests that an anomalous rising motion (denoted by the
negative center) in the southeastern region during an
El Nino event favors the formation of STYs. Such
a change in vertical motion is also consistent with the
strengthening of the monsoon trough, which results in
a stronger cyclonic inflow at low levels during an El Nino
event, as shown in Fig. 13.
The first EOF of 200-hPa divergence reveals a north–
south dipole pattern (Fig. 16). Although the time series
of PC1 correlates positively (0.71 at 99% confidence)
with the PDI, it shows no significant relationship with
the frequency of different groups of TCs. This means
that the upper-level divergence induced by ENSO plays
a relatively minor role compared with other dynamic
factors. In contrast, the time series of PC2 shows a sig-
nificant correlation with TY frequency but reveals no
significant relationship with the PDI. Similar to the
EOF2 of the VWS, the results here suggest that the
change in TY frequency through modulation of the
200-hPa divergence is related to factors other than
ENSO.
b. Thermodynamic factors
EOF1 of the 600-hPa relative humidity again shows
a southeast–northwest dipole pattern (Fig. 17). The
correlations with both STY frequency (0.58 at 99%
confidence) and the PDI (0.52 at 99% confidence) are
significantly positive. This means that an increase in
midlevel relative humidity in the southeast region dur-
ing an El Nino event is beneficial for the development of
STYs. Our results here agree with previous studies
(Camargo et al. 2007a; Kim et al. 2011), which reveal
a similar increase in humidity near the date line during
an El Nino event. On the contrary, EOF2 shows no
significant relationship with different TC parameters,
though PC2 reveals a significant lag-1 correlation (20.31
at 90% confidence) with the PDI.
Finally, for the MSE (Fig. 18), only EOF2 is found to
be related to the number of both STYs (0.55 at 99%
confidence) and TSTDs (20.26 at 90% confidence),
while EOF1 is not. Again, EOF2 reveals a southeast–
northwest dipole pattern with a significant positive
correlation of 0.72 with the PDI, which implies that an
increase in MSE in the southeastern region would result
FIG. 13. (top) EOF1 and (bottom) EOF2 of the JASON mean 850-
hPa relative vorticity. The sign of the EOF is chosen such that the
simultaneous correlation is positive between the PC time series with
the PDI. The value above the top-right corner of each panel indicates
the percentage of the total variance explained by each mode.
FIG. 14. As in Fig. 13, but of the total vertical wind shear.
5874 J O U R N A L O F C L I M A T E VOLUME 25
Page 12
in an increase (decrease) in the number of STYs
(TSTDs) during an El Nino event. Such a pattern also
resembles the EOF2 pattern of MSE obtained by Chan
and Liu (2004), which further supports our results.
c. Stepwise regression
As an extension of Chan and Liu, this section in-
vestigates how different dynamic and thermodynamic
factors are related to TCs with different intensities and
how they are linked to different phases of ENSO. As
shown in Tables 4 and 5, the PC time series (including
850-hPa relative vorticity, VWS, 500-hPa omega, 600-hPa
relative humidity, and average MSE), which shows sig-
nificant correlations with STY frequency, is simulta-
neously related to the PDI. This suggests that the
modulation of STY frequency takes place mainly during
mature ENSO events. The enhanced low-level relative
vorticity, midlevel rising motion, weaker VWS, and
higher midlevel relative humidity and MSE in the
southeast quadrant during an El Nino event strongly
favor the development of STYs. This is consistent with
the strengthening and southeastward extension of the
monsoon trough during an El Nino event (Wang and
Chan 2002; Chen and Huang 2008), which results in
a southeastward shift in the TC genesis position and
thereby allows more time for TCs to stay over the open
ocean and intensify. Finally, to identify the relative
contribution of these different environmental parame-
ters to the frequency of STYs, stepwise regression is
carried out. This is a systematic method for adding and
removing terms from a multilinear model based on the p
values of the F statistics so as to minimize rms error. In
each step, the term with the smallest (largest) p values
less (greater) than 0.05 will be added to (removed from)
the model. The process terminates when no additional
term can be added or removed from the model. The
corresponding regression equation for STY frequency is
as follows:
STY 5 6. 3180 2 0. 1356(VWS1) 1 0. 3619(MSE2)
(with multiple R 5 0. 65 at 99% confidence),
where VWS1 is the EOF1 mode for VWS and MSE2 is
the EOF2 mode for MSE. This suggests that wind shear
and MSE play a much more critical role in predicting the
frequency of STYs during the mature phase of ENSO,
which is consistent with the results of Chan and Liu
(2004).
TY frequency is found to be related to low-level rel-
ative vorticity, VWS, and upper-level divergence, which
means that dynamic factors play a much more important
role than thermodynamic factors in TY modulation. The
change in relative vorticity is found to be related to the
transition phase of ENSO, while the change in VWS and
divergence might be related to other climate variability.
Thus, during the ENSO transition phase, both ENSO
and other climate variability play a role in regulating the
frequency of TYs, which makes the situation much more
complex than it is for STYs. The corresponding stepwise
regression equation for TY frequency is given as
FIG. 15. As in Fig. 13, but of the 500-hPa omega. FIG. 16. As in Fig. 13, but of the 200-hPa divergence.
1 SEPTEMBER 2012 L I A N D Z H O U 5875
Page 13
TY 5 7. 5238 1 0. 1241(RV2) 2 0. 1596 (VWS2)
(with multiple R 5 0. 54 at 99% confidence),
where RV2 and VWS2 denote the EOF2 mode of 850-hPa
relative vorticity and VWS, respectively. In contrast to
STY, which is controlled by both dynamic (VWS) and
thermodynamic (MSE) factors, TY is controlled solely
by dynamic factors. This extends the results of previous
studies (Wang and Chan 2002; Chan and Liu 2004) and
further stresses the difference between factors that af-
fect the frequencies of STYs and TYs.
Finally, a significant relationship can also be found
between the frequency of TSTDs, low-level relative
vorticity, and MSE associated with the mature phase of
ENSO. The stepwise regression equation for TSTD
frequency includes only the vorticity term, again em-
phasizing the importance of the dynamic factor in pre-
dictions of weaker TCs:
TSTD 5 7. 4048 2 0. 1258(RV1)
(with R 5 0. 36 at 99% confidence),
where RV1 is the EOF1 mode of the relative vorticity.
6. Summary and discussion
This study examines the interannual variability of
three groups of TCs—intense STYs, moderately strong
TYs, and weak TSTDs—and their relationship with
ENSO. In contrast to many previous studies, we use
upper-ocean heat content (OHC) instead of SST as
a proxy for the ENSO signal to determine the subsurface
oceanic response to both ENSO and TCs.
Both wavelet analysis and correlation studies reveal
significant differences among the three groups of TCs.
Specifically, the simultaneous correlation of OHC with
STYs and TSTDs depicts a significant ENSO-like dipole
pattern, while that with TYs does not. In contrast, the
lead-1 and lag-1 correlation of OHC with TYs reveals
a similar ENSO-like dipole pattern. The results suggest
that the timing with which ENSO impacts STYs, TYs,
and TSTDs differs and the corresponding changes in
their frequencies closely follows the evolution of an
ENSO cycle. This is further supported by the composite
analysis. The increase (decrease) in STY frequency in
more (fewer) STY years is usually associated with the
mature phase of El Nino (La Nina) events, while the
opposite is found for TSTDs. In contrast, the frequency
of TYs shows an increase (decrease) during the transi-
tion period from La Nina to El Nino (El Nino to La
Nina). All of these findings provide new insight into the
ENSO–TC relationship and extend the results of pre-
vious studies (Chia and Ropelewski, 2002; Wang and
Chan 2002; Kim et al. 2011).
To examine how the frequency of different groups of
TCs is related to various types of environmental forcing,
EOF analysis is also performed. The EOF patterns of
the environmental factors associated with ENSO, in-
cluding relative vorticity, omega, relative humidity, and
MSE, reveal a prominent southeast–northwest dipole
FIG. 17. As in Fig. 13, but of the 600-hPa relative humidity. FIG. 18. As in Fig. 13, but of the 1000–500-hPa average moist static
energy.
5876 J O U R N A L O F C L I M A T E VOLUME 25
Page 14
pattern. The enhanced low-level cyclonic vorticity,
midlevel vertical motion, relative humidity, and MSE as
well as weaker VWS in the southeast part of the WNP
provide favorable conditions for STY development
during El Nino years, while unfavorable conditions in
the northwest suppress the formation of TSTDs. These
results are consistent with previous studies (Chia and
Ropelewski 2002; Wang and Chan 2002; Chan and Liu
2004; Wu et al. 2004; Camargo et al. 2007b) that showed
that the strengthening of the monsoon trough during an
El Nino year causes a southeastward shift in the TC
genesis location, which in turn favors the development
of intense TCs. Stepwise regression emphasizes the im-
portance of VWS and MSE (both are correlated signif-
icantly with the PDI) in the prediction of the frequency
of STYs, while the frequency of TSTDs is found to be
related largely to low-level relative vorticity.
On the other hand, TY frequency is found to be related
to low-level relative vorticity, vertical wind shear, and
upper-level divergence. However, only the change in
relative vorticity is found to be related to the transition
phase of ENSO, while the change in VWS and divergence
might be related to other factors. This may be due to
weaker ENSO forcing during the transition phase, which
implies that other climate variability might also contrib-
ute to the variability of TYs. Using stepwise regression,
only relative vorticity and VWS are identified as domi-
nant factors that control TY frequency, highlighting the
importance of these two factors in forecasting TYs.
In a recent study, Du et al. (2011) found that VWS
increases in the summer following strong El Nino events
through the development of a warm Kelvin wave from
the tropical Indian Ocean that then suppresses TC for-
mation. Thus, the EOF2 pattern of VWS might be in-
duced by forcing from the Indian Ocean, which requires
further investigation. In addition, Zhan et al. (2011) also
suggested that the SST anomaly in the east Indian
Ocean (EIO) (108S–22.58N, 758–1008E) affects the ba-
sinwide genesis of TCs in the WNP [which also included
the South China Sea (SCS)]. As a comparison, we also
determined whether the frequency of different TC
groups is related to the EIO OHC. As shown by the
correlation maps of OHC with different TC groups
(Figs. 4, 6, and 7), the correlation in the EIO is not
prominent in most cases, which indicates that the impact
of EIO OHC on TCs is generally weak. The only ex-
ception is the simultaneous TY–OHC correlation, with
a significant negative value of 20.35 at 95% confidence,
suggesting that a warming in the EIO will lead to a de-
crease in the number of TYs in the WNP. This is con-
sistent with the results of Zhan et al. (2011), although
the correlation coefficient in the present study is much
smaller [20.69 in the case of Zhan et al. (2011)]. This
discrepancy may be related to the chosen study region.
Zhan et al. took into account all TCs that formed within
the WNP as well as the SCS, whereas we consider only
those formed within the WNP. This suggests that the im-
pact of anomalous warming in the EIO on TC genesis in
the WNP and SCS may be different. Thus, the interaction
between EIO warming and ENSO on cyclogenesis in the
WNP and SCS, especially during the transition phase of
ENSO, still requires future investigation. Nevertheless,
the results from this study clearly demonstrate that TCs
with different intensities are modulated differently by
dynamic and thermodynamic factors during the various
phases of ENSO.
Acknowledgments. The research described in this
paper was supported by 973 Basic Research Program
Grant 2009CB421400, National Nature Science foun-
dation of China Grant 41175079, and Hong Kong
Croucher Foundation Grant 9220055. The authors are
grateful to the two reviewers and to the editor for their
constructive comments and suggestions.
REFERENCES
Bell, G. D., and Coauthors, 2000: Climate assessment for 1999.
Bull. Amer. Meteor. Soc., 81, S1–S50.
Camargo, S. J., and A. H. Sobel, 2005: Western North Pacific tropical
cyclone intensity and ENSO. J. Climate, 18, 2996–3006.
——, K. A. Emanuel, and A. H. Sobel, 2007a: Use of a genesis
potential index to diagnose ENSO effects on tropical cyclone
genesis. J. Climate, 20, 4819–4834.
——, A. W. Robertson, S. J. Gaffney, P. Smyth, and M. Ghil,
2007b: Cluster analysis of typhoon tracks. Part II: Large-scale
circulation and ENSO. J. Climate, 20, 3654–3676.
Chan, J. C. L., 2007: Interannual variations of intense typhoon
activity. Tellus, 59, 455–460.
——, 2008: Decadal variations of intense typhoon occurrence
in the western North Pacific. Proc. Roy. Soc. London, 464A,249–272.
——, and K. S. Liu, 2004: Global warming and western North Pa-
cific typhoon activity from an observational perspective.
J. Climate, 17, 4590–4602.
——, and M. Xu, 2009: Inter-annual and inter-decadal variations of
landfalling tropical cyclones in East Asia. Part I: Time-series
analysis. Int. J. Climatol., 29, 1285–1293.
Chen, G. H., and R. Huang, 2008: Influence of monsoon over the
warm pool on interannual variation on tropical cyclone activity
over the western North Pacific. Adv. Atmos. Sci., 25, 319–328.
Chia, H. H., and C. F. Ropelewski, 2002: The interannual vari-
ability in the genesis location of tropical cyclones in the
northwest Pacific. J. Climate, 15, 2934–2944.
Du, Y., L. Yang, and S.-P. Xie, 2011: Tropical Indian Ocean in-
fluence on northwest Pacific tropical cyclones in summer fol-
lowing strong El Nino. J. Climate, 24, 315–322.
Emanuel, K. A., and D. Nolan, 2004: Tropical cyclone activity and
the global climate system. Preprints, 26th Conf. on Hurricanes
and Tropical Meteorology, Miami, FL, Amer. Meteor. Soc.,
10A.2. [Available online at http://ams.confex.com/ams/
26HURR/techprogram/paper_75463.htm.]
1 SEPTEMBER 2012 L I A N D Z H O U 5877
Page 15
Frank, W. M., and G. S. Young, 2007: The interannual variability of
tropical cyclones. Mon. Wea. Rev., 135, 3587–3598.
Gray, W. M., 1979: Hurricanes: Their formation, structure and
likely role in the tropical circulation. Meteorology over the
Tropical Oceans, D. B. Shaw, Ed., Royal Meteorological So-
ciety, 155–218.
Huang, F., and S. Xu, 2010: Super typhoon activity over the western
North Pacific and its relationship with ENSO. J. Ocean Univ.
China, 9, 123–128.
Kalnay, E., and Coauthors, 1996: The NCEP/NCAR 40-Year Re-
analysis Project. Bull. Amer. Meteor. Soc., 77, 437–471.
Kessler, W. S., 1990: Observations of long Rossby waves in the
northern tropical Pacific. J. Geophys. Res., 95 (C4), 5183–5217.
Kim, H.-M., P. J. Webster, and J. A. Curry, 2011: Modulation of
North Pacific tropical cyclone activity by three phases of
ENSO. J. Climate, 24, 1839–1849.
Kinter, J. L., K. Miyakoda, and S. Yang, 2002: Recent change in the
connection from the Asian monsoon to ENSO. J. Climate, 15,
1203–1215.
Smith, T. M., and R. W. Reynolds, 2004: Improved extended re-
construction of SST (1854–1997). J. Climate, 17, 2466–2477.
Torrence, C., and G. P. Compo, 1998: A practical guide to wavelet
analysis. Bull. Amer. Meteor. Soc., 79, 61–78.
Wada, A., and J. C. L. Chan, 2008: Relationship between typhoon
activity and upper ocean heat content. Geophys. Res. Lett., 35,L17603, doi:10.1029/2008GL035129.
Wang, B., and J. C. L. Chan, 2002: How strong ENSO events affect
tropical storm activity over the western North Pacific. J. Cli-
mate, 15, 1643–1658.
——, R. Wu, and R. Lukas, 1999: Roles of the western North Pa-
cific wind variation in thermocline adjustment and ENSO
phase transition. J. Meteor. Soc. Japan, 77, 1–16.
Wu, M. C., W. L. Chang, and W. M. Leung, 2004: Impacts of
El Nino–Southern Oscillation events on tropical cyclone
landfalling activity in the western North Pacific. J. Climate, 17,
1419–1428.
Zhan, R., Y. Wang, and X. Lei, 2011: Contributions of ENSO and
east Indian Ocean SSTA to the interannual variability of
northwest Pacific tropical cyclone frequency. J. Climate, 24,
509–521.
Zhou, W., and J. C. L. Chan, 2007: ENSO and South China Sea
summer monsoon onset. Int. J. Climatol., 27, 157–167.
5878 J O U R N A L O F C L I M A T E VOLUME 25