Abstract: We have performed multimodal imaging of live fibroblastcells infected by murine cytomegalovirus (mCMV). The infection processwas monitored by imaging the two-photon fluorescence signal from aGFP-expressing strain of mCMV, whilst changes to lipid droplet configu-ration were observed by CARS imaging. This allowed us to identify threevisually distinct stages of infection. Quantitative analysis of lipid dropletnumber and size distributions were obtained from live cells, which showedsignificant perturbations across the different stages of infection. The CARSand two-photon images were acquired simultaneously and the experimentaldesign allowed incorporation of an environmental control chamber to main-tain cell viability. Photodamage to the live cell population was also assessed.
OCIS codes: (180.0180) Microscopy; (170.3880) Medical and biological imaging; (170.1530)Cell analysis; (190.4380) Nonlinear optics, four-wave mixing; (170.2520) Fluorescence mi-croscopy.
References and links1. I. Robinson, M. A. Ochsenkuhn, C. J. Campbell, G. Giraud, W. J. Hossack, J. Arlt, and J. Crain, “Intracellular
imaging of host-pathogen interactions using combined CARS and two-photon fluorescence microscopies,” J.Biophoton. 3, 138–146 (2010).
2. J. Cheng, “Coherent anti-Stokes Raman scattering microscopy,” Appl. Spectrosc. 61, 197A–208A (2007).3. C. L. Evans and X. S. Xie, “Coherent anti-Stokes Raman scattering microscopy: chemical imaging for biology
and medicine,” Annu. Rev. Anal. Chem. 1, 883–909 (2008).4. Y. Guo, K. R. Cordes, R.V. Farese, and T.C. Walther, “Lipid droplets at a glance,” J. Cell Sci. 122, 749–752
(2009).5. D. M. Jones and J. McLauchlan, “Hepatitis C virus: assembly and release of virus particles,” J. Biol. Chem. 285,
22733–22739 (2010).6. R. K. Lyn, D. C Kennedy, A. Stolow, A. Ridsdale, and J. P. Pezacki, “Dynamics of lipid droplets induced by the
hepatitis C virus core protein,” Biochem. Biophys. Res. Commun. 399, 518–524 (2010).7. E. Herker, C. Harris, C. Hernandez, A. Carpentier, K. Kaehlcke, A. R. Rosenberg, R. V. Farese, and M. Ott,
8. R. Bartenschlager, F. Penn, V. Lohmann and P. Andre, “Assembly of infectious hepatitis C virus particles,” TrendsMicrobiol. 19, 95–103 (2010).
#147177 - $15.00 USD Received 9 May 2011; revised 5 Jun 2011; accepted 8 Jul 2011; published 2 Aug 2011(C) 2011 OSA 1 January 2011 / Vol. 2, No. 1 / BIOMEDICAL OPTICS EXPRESS 2504
9. A. Angulo, P. Ghazal, and M. Messerle, “The major immediate-early gene ie3 of mouse cytomegalovirus isessential for viral growth,” J. Virol. 74, 11129–11136 (2000).
10. N. E. Bishop, “Hepatitis A virus replication: an intermediate in the uncoating process,” Intervirology 43, 36–47(2000).
11. G. Sluder, J. J. Nordberg, F. J. Miller, and E. H. Hinchcliffe, “A sealed preparation for long-term observations ofcultured cells,” in Live Cell Imaging: A Laboratory Manual, R. D. Goldman and D. L. Spector eds. (Cold SpringHarbor Laboratory Press, 2005), pp. 345–349.
12. D. J. Stevenson, D. J. Carnegie, B. Agate, F. Gunn-Moore, and K. Dholakia, “Long-term cell culture on a micro-scope stage: the carrel flask revisited.” Microsc. Anal. 22, 9–11 (2008).
13. M. E. Dailey, D. C. Focht, A. Khodjakov, C. L. Rieder, K. R. Spring, N. S. Claxton, S. G.Olenych, J. D. Griffin, and M. W. Davidson, “Maintaining live cells on the microscope stage,”http://www.microscopyu.com/articles/livecellimaging/livecellmaintenance.html.
14. E. S. Mocarski, T. Shenk, and R. F. Pass, “Cytomegaloviruses,” in Fields Virology, D. M. Knipe and P. M. Howleyeds. (Lippincott Williams and Wilkins, 2006) pp. 2702–2772.
15. A. Yu, X. Ye, D. Ionascu, W. Cao, and P.M. Champion, “Two-colour pump-probe laser spectroscopy instrumentwith picosecond time-resolved electronic delay and extended scan range,” Rev. Sci. Instrum. 76 114301 (2005).
16. X. Nan, J. X. Cheng, and X. S. Xie, “Vibrational imaging of lipid droplets in live fibroblast cells with coherentanti-Stokes Raman scattering microscopy,” J. Lipid. Res. 44, 2202–2208 (2003).
17. W. Denk, D. W. Piston, and W. W. Webb, “Multi-photon molecular excitation in laser scanning microscopy,” inHandbook of Biological Confocal Microscopy J. B. Pawley, (Springer, 2006) pp. 535–549.
18. J. Bewersdorf and S. W. Hell, “Picosecond pulsed two-photon imaging with repetition rates of 200 and 400MHz,” J. Microsc. 191, 28–38 (1998).
19. M. A. Hayat, “Chemical fixation,” in Principles and Techniques of Electron Microscopy Biological Applications(Cambridge University Press, 2000), pp. 43–44.
20. H. Fried and U. Kutay, “Nucleocytoplasmic transport: taking an inventory,” Cell. Mol. Life Sci. 60, 1659–1688(2003).
21. W. Muranyi, J. Haas, M. Wagner, G. Krohne, and U. H. Koszinowski, “Cytomegalovirus recruitment of cellularkinases to dissolve the nuclear lamina,” Science 297, 854–857 (2002).
22. W. S. Rasband, “ImageJ,” U. S. National Institutes of Health, http://imagej.nih.gov/ij/.
1. Introduction
The physical dimensions of viruses are smaller than the resolution limit of far field microscopythereby precluding direct observation. As a result, many studies focus on examining the host–pathogen interactions which can be observed with far field microscopy. These studies generallyinvolve labelling cells with fluorescent markers. However, labels can degrade into toxic photo-chemical reaction products and can also perturb the native biochemical pathways which operatebetween host and pathogen. This has restricted many previous investigations to working withfixed rather than living cells.
In this paper we demonstrate the application of far field microscopy to the study of host–pathogen interactions in unlabelled live cells. Specifically, we examine the correlation betweencytomegalovirus infection and the behaviour of cellular lipid droplets by imaging live cellson a multimodal microscope platform which combines coherent anti-Stokes Raman scatte-ring (CARS) and two-photon fluorescence (TPF). This work extends our previous study [1]which was based only on fixed cell samples.
The importance of label-free live cell imaging has led to the development of a variety ofnew methods for far field microscopy. Among them, CARS has emerged as the ideal techniquefor imaging cellular lipid droplets [2, 3]. The basic functions of lipid droplets as a store forenergy reserves, hydrophobic compounds, and membrane building blocks have long been un-derstood [4]. Recently, the more subtle and complex role played by these organelles has beenrevealed, including the discovery that lipid droplets are appropriated by the hepatitis C virusduring the infection cycle [5–8]. CARS is clearly a valuable tool for the study of the link be-tween lipids and viral replication. Used alone however, CARS is insufficient for identifyingthe infection state of cells, so we combine CARS with TPF to simultaneously image cellu-lar lipid droplets whilst identifying and monitoring viral activity using a genetically modified
#147177 - $15.00 USD Received 9 May 2011; revised 5 Jun 2011; accepted 8 Jul 2011; published 2 Aug 2011(C) 2011 OSA 1 January 2011 / Vol. 2, No. 1 / BIOMEDICAL OPTICS EXPRESS 2505
murine cytomegalovirus (mCMV). The virus causes the host cell to express green fluorescentprotein (GFP) upon infection.
The use of the modified virus allows the cellular expression of GFP to be utilised as a defini-tive marker of infection, to indicate that cellular translation of viral mRNA has begun. Themodified genetic code persists in the DNA of viral progeny, therefore GFP expression contin-ues for an extended time period after the initial infection. Furthermore, with this technique, it ispossible to use the GFP expression to correlate observed cell changes with the overall timescaleof the infection process. This imaging technique avoids the problems of toxicity, changes to cellfunction and fluorophore fading inherent to fluorescent labels.
In our previous study [1] we combined CARS and TPF imaging to compare fixed samples ofhealthy (uninfected) and infected mouse fibroblast cells. The main results were that the viruscauses morphological changes to the cell, including expansion of the cell nucleus, and that anapparent rearrangement of lipid droplets occurs at some point during the infection process.
The aim of this study is to understand this dynamic process by relating the observed changesin lipid droplet configuration with the GFP expression, and hence the infection stage. A prelim-inary study of fixed cell samples is used to systematically identify the stages of viral infectionby observing the quantity of GFP expression within the cell. We then image the lipid dropletbehaviour in live cells during the infection process by using the fixed cell data as a reference toidentify the stage of infection from the level of GFP expression.
2. Experimental Method
2.1. Sample Preparation
The method for sample preparation and infection with the genetically modified virus was de-scribed in detail in a previous paper [1]. Briefly, NIH/3T3 fibroblast cells with a passage numberin the range 11–20 were cultured in Dulbecco’s modified Eagle’s medium (DMEM), with L-glutamine (200 mol/m3), penicillin/streptomycin (10 000 units/ml) and 10 % calf serum. Stan-dard growth conditions of 37 ◦C and a 5 % CO2 environment were maintained during an incu-bation period of 12 hours. Cells were seeded onto glass-bottom Petri dishes (P35Gcol-1.0-14-C,MatTec). Infection with mCMV wildtype mutant C3X was carried out using a genetically mod-ified version of the Smith strain [9] at a multiplicity of infection of 1, with the growth mediacontaining 3 % calf serum in order to reduce cell growth.
2.2. Preliminary Study
A preliminary study was conducted with fixed cells, prepared as described above, with theexception that the cells were seeded onto glass coverslips and fixed using 1 % formaldehyde inphosphate buffered saline. By using a synchronized transfection method [10] a range of sampleswere fixed at known time points between 0 and 96 hours post transfection (hpt). The samplestherefore consisted of a large number of cells fixed at the same time (hpt) in the infection cycle.
2.3. Live Cell Chamber
A portable cell chamber was built to provide a suitable environment for sustaining live cellson the microscope stage. The chamber was designed to attach directly onto the microscope, asshown in Fig. 1. Since the function of the chamber was to sustain a stable population of livingcells, access for passaging or perfusion was not required. Therefore, the chamber was designedto be airtight, to maintain a 5 % CO2 atmosphere, and to provide a controlled temperatureof 37.0 ◦C [11]. The top window of the chamber was designed to touch the growth media inorder to minimize signal loss due to refraction and to prevent the formation of condensationon the glass. We found that this set-up enabled live cells to survive on the microscope for at
#147177 - $15.00 USD Received 9 May 2011; revised 5 Jun 2011; accepted 8 Jul 2011; published 2 Aug 2011(C) 2011 OSA 1 January 2011 / Vol. 2, No. 1 / BIOMEDICAL OPTICS EXPRESS 2506
TPF signal
Microscopeobjective lens
Heating element5 % CO2 environment
Heating element
Thermocouple
Temperaturecontroller (37.0 °C)
CARS signal
Petri dish
Coverslips
Attaches directly tomicroscope stage
Fig. 1. Portable cell chamber for live cell imaging. A glass-bottom Petri dish containingthe cell sample is sealed into the chamber in a 5 % CO2 environment. The aluminiumchamber body is fitted with heating elements and connected to a temperature controllerwhich maintains a constant temperature of 37.0 ◦C. The chamber attaches directly to thestage of the (custom-built) microscope.
least 7 days. This was verified by observing a gradual growth in cell population from the initial50–70 % to 100 % confluence over the period. A phenol-red indicator confirmed that neutralpH was maintained, suggesting that the CO2 concentration remained constant inside the cham-ber [12,13]. As cytomegalovirus completes its replication cycle after 72 hours at most [14], thelongevity of cells in the chamber is more than sufficient for the process being investigated.
2.4. Imaging Instrumentation
A custom-built laser-scanning inverted CARS microscope setup [1], shown in Fig. 2, was usedto record both CARS and TPF images simultaneously. The laser source was a pair of titanium-sapphire lasers (Mira 900, Coherent), which were mode-locked and synchronized via a phase-locked loop system [15] (Synchrolock, Coherent).
The 2845 cm−1 Raman vibration, which corresponds with the aliphatic C–H vibrations foundin lipids [16], was targeted by tuning the pump laser wavelength to 714 nm and the Stokes laserto 896 nm. This generated a CARS signal at 593 nm, which was reflected out of laser beampath with a long wave-pass dichroic mirror (683dcxr, Chroma) and further filtered with a shortwave-pass filter (680/SP-25, Semrock) and a narrow band-pass filter (600/14-25, Semrock).The forward CARS (F-CARS) signal was detected with a photomultiplier tube (PMT) (R3896,Hamamatsu).
The Stokes beam at 896 nm falls within the excitation band of GFP, allowing simultaneousTPF imaging with CARS. Unlike CARS, TPF is non-directionally scattered [17] and is mostefficiently collected in the backward direction. A dichroic mirror behind the objective lensreflected the TPF signal out of the beam path. An identical PMT (R3896) was used to detect thesignal. Two filters, a short wave-pass (680/SP-25, Semrock) and a broad band-pass (510/84-25,Semrock), were used to block the pump and Stokes laser wavelengths whilst transmitting mostof the GFP emission spectrum. The band-pass filter also blocks the CARS signal at 593 nm.The picosecond pulse duration used in this set-up is ideal for CARS microscopy, but less so forTPF. Nonetheless, it is still capable of producing high-quality TPF images [18].
Image acquisition was achieved with a customized LabVIEW program, which controls thebeam scanning mirrors and records the CARS and TPF PMT signals. The laser power at thesample was adjusted with neutral density filters (not shown in the figure). Bright field mi-croscopy was used for all sample alignment and focusing in order to minimize the exposure ofthe sample to the laser beam.
#147177 - $15.00 USD Received 9 May 2011; revised 5 Jun 2011; accepted 8 Jul 2011; published 2 Aug 2011(C) 2011 OSA 1 January 2011 / Vol. 2, No. 1 / BIOMEDICAL OPTICS EXPRESS 2507
Beam scanning
mirrors (x and y)
Stokes beam
Pump beam
Dichroic mirror
Microscope
objective lens
Flip mirrorCamera for bright
field imaging
Condenser
Live cell
chamber
Dichroic mirror
Halogen lamp
CARS filters
PMT for CARS
detection
PMT for TPF
detection
TPF filters
Fig. 2. Multimodal CARS and TPF microscopy system. The Stokes laser is tuned to 896 nmand the pump to 714 nm, to target a Raman shift of 2845 cm−1. The two lasers are mode-locked and the pulses are synchronized. An x–y pair of galvanometer mirrors is used to scanthe combined beams across the sample. The CARS signal is detected by a photomultipliertube (PMT) in the forward direction (F-CARS) and TPF is detected, also by a PMT, in thebackward direction. The set-up can also perform bright field imaging with a halogen lampand camera.
3. Results and Discussion
3.1. Multimodal microscopy: simultaneous CARS and TPF
We used CARS to target the C–H Raman band at 2845 cm−1. Bright spots were observed inthe cytosol, which were identified as the resonant CARS signal from lipid droplets [16]. Thecellular and nuclear membranes were also visible in CARS images due to the nonresonantbackground, revealing the cell morphology and the outline of the nucleus as a dark ellipticalregion.
Simultaneous and sequential CARS and TPF images are shown in Fig. 3. Sequential TPF im-ages (Fig. 3(C)) were collected by scanning the Stokes laser beam only, the wavelength of whichfalls within the two-photon excitation band of GFP. It is evident that the TPF images generatedsimultaneously with CARS (Fig. 3(B)) are comparable to the images generated sequentially(Fig. 3(C)), with both TPF images revealing similar features. The bright high-contrast spots inthe simultaneous image (Fig. 3(B)) could in principle arise from either CARS or GFP. To con-firm that cross-channel leakage was not significant, pairs of images were taken with the phaseof the pump and Stokes beams shifted by approximately 180◦ using the phase-locked loop sys-tem (Synchrolock). When the beams are out of phase, pump and Stokes pulses do not arriveat the sample simultaneously, so frequency mixing cannot occur and no CARS signal is gen-erated. This test allows ready discrimination of the TPF signal from the CARS and confirmedthat the filters prevented cross-channel leakage. The bright spots in TPF images recorded si-multaneously with CARS (Fig. 3(B)) were therefore unambiguously identified as sites of GFP
#147177 - $15.00 USD Received 9 May 2011; revised 5 Jun 2011; accepted 8 Jul 2011; published 2 Aug 2011(C) 2011 OSA 1 January 2011 / Vol. 2, No. 1 / BIOMEDICAL OPTICS EXPRESS 2508
Fig. 3. Images of fibroblast cells infected with a genetically modified mCMV which causescellular expression of GFP. The CARS image (A) shows the distribution of cellular lipiddroplets. The TPF image (B), acquired simultaneously with the CARS, shows the sites ofGFP, indicating that the cell is infected. A second TPF image (C) was recorded after theCARS image (sequentially) using only the Stokes laser beam; the pump beam was blocked.
Fig. 4. A stack of CARS images through a single cell. Slices were taken at 0.25 µm in-crements in the z-direction. The laser power at the sample was approximately 35 mW. Thebright spots visible in the images were identified as lipid droplets.
accumulation.
3.2. Cell Viability
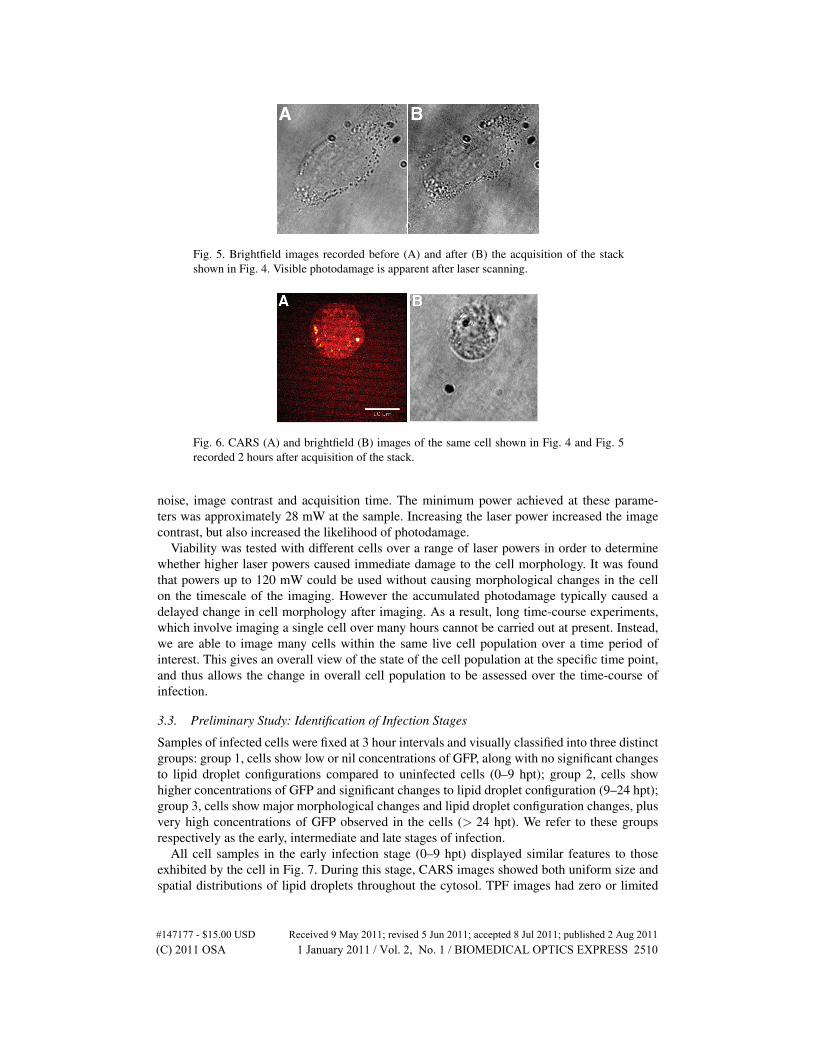
The setup enabled acquisition of high-contrast CARS images using a reasonably low laserpower of approximately 35 mW at the sample. Figure 4 shows a stack of images of a singlelive cell at increments of 0.25 µm, starting from the coverslip and scanning upwards in thez-direction. Bright field images were taken before (Fig. 5(A)) and after (Fig. 5(B)) recordingthe stack to assess possible photodamage. The image taken after recording the stack showsmorphological changes to the cellular membrane, suggesting that some photodamage had oc-curred. Images of the same cell recorded two hours later, Fig. 6, revealed that the cell had be-come rounded and detached from the surface of the Petri dish. Nearby cells retained a normalappearance, indicating that the cell’s death was due to photodamage.
The accumulated laser exposure experienced by a cell during stack acquisition is far greaterthan required for imaging a single slice. We tested cell viability against a range of laser pow-ers in order to determine the optimum parameters for 2D imaging. We found that acquiringa 512×512 pixel image and integrating over 4 scans provided the optimum balance between
#147177 - $15.00 USD Received 9 May 2011; revised 5 Jun 2011; accepted 8 Jul 2011; published 2 Aug 2011(C) 2011 OSA 1 January 2011 / Vol. 2, No. 1 / BIOMEDICAL OPTICS EXPRESS 2509
Fig. 5. Brightfield images recorded before (A) and after (B) the acquisition of the stackshown in Fig. 4. Visible photodamage is apparent after laser scanning.
Fig. 6. CARS (A) and brightfield (B) images of the same cell shown in Fig. 4 and Fig. 5recorded 2 hours after acquisition of the stack.
noise, image contrast and acquisition time. The minimum power achieved at these parame-ters was approximately 28 mW at the sample. Increasing the laser power increased the imagecontrast, but also increased the likelihood of photodamage.
Viability was tested with different cells over a range of laser powers in order to determinewhether higher laser powers caused immediate damage to the cell morphology. It was foundthat powers up to 120 mW could be used without causing morphological changes in the cellon the timescale of the imaging. However the accumulated photodamage typically caused adelayed change in cell morphology after imaging. As a result, long time-course experiments,which involve imaging a single cell over many hours cannot be carried out at present. Instead,we are able to image many cells within the same live cell population over a time period ofinterest. This gives an overall view of the state of the cell population at the specific time point,and thus allows the change in overall cell population to be assessed over the time-course ofinfection.
3.3. Preliminary Study: Identification of Infection Stages
Samples of infected cells were fixed at 3 hour intervals and visually classified into three distinctgroups: group 1, cells show low or nil concentrations of GFP, along with no significant changesto lipid droplet configurations compared to uninfected cells (0–9 hpt); group 2, cells showhigher concentrations of GFP and significant changes to lipid droplet configuration (9–24 hpt);group 3, cells show major morphological changes and lipid droplet configuration changes, plusvery high concentrations of GFP observed in the cells (> 24 hpt). We refer to these groupsrespectively as the early, intermediate and late stages of infection.
All cell samples in the early infection stage (0–9 hpt) displayed similar features to thoseexhibited by the cell in Fig. 7. During this stage, CARS images showed both uniform size andspatial distributions of lipid droplets throughout the cytosol. TPF images had zero or limited
#147177 - $15.00 USD Received 9 May 2011; revised 5 Jun 2011; accepted 8 Jul 2011; published 2 Aug 2011(C) 2011 OSA 1 January 2011 / Vol. 2, No. 1 / BIOMEDICAL OPTICS EXPRESS 2510
contrast, indicating either no GFP, or the presence of a low concentration of GFP in the cytosol.There was no TPF signal from the nucleus, as GFP is expressed in the cytoplasm. The imagesalso show areas of small accumulations of GFP in the cytosol, which could indicate the sites ofGFP expression or suggest vesicle-mediated GFP transport.
Fig. 7. CARS (A) and TPF (B) images of cells fixed at the early stage of infection. Lipiddroplets of regular size are uniformly distributed in the cytosol. The low level of fluores-cence provides limited contrast in the TPF image.
Cell samples infected for 9–24 hpt, the intermediate stage, typically exhibited the featuresshown in Fig. 8. The cells in this group displayed some lipid droplet clustering, where non-uniform spatial distributions of lipid droplets and some relatively large lipid droplets wereidentifiable. In addition, a general increase in cell nucleus area was evident. This is consis-tent with our earlier study [1], although in that investigation we were unable to associate nu-clear expansion with a definite infection stage. The larger overall TPF signal indicated higherconcentrations of GFP in the cytosol, thus confirming a progression of the infection.
Fig. 8. CARS (A) and TPF (B) images of cells in the intermediate stage of infection. Thedistribution of lipid droplets is less uniform than in the early stage (Fig. 7) with the emer-gence of some clustering. The TPF image shows an increased amount of GFP expression.
Samples containing cells infected for > 24 hpt, Fig. 9, we designated as the late stage ofinfection. Cells in this infection stage imaged using CARS show a dramatic reduction in thenumber of lipid droplets. The corresponding TPF images indicated high concentrations of GFPin both cytosol and nucleus, showing that GFP is imported into the cell nucleus at this lateinfection stage. Additionally, many images display fragmented cell nuclei, which suggests thecells are undergoing apoptosis.
Since GFP is expressed as a result of viral protein translation, we expect the fluorescenceintensity to increase as the infection progresses. Figure 10 shows the measure of intensity ofintracellular fluorescence per cell throughout the infection process. The graph shows a signif-icant increase in fluorescence intensity as the infection progressed, where an average intensityof 17.3, 160.4 and 1025.9 (normalised units) was measured for each group of infected cells.
#147177 - $15.00 USD Received 9 May 2011; revised 5 Jun 2011; accepted 8 Jul 2011; published 2 Aug 2011(C) 2011 OSA 1 January 2011 / Vol. 2, No. 1 / BIOMEDICAL OPTICS EXPRESS 2511
Fig. 9. CARS (A) and TPF (B) images of a sample of cells fixed in the late infection stage.(C) and (D) are CARS and TPF images of a different area of the same sample. The contrastin the two CARS images (A,C) is very limited due to the absence of lipid droplets. TheTPF images (B,D) show a high level of GFP expression as well as fragmentation of cellnuclei suggesting apoptosis.
Fig. 10. Graph showing the average intensities for TPF images acquired pre-infection; andduring the early, intermediate and late stages. Error bars indicate 1 standard deviation. Toaccount for small changes in laser power between images the two-photon intensities havebeen normalized by dividing by the square of the power.
Pre-infection TPF images were also acquired where an average intensity of 0.09 was measured,indicating that there was no significant autofluorescence background in TPF images.
3.4. Imaging of Live Infected Cells
Although our preliminary study allowed us to group the infection process into three visu-ally distinct stages, it is unsuitable for quantitative analysis of the observed changes in lipiddroplet configuration because the formaldehyde fixing method causes rapid degradation of lipiddroplets [19]. Therefore, the use of live cell samples is imperative for further analysis of lipiddroplet characteristics during the infection process. Different cells in live samples had oftenprogressed to different stages of the infection process, therefore within one image, each cell
#147177 - $15.00 USD Received 9 May 2011; revised 5 Jun 2011; accepted 8 Jul 2011; published 2 Aug 2011(C) 2011 OSA 1 January 2011 / Vol. 2, No. 1 / BIOMEDICAL OPTICS EXPRESS 2512
Fig. 11. CARS (A) and bright field (B) images of a group of live cells during the early stageof infection. The CARS image shows lipid droplets of regular size uniformly distributedthroughout the cytosol. The pump and Stokes laser powers at the sample were approxi-mately 25 mW and 30 mW respectively. The bright field image shows the cell outlinesonly.
Fig. 12. CARS (A) and TPF (B) images of two cells in the intermediate stage of infection.The images are overlaid in (C). The pump and Stokes laser powers at the sample wereapproximately 28 mW and 32 mW respectively. The CARS image shows a non-uniformdistribution of lipid droplets within the cytosol, with the appearance of clustering, specif-ically towards the neighbouring cell. The TPF image confirms that the cells are infected,and also shows that some GFP has been imported into the nucleus.
may be at a different stage of infection, as evident in Fig. 13(B). Using the data from the pre-liminary study we were able to assign the live cells to a definite stage (early, intermediate orlate) of the infection process.
Cells in the early stage of infection provided a low overall intensity in TPF images. GFPexpression is initiated by cellular translation of viral mRNA, therefore the initial appearanceof GFP within the cell can be attributed to the onset of viral replication. CARS images of livecells acquired during the early infection stage, such as the image shown in Fig. 11, clearly showregularly-sized lipid droplets uniformly distributed throughout the cytosol, consistent with thepreliminary study (Fig. 7).
CARS images acquired from cells in the intermediate stage of infection, such as the imageshown in Fig. 12, showed non-uniform spatial distribution of lipid droplets throughout the cy-tosol. In addition, some relatively large lipid droplets were seen, suggesting a clustering effect.This behaviour is consistent with observations in the preliminary study (Fig. 8). Furthermore,some images of live cell infection, including Fig. 12, suggested that lipid droplets migrated to-wards neighbouring cells. Live cell TPF images revealed GFP in a number of cell nuclei. Thisfeature was not observed in fixed cell images at the same infection stage, where GFP was onlydetected in the nucleus during the late stages of infection. These live cell images suggest thatnuclear import of GFP occurs during the same infection stage as lipid droplet aggregation, in-dicating a possible link between the two processes. The import of GFP into the nucleus was anunexpected feature. Since GFP is synthesized in the cytosol, and nucleocytoplasmic transportis highly controlled [20], large molecules such as GFP must be actively transported in order to
#147177 - $15.00 USD Received 9 May 2011; revised 5 Jun 2011; accepted 8 Jul 2011; published 2 Aug 2011(C) 2011 OSA 1 January 2011 / Vol. 2, No. 1 / BIOMEDICAL OPTICS EXPRESS 2513
Fig. 13. CARS (A), TPF (B) and overlaid (C) images of a group of live cells in the lateinfection stage. (D–F) show a different group of cells. The pump and Stokes laser power atthe sample was approximately 43 mW and 47 mW respectively. The CARS images (A,D)show a small number of lipid clusters. The high intensity in the corresponding TPF images(B,E) confirm the late stage of infection. Inhomogeneous infection is evident in image (B),where most cells are in the late infection stage with the exception of the two cells markedX which are in the intermediate stage, identified using fixed cell data as a reference.
enter the nucleus. This suggests that the behaviour may not be a cellular function initiated bythe virus but rather a side-effect of infection caused by some mechanism occurring within thecell during the infection cycle [21].
CARS images of cells in the late stages of infection, Fig. 13, show a significant reductionin the number of lipid droplets. Where lipid droplets were still visible, much larger dropletsizes were typical. The high intensity in TPF images provided evidence of fragmented cells andapoptosis.
Fig. 14. Histogram showing the probability distribution of the number of lipid droplets ina cell for the early, intermediate and late infection stages. The separate counts for eachinfection stage group were binned and are plotted in the histogram. An empty bin for aparticular infection stage indicates that there were no cells whose lipid droplet count waswithin the bin range.
#147177 - $15.00 USD Received 9 May 2011; revised 5 Jun 2011; accepted 8 Jul 2011; published 2 Aug 2011(C) 2011 OSA 1 January 2011 / Vol. 2, No. 1 / BIOMEDICAL OPTICS EXPRESS 2514
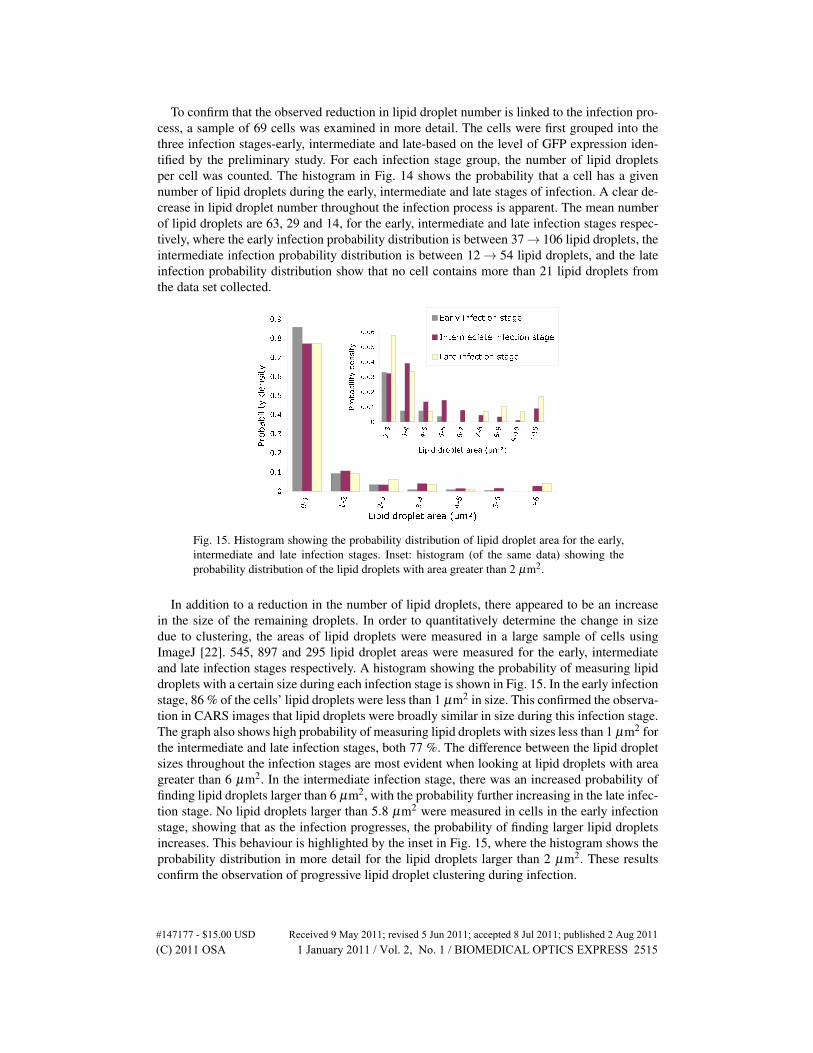
To confirm that the observed reduction in lipid droplet number is linked to the infection pro-cess, a sample of 69 cells was examined in more detail. The cells were first grouped into thethree infection stages-early, intermediate and late-based on the level of GFP expression iden-tified by the preliminary study. For each infection stage group, the number of lipid dropletsper cell was counted. The histogram in Fig. 14 shows the probability that a cell has a givennumber of lipid droplets during the early, intermediate and late stages of infection. A clear de-crease in lipid droplet number throughout the infection process is apparent. The mean numberof lipid droplets are 63, 29 and 14, for the early, intermediate and late infection stages respec-tively, where the early infection probability distribution is between 37 → 106 lipid droplets, theintermediate infection probability distribution is between 12 → 54 lipid droplets, and the lateinfection probability distribution show that no cell contains more than 21 lipid droplets fromthe data set collected.
Fig. 15. Histogram showing the probability distribution of lipid droplet area for the early,intermediate and late infection stages. Inset: histogram (of the same data) showing theprobability distribution of the lipid droplets with area greater than 2 µm2.
In addition to a reduction in the number of lipid droplets, there appeared to be an increasein the size of the remaining droplets. In order to quantitatively determine the change in sizedue to clustering, the areas of lipid droplets were measured in a large sample of cells usingImageJ [22]. 545, 897 and 295 lipid droplet areas were measured for the early, intermediateand late infection stages respectively. A histogram showing the probability of measuring lipiddroplets with a certain size during each infection stage is shown in Fig. 15. In the early infectionstage, 86 % of the cells’ lipid droplets were less than 1 µm2 in size. This confirmed the observa-tion in CARS images that lipid droplets were broadly similar in size during this infection stage.The graph also shows high probability of measuring lipid droplets with sizes less than 1 µm2 forthe intermediate and late infection stages, both 77 %. The difference between the lipid dropletsizes throughout the infection stages are most evident when looking at lipid droplets with areagreater than 6 µm2. In the intermediate infection stage, there was an increased probability offinding lipid droplets larger than 6 µm2, with the probability further increasing in the late infec-tion stage. No lipid droplets larger than 5.8 µm2 were measured in cells in the early infectionstage, showing that as the infection progresses, the probability of finding larger lipid dropletsincreases. This behaviour is highlighted by the inset in Fig. 15, where the histogram shows theprobability distribution in more detail for the lipid droplets larger than 2 µm2. These resultsconfirm the observation of progressive lipid droplet clustering during infection.
#147177 - $15.00 USD Received 9 May 2011; revised 5 Jun 2011; accepted 8 Jul 2011; published 2 Aug 2011(C) 2011 OSA 1 January 2011 / Vol. 2, No. 1 / BIOMEDICAL OPTICS EXPRESS 2515
4. Conclusion
We have shown that a multimodal CARS and TPF microscope system allows the observa-tion and measurement of changes in live fibroblast cells that occur during infection by cy-tomegalovirus. Imaging with TPF allowed us to identify three distinct stages of the infectionprocess; early, intermediate and late infection stage, whilst simultaneous CARS imaging wasused to observe the changes in cell morphology, and to quantify the perturbations to cellu-lar lipid droplets, enabling us to correlate these findings against the defined infection stages.This enabled us to identify several persistent features of cytomegalovirus infection including achange in cell morphology, a decrease in the number of cellular lipid droplets and an overallincrease in the size of the remaining droplets, thus suggesting a clustering of lipid droplets.The increase in the size was significant, with some lipid droplets of area greater than 6 µm2
emerging in the later stages of infection. The biological significance of these observed processesrequires further investigation.
Acknowledgments
We appreciate the provision of C3X-GFP virus from Mathieu Blanc of the Division of PathwayMedicine, University of Edinburgh.
#147177 - $15.00 USD Received 9 May 2011; revised 5 Jun 2011; accepted 8 Jul 2011; published 2 Aug 2011(C) 2011 OSA 1 January 2011 / Vol. 2, No. 1 / BIOMEDICAL OPTICS EXPRESS 2516