45
CBO PAPERS CHANGING THE CLASSIFICATION OF FEDERAL WHITE-COLLAR JOBS: POTENTIAL MANAGEMENT AND BUDGETARY IMPACTS July 1991 CONGRESSIONAL BUDGET OFFICE
CBOPAPERS
CHANGING THE CLASSIFICATION OFFEDERAL WHITE-COLLAR JOBS:POTENTIAL MANAGEMENT AND
BUDGETARY IMPACTS
July 1991
CONGRESSIONAL BUDGET OFFICE


PREFACE
This Congressional Budget Office paper examines the potential management andbudgetary impacts of correcting the misgrading of federal white-collar positions andof adopting a frequently discussed alternative to the current classification system-pay banding. The paper updates some analyses from an earlier CBO reportReducing Grades of the General Schedule Work Force (September 1984).
The study was prepared at the request of Congressman Steny H. Hoyer,Chairman of the Federal Government Service Task Force. R. Mark Musell ofCBO's Office of Intergovernmental Relations prepared the report under thesupervision of Stanley L. Greigg and Earl A. Armbrust. Mary V. Braxton typed thedraft and prepared the report for publication. The author gratefully acknowledgesthe cooperation of staff in the Office of Personnel Management's Office ofClassification and Office of Systems Innovation and Simplification. Special thanksalso to CBO's Bruce Vavrichek, Susan Borghard, and Richard Krop and to the MeritSystems Protection Board's Charles E. Friedman for thoughtful comments.
Robert D. ReischauerDirector
July 1991
ui


CONTENTS
SUMMARY vii
I INTRODUCTION 1
The General Schedule Classification System 2
H THE GRADE STRUCTURE OF THE GS WORKFORCE AND OVERGRADING
Increases in Average Grade 7Factors Contributing to Rising Grades 7The Overgrading of Federal Jobs and its Costs 9
HI PAY BANDING AS AN ALTERNATIVE TOCURRENT PRACTICE 15
The Navy Demonstration Project 17Some Results from the Navy Project 21
APPENDIX 27

TABLES AND FIGURES
TABLES
1. Occupations and Employees Covered byOPM Position-Classification Standards 5
2. The Age of Federal Position-ClassificationStandards 6
3. Increase in Average GS Grade in Defenseand Nondefense Agencies 8
4. Increases in Average Grade by Agencyand Change Factor 8
5. The Percent of the Department of Defense WorkForce in Over- and Undergraded Positions 12
6. Employee Turnover at the Demonstration andControl Laboratories Involved in the NavyDemonstration Project 24
A-l. Number of Full-Time White-Collar FederalWorkers by Grade and Occupational Group 28
A-2. Increases in Average GS Grade ByType of Agency and Occupation 34
A-3. Percent Distribution of the Federal WorkForce by Occupational Category 35
FIGURES
1. Career Paths and Pay Bands at theNaval Ocean Systems Center 19
F-l. Reprint of a Position-ClassificationStandard for Correspondence Clerk, GS-4 29
BOXES
1. OPM Personnel Management DemonstrationProjects 16
2. Laboratories Involved in the NavyDemonstration Project 18
vi
SUMMARY
The government determines how much to pay its employees with the aid of adecentralized classification system that takes into account, among other things, theduties and responsibilities of each position. Classification is intended to ensure thatsimilar jobs are assigned equal pay and that different jobs reflect fair differences incompensation. It also aids in the evaluation of pay comparability with the privatesector.
A forthcoming major study of federal practices by the National Academy ofPublic Administration (NAPA) is likely to increase interest in the classification offederal jobs. In addition, the Office of Personnel Management (OPM) has calledfor an exploration of alternatives to the current system. In light of thesedevelopments, this analysis addresses two subjects that are likely to figureprominently in discussions about classification and about which budgetary concernsoften arise: (1) pay banding, an often-discussed alternative to current practice, and(2) incorrect grading of federal jobs.
THE GENERAL SCHEDULE CLASSIFICATION SYSTEM
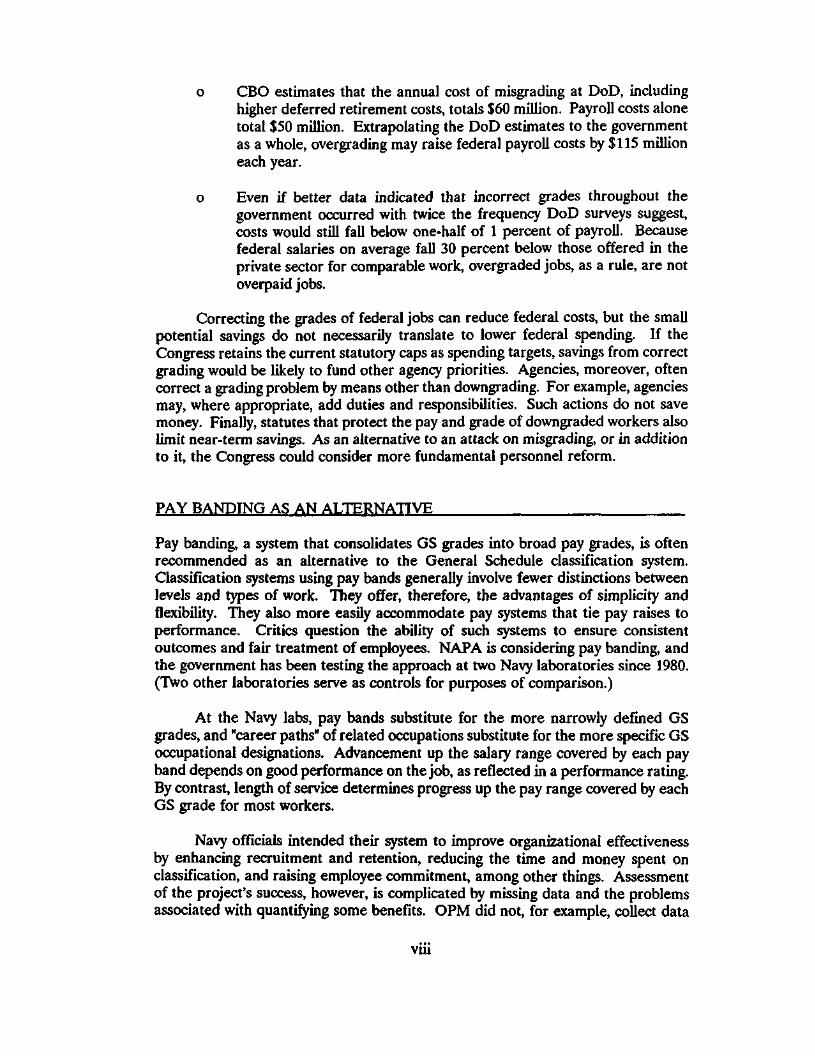
The General Schedule (GS) is the basic pay schedule for the government's white-collar work force. It currently covers about 1.5 million workers. The ClassificationAct of 1949 established the schedule with 18 pay grades, each representing adifferent degree of difficulty and level of responsibility. The government placesfederal positions in pay grades by means of a classification system that involvescomparing a description of a job's duties and responsibilities to official classificationstandards for positions. These standards, prepared by OPM, set out criteria for aposition's grade and title, among other things. Unfortunately, OPM has allowed itsstandards to become outdated. Currently, three-quarters of all standards, coveringsome 760,000 workers, are 10 or more years old.
In a 1983 analysis, OPM estimated that 14.3 percent of the GS work forcewere classified too high. All else being equal, the government fails to get fair valuefor its payroll dollar from an overgraded job. CBO estimated the 1983 cost ofmisgrading (overgrading less undergrading) at $660 million, including the cost ofretirement. What does overgrading cost the government now?
o The only current data on misgrading comes from the Department ofDefense (DoD). Data from more than 2,500 random audits conductedin 1989 and 1990 show overgrading averages about 4.9 percent; almosta 50 percent reduction from the 8.7 percent reported for DoD in 1983.
vu
o CBO estimates that the annual cost of misgrading at DoD, includinghigher deferred retirement costs, totals $60 million. Payroll costs alonetotal $50 million. Extrapolating the DoD estimates to the governmentas a whole, overgrading may raise federal payroll costs by $115 millioneach year.
o Even if better data indicated that incorrect grades throughout thegovernment occurred with twice the frequency DoD surveys suggest,costs would still fall below one-half of 1 percent of payroll. Becausefederal salaries on average fall 30 percent below those offered in theprivate sector for comparable work, overgraded jobs, as a rule, are notoverpaid jobs.
Correcting the grades of federal jobs can reduce federal costs, but the smallpotential savings do not necessarily translate to lower federal spending. If theCongress retains the current statutory caps as spending targets, savings from correctgrading would be likely to fund other agency priorities. Agencies, moreover, oftencorrect a grading problem by means other than downgrading. For example, agenciesmay, where appropriate, add duties and responsibilities. Such actions do not savemoney. Finally, statutes that protect the pay and grade of downgraded workers alsolimit near-term savings. As an alternative to an attack on misgrading, or in additionto it, the Congress could consider more fundamental personnel reform.
PAY BANDING AS AN ALTERNATIVE
Pay banding, a system that consolidates GS grades into broad pay grades, is oftenrecommended as an alternative to the General Schedule classification system.Classification systems using pay bands generally involve fewer distinctions betweenlevels and types of work. They offer, therefore, the advantages of simplicity andflexibility. They also more easily accommodate pay systems that tie pay raises toperformance. Critics question the ability of such systems to ensure consistentoutcomes and fair treatment of employees. NAPA is considering pay banding, andthe government has been testing the approach at two Navy laboratories since 1980.(Two other laboratories serve as controls for purposes of comparison.)
At the Navy labs, pay bands substitute for the more narrowly defined GSgrades, and "career paths" of related occupations substitute for the more specific GSoccupational designations. Advancement up the salary range covered by each payband depends on good performance on the job, as reflected in a performance rating.By contrast, length of service determines progress up the pay range covered by eachGS grade for most workers.
Navy officials intended their system to improve organizational effectivenessby enhancing recruitment and retention, reducing the time and money spent onclassification, and raising employee commitment, among other things. Assessmentof the project's success, however, is complicated by missing data and the problemsassociated with quantifying some benefits. OPM did not, for example, collect data
viii

on productivity or on other indicators of organizational effectiveness. Problems withsome of the data that were collected, moreover, make it difficult to attributeobserved changes to the experimental personnel system or to other factors. Forexample, data on turnover that OPM collected to assess the project's impact onrecruitment does not include base year data. The Navy has had its successes,however, and preliminary analysis indicates that costs are small. Moreover, studieshave not identified serious problems with the experiment. In fact:
o The hours that both supervisors and personnel staff spend onclassification have decreased. In a 1986 report, OPM estimated thatthe overall savings associated with simplified classification total about0.8 percent of payroll.
o Seven attitude surveys OPM administered during the 1979-1989 periodindicate that employees' attitudes about their work and about thedemonstration project have improved, offering a potential boost toperformance and retention. For example, in 1979 the proportion ofscientists and engineers who were satisfied with their jobs was threepercentage points higher at the demonstration labs than at the controllabs. By 1989, the job-satisfaction premium had grown to eightpercentage points.
o Although a shortage of data makes a meaningful comparison of thecosts and benefits of the demonstration project impossible, the Navy'sproject has not dramatically increased federal costs. According topreliminary estimates prepared by OPM, the project has, after 11 yearsof putting in place and developing, increased salary costs over whatwould have occurred otherwise by only about 6 percent; an averageannual increase of about 0.5 percent.
Results at the Navy project may not apply elsewhere. The Navy designed itsexperimental system to meet the recruitment and retention needs of two specializedfacilities; laboratories employing a large number of scientists and engineers. Costimpacts of a governmentwide system would reflect the nature of the system involved.Design can incorporate features intended to keep costs down; for example, limits onraises for employees at the top end of a pay range. An increase in governmentwidepayroll costs equivalent to that the Navy experiences would raise outlays by $250million per year. If one factors in the costs of retirement, the estimate rises to $280million. Such costs are insignificant compared with the estimated 6 percent increaseprojected to occur each year through the end of this century under recently enactedpay reform. Some of the costs and benefits of any pay-banding system thegovernment might consider adopting, moreover, are already anticipated by payreform, which allows for pay-for-performance and other features that oftencharacterize pay-banding systems.
IX


CHAPTER!. INTRODUCTION
The federal government assigns most of its white-collar jobs to the pay grades of theGeneral Schedule (GS)-currently covering 1.5 million workers~by means of adecentralized classification system that takes into account the duties and responsibili-ties assigned to a position, along with the qualifications it requires.1 Classificationof positions affords the government a means of rationally organizing its diversecollection of jobs, which cover more than 450 professional, administrative, technical,and clerical occupations. (Appendix Table A-l shows a distribution of the GS workforce by grade and occupational category.)
Critics of the federal system for classifying positions have found it contentious,costly, rigid, and poorly administered.2 In 1983, two reports, one by the Office ofPersonnel Management (OPM) and the other by the President's Private SectorSurvey on Cost Control (also referred to as the Grace Commission), focusedattention on two phenomena associated with the federal classification system: thelarge number of misclassified positions and the disproportionate number of federaljobs with high GS grades.3 Subsequent initiatives for improved position manage-ment from both the OPM and the Office of Management and Budget (OMB) metwith a mixed response from federal agencies, and interest in improving federalclassification diminished considerably.4
Several recent developments have revived interest in the subject of classifica-tion. For more than a year, the National Academy of Public Administration(NAPA) has conducted interviews, research, and analysis as part of a major studyof the federal classification system. NAPA's final report, expected shortly, willexamine the current classification system and suggest a variety of reforms. Inaddition, OPM's strategic plan for the federal work force, released in November of1990, calls for exploring alternatives to current practice concerning the classification
1. The Office of Personnel Management figure of 1.5 million covers full-time workers as of March1990. Most white-collar positions in the Executive Branch are paid according to rates set out inthe General Schedule.
2. For a review of the literature, see National Academy of Public Administration, FederalClassification Study, Interim Research Results (August 1990).
3. Office of Personnel Management, Federal White-Collar Position Classification Accuracy (March1983) and President's Private Sector Survey on Cost Control, Report on Personnel Management(1983), pp. 82-100. For an analysis of the budgetary impacts of various proposals for improvingclassification, see Congressional Budget Office, Reducing Grades of the General Schedule WorkForce (September 1984).
4. General Accounting Office, How Certain Agencies Are Implementing the Grade Reduction Program(January 1986).

of positions and the structuring of pay systems.5 This approach could affect all orpart of the work force the government's General Schedule now covers.
Two other developments in federal personnel operations may increase concernsabout effective position classification. Last year the government enacted sweepingreforms in its pay-setting practices under the Federal Employees Pay ComparabilityAct of 1990 (Public Law 101-509). Pay reform did not provide for higher agencybudgets. Accordingly, it could increase the attention that agencies devote toclassifying positions and other management practices that help to ensure cost-effective operations. At the same time, the Department of Defense (DoD) isplanning a major restructuring of and reduction in military personnel and the civilianwork force that supports them. Effective classification can play a useful part in theDoD effort.
Two issues are likely to raise budgetary concerns and figure prominently in thegrowing debate about position classification: incorrect grading of jobs and paybanding-an often discussed alternative to current practice. Systems incorporatingpay bands generally include fewer distinctions between types and levels of work thanthe GS system.
THE GENERAL SCHEDULE CLASSIFICATION SYSTEM
The current federal GS classification system derives its principal authority from theClassification Act of 1949, as amended.6 The act established the General Schedulewith 18 pay grades into which most white-collar positions were then slotted.7 Eachgrade represents a different level of difficulty and responsibility and has a series ofsalary rates, or steps, associated with it. (At present, most workers advance up thesesteps on the basis of length of service. The majority of the nearly 250,000 workersin grades 13 through 15, however, advance according to performance under thegovernment's Performance Management and Recognition System, referred to hereand throughout as the merit pay system.) In addition to pay grade, classificationdetermines pay plan, occupational series, and classification title.
As specified by law, the basic objectives of the federal classification system areto provide equal pay for equal work, ensure fair differences in pay for unequal work,and offer a broad, systematic approach to organizing jobs. An effective classification
5. Office of Personnel Management, Strategic Plan for Federal Human Resources Management(November 1990).
6. Public Law 81-429.
7. Since enactment of the Civil Service Reform Act of 1978 (Public Law 95-454), most positions inGS grades 16 through 18 have been converted to a separate Senior Executive Service (SES). Asof March 1991, SES employment totaled nearly 8,000. The Federal Employees Pay ComparabilityAct of 1990 created a separate senior-level service for workers remaining in pay grades 16,17, and18. As of March 1990, they numbered only about 700.

system makes an important contribution to agency management. Among otherthings, it can aid in planning and budgeting, selecting employees, organizing work,promoting the sense of fairness that contributes to employee morale, and keepingsalaries competitive. The federal classification system assigns grades, titles, andother defining elements based on the characteristics of the position being graded,rather than on the characteristics of the employee holding the position.8 Undersuch an approach, an accountant sorting mail at an agency is a mail clerk forpurposes of pay and personnel management, not an accountant. Agency classifiersand managers have primary responsibility for classifying positions. The OPMprovides general oversight and direction.
The Role of Federal Agencies
Classification begins with the preparation of a written description, specifying theduties and responsibilities associated with a position. Depending on the agency, thistask may fall to supervisors, personnel specialists, or sometimes to employeesthemselves. Agency classifiers use these descriptions to determine correct title,series, and grade. (Some agencies have assigned this task to managers.) Theprocess involves comparing key elements of a position, as outlined in its description,to classification standards prepared by OPM (referred to as position-classificationstandards). A position standard contains a variety of information about the jobs thatit covers. When a classifier makes a match between a position and its standard, thatstandard sets out the criteria that help determine the correct classification.
Position-classification standards represent an approach to achieving someconsistency in classification decisions. As such, complete, accurate, and up-to-datestandards remain a key element of an effective classification system. Even withstandards, however, the current classification process leaves considerable room forthe exercise of professional judgment.
The Role of OPM
Current law charges OPM with a variety of tasks under the GS classification system.Among other things, the agency makes regulations, monitors agency compliance, andrenders decisions on appeals of classification actions. OPM is also responsible forpreparing, publishing, and keeping position-classification standards up-to-date . Atpresent, published standards cover almost 80 percent of the 458 federal occupationalseries (361 out of 458).9 These standards cover virtually the entire full-time GS
8. Other approaches to classification that emphasize an individual's ability, qualifications, and othercharacteristics are found in the Armed Services, the U.S. Foreign Service, and the Senior ExecutiveService.
9. Many occupations not covered by standards have so few employees as to make developing standardsan inefficient use of resources. Classifiers generally evaluate positions in these occupations usingstandards for related occupations.

work force (see Table 1). In 1975, OPM began issuing its standards, most of whichformerly used simple narrative descriptions of work, in a factor evaluation formatthat employs a numerical rating system. Under the Factor Evaluation System (FES),classifiers rank positions according to nine factors, such as knowledge required,amount of supervision received, and complexity of work. The other factors used torank positions are the nature of guidelines used, the scope and effect of work, theextent of personal contacts, the purpose of contacts, the physical demands associatedwith assignments, and the risks and discomforts associated with the workplace.
Each factor is assigned a range of points. (An example of a position standardin FES format is included as Figure F-l in the Appendix.) A position's gradereflects the total of the points it merits for each factor. By using standard factorsand point values, the FES system offers a more consistent approach to ranking andevaluating positions. Currently, FES standards cover almost half of the GeneralSchedule work force.
Over the last five years, OPM has also moved to simplify standards. The effortinvolves using standards written in simpler language and covering multipleoccupations. Wherever possible, OPM writes these generic standards in FES format.(Standards covering multiple occupations are not new. Several, such as thosecovering various types of engineering work, have been in use for years.) Thesimplification of standards was part of a broader effort to simplify the entireclassification process. In simplifying the system, OPM hoped to improve efficiencyand introduce an added measure of flexibility that would tailor classification to meetindividual agency needs. Ironically, responses from many agencies to severalprototypes suggested that the new standards were too general, and OPM has decidedthat future standards of this type will cover fewer, more closely related occupations.Currently, eight of these broader, more simplified standards are in use. These coverfewer than 150,000 employees. Several more simplified standards are in variousstages of development.
OPM appears to have fallen behind in its obligation to keep standards up-to-date. Currently, more than half the work force is covered by standards that are 10or more years old (see Table 2). The portion of the work force covered by olderstandards is up by seven percentage points since CBO's last report in 1984. Amoratorium on producing standards, imposed by OPM in the mid-1980s, explains asignificant portion of the lost ground. OPM intended to conserve resources whilereexamining the classification and pay systems. In recent years, there has been arenewed effort to update standards, and OPM currently has 44 new and revised GSstandards in various stages of development. Nevertheless, many observers areconcerned about the age of the current inventory of standards.10
10. See, for example, National Academy of Public Administration, Interim Results (August 1990), andU.S. Merit Systems Protection Board, OPM's Classification and Qualification Systems: A RenewedEmphasis, A Changing Perspective (November 1989).

TABLE 1. OCCUPATIONS AND EMPLOYEES COVERED BY OPMPOSITION-CLASSIFICATION STANDARDS
Number of Number of Percent ofOccupations Employees Employees
Coverage By OPM Standards
With StandardsWithout Standards
Total
36197
458
1,410,00027.000
1,437,000
982
100
Coverage By Type of Standard
FES StandardsOther Standards
Total
77284361
670,000740.000
1,410,000
47
~98
SOURCE: Office of Personnel Management.
NOTE: Employment figures cover full-time permanent workers as of September 1990. Positionstandards are those in effect in March 1991 The eight recently developed generic standardsare included in the total of 361 standards. Seven are FES, and one is narrative.

TABLE 2. THE AGE OF FEDERAL POSITION-CLASSIFICATIONSTANDARDS (Numbers of occupations and employees covered)
Age of Standard
Less than 10 years old
10 to 20 years old
More than 20 years old
Total
Occupations
86
106
169
361
Employees
650,000
555,000
205.000
1,410,000
Percent ofEmployees
45
39
14
98
SOURCE: Office of Personnel Management.
NOTE: Employment figures cover full-time permanent workers as of September 1990. Standardsare those in effect in March 1991.

CHAPTER II. THE GRADE STRUCTURE OF THE GS WORK FORCEAND OVERGRADING
Increases in the average grade of the GS work force since 1983 are part of a long-term trend. A variety of factors, including the growing complexity of federal work,helped push grades up. Overgrading--the placing of a position at a grade and payhigher than correct classification-may also have contributed to rising GS grades, butprobably not by much. The Grace Commission addressed overgrading and its costsin its 1983 report. The forthcoming release of NAPA's study will no doubt raise thesubject again. Estimating the extent of the phenomenon, however, is difficult,although there is some evidence that overgrading is not nearly as widespread assome suspect.
INCREASES IN AVERAGE GRADE
From March 1983 through March 1990, average grade for full-time permanentemployees under the General Schedule and those covered by similar pay schedulesincreased by one-half grade, from 8.5 to 9.O.11 While both defense and nondefenseagencies show upward trends in average grade, increases for defense agencies as agroup were double those for nondefense agencies (see Table 3). Despite the largerincrease, however, the average grade at DoD remains below that for nondefenseagencies; that is, 8.8 compared with 9.1. The pattern of rising average gradecontinues a long-term trend. In 1974, the average GS grade stood at 8.0, a gradebelow the current level. (Appendix Table A-2 shows changes in average grade byagency and occupational category.)
FACTORS CONTRIBUTING TO RISING GRADES
Many factors have contributed to the increase in the average grade of the GS workforce. Although it is difficult to isolate the size of each factor's contributionprecisely, it appears that a leading factor, accounting for around two-thirds of theincrease since 1983, is the changing nature of governmental work (see Table 4).12
Federal agencies have come to rely increasingly on professional and administrativeworkers, who generally have higher grades than workers in other occupations. The
11. About 8,000 full-time employees with permanent appointments are paid under systems tied tothe General Schedule though not officially covered by it. These systems are referred to here as"similar schedules."
12. The two-thirds estimate comes from OPM data that compares the average grade of GS workersin 1990 to the average grade that would occur if each occupation in government had the sameaverage grade as it had in 1983.

TABLE 3. INCREASE IN AVERAGE GS GRADE IN DEFENSEAND NONDEFENSE AGENCIES, 1983-1990
Agency
All Agencies
Defense
Nondefense
March
8.5
8.2
8.8
Average Grade1983 March 1990
9.0
8.8
9.1
GradePoint
Increase
0.5
0.6
0.3
SOURCE: Congressional Budget Office from data provided by Office of Personnel Management.
NOTE: Data cover grades of full-time workers who have permanent appointments to the GeneralSchedule and to similar schedules.
TABLE 4. INCREASES IN AVERAGE GRADE BY AGENCYAND CHANGE FACTOR, 1983-1990(Average grade points rounded to the nearest tenth)
Increases AttributableTotal Change to Shift to Higher Increases Attributable
Agency 1983-1990 Grade Occupations to Other Factors
All agencies
Defense
NonDefense
0.5
0.6
0.3
0.3
0.4
0.2
0.2
0.2
0.1
SOURCE: Congressional Budget Office from Office of Personnel Management data.
NOTE: Data cover grades of full-time workers who have permanent appointments to the GeneralSchedule and similar schedules.

proportion of the federal white-collar work force in such occupations has increasedfrom 49 percent to 54 percent since 1983. (Appendix Table A-3 provides moredetails on changes in the occupational distribution of the white-collar work force.)In 1978, only 46 percent of the white-collar work force held jobs designated asprofessional and administrative. Jobs in the fields of computer science, medicine,criminal investigation, engineering, and contracting and procurement, led the recentgrowth among professional and administrative occupations.
Fundamentally, the shift in the occupational mix of the work force reflects anincrease in both the size and complexity of the demands placed on government.Demands such as those associated with drug related and other crime, AIDS andother life-threatening diseases, protection of the environment, regulation of banksand other financial institutions, and the highly complex weapons and control systemsneeded to preserve national security, often require the skills of highly trainedprofessionals and administrators.
Among other significant factors contributing to the increases in average gradewere three major reclassification actions by G'PM. The three occupations involved--medical technologist, air traffic controller, and financial administrator-togetheraccount for about 13 percent of the increase in average grade since 1983. Also, thegovernment's increasing reliance on contracting with the private sector for goods andservices has raised the need for well-trained professionals to prepare and monitorcontracts. Overgrading of particular jobs, too, may have contributed to the overallrise in average grade; some of it reflecting efforts by managers to compensate forbelow-market federal salaries.
THE OVERGRADING OF FEDERAL JOBS AND ITS COSTS
All else being equal, when an agency places a job in a pay grade higher than thatwarranted by the duties and responsibilities of the job, the government fails to getfair value for its payroll dollars. Some argue that because current federal salariesare below market rates, overgraded jobs are not necessarily overpaid jobs.(Although, to the extent that lower-than-market salaries force an agency to hireworkers with less human capital-such as education and experience—overgrading canstill lead to overpaying job holders.) But with the pay raises provided for under theFederal Employees Pay Comparability Act of 1990, federal pay should graduallymove toward comparability with nonfederal markets.13 And overgrading has othercosts, because it undermines a system designed to organize federal work in a fairand efficient manner. Estimating the costs of overgrading is difficult, however,because there is little current data on the extent of the problem. Moreover, current
13. Under the act, employees may receive annual pay raises linked to increases in the nonfederal sectoras measured by the Employment Cost Index. Beginning in 1994, workers may also receive raisesdesigned to shrink the gap between federal and nonfederal salaries in local areas to 5 percent orless over nine years.

laws that protect the grade and pay of downgraded workers limit the near-termsavings available from correcting overgrading.
The Difficulties of Grading and Estimatingthe Number of Misgraded Jobs
How are positions assigned to the wrong grade? Some misgrading may result fromerror or poor judgment. Even when done by highly-trained classifiers using well-prepared, up-to-date position-classification standards, assigning grades involves agreat deal of judgment. Jobs may also be misgraded during the normal course ofreorganizations or because missions change. Managers who feel that the low federalsalaries of recent years have made it difficult to recruit and retain workers may alsooverstate positions to obtain higher grades and higher pay.
In a 1983 analysis, OPM estimated that 14.3 percent of the GS work force wasovergraded and 1.5 percent was undergraded. For nondefense agencies, OPM found16.7 percent of all positions overgraded, and 8.7 percent of all Department ofDefense positions overgraded. Most striking, however, overgrading occurred almostfour times as often in Washington, D.C. as in all other areas combined. Althoughonly about 20 percent of all full-time GS employees work in the Washingtonmetropolitan area, it accounted for 40 percent of all overgraded jobs.14 UsingOPM's findings, CBO estimated that the 1983 net payroll cost of incorrect grading(overgrading less undergrading), including the costs of future retirement benefits,totaled some $660 million.15
No one knows how much overgrading takes place. Many people feel that thenumber of overgraded jobs has increased in recent years. Those who support thisview point out that once positions are overgraded, they tend to remain so. Evenwhen incumbents leave an overgraded job, an agency is likely to rehire at the highergrade. They argue, moreover, that recent developments may have caused the rateof job overgrading to rise. The temptation to compensate for below-market salariesby overgrading, for example, has probably grown. At the time of OPM's 1983report, which estimated overgrading at 14.3 percent, the President's Pay Agentestimated the gap between federal and private-sector salaries at about 20 percent.Current estimates put the gap at about 30 percent. Moreover, in 1988 OPM relaxedcertain requirements that may have helped ensure accurate job grading. In a lettertransmitting guidance to agencies, OPM canceled requirements for periodic reviewsof position classification designed to ensure the accuracy of classification. Also,OPM delegated authority to agencies to review classification decisions changing
14. Office of Personnel Management, Federal White-Collar Position Classification Accuracy (March1983). The OPM analysis involved audits conducted in 1980 and 1981 of over 700 GS full-timepermanent positions.
15. Congressional Budget Office, Reducing Grades (September 1984), pp. 21-23.
10

large blocks of positions.16 (Formerly, agencies had to consult with OPM onclassification and job grading actions affecting 20 or more positions.) The OPMintended its action to simplify position classification, but it may have done so at theexpense of accuracy.
At the same time, other developments may have helped reduce or keep theovergrading problem in check. The budgetary restraint that has characterized recentyears may have, in some cases, made it harder for agencies to bear the cost ofinaccurate grading. Special rates may have reduced some of the temptation to usethe classification system to get higher pay for workers. For agencies that can affordthem, special rates provide for higher salaries designed to help agencies addressstaffing problems caused by uncompetitive federal pay and other factors. Theserates have been authorized since 1955, but their use has expanded greatly only inrecent years. Currently, special rates cover more than 185,000 employees, a numberthat is up five-fold over the 1983 level.17 Of course, the classification system itself,with its 2,200 classifiers, requirements for documentation, and provisions grantingemployees legal recourse against unfair actions, serves to limit abuse and to providefair treatment of employees.
Given the conflicting trends and the limited data available, it is difficult toestimate precisely how much incorrect grading has changed since the 1983 OPMstudy. Selected data available from DoD indicates that things are no worse than in1983, or perhaps even somewhat improved.
Incorrect Grading at DoD and Its Costs
The only current data available on misgrading comes from the DoD. As part of itsannual personnel management evaluation, DoD performs random audits to test theaccuracy of position classification. For the years 1989 and 1990, data from morethan 2,500 audits show overgrading averaging 4.9 percent of all positions andundergrading averaging 2.1 percent (see Table 5). The overgrading rate is wellunder the 8.7 percent that OPM reported for DoD in 1983. But rates variedconsiderably by service, from a low of 1.1 percent for the Air Force to a high of 8.9percent for the Army, just over the overall DoD rate OPM reported for 1983.
Although DoD selects positions for audit at random, it audits only selectedinstallations each year. DoD schedules audits so that each year's selectedinstallations cover about the same portion of the civilian work force and so that allinstallations are audited at least once every five to seven years. Even so, DoD
16. Office of Personnel Management, Federal Personnel Manual Letter 511-10 (March 1988).
17. The Federal Employees Pay Comparability Act of 1990 authorizes the use of a variety of othersupplements to pay that could assist agencies to recruit and retain workers. These include authorityto hire above the minimum salary of a pay grade, geographic pay differentials, and recruitment andretention bonuses.
11

officials claim that data show fairly consistent results in recent years, and believethat each year's results fairly represent their entire agency.
Accordingly, CBO estimated the approximate cost of misgrading at DoD, basedon audits for 1989 and 1990. More precise estimates would require detailedinformation on the grade distribution of misgraded jobs and the level of over- andundergrading; information not readily available from the DoD. Better estimatesmay be possible after the Army releases the results of a comprehensive audit. Theresults, expected later this summer, will reflect audits of more than 900 positions.
Assuming that misgraded jobs at DoD have the same average grade and stepas the work force as a whole, and that, on average, the positions are misgraded byone grade, then the estimated 1991 net cost of incorrect grading for GS workers atthe DoD totals $60 million, including deferred retirement costs. Payroll costs alonetotal $50 million; $90 million for overgrading, less $40 million for undergrading.Extrapolating the DoD experience to the government as a whole, overgrading wouldraise federal payrolls by $115 million--$200 million for overgrading, less $85 millionfor undergrading. The net costs would amount to about 0.2 percent of the federalwhite-collar payroll.
TABLE 5. THE PERCENT OF THE DEPARTMENT OF DEFENSE WORKFORCE IN OVER- AND UNDERGRADED POSITIONS
Averaee for 1989 and 1990
Army
Navy
Air Force
Total
Over-Graded
8.9
2.7
1.1
4.9
Under-Graded
3.3
1.5
0.7
2.1
TotalMisgraded
12.2
4.2
1.9
7.0
SOURCE: U.S. Army Civilian Personnel Evaluation Agency, U.S. Navy Office of Civilian PersonnelManagement, and U.S. Air Force; Civilian Personnel Plans and Evaluation Division.
NOTE: Details are rounded independently. The two-year average for the Air Force masks asignificant increase in overgrading; between 1989 and 1990, from 0.5 percent to 1.7 percent.Air Force officials believe the increase reflects survey coverage and does not representlong-term trends in overgrading at the agency.
12

Federal Budget Deficits and the Costs of Incorrect Grading
While not insignificant, especially in light of the many interests and problemscompeting for limited federal funds, incorrect grading does not seem to representa major drain on federal resources. Even if misgrading throughout the governmentoccurred twice as often as DoD data suggest, its cost would still represent less thanone-half of 1 percent of payroll. (Of course, it may represent a far greater gain orloss to the employee in a misgraded position.) The cost of misgrading, moreover,appears insignificant when compared with the savings that the government achieves,estimated at about 30 percent of payroll, by continuing to pay salaries below thoseoffered in the private sector. Compared with the private sector, in fact, overgradedjobs may not be overpaid jobs. This will change, however, as the governmentgradually moves toward comparability under recently enacted pay reform.
Regardless of the potential savings involved, translating correct grading intonear-term budgetary reductions presents certain problems. If the Congress retainscurrent statutory caps as targets for spending, the savings from correct grading wouldbe applied to other agency priorities. Even to obtain savings, the Congress wouldhave to require that agencies correct overgrading by downgrading. They have otheralternatives-for example, adding duties and responsibilities-thai do not necessarilyfree up resources for other priorities. Such alternatives may often make more sensethan downgrading for getting work done in an organization. Downgrading,moreover, has costs of its own, including damage to employee morale. Even withdowngrading, current statutes that protect the pay and grade of regraded workersdelay savings to the government.18 Under these statutes, downgraded workerskeep their same grade and pay for two years. Thereafter, workers whose salariesexceed the top step of their correct grade receive half the annual governmentwidepay adjustments granted at that step until the top salary at the new grade catchesup.19 Eliminating or curtailing grade and pay protection, however, would also loweremployee morale. Moreover, the prospect of a disrupted workplace, might makefederal managers more reluctant to downgrade jobs in the first place. As analternative to attacking misgrading directly, or in addition to it, the Congress couldchoose to focus on basic changes to the GS classification system.
18. 5 U.S.C. 5361 et seq.
19. Assuming a governmentwide pay adjustment of 4 percent, for example, a worker earning $25,000,whose correct grade is GS-6, would receive a pay increase equal to 2 percent of the salary at Step10 of that grade ($24,598), or about $492. Full pay increases would commence only when the salaryfor GS-6, Step 10, catches up to what the employee is then earning.
13


CHAPTER III. PAY BANDING AS AN ALTERNATIVETO CURRENT PRACTICE
Analysts have offered a variety of recommendations for improving federalclassification. Over the years, they have called for more relevant, up-to-dateposition-classification standards, more oversight and direction from OPM, bettercommunication between OPM and agencies, and simplification of the classificationprocess. As part of its improvement efforts, the OPM has sought to improve thetraining of classifiers, update position-classification standards, and explore possibleapplications of computer technology to the classification process. Substituting asystem that consolidates the grades of the GS schedule into broad pay ranges, or paybands, would represent more fundamental reform.
Some have questioned whether the current system's problems warrant suchdramatic action. Nevertheless, pay banding remains the most discussed reformproposal. The forthcoming NAP A report will include a design for a banding systemthat could serve as a model for the government. In addition, the government istesting pay banding at several agencies (see Box 1). The Navy boasts the longestrunning and best documented of these test projects. (Alternate personnel systemsand practices are also in place at agencies that are not required to participate in theGeneral Schedule system. These organizations include the General AccountingOffice, the Postal Service, and the Tennessee Valley Authority. Together, exemptagencies have over 1 million employees. The system in place at GAO incorporatespay for performance and broad pay bands.)
Systems employing pay bands generally involve fewer distinctions between bothtypes and levels of work. They offer, therefore, the advantages of simplicity andflexibility. Also, they more easily accommodate pay plans that tie raises toperformance, the typical practice in the private sector.20 The simplicity andflexibility of pay banding, of course, is gained at the expense of the precision broughtto decisions about classification. Accordingly, some question the ability of paybanding systems to ensure consistent outcomes and fair treatment of employees.Some also question the emphasis banding systems often give to performance, arguingthat experience and adaptability are also important. Results from the Navydemonstration project suggest that pay banding can, with only modest increases incost, lead to improvements in personnel management.
20. Section 111 of the Federal Employees Pay Comparability Act of 1990 requires the Office ofPersonnel Management to establish a labor-management committee to advise it on the design andestablishment of systems that will strengthen the link between the pay of federal General Scheduleworkers and their performance. The legislation requires the committee to report by November of1991 to the Director of OPM.
15

Box!OPM PERSONNEL MANAGEMENT
DEMONSTRATION PROJECTS
The Civil Service Reform Act of 1978 (Public Law 95-454) authorized establishment ofup to 10 demonstration projects to explore new concepts and approaches to personnelmanagement. The government now has six major projects under way. These projectscurrently involve about 23,000 white- and blue-collar workers. The five projects outsidethe Navy's are described below. Like the Navy, two of the five projects-one at theNational Institute of Standards and Technology and one at the Air Force's McClellanAir Base—test new approaches to job classification.
National Institute of Standards and Technology (NIST). This project, mandated byCongress in the National Bureau of Standards Authorization Act for Fiscal Year 1987(Public Law 99-574), commenced in January 1988 and covers 3,000 white-collaremployees at research sites in Maryland and Colorado. These labs undertake researchand development in physical measurement. The project addresses difficulties NISTexperienced in attracting quality researchers. Like the Navy Demonstration Project, theNIST experiment features simplified classification with broad pay bands and pay raisesbased on performance. The project also provides for pay and benefit comparability withthe private sector.
Air Force/Defense Logistics Agency (DLA) Pacer Share. This project was carried outin February 1988 in the Directorate of Distribution of the Sacramento Air LogisticsCenter, McClellan Air Force Base, and covered 1,800 blue- and white-collar employees.The Directorate provides parts and equipment to customers on base and throughout theworld. As a result of DoD depot consolidations, more than half of the employeescovered by Pacer Share were transferred to DLA in April 1991. The project nowcontinues as an interagency demonstration. Pacer Share was designed to demonstratethat the productivity and quality of work of an organization can be improved byestablishing a more flexible personnel system and a productivity gainsharing system basedon organizational performance. Under the gainsharing program, the Air Force returnsto employees half of any savings from improved organizational performance.
Department of Transportation/Federal Aviation Administration (FAA). In 1989, FAAstarted testing retention allowances designed to attract and retain well-qualifiedemployees for hard to fill facilities in Chicago, Los Angeles, New York, and other areas.The project, involves 2,100 white-collar employees.
FBI. The project tests retention allowances and relocation bonuses designed to help theNew York City office recruit and retain workers. The New York office employs 2,100agents and support staff. The project, authorized by the Congress in 1988, is not a CivilService Reform Act demonstration.
The Forest Service and the Agriculture Research Service. In 1990, these two agenciesbegan testing a decentralized hiring system that features a streamlined examining process,recruitment incentives, and relocation allowances. The project may involve up to 5,000new hires.
16

THE NAVY DEMONSTRATION PROJECT
The Navy's demonstration project, started in 1980, was originally set up to run fiveyears. In 1988, the Congress extended the project to 1995. Altogether, the projectand its evaluation involves four naval laboratories and about 16,000 employees. Thefour labs employ a variety of professional, administrative, technical, and clericalworkers, although scientists and engineers make up about half the total number ofemployees. The new pay and position classification system was put into effect at twolaboratories, the Naval Weapons Center at China Lake, California, and the NavalOcean Systems Center at San Diego, California (see Box 2). These labs employ8,700 workers. Two other laboratories, where there were no changes, serve ascontrols for purposes of comparison; the Naval Surface Warfare Center at Dahlgren,Virginia, and White Oak, Maryland, and the Naval Air Development Center atWarminster, Pennsylvania. Although the four labs have different specificresponsibilities and locations (see Box 2), they also have many similarities. TheDirector of Navy Laboratories manages all four, and each is engaged in Navyresearch, development, testing, and evaluation. Finally, all four labs employ largenumbers of scientists and engineers.
The changes in personnel practices the Navy project adopted were designed toaddress problems that both demonstration labs had in recruiting high qualityscientists and engineers and in keeping the best of these employees. Among otherthings, the new personnel system at the demonstration labs features pay raises tiedto performance, and a simplified classification system employing broad pay bands.
Classifying Positions at the Demonstration Labs
At the two demonstration labs, the classification system groups related occupationsinto "career paths." The labs feature five such paths. Scientists, engineers, and otherprofessionals, for example, make up one path; budget analysts, personnel specialists,and other administrative employees make up another. The other three paths covertechnicians, technical specialists, and clerical personnel. Each career path isassociated with a range of salaries. Each salary range, in turn, is divided into broadpay bands (see Figure 1). These bands span at least two GS grades and represent,as do GS grades, different degrees of difficulty and responsibility. Under the system,for example, a GS-13 engineer would fall in pay band III of the career path forscientists, engineers, and other professionals.
Classification at the demonstration labs generally involves fewer and lessdiscrete decisions than those required by the GS system. Under the demonstrationproject, a position is assigned to a pay band representing a broadly defined level ofdifficulty rather than to a more narrowly defined General Schedule grade. As such,the Navy's system permits the use of shorter, simpler position-classification standardsand position descriptions.
17

Box 2LABORATORIES INVOLVED IN THE NAVY DEMONSTRATION PROJECT
Demonstration Sites
Naval Weapons Center at China Lake, CA Pilot personnel system began July 1980
Location: Upper Mojave Desert, 150 miles northeast of Los Angeles.
Civilian Employment: 5,400 with 48 percent in science, engineering, and otherprofessional occupations.
Mission: Principal research, development, testing, and evaluation (RDT&E) center forair warfare and missile systems (except anti-submarine warfare).
Naval Ocean Systems Center at San Diego, CA Pilot personnel system began July 1980
Location: Point Loma, 7 miles from downtown San Diego.
Civilian Employment: 3300 with 58 percent in science, engineering, and otherprofessional occupations.
Mission: Principal RDT&E center for command control, communications, oceansurveillance, surface- and air-launched undersea weapons, and submarine arctic warfare.
Control Sites
Naval Surface Warfare Center at Dahlgren, VAand White Oak, MD
Location: 40 miles south of Washington, D.C., and 20 miles east of Fredericksburg, VA.
Civilian Employment: 4,900 with 58 percent in science, engineering, and otherprofessional occupations.
Mission: Principal RDT&E center for surface ship combat systems, ordinance, mines,and strategic systems support.
Naval Air Development Center at Warminster, PA
Location: About 20 miles north of Philadelphia.
Civilian Employment: 2,700 with 64 percent in science, engineering, and otherprofessional occupations.
Mission: Principal RDT&E center for aircraft, airborne anti-submarine warfare, aircraftsystems, and surface ship, submarine, and aircraft navigation.
18

FIGURE 1. CAREER PATHS AND PAY BANDS AT THE NAVAL OCEAN SYSTEMS CENTER
Equivalent GS Grades
Career Paths
Scientists,Engineers,Senior Staff:Pay Bands
Technicians:Pay Bands3
TechnicalSpecialists:Pay Bands3
AdministrativeSpecialists:Pay Bands
GeneralClerical:Pay Bands
1 2 3 4
A
A
A
A
A
5 6
]
7 8
[
I
I
I
I II
9 10 11
II
II
II
II
III
12 13 14 15 16 17 18
III IV V
III
III
III
IV
n.a.
n.a.
n.a.
n.a.
SOURCE: Congressional Budget Office from information provided by the Office of Personnel Management.
NOTES: If qualified, technicians, technical specialists, and administrative specialists at the top of their career path can enter, at band III, the careerpath for scientists, engineers, and senior staff. General Clerical staff can enter, at band HI, the administrative, technical specialist, ortechnician career path.
Bands labeled "A" generally cover apprentices, student aides, and co-op students,
n.a. = not applicable,
a. The "technicians" career path primarily covers those engaged in engineering. The career path for "technical specialists" covers other technicians.

The Navy designed its classification system for simplicity and flexibility. Underthe system, the decisions involved in classifying work become less complex and thepotential for both error and disagreement drops. Classifiers, for example, no longerhave to concern themselves with the often subtle distinction between professionalwork at grade 12 and professional work at grade 13. Assigning and organizing work,moreover, does not require managers to observe as many fine distinctions betweenlevels of work and occupations as does the GS system, thus offering a potential boostto management effectiveness.
The Navy's design also offered potential advantages in recruiting and retainingworkers. Broad pay bands increase the range of salaries a laboratory can offer topotential new hires. For employees that a laboratory might hope to keep, the broadpay bands offer the opportunity for much greater pay growth. Finally, and perhapsmost important, the Navy designed its system to accommodate a pay-for-perfor-mance plan. Compared with the GS grade system, broad pay bands provide a widerrange of salaries, at a given level, within which to make performance-based paydistinctions. (Under the GS system, most grades have salaries with a 30 percentrange from top to bottom at each grade. As previously mentioned, pay bands coverat least two GS grades.)
Pay for Performance at the Demonstration Labs
Under the GS system, the government adjusts General Schedule rates in January ofeach year. Most employees (those not under merit pay systems) automaticallyreceive these raises. As described earlier, employees may also receive "within-grade"increases tied to length of service. Employees move up the salary range of eachgrade by means of these within-grade raises. By contrast, pay raises under the Navysystem depend on good performance, as under the merit pay system. By tying payto performance, officials hoped to encourage good employees to stay longer andpoor performers to leave sooner than they would have otherwise.
Pay adjustments occur in two segments. The first reflects governmentwide payincreases granted automatically to other GS workers in January of each year. Allemployees rated fully successful or better receive the full, annual governmentwideadjustment. Because the minimum and maximum salary rates of each pay bandincrease by the full amount of the annual adjustment, employees who receive no orlimited pay raises because of poor performance may find themselves in a lower payband. Few workers, however, receive poor ratings. For 1990, less than one half of1 percent of the work force at the demonstration labs were rated below the fullysuccessful level. Poor performance ratings are also rare in the government's meritpay program. They are rare in some large, private-sector firms as well.
The second segment of pay adjustments, referred to as incentive payments,substitutes for within-grade and other increases under the GS system. It is by meansof these payments that employees move up the salary range covered by a pay band.The size of the pool of funds for incentive payments primarily reflects the amount,measured as a percent of payroll, that laboratories spent in the past on awards,
20

within-grade increases, and certain other pay supplements. At the China LakeWeapons Center, the pool for incentive awards amounts to 2.4 percent of pay. Atthe Ocean Systems Center it amounts to 2.3 percent. The share of the pool awardedan employee reflects points earned in annual performance appraisals. (Points alsoadd up to an overall rating that determines the portion of the governmentwideadjustment earned. As previously mentioned, a rating of fully successful or betterearns a full comparability adjustment.) The method of determining point valuesvaries by laboratory, but is designed so that the total value of points awarded doesnot exceed the amount in the pay pool.
In 1984, both demonstration labs also began offering bonuses. These bonuses,like incentive awards, are granted on the basis of performance. Generally, thedemonstration labs use bonuses to reward good performance at temporaryassignments or for one-time accomplishments. Labs also use bonuses to rewardemployees for whom pay increases are not appropriate; for example, an employeeat the top of a pay band. The pool of funds available for bonuses is 0.8 percent ofpayroll at China Lake and 1.0 percent of payroll at the Naval Ocean Systems Center(NOSC). Together bonuses and incentive awards amount to 3.2 percent of payrollat China Lake and 3.3 percent of payroll at NOSC.
SOME RESULTS FROM THE NAVY PROJECT
In addition to simplicity, flexibility, better recruitment and retention, and the otheranticipated benefits described in the previous section, Navy officials hoped thedemonstration project would increase the commitment of employees to andsatisfaction in their work. The overarching objective of the project, of course,remains more effective operation of federal laboratories.
Unfortunately, after over a decade of experiment and analysis, available dataand information provide only a sketchy picture of the costs and benefits of thedemonstration project. OPM continues to refine its analysis of costs, and analysisof benefits is hampered by missing or poor data and the complexity of quantifyingsome benefits. Among the more serious problems is that no data were collected, oneither the productivity of lab operations or the quality of lab work, on which to basean assessment of organizational effectiveness.21 One can conclude with a fairdegree of reliability that the project has simplified personnel administration andimproved the attitudes that employees have about their work. Results for otherproject objectives, such as improved retention, are less clear. No analysis, however,has identified any serious problems with the experimental personnel system. And
21. Monitoring productivity for research, development, testing, and evaluation (RDT&E) is notwidespread in private or government organizations because developing meaningful measures ofoutput is difficult. The Department of Defense (DoD) has, however, developed a generalized guidefor organizations and managers to quantify and assess quality and productivity; but no concertedeffort was made to apply the guide to the demonstration project despite strong interest at one ofthe control sites (Dahlgren, VA).
21

whatever the project's advantages are, they appear to have been gained with onlymodest increases in federal costs.
Finally, it is important to remember that the Navy designed its experimentalpay banding and pay-for-performance systems to meet the specific recruitment andretention needs of two specialized facilities; laboratories employing large numbersof scientists and engineers. A system designed with more general applicability couldhave very different features and thus very different impacts.
Personnel Administration
Analysis by OPM indicates that personnel administration at the Navy demonstrationlabs has been simplified. The hours that both supervisors and personnel staff spenton each classification action dropped. So did the number of actions. 22 (OPMcompared the performance of the demonstration labs with their performance beforeinstalling the new personnel practices and with the performance of the controllaboratories.) OPM estimated that the savings associated with simplified classifica-tion amounted to about 0.8 percent of total payroll at the demonstration sites. Mostof the savings reflected the smaller amount of time supervisors spent on eachclassification action. The OPM estimates provide a quantification of resourcesliberated by simplification and available for commitment to other laboratoryactivities. Liberated supervisory time is then probably devoted to activity that ismore directly related to laboratory research and development. OPM has notupdated its estimate and qualifies its conclusions by pointing out the difficulties ofmeasuring and comparing the time employees devote to different tasks. OPM alsonotes that savings associated with the other advantages of the demonstration projectoccur, but cannot be quantified.
Recruitment. Retention, and Employee Attitudes
Both the General Accounting Office (GAO) and OPM have observed improvementsin recruitment at the demonstration labs. Determining how much of the improve-ment is attributable to the demonstration project, however, is difficult. OPMmaintains that the project's higher starting salaries had the greatest impact onrecruitment success. But the lab's intensified recruitment efforts may also accountfor some of the improvement. OPM reports that recruitment programs at all fourlabs are far above the government norm.
GAO's analysis found that the average college grade point average (GPA) ofnewly hired junior professionals increased slightly at both demonstration labs
22. Office of Personnel Management, Summary Assessment of the Navy Demonstration Project (February1986), pp. 30-34.
22

between 1980 and 1985.23 The OPM analysis, which is still under review, alsoshows a rise in the GPA of new hires, but only at one demonstration lab (data forthe other lab were incomplete). At the same time, according to OPM, GPAs at thecontrol labs have held steady. OPM also reports that the demonstration labs havebecome better able than the control labs to fill vacancies, and that the frequencywith which job offers are accepted has increased. (GPAs are, of course, only animperfect measure of the quality of newly hired employees.)
In order to assess the impact of the demonstration project on retention, theOPM conducted a number of analyses of employee turnover. On this basis, OPMmaintains that recruitment and retention, particularly of superior performers, hasimproved.24 OPM's analyses, however, acknowledge important limitations. Theysuffer from missing base-year data and from the lack of information about a varietyof factors that influence employee turnover, including the important one ofemployee tenure.25 Accordingly, it is difficult to attribute the observed changesin turnover to an experimental personnel system.
Consistent with the objectives of the demonstration project, OPM data showthat turnover rates at the demonstration labs were generally lower and less erraticthan those at the control labs (see Table 6). The trend in rates, however, variedaccording to the group and the time period. (CBO considered all years for whichdata were available.) The overall trend in rates for all white-collar workers at boththe control and demonstration labs between 1981 and 1989 was upward. At thedemonstration labs, the rate increased from 8.3 percent to 8.6 percent. The rate forthe control labs rose from 8.7 percent to 9.6 percent, but fluctuated dramatically overthe period. For superior performers, a group of great concern to the Navy, turnoverrates fell between 1984 and 1989 at both the demonstration and the control labs.But contrary to expectations, the decreases were generally steeper at the controllabs. For scientists and engineers with superior performance, for example, rates atthe demonstration labs dropped from 4.6 percent to 4.0 percent; a 13 percentdecrease. At the control labs rates dropped from 6.7 percent to 5.2 percent; a 22percent decrease.
23. General Accounting Office, Observations on the Navy's Personnel Management DemonstrationProject (May 1988).
24. Office of Personnel Management, Turnover in the Navy Demonstration Laboratories 1980-1985(December, 1988) and unpublished data from a forthcoming report. The measure of turnover usedexpresses employee separations in a given year as a percentage of the average employment in thatyear. Separations, for purposes of the analysis, consist primarily of resignations, retirements, andtransfers to other agencies.
25. The relationship between tenure and turnover is well documented and not unique to government.The relationship is inverse and reflects in part the value placed on compensation packages that, likethe government's, rewards service and age primarily by providing progressively larger pensions. SeeCongressional Budget Office, Employee Turnover in the Federal Government (February 1986), pp.17-22. For an analysis of governmentwide turnover, see U.S. Merit Systems Protection Board, Whois Leaving the Federal Government? An Analysis of Employee Turnover (August 1989).
23

TABLE 6. EMPLOYEE TURNOVER AT THE DEMONSTRATION ANDCONTROL LABORATORIES INVOLVED IN THE NAVYDEMONSTRATION PROJECT
1981 1984 1985 1986 1987 1988 1989
All White-Collar Workers
Control Labs 8.7 12.3 13.6 10.9 15.0 9.1 9.6Demonstration Labs 8.3 8.5 9.9 9.7 9.4 8.9 8.6
White-Collar Workers with Superior Performance
Control Labs n.a. 8.0 10.2 8.5 11.3 6.8 6.2Demonstration Labs n.a. 5.7 6.2 7.4 5.6 5.0 5.5
Scientists, Engineers, and Other Professionalswith Superior Performance
Control Labs n.a. 6.7 10.4 7.3 9.1 5.9 5.2Demonstration Labs n.a. 4.6 5.0 6.0 5.5 4.2 4.0
SOURCE: Office of Personnel Management.
NOTE: n.a. = not available.
OPM offers more convincing evidence of the demonstration project's effects onemployee attitudes. OPM's concerns with the subject stem from the importantrelationship between such factors as job satisfaction and turnover and overallperformance. To assess employee attitudes, OPM conducted seven surveys between1979 (the year before the demonstration project was carried out) and 1989. Allsupervisors were polled, as well as a random sample of 25 percent of all nonsupervi-sory staff. Survey questions covered an array of subjects, including job satisfaction,support for the demonstration project, and intent to look for another job. Generally,data show trends supporting the objectives of the demonstration project.26
26. Office of Personnel Management, Turnover in the Navy Demonstration Laboratories 1980-1985(December 1988), Effects of Performance-Based Pay on Employees in the Navy DemonstrationProject: An Analysis of Survey Responses 1979 to 1987 (December 1988), and unpublished OPMdata.
24

Data, for example, show higher job satisfaction at the demonstration labs forthe entire 10-year period. More important, the job-satisfaction advantage at thedemonstration sites grew considerably. In 1979 the percentage of scientists andengineers indicating satisfaction with their work stood at 73 percent at the controllabs and 76 percent at the demonstration labs; a premium of three percentagepoints. By 1989, the figures were 73 percent and 81 percent respectively-a premiumof eight percentage points.
The Cost of the Demonstration Project
While the limitations associated with the existing data and information do not permita meaningful comparison of costs and benefits, one can conclude with a fair degreeof reliability that the Navy project has not resulted in dramatic increases in federalpay and benefit costs. According to preliminary estimates prepared by OPM, thedemonstration project has increased salary costs, over what might have occurredotherwise, by about 6 percent. Both of the project's major interventions—gradebanding and performance-based pay-contributed to the increase. Preliminaryanalysis suggests that grade banding has proven the most costly innovation,accounting for about two-thirds of the rise in costs. Banding, by removing barriersbetween grades, permitted many employees to achieve career and salary advance-ments that would have been impossible under the GS system. According to OPM,the remaining third of the increase in salary costs at the demonstration labs isassociated with the project's pay-for-performance practices, in particular the use ofa fixed pool of funds for incentive pay raises,
OPM states that by employing fixed pools, the demonstration labs may haveawarded more in raises than the control labs, where the overall amount spentreflects employees' performance and years of service. In addition, in calculating thesize of the pools, the demonstration labs included a factor that reflects amountspreviously paid out as one-time cash awards. Therefore, they probably averagedmore in permanent salary increases than did the control labs where awards are stillmade. OPM also points to additions to the pools designed to reflect anticipatedwork force and other changes. OPM believes these may have raised costs at thedemonstration labs.
OPM bases its estimates on 1989 and 1990 data for scientists, engineers, andother professionals, who together account for about two-thirds of payroll. OPMestimated costs by comparing control labs with demonstration labs. (Comparisonswith different labs may not yield the same or similar results.) OPM defined costsas the difference between the actual salary expenses of the demonstration sites andthe expenses that would occur if the demonstration sites had the same averagesalary, by level, and the same employment distribution, by level, as the control labs.The analysis also employed multivariate regression analyses to exclude costdifferences caused by factors unrelated to the experimental personnel system,including those attributable to occupational distribution (scientists versus engineers),tenure, and educational attainment.
25

It is worth noting that the OPM estimate represents the cumulative effect of theNavy's experience over nearly 11 years (July 1980 through 1990) of carrying out anddevelopment. Averaged over the entire period, salary costs amount to a modestincrease of 0.5 percent per year. An equivalent increase in governmentwide GSpayroll would raise federal expenses by $250 million (in 1991 dollars). If the costsof retirement are included, the estimate rises to $280 million. Such cost increaseswould be insignificant compared with the 6 percent average annual increase in costsprojected through the turn of the century. Some of the costs and benefits of any paybanding system the government might adopt, moreover, are anticipated by payreform, which allows for pay-for-perforrnance, bonuses, and other features that oftencharacterize such systems.27
In the interest of reducing budget deficits or pursuing other spending and taxpriorities, the government may, of course, choose to forgo some or all of thepotential benefits and costs of pay and other personnel reforms.28 The govern-ment can always insist that reform meet requirements of budget neutrality, butmeaningful reform would almost certainly entail some costs.29 To keep costsdown, the government could modify the scope and design of reform. With regardto pay banding, for example, reform measures could emphasize bonuses over raises,employ fairly narrow bands, and limit raises for employees at the top end of theirpay band.
27. For an analysis of the costs of implementing federal pay reform, see Congressional Budget Office,Federal White-Collar Pay Reform: Costs and Financing (September 1990).
28. Current budget projections make no specific allowance for federal pay raises other than thosenecessary to match average increases expected in the private sector. Accordingly, some budget plansmight call for limits in effecting pay comparability under pay reform. For a discussion of pay raisesunder pay reform and the CBO baseline, see Congressional Budget Office, The Economic andBudget Outlook Fiscal Years 1992-1996 (January 1991), p. 89.
29. The demonstration project at the National Institute of Standards and Technology (NIST) adoptedpersonnel reforms similar to those of the Navy, along with a requirement of budget neutrality.NIST measures its success in meeting its goal by comparing actual costs to projections based oncosts prior to the adoption of the reforms. For a discussions of the NIST project and budgetneutrality, see Office of Personnel Management, Second Annual Evaluation Report, National Instituteof Standards and Technology Personnel Management Demonstration Project (August 1990).
26

APPENDIX

TABLE A-l. NUMBER OF FULL-TIME WHITE-COLLAR FEDERALWORKERS BY GRADE AND OCCUPATIONAL GROUP,MARCH 1990 (In thousands)
Grade
GS-1GS-2GS-3GS-4GS-5GS-6GS-7GS-8GS-9GS-10GS-11GS-12GS-13GS-14GS-15
Profes-sionalJobs
000
b
3b
13b
402
6785663620
Adminis-trativeJobs
b
b
b
b
81
274
6817
104107683715
Tech-nicalJobs
b
1
42150598519448
241641
b
Cleri-cal
Jobs
16
401131213816631
b
b
b
b
0
OtherJobsa
b
b
1
6116633
b
21
b
b
b
All
Jobs
17
4514019310314732
15829
1962091387335
Total 332 456 336 343 38 1,505
SOURCE: Congressional Budget Office from Office of Personnel Management data.
NOTE: Details were rounded independently. Totals may not, therefore, reflect the sums of jobcategories.
The Federal Employees Pay Comparability Act of 1990 (Public Law 101-509) creates aseparate senior level service for employees formerly in grades 16,17, and 18. As of March1990, these employees numbered aibout 700.
a. Workers in this category are primarily in law enforcement related occupations. Also included areoccupations for which agencies did not report a category.
b. Total rounds to less than 1,000.
28

FIGURE F-l. REPRINT OF A POSITION-CLASSIFICATIONSTANDARD FOR CORRESPONDENCE CLERK, GS-4
OPM Benchmark Description SeriesGS-309
Grade04
BMK*01
CORRESPONDENCE CLERK, GS-4
Serves in a correspondence unit of a military personnel commandactivity composing responses to a variety of common requests,questions, and complaints related to an individual's military statusor record. These responses require examination of service records,but do not require more involved technical determinations such asthose made by military personnel examiners.
Duties—Reads incoming correspondence concerning current and
former service members written by service members them-selves, their relatives, employers, prospective employers,creditors, commanding officers, military finance centers, at-torneys, congressmen, federal, state, and local governmentagencies, and other authorized parties.
—Identifies the specific kind of information required to answerthe correspondence which has been screened and coded toany one of 10 general categories by the "make ready" unit.Determines the correspondent's entitlement to such informa-tion.
—Searches individual service record "jackets," records onmicrofiche, and service record information retrievedelectronically via computer terminal to gather information onan individual's current military status or past record such asthe date and place an individual entered the military service,his or her current duty station, current rate of pay, periodsof active and inactive duty, disciplinary actions taken againstthe individual, training received, dates and places of duty,past assignments, rates or ranks held at particular periods oftime, etc. Information is used to determine eligibility for andpreparation of upgraded or reissued discharge papers andcertificates; to determine eligibility for particular medals andcitations; to prepare necessary documents certifying an indi-vidual's military or civilian status for a court's use indetermining his or her susceptibility to garnishment in childsupport, alimony, or mortgage default cases; to prepare serv-ice transcripts needed by a former service member for UPA in
29

FIGURE F-l. (Continued)
SeriesGS-309
Grade04
BMK*01
obtaining specialized employment such as work as a mer-chant seaman; etc.
—Composes letters, messages, or telegrams to other militarycommands, branches of service, or other appropriate sourcesto request information not found in records at hand oromitted from the incoming correspondence or informationneeded to resolve conflicting or inconsistent informationfound in initial search.
—Composes correspondence arranging information gatheredinto logical sequence and appropriate format including anynecessary forms. Submits completed draft letters to typistsfor typing in final form instructing them on matters such asformat, addressees, addresses, and necessary number of cop-ies. Assembles final correspondence into a prescribed "pack-age" of letter, attachments, and enclosures in the right num-ber of copies and submits it to the authorized official forsignature.
Knowledge Required by the Position—Level 1-3—550 points
—Knowledge of the internal organization of military servicemember records and the relationships of their parts in orderto search records and extract service information required indeveloping accurate and adequate written responses to a va-riety of requests, questions, and complaints, and to recognizeerrors, inconsistencies, or omissions in service record infor-mation.
—Knowledge of the various military services' personnel man-agement related organizations, such as Finance, Reserve,and Records Centers and their functions and terminologysuch as that related to duty status, rank, and pay in order tounderstand incoming correspondence, to identify and contactin writing likely sources for needed information, and to com-pose accurate replies.
—Knowledge of the rules for entitlement to a variety of mili-tary certificates, decorations, and citations in order to deter-mine the response to a correspondent's request for issuanceor reissuance.
30

FIGURE F-l. (Continued)
SeriesGS-309
Grade04
BMK*01
—Knowledge of the rules of grammar, spelling, and punctua-tion for composing correspondence and reviewing corre-spondence composed or typed by others.
—Knowledge of unit rules and procedures for recording assign-ments, for selecting the proper format, releasing servicemember information, and contacting other offices in the em-ploying organization and other military components.
Factor 2, Supervisory Controls—Level 2-2—125 points
The employee answers routine correspondence in selected catego-ries routed directly to the unit. The unit supervisor or authorizedassistant provides instructions on changes in rules or unit proce-dures. The employee independently identifies, gathers, selects, andorganizes the appropriate information. Completed replies arechecked for accuracy, responsiveness, and adherence to unit proce-dure.
Factor 3, Guidelines—Level 3-2—125 points
Guidelines include model letters, a Departmental correspondencemanual, Military Personnel Command directives, correspondenceunit directives, duty station directories, and posters depicting andexplaining military decorations. Since each correspondent's circum-stances are unique and information provided by the correspondentis not always complete or consistent, each reply requires exercise ofjudgment in selecting the most appropriate of several alternativesoffered by the guidelines. Where inconsistencies or gaps in informa-tion cannot be resolved and correspondent's status remains unclear,the situation is referred to the supervisor.
Factor 4, Complexity—Level 4-2—75 points
The employee composes responses to several different categoriesof situations, each requiring information gathering and organiza-tion. Information searches require determining which of severaltypes of records may exist and their location either in local files anddata banks or in those of other organizations. Information providedby incoming correspondence or in the records at hand is often in-complete and there are often a number of different types of records
31

FIGURE F-l. (Continued)
SeriesGS-309
Grade04
BMK*01
to locate. Depending on the circumstances, a number of differentkinds of correspondence may be composed to obtain and convey in-formation before a final reply is composed. Responses vary withsuch things as the kind of personnel matter involved and the extentof the inquirer's understanding of the military personnel system.
Factor 5, Scope and Effect—Level 5-2—75 points
The purpose of the work is to develop timely and factual replies tocurrent or former service members, to their commanding officers,close relatives, courts of law, Government agencies, and other au-thorized parties having requests or questions related to the servicemember's military status or record.
The work affects the accuracy of court actions such as allowinggarnishment of an individual's pay. It also affects the acceptabilityof a former service member's claim for veterans' benefits, applica-tion for employment in the Merchant Marine, or request for U.S.citizenship.
Factor 6, Personal Contacts—Level 6-1—10 points
The employee has contacts with employees within the corre-spondence unit, with employees in related or support units such as"make ready" clerks, military personnel examiners, "Freedom ofInformation/Privacy Act" specialists, and typists.
Factor 7, Purpose of Contacts—Level 7-1—20 points
Contacts are to question or explain incomplete information; toprovide instructions on format, forms, and enclosures; to explain acorrespondence situation and request guidance on release of infor-mation; and to request additional forms.
Factor 8, Physical Demands—Level 8-1—5 points
The work is done primarily while sitting at a desk. Occasionalwalking and carrying of service record jackets, forms, letters, andmanuals are necessary.
32

FIGURE F-l. (Continued)
SeriesGS-309
Grade04
BMK*01
Factor 9, Work Environment—Level 9-1—5 points
The work involves only normal risks or discomforts typical of anoffice setting and requires no special safety precautions.
TOTAL POINTS—790
SOURCE: Office of Personnel Management.
33

TABLE A-2. INCREASES IN AVERAGE GS GRADE BY TYPE OFAGENCY AND OCCUPATION, 1983-1990
AgencyAverage Grade
March 1983 March 1990
GradePoint
Increase
ProfessionalAdministrativeTechnicalClericalAll Workers
11.811.07.34.68.5
All Agencies
11.811.27.44.89.0
00.20.10.20.5
Defense
ProfessionalAdministrativeTechnicalClericalAll Workers
11.710.67.64.58.2
11.710.97.84.78.8
00.30.20.20.6
Nondefense
ProfessionalAdministrativeTechnicalClericalAll Workers
11.811.37.04.78.7
11.911.57.14.89.1
0.10.20.10.10.4
SOURCE: Congressional Budget Office from Office of Personnel Management data.
NOTE: Data cover full-time permanent employees covered by the General Schedule and similar payplans. The average grade given for "all workers" for each agency include workers for whomno occupation was specified and workers in the "other" occupational category, which mainlyincludes guards, police, correctional officers, and similar occupations. The increases shownfor "all workers" reflect shifts, between 1983 and 1990, in the distribution of workers amongthe four occupational categories (see Table A-3). The increases shown for each categoryseparately, by definition, do not.
34

TABLE A-3. PERCENT DISTRIBUTION OF THE FEDERAL WORK FORCEBY OCCUPATIONAL CATEGORY, 1983 AND 1990
Professional
Administrative
Technical
Clerical
Other
Total
1983
20
29
23
25
_3
100
1990
23
31
22
22
_2
100
SOURCE: Congressional Budget Office from Office of Personnel Management data.
NOTE: Data cover full-time permanent General Schedule employees.
35


