48
Changing the Oil Economy State of the World Worldwatch Institute

Changing the Oil Economy
State of the World Worldwatch Institute

The Oil Economy
• Strategic commodity• Economic security• Civil security
• Climate security• Alternatives
Courtesy Elmendorf AFB
The Oil Age fueled the 20th CenturyHow does it affect global security?
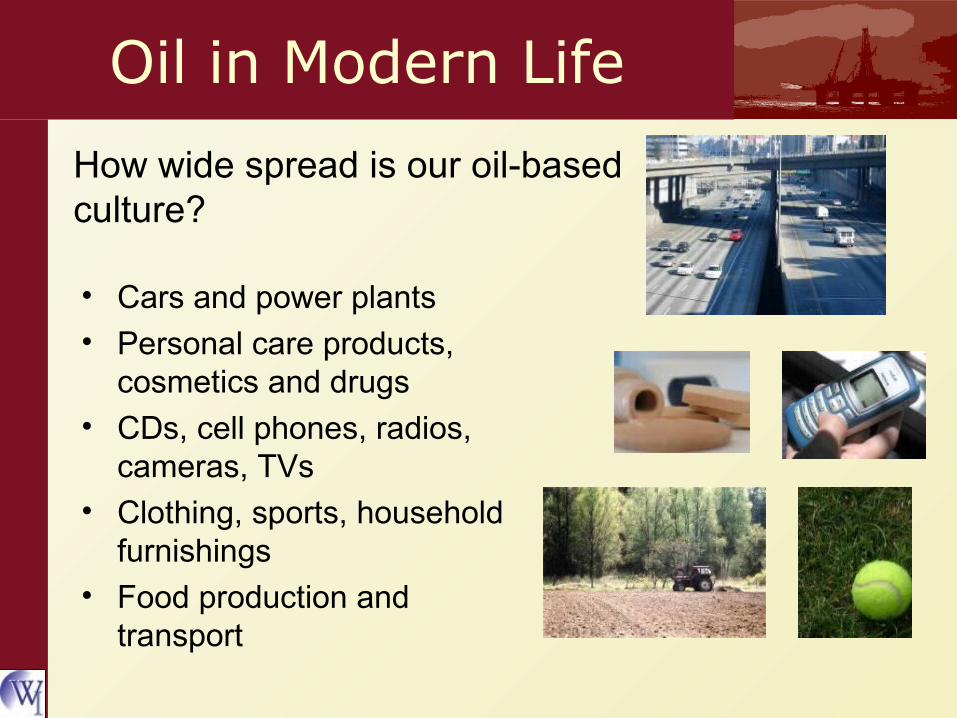
Oil in Modern Life
• Cars and power plants• Personal care products,
cosmetics and drugs• CDs, cell phones, radios,
cameras, TVs• Clothing, sports, household
furnishings
• Food production and transport
How wide spread is our oil-based culture?
A Strategic Commodity
• Oil is central to modern civilization• It is the world’s largest source of energy
• Oil has changed from an asset to a liability• Oil is key to manufacturing, feedstock and energy
and there are no ready substitutes
• Oil dominates world energy budgets• Per capita and total energy consumption
skyrocketed once fossil fuels became widely available
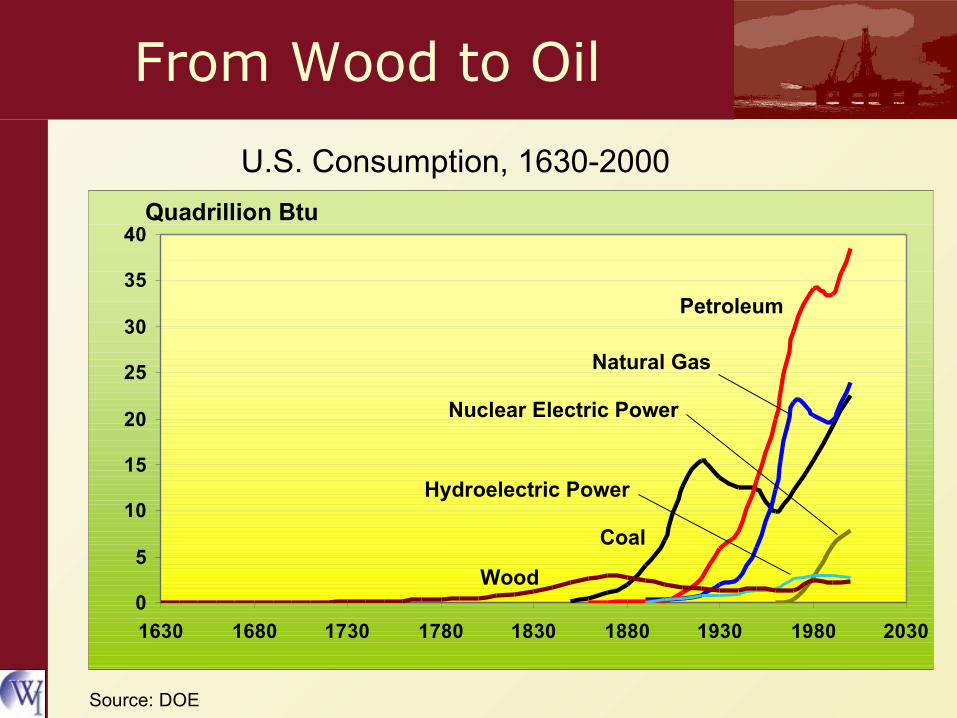
From Wood to Oil
0
5
10
15
20
25
30
35
40
1630 1680 1730 1780 1830 1880 1930 1980 2030
U.S. Consumption, 1630-2000
Quadrillion Btu
Source: DOE
Petroleum
Natural Gas
Nuclear Electric Power
Hydroelectric Power
Coal
Wood
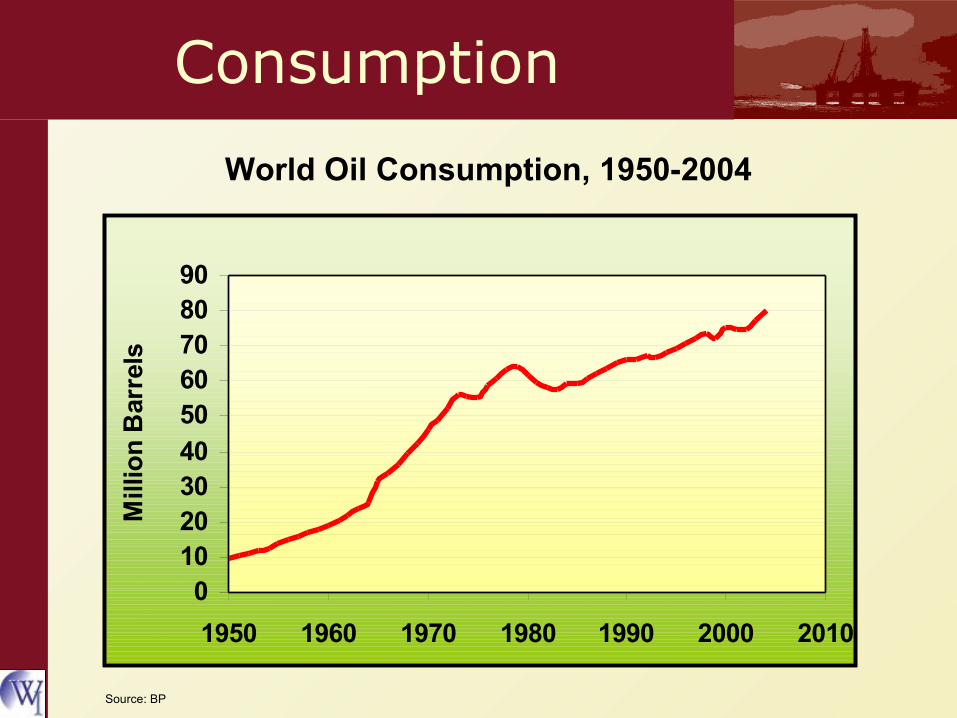
Consumption
World Oil Consumption, 1950-2004
Source: BP
010203040
5060708090
1950 1960 1970 1980 1990 2000 2010
Mill
ion
Bar
rels

China• China exported oil in the early 90’s• Today, it is the world’s second largest importer
0
1
2
3
4
5
6
7
1970 1980 1990 2000
Mil
lio
n B
arre
ls/D
ay
Production
Consumption
Source: DOE

Consumption
• Global consumption of useful energy per person is about 13 times higher than in pre-industrial times
• Per capita consumption is much higher in industrial than developing nations
• Consumption has risen despite increasing pollution, emissions and other problems
© USDA

Transportation
– The world’s automobile fleet grew from 53 million in 1950 to 539 million in 2003
– China, with an expanding economy, now has 20 million cars and trucks and by 2020 is projected to have a fleet of 120 million
Automobiles
Digital Vision
Oil accounts for nearly all transportation energy use

Transportation
Air travel has increased dramatically since jets were introduced
– 1950: 28 billion passenger-km
– 2002: 2,942 billion passenger-km
Air Travel
© NASA
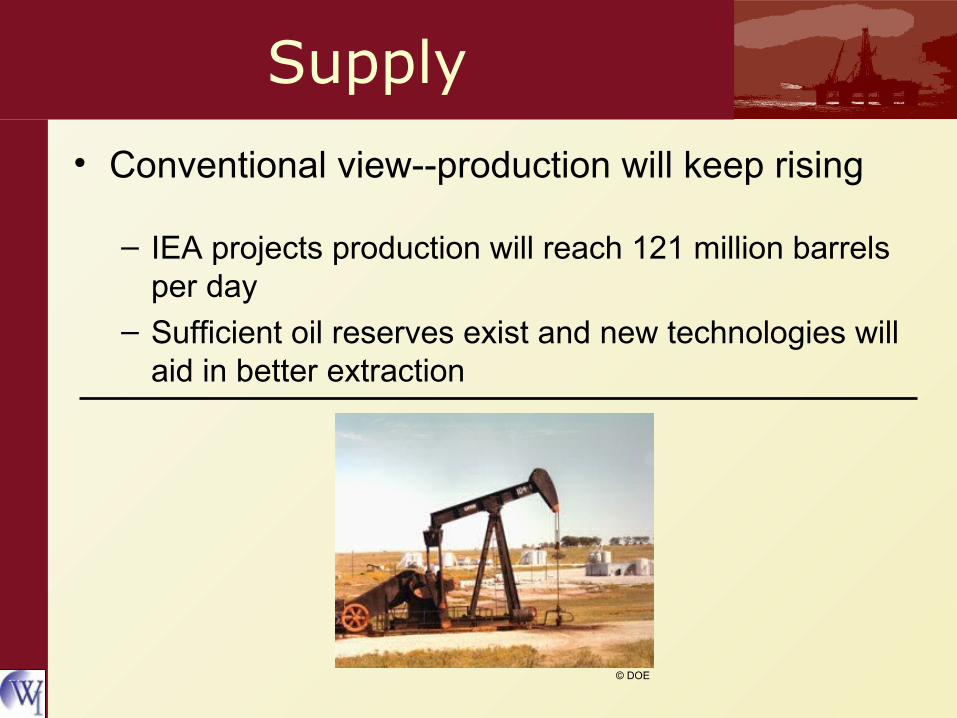
Supply
• Conventional view--production will keep rising
– IEA projects production will reach 121 million barrels per day
– Sufficient oil reserves exist and new technologies will aid in better extraction
© DOE

A Finite Resource
• Dissident view--production will begin to decline by 2007– Gap between supply and demand will continue to grow– New technologies will only accelerate rate of depletion
– Production has outrun discovery for past three decades
© Getty Images

Discoveries
World oil discoveries are lagging far behind production
0
10
20
30
40
50
60
1920 1940 1960 1980 2000 2020
Discoveries
Production
Bill
ion
Bar
rels
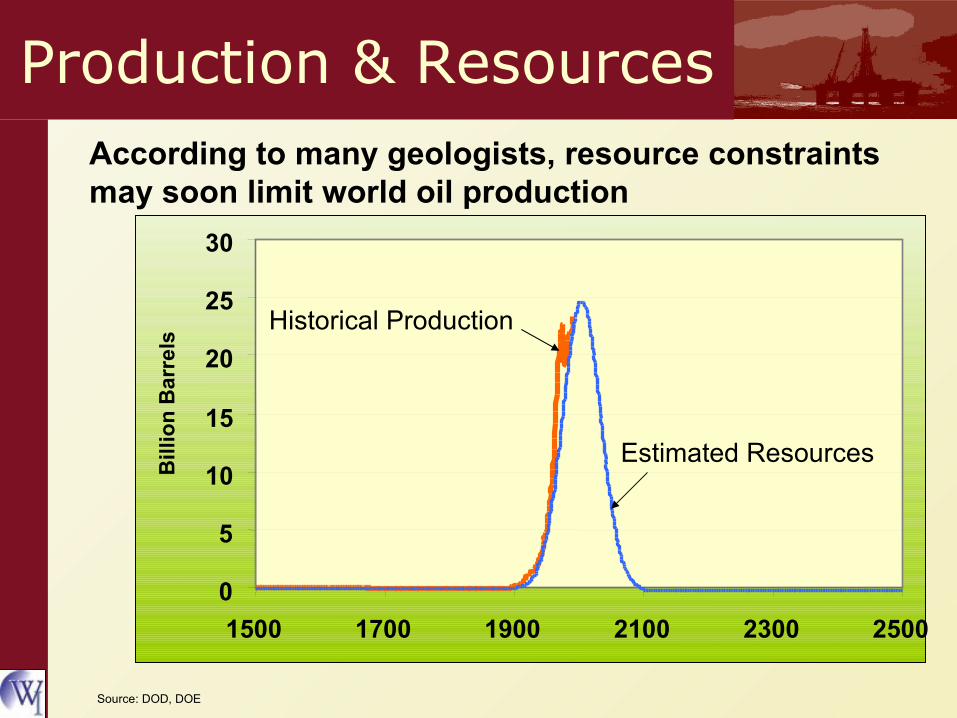
Production & Resources
Bill
ion
Bar
rels
Source: DOD, DOE
0
5
10
15
20
25
30
1500 1700 1900 2100 2300 2500
Historical Production
Estimated Resources
According to many geologists, resource constraints may soon limit world oil production
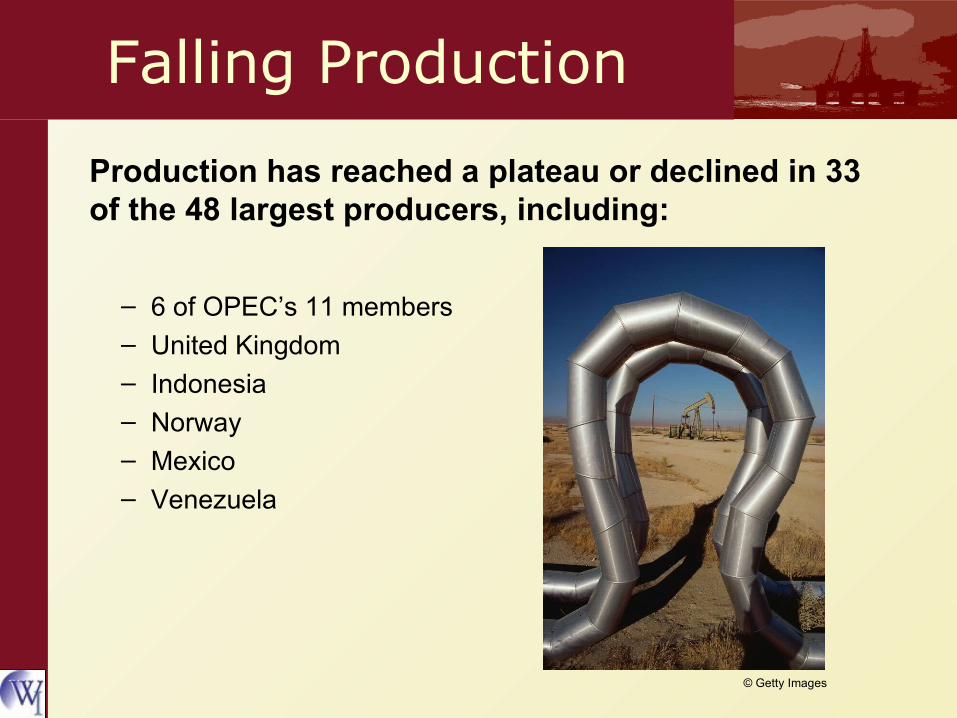
Falling Production
– 6 of OPEC’s 11 members– United Kingdom– Indonesia– Norway– Mexico– Venezuela
© Getty Images
Production has reached a plateau or declined in 33 of the 48 largest producers, including:
0
2
4
6
8
10
12
14
1950 1960 1970 1980 1990 2000 2010
Mill
ion
Bar
rels
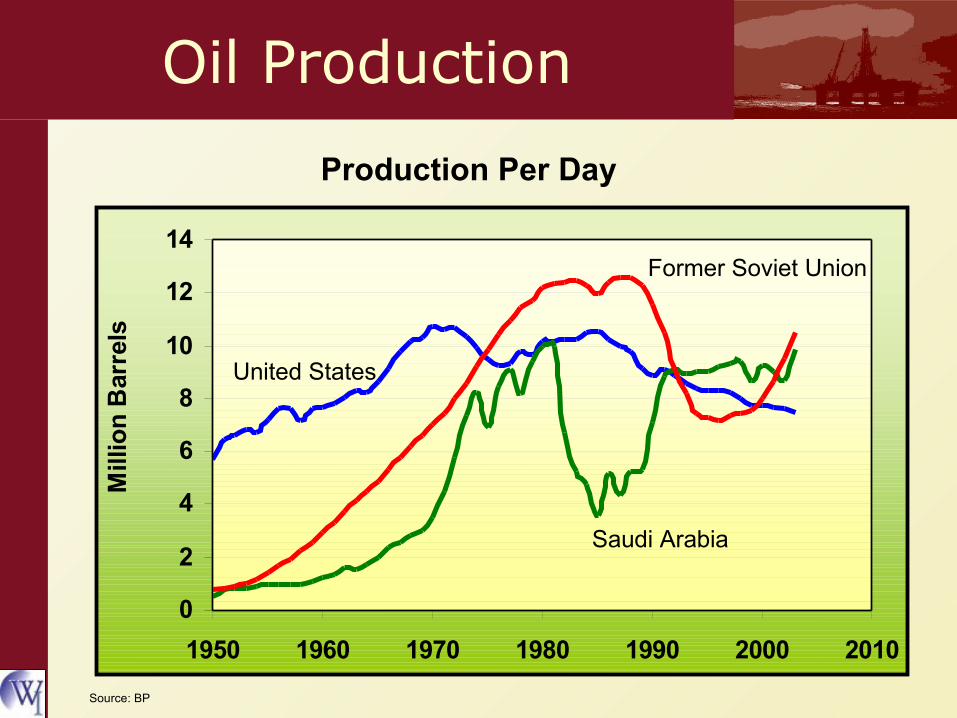
Oil Production
United States
Former Soviet Union
Saudi Arabia
Production Per Day
Source: BP
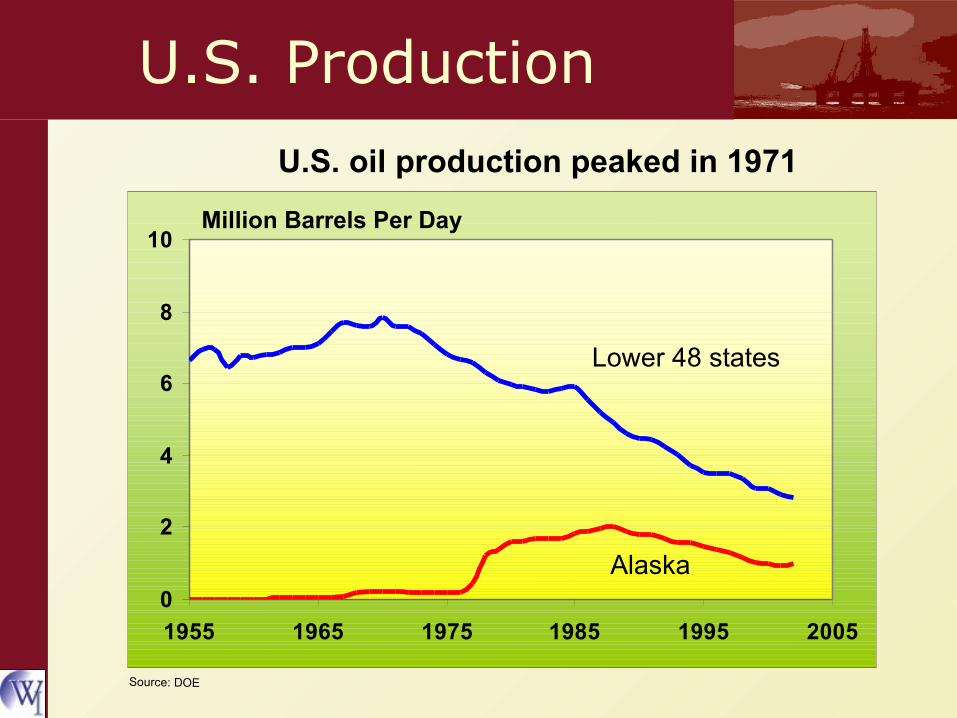
0
2
4
6
8
10
1955 1965 1975 1985 1995 2005
U.S. Production
Million Barrels Per Day
Source: DOE
Lower 48 states
Alaska
U.S. oil production peaked in 1971
Dependency
• Industrial nations use most of the world’s oil
• Developing nations– Are more dependent on oil as share of total energy use– Use more in proportion to the size of their economies
– Many import virtually all their oil– Are more vulnerable to price shocks than many
industrial nations

0 10 20 30 40 50 60 70 80
Dependency
Percent of Oil in Energy Budgets
Ecuador
Thailand
Japan
U.S.
France

Paying the PriceD
ollars Per B
arrel
Two decades of stable oil prices have abruptly ended. Is this a temporary anomaly?

Human Cost
Price increases translate into human cost in poor countries
– rising food costs affect diets– cooking fuel becomes less affordable
© FAO© UN

Price and Economic Growth
IEA estimates that if the price per barrel price increase is sustained, it will reduce economic growth throughout the world in 2006
0 1 2 3 4 5 6
Percent Reduction in Economic GrowthU.S.
Europe
India
Indebted countries
1.0
1.6
3.2
5.1

World Oil Trade, 2002
Exports, MBD< 11-22-45-66-9

World Oil Trade, 2020
Exports, MBD< 11-22-45-66-9
8.8
1970 1980 1990 2000 2010 2020
Trillion Ton-Miles
5.6 8.3 6.3 7.1 8.8 12.9

Exporter Dependency
• Exporters rely on a continuous stream of oil revenues because their economies are not diversified
• Oil income is often diverted to enrich elites and to pay for military buildup
© Getty Images

Uncertainty
• Growing demand will increase dependence on supplies from the Middle East
• Oil-producing countries are often politically unstable• True state of reserves in Persian Gulf, particularly
Saudi Arabia, are in question
• Countries such as China and India are entering into oil-intensive development and will intensify competition for oil
• Competition will trigger soaring prices
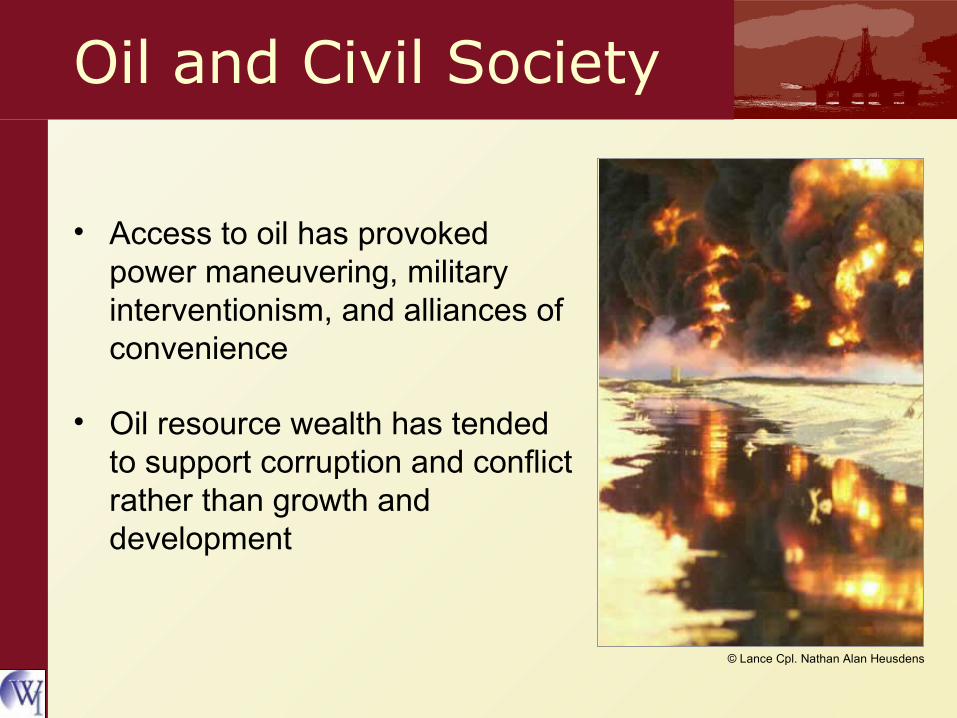
Oil and Civil Society
• Access to oil has provoked power maneuvering, military interventionism, and alliances of convenience
• Oil resource wealth has tended to support corruption and conflict rather than growth and development
© Lance Cpl. Nathan Alan Heusdens
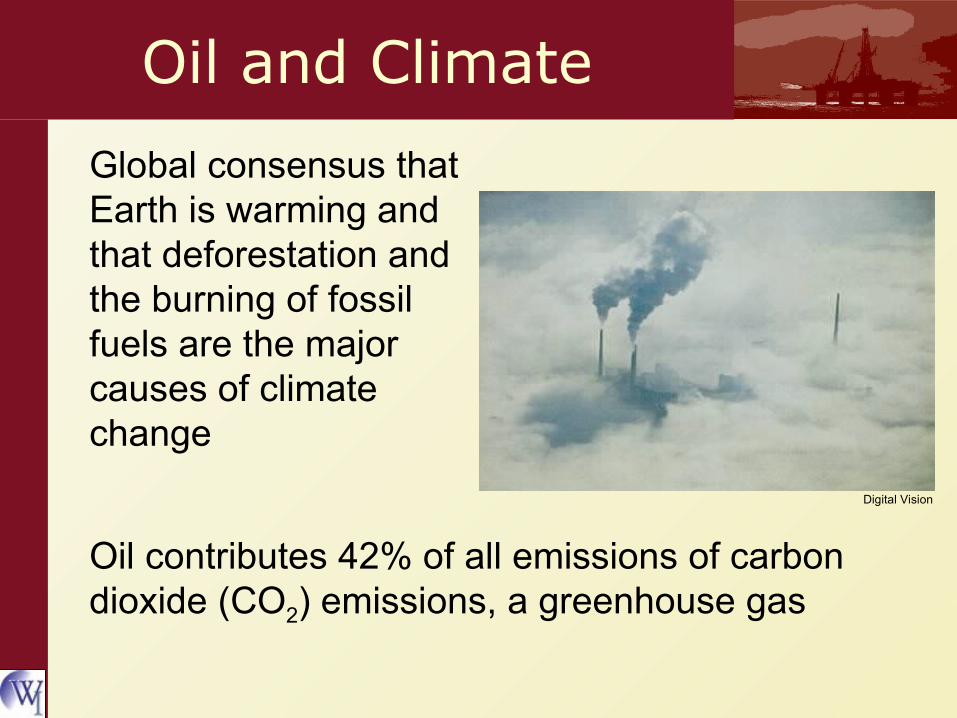
Oil and Climate
Global consensus that Earth is warming and that deforestation and the burning of fossil fuels are the major causes of climate change
Oil contributes 42% of all emissions of carbon dioxide (CO2) emissions, a greenhouse gas
Digital Vision

Atmospheric concentration of carbon dioxide is now higher than at any time in the last 650,000 years
Greenhouse Gas
Source: Scripps Institute of Oceanography
260
280
300
320
340
360
380
400
1850 1870 1890 1910 1930 1950 1970 1990 2010
Parts Per Million

Greenhouse Gas
Source: IPCC
Past and future CO2 concentration

Climate Change
Scientists project that rising temperatures will:
– melt ice caps and glaciers, raise sea levels, and increase storm severity
– trigger regional droughts and famines
– lead to the spread of diseases like malaria and dengue fever
– affect the growth and harvest of world food crops
Glaciers are already melting

Temperature Changes
The global average temperature is already higher than at any time since the Middle Ages
13.0
13.4
13.8
14.2
14.6
15.0
1860 1880 1900 1920 1940 1960 1980 2000
De
gre
es
Ce
lsiu
s
Source: Goddard Institute for Space Studies (GISS)

Climate Security
– Global increase in poverty– National and regional instability– Tightened food supplies– Conflict over water resources
Environmental effects from climate change threaten human security and the global economy
© UN
© Digital Vision

0
100
200
300
400
1980-84 1985-89 1990-94 1995-99 2000-04
Weather Disasters
The economic cost of weather-related catastrophes
Source: Munich Re
Billion Dollars
Uninsured Losses
Insured Losses
The Tipping Point
We may already be in the early stages of a global energy
transition…One that is as profound as the
advent of the oil age was a century ago.

The Tipping Point
Oil (1905)
Renewable Energy (2005)

Improving Efficiency
Improving automobile fuel economy can make an enormous difference
Gasoline and diesel-electric hybrid cars are twice as efficient as internal combustion engines

Renewable Energy
Wind- and solar- generated electricity are the fastest growing sources of energy in the world
Biomass fuels such as ethanol and biodiesel are proven and competitive with gasoline and diesel
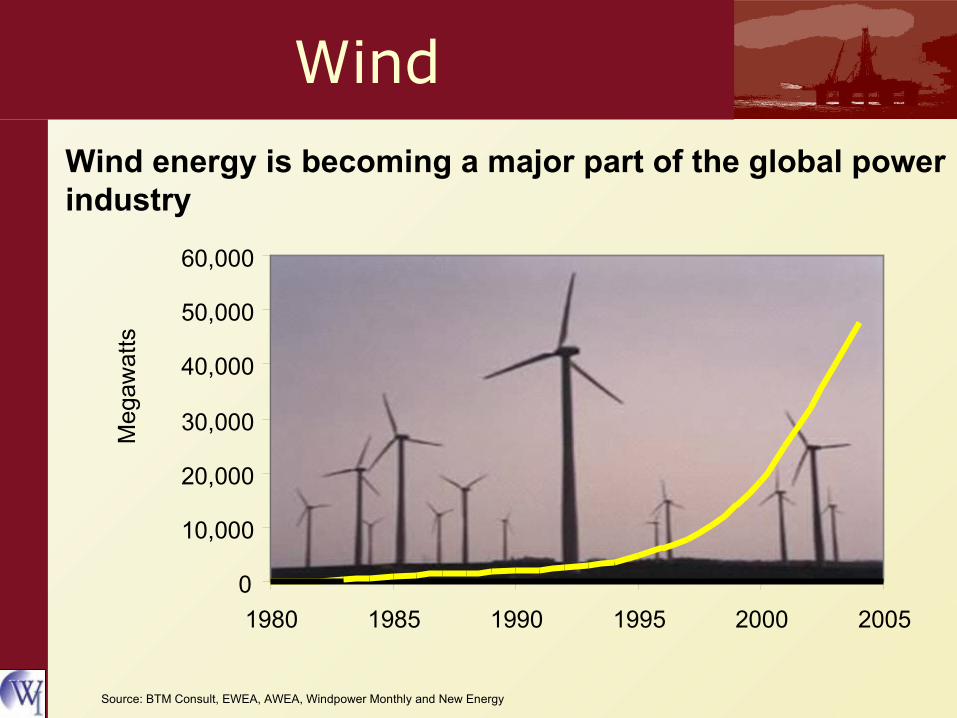
Wind
Wind energy is becoming a major part of the global power industry
Meg
awat
ts
Source: BTM Consult, EWEA, AWEA, Windpower Monthly and New Energy
0
10,000
20,000
30,000
40,000
50,000
60,000
1980 1985 1990 1995 2000 2005
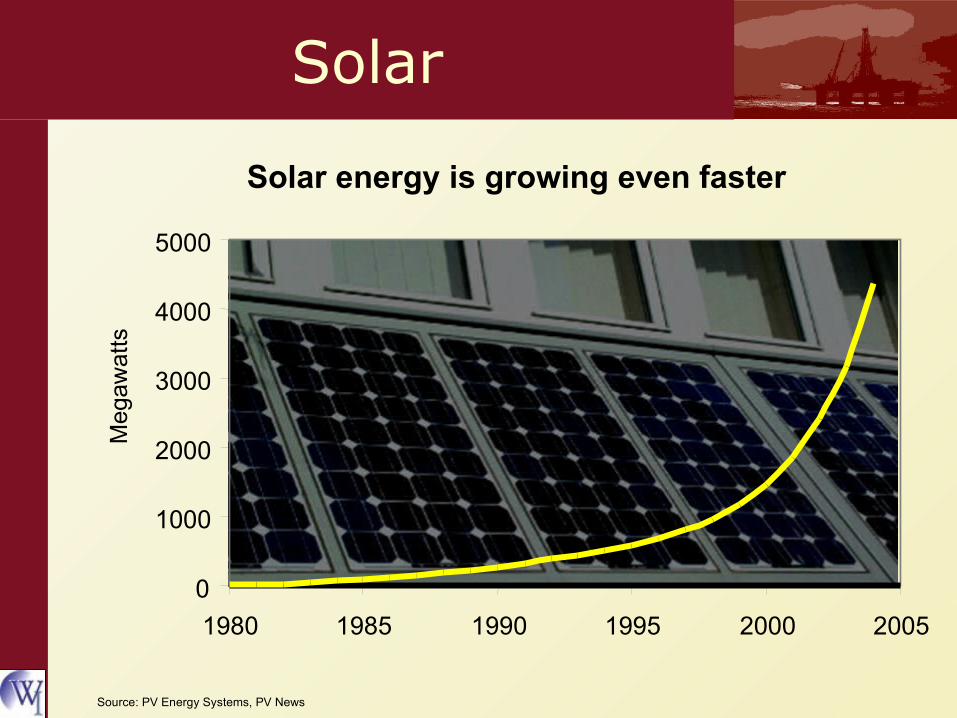
Solar
Solar energy is growing even faster
Meg
awat
ts
0
1000
2000
3000
4000
5000
1980 1985 1990 1995 2000 2005
Source: PV Energy Systems, PV News

Biofuels
• Biofuels are joining the bandwagon M
illi
on
Lit
ers
0
5,000
10,000
15,000
20,000
25,000
30,000
35,000
1980 1985 1990 1995 2000 2005
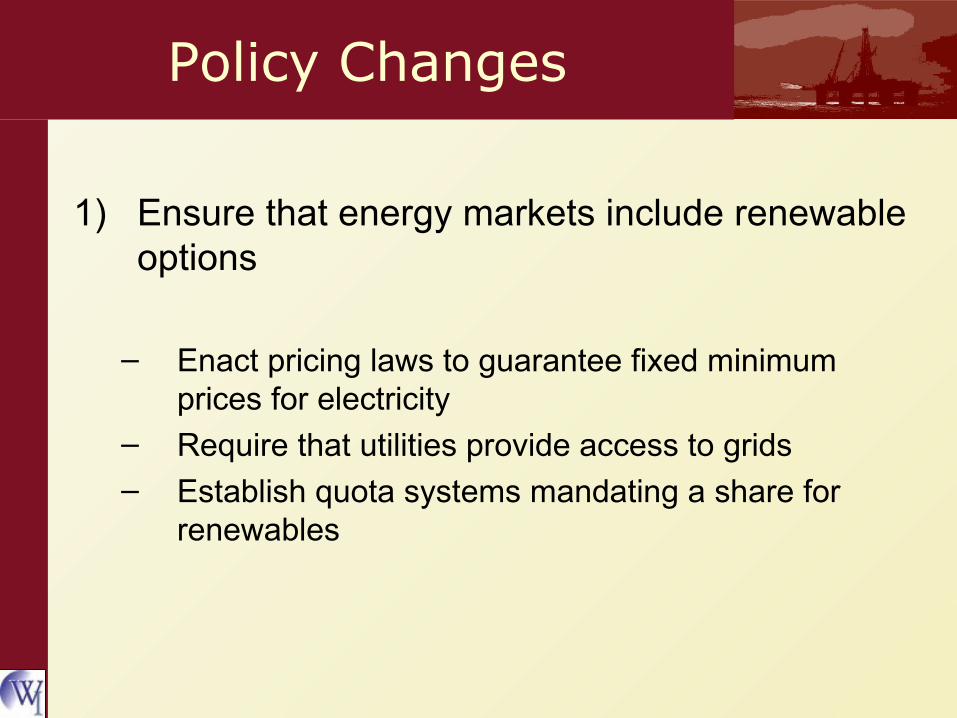
Policy Changes
1) Ensure that energy markets include renewable options
– Enact pricing laws to guarantee fixed minimum prices for electricity
– Require that utilities provide access to grids– Establish quota systems mandating a share for
renewables
Policy Changes
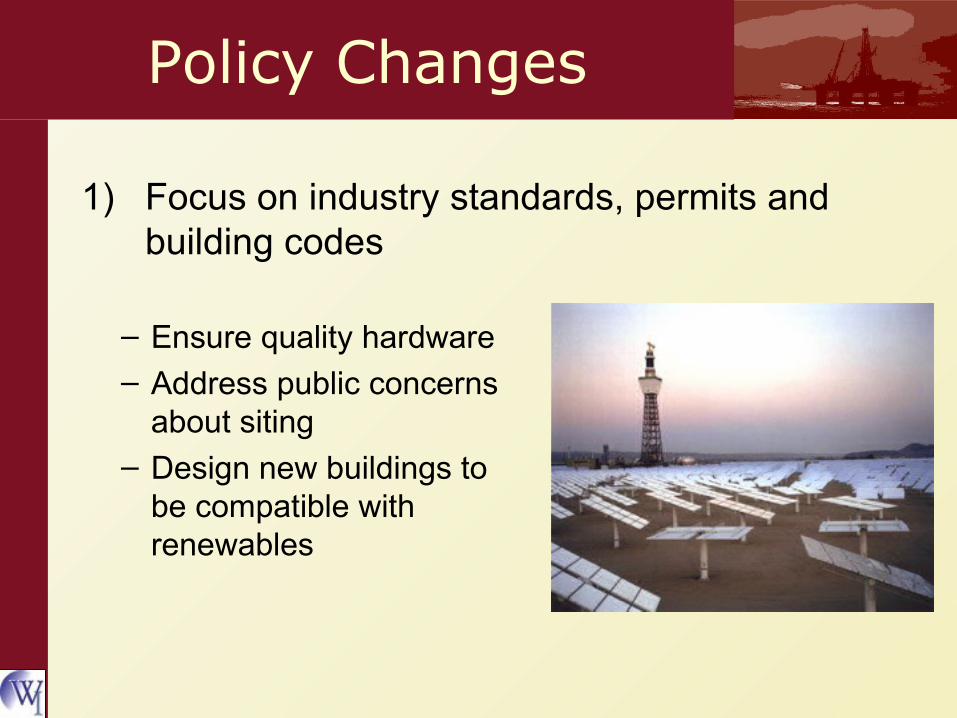
1) Focus on industry standards, permits and building codes
– Ensure quality hardware– Address public concerns
about siting– Design new buildings to
be compatible with renewables

Policy Changes
1) Educate investors and consumers
• Ensure a skilled workforce
• Increase public participation

Choices
World Energy Use
Source: Martinot, BP
0
5
10
15
20
25
30
35O
il
O
ther
Renew
able
s
Nucle
ar
Hydro
Trad
itiona
l
Bio
mas
s
Natur
al
GasCoa
l
% 2004

Choices
0
5
10
15
20
25
30
35
Hydro Oil
Nuclea
r
Win
d
Biofu
els
Gas
Trad
ition
al
B
iom
ass
Coal
Solar
PV
Source: Martinot, BP
World Energy Growth (2002-2004)
Annual Percent Growth Rate
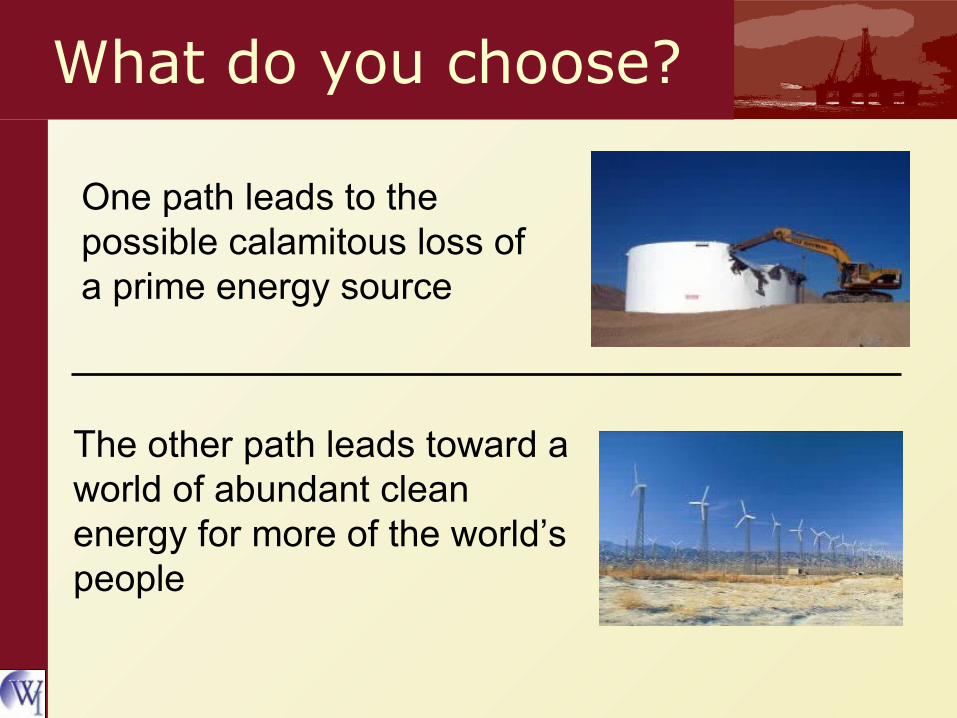
What do you choose?
One path leads to the possible calamitous loss of a prime energy source
The other path leads toward a world of abundant clean energy for more of the world’s people

Worldwatch Institute
Further information and references for the material in this presentation are available in the Worldwatch Institute’s publication “State of the World 2005”
www.worldwatch.org
This presentation is based on a chapter authored by:
Thomas Prugh, Christopher Flavin, and Janet L. Sawin


