Review of Agricultural and Applied Economics The Successor of the Acta Oeconomica et Informatica ISSN 1336-9261, XIX (Number 2, 2016): 10–18 doi: 10.15414/raae/2016.19.02.10-18 RAAE REGULAR ARTICLE THE DAIRY VALUE CHAIN AND FACTORS AFFECTING CHOICE OF MILK CHANNELS IN HARAR AND DIRE DAWA AREAS, EASTERN ETHIOPIA Mengistu KETEMA * 1 , Mohammed AMAN 1 , Eyassu SEIFU 2 , Tarekegn GETACHEW 3 , Estifanos HAWAZ 4 , Yonas HAILU 3 Address: 1 School of Agricultural Economics and Agribusiness, Haramaya University, PO Box 48, Haramaya Campus, Ethiopia, phone: +251969141750 2 Department of Food Science and Technology, Botswana University of Agriculture and Natural Resources, Private Bag 0027, Gaborone, Botswana 3 School of Animal and Range Sciences, Haramaya University, Ethiopia 4 Department of Biology, Haramaya University, Ethiopia *Corresponding author; E-mail: [email protected]ABSTRACT The study was aimed at mapping the dairy value chain, assessing constraints and opportunities in the sector, and identifying factors affecting channel choices of producers in Harar and Dire Dawa milkshed areas. Data were collected from 93 producers, six collectors, seven wholesalers, seven retailers, and ten consumers. Both descriptive and econometric analysis were employed. The study revealed that the channel choices available to producers include selling to collectors, wholesalers, retailers, and directly to consumers. The multinomial model output indicated that being in rural areas, breed type, separate milking place, and supply of hay negatively determined the choice to sell to wholesalers, retailers, and consumers. In contrast, education status and milk storage duration positively determined producers’ choice not to sell to collectors. The major recommendations include provision of training, disseminating dairy technologies, encouraging value chain actors to add values; and enhancing collective actions of producers. Keywords: Dairy value chain, Multinomial logit, Channel choice, Ethiopia JEL: Q12, Q13 INTRODUCTION Agriculture is the foundation of Ethiopia’s economy. Looking into the structure of the economy in 2013/14 production year, for instance, agriculture contributed 39.9% to the GDP where industry and service sectors contributed 14.2% and 45.9%, respectively (NBE, 2014). The same report indicated that out of the total contribution of agriculture to the GDP, the animal production sub- sector contributed 20.6% whereas crop and forestry sub- sectors had 70.7% and 8.7% contributions, in that order. In fact, some studies indicated that contribution of the livestock sub-sector is underestimated because of the fact that some benefits of livestock like traction power, manure for fertilizer, security during crop failures and others are not routinely included in agricultural GDP calculations (ICPALD, 2013). In 2014, Ethiopia had a total of 56.71 million cattle, 29.33 million sheep, 29.11 million goats, 2.03 million horses, 7.43 million donkeys, 0.4 million mules, 1.16 million camels, 56.87 million poultry, and 5.89 million bee hives in the sedentary areas (CSA, 2015a). The indicated figures exclude livestock population in non- sedentary areas of Afar region and six zones of Somali region where large number of camel population is available. Consequently, the country is believed to have the largest livestock population in Africa. These livestock categories are all important assets for rural households and for the country in general. The contribution of the livestock sector to the economy is manifold. Livestock provide the needed animal protein in the form of products like meat, milk, eggs and cheese contributing to nutritional security; play an important role in providing export commodities such as live animals, hides and skins; provide power for cultivation, threshing, and transport; confer a certain degree of security during periods of crop failure; provide farmyard manure to improve soil fertility and also as a source of energy; and other economic and social benefits (Smith et al., 2013). Despite the large livestock population and the available huge potential, the livestock sub-sector is confronted with a number of production and market- related challenges. Lack of improved breeds, shortage and poor quality of feed resources coupled with shortage of grazing land, poor management practices, and diseases coupled with inadequate veterinary services are among the major bottlenecks from the production side (Mekuriaw et al. 2012; Messay et al., 2013). Added to these, illegal trade activities, lack of market information, poor market infrastructure, and lack of market orientation in production process are some of the market-related challenges (Ayele et al., 2003; Gebremariam et al., 2010).
Transcript
Review of Agricultural and Applied Economics The Successor of the Acta Oeconomica et Informatica
ISSN 1336-9261, XIX (Number 2, 2016): 10–18 doi: 10.15414/raae/2016.19.02.10-18
RAAE REGULAR ARTICLE
THE DAIRY VALUE CHAIN AND FACTORS AFFECTING CHOICE OF MILK
CHANNELS IN HARAR AND DIRE DAWA AREAS, EASTERN ETHIOPIA
Mengistu KETEMA *1, Mohammed AMAN 1, Eyassu SEIFU 2, Tarekegn GETACHEW 3, Estifanos HAWAZ 4, Yonas HAILU 3
Address: 1School of Agricultural Economics and Agribusiness, Haramaya University, PO Box 48, Haramaya Campus, Ethiopia, phone: +251969141750 2Department of Food Science and Technology, Botswana University of Agriculture and Natural Resources, Private Bag 0027, Gaborone, Botswana 3School of Animal and Range Sciences, Haramaya University, Ethiopia 4Department of Biology, Haramaya University, Ethiopia *Corresponding author; E-mail: [email protected] ABSTRACT The study was aimed at mapping the dairy value chain, assessing constraints and opportunities in the sector, and identifying factors affecting channel choices of producers in Harar and Dire Dawa milkshed areas. Data were collected from 93 producers, six collectors, seven wholesalers, seven retailers, and ten consumers. Both descriptive and econometric analysis were employed. The study revealed that the channel choices available to producers include selling to collectors, wholesalers, retailers, and directly to consumers. The multinomial model output indicated that being in rural areas, breed type, separate milking place, and supply of hay negatively determined the choice to sell to wholesalers, retailers, and consumers. In contrast, education status and milk storage duration positively determined producers’ choice not to sell to collectors. The major recommendations include provision of training, disseminating dairy technologies, encouraging value chain actors to add values; and enhancing collective actions of producers. Keywords: Dairy value chain, Multinomial logit, Channel choice, Ethiopia JEL: Q12, Q13 INTRODUCTION Agriculture is the foundation of Ethiopia’s economy. Looking into the structure of the economy in 2013/14 production year, for instance, agriculture contributed 39.9% to the GDP where industry and service sectors contributed 14.2% and 45.9%, respectively (NBE, 2014). The same report indicated that out of the total contribution of agriculture to the GDP, the animal production sub-sector contributed 20.6% whereas crop and forestry sub-sectors had 70.7% and 8.7% contributions, in that order. In fact, some studies indicated that contribution of the livestock sub-sector is underestimated because of the fact that some benefits of livestock like traction power, manure for fertilizer, security during crop failures and others are not routinely included in agricultural GDP calculations (ICPALD, 2013).
In 2014, Ethiopia had a total of 56.71 million cattle, 29.33 million sheep, 29.11 million goats, 2.03 million horses, 7.43 million donkeys, 0.4 million mules, 1.16 million camels, 56.87 million poultry, and 5.89 million bee hives in the sedentary areas (CSA, 2015a). The indicated figures exclude livestock population in non-sedentary areas of Afar region and six zones of Somali region where large number of camel population is available. Consequently, the country is believed to have the largest livestock population in Africa. These livestock
categories are all important assets for rural households and for the country in general.
The contribution of the livestock sector to the economy is manifold. Livestock provide the needed animal protein in the form of products like meat, milk, eggs and cheese contributing to nutritional security; play an important role in providing export commodities such as live animals, hides and skins; provide power for cultivation, threshing, and transport; confer a certain degree of security during periods of crop failure; provide farmyard manure to improve soil fertility and also as a source of energy; and other economic and social benefits (Smith et al., 2013).
Despite the large livestock population and the available huge potential, the livestock sub-sector is confronted with a number of production and market-related challenges. Lack of improved breeds, shortage and poor quality of feed resources coupled with shortage of grazing land, poor management practices, and diseases coupled with inadequate veterinary services are among the major bottlenecks from the production side (Mekuriaw et al. 2012; Messay et al., 2013). Added to these, illegal trade activities, lack of market information, poor market infrastructure, and lack of market orientation in production process are some of the market-related challenges (Ayele et al., 2003; Gebremariam et al., 2010).
According to the national estimates, about 3.07 billion litres of cow milk and 0.23 billion litres of camel milk were produced in 2014 (CSA, 2015a). In terms of livestock product utilization, most of the dairy products were for home consumption. According to the estimates of the Central Statistical Agency of the country for the year 2014, only about 6% of the total milk production, 35.5% of butter production, and 15.2% of cheese production were sold (CSA, 2015b). Almost all the dairy products sold goes to satisfy the local demand with no report at all for export.
The low volume of sale is attributed to market-related issues in addition to the low levels of production resulting from various production constraints. Marketing of dairy products in the country is not well organized; dairy production at smallholder level is not seriously taken as a business and it is an activity that is operated haphazardly; collaboration among dairy value chain actors and market integration in general are very weak; relevant market information is not readily available; meeting the required quality and safety standards by taking into account customers’ needs is almost non-existent; tracing flow of products, information, and finance is very difficult; efforts in adding values to the product at different level is inadequate; and many more (Girma and Marco, 2014; Andualem, 2015). Added to these, dairy producers are confronted with the challenges related to selecting buyers and sellers, bargaining on price settings, forging forward and backward linkages, and handling products to meet the requirements of customers and final consumers. These problems are common throughout the country including the Eastern part of Ethiopia, focus areas of the current study.
Added to these, decisions on channel choice is among important considerations that affect the performance of actors in a given value chain. Channel choice involves understanding the ultimate users and how they prefer to sell or purchase the product. Theoretically, channel choice decisions may be affected by the characteristics related to the product (value, standardization, perishability, etc.), characteristics related to the market (number and type of buyers, buying habit, quantity bought, and size of market), characteristics related to the seller (reputation, desire to control channel, and financial strength), considerations related to government (e.g., license requirements), and others like cost, availability, and possibility of having many outlets.
Addressing the major impediments facing each segment of the dairy value chain and identifying opportunities to increase farmers’ income require generation of organized data and information that would enable the public to design appropriate policies for improving the benefits from the dairy sector. However, available studies addressing dairy value chains in general and the indicated bottlenecks in particular are very scanty in the study areas.
This study was, therefore, aimed at mapping the dairy value chain by identifying value chain actors, their roles, and linkages; assessing constraints and opportunities for the development of the dairy value chain; and identifying factors affecting channel choice decisions of smallholder
dairy producers in and around Harar and Dire Dawa milkshed areas. MATERIAL AND METHODS Description of the study areas Harar and Dire Dawa milkshed areas have two cities Harar and Dire Dawa as the major milk consumption areas and wider surrounding rural districts as a major sources of supply for milk and milk products in general. Dire Dawa city, the second largest city in Ethiopia, is located at a distance of 525 km to the east of Addis Ababa, capital of Ethiopia. The city has a total area coverage of 1213 square kilometres and a projected population of 440,000 for the year 2015 (CSA, 2013). The city is located in the lowlands at an elevation of 1276 meters above sea level and surrounded by escarpments of mountains.
Harar, a walled city in eastern Ethiopia, is a regional city for the Harari region and a zonal capital for East Hararghe zone of Oromia region. The city has a projected population of 232,000 for the year 2015 (CSA, 2013). It is located at about five hundred kilometres from Addis Ababa at an elevation of 1,885 meters above sea level.
The two cities are the major milk consumption centres in eastern Ethiopia. Supply of milk to these cities mainly come from the surrounding rural areas of Oromia regional state, except a limited supply from urban agriculture schemes in these cities. These major milk supplying districts include Babile, Meta, Haramaya, and Kersa. These areas have a mixed crop-livestock farming system where crop production being the dominant one, except Babile. Milk outputs from these districts are also supplied to the two cities, Harar and Dire Dawa, owing to their geographical proximity and relatively better access to transport facilities. Types and methods of data collection For this study, primary data were collected from different value chain actors. Semi-structured questionnaire was used to extract primary information from the value chain actors through face to face interview. It is worthwhile to indicate that, separate semi-structured questionnaires were used for the different value chain actors. Data were collected from producers, cooperatives, traders, and consumers.
In general, the collected data included household characteristics like include age, family size, educational status, dependency ratio, and others; farm characteristics like type and number of livestock owned, type and amount of inputs secured, amount of milk obtained, and others; market related information like amount of dairy products sold, dairy product handling mechanisms, buying and selling prices, buying and selling quantities, and others; and institutional variables like credit utilization, membership to cooperatives, and participation in trainings. Sampling technique and sample size Five major milk producing districts of the milkshed area were purposively selected based on milk production levels and their participation in market for sale of milk. These districts, were Babile, Haramaya, Harar, Meta, and Kersa.
Dire Dawa city was also included in consumers’ survey. The information obtained from the Districts’ bureau of agriculture were used to identify major dairy producing kebeles, the smallest administrative units. Generally, data were collected from a total of 93 producers, six collectors, seven wholesalers, seven retailers, and ten consumers. Methods of data analysis Both descriptive and econometric tools were used to analyse the collected data. Descriptive statistical tools were used to explain the socio-economic characteristics of value chain actors, milk value chain map, value chain constraints and opportunities. Multinomial Logistic Model (MNL) was used to identify the determinants of dairy farmers’ market channel choice decisions.
MNL model was used to explain the inter-household variation in the choice of specific marketing channel. MNL model was used because it is the standard method for estimating unordered, multi category dependent variables. It also assumes independence across the choices. In this study, milk producers (farmers) had four choices for selling their milk. They sell their milk to wholesalers, collectors, retailers or directly to consumers. Among these choices, selling to collectors was taken as a base category against which other channels are going to be compared, just to simplify explanations.
Since channel is a discrete choice, the multinomial logit model in which the decision-maker (producer) chooses between mutually exclusive and unranked alternatives (the four marketing channels) is appropriate. MNL assumes that producer’s decision is made based on the utility it derives from selecting a given channel as compared to the other. Since each channel entails different costs and benefits to the producer, the utility derived from these channels differ.
Suppose that the utility to a household of alternative j is Uij, where j = 0, 1, 2,… J. From the producer’s perspective, the best alternative is simply the one that maximizes utility. That means, household i will choose channel j if and only if Uij > Uik for k≠ j.
It is important to note that the indicated utility cannot be observed in practice and what a researcher can observe is the factors influencing the utility (Xi’s) such as household and personal characteristics and attributes of the choice set experienced by the respondent. Based on McFadden (1978), a household’s utility function from using alternative J can then be expressed in terms of indirect utility and random error terms. Following this, if utility from alternative j is better than that from alternative k (Eq. 1).
∀
∀ (1) The probability that a producer chooses alternative channel, therefore, can be expressed by a MNL model (Eq.2).
exp
∑ exp (2)
Where,
is a vector of the predictor (explanatory) variables for the respondent facing alternative
is a vector of the estimated parameter associated with alternative
Following equation 2, we can adapt the MNL model fitting to this study as follow in Eq. 3.
Exp
∑ Exp (3)
Where: represents the producer, and 1, 2, 3, … 93. represents different marketing channel, 0for sale to
collectors, 1 for sale to wholesalers, 2 for sale to retailers, and 3 for sale to consumers. Here, selling for collectors is selected as a base category.
represents the probability of milk marketing channel to be chosen by the producer
means that milk marketing channel is chosen by the producer , and
represent independent variables. The MNL model predicts the relative probability that
producers would choose one of the marketing channels based on the nature of the explanatory variables. Explanatory variables included in this study are indicated in Table 1. RESULTS AND DISCUSSION Profile of major value chain actors Six value chain actors were identified in Harar and Dire Dawa Milk shed areas. These are input suppliers, producers, collectors, wholesalers, retailers, and consumers. Brief profiles of these actors are presented in the next sub-sections. Household and socioeconomic characteristics of producers Demographic characteristics of the producers The actual dairy farming activities, which include feeding, cleaning barns, milking, and selling milk and milk products are mainly performed by female members of households in Harar and Dire Dawa milkshed areas. As far as marital status of producers was concerned, around 95% of them were married while the remaining 5% are single (Table 2). About 72% of the producers were illiterate while the remaining 28% were literate. Education improves the ability of searching and processing information leading to a tendency of adopting improved dairy technologies. In this line, a lot has to be done to improve the educational status of the dairy farming community to enable them to make an informed farm decisions. In terms of location, 71% of producers operate in rural areas while 29% are in urban areas. The mean age of producers in the two milk shed areas was found to be 36 years.
Table 1. Description of Explanatory Variables in Multinomial Logit Model
S.N Explanatory variables
Description
1 Area dummy It is about whether dairy production is undertaken in rural areas or urban areas. It is measured as dummy taking a value of 1 for rural area and 0 for urban area.
2 Age Age of the household head measured in years
3 Family size Family size of the household measured in number
4 Education status
Education status of the household head taking a value of 1 for literate and 0 for illiterate.
5 Breed type It is breed types of cows owned by the household. It takes a value of 1 for exotic and 0 for local.
6 No. of cows Number of cows owned by the household.
7 Milking place It is about whether a household has separate milking place or not. It takes a value of 1 if yes and 0 if no.
8 Time after milking
This is a measure of how long the milk stays with the household before selling. It is measured in hours.
9 Way of transporting
Dummy variable about whether the producer transport milk collectively (taking a value of 1) or individually (a value of 0).
10 Other products Whether the household produce milk products other than raw milk, taking a value of 1 if yes and a value of 0 if no.
11 Hay supplement
It is about whether the household gives hay supplements to dairy cows in addition to green fodder. It takes a value of 1 if yes and 0 if no.
Producers access to inputs, training and support services: About 92.5% of all the dairy cows owned by farmers are local breeds while only 7.5% are either exotic or crossbreds. This is actually in line with the national trend where about 98.7% of all the cattle population in the country are local breeds (CSA, 2015a). The implication is that milk production in the area is very low owing to the fact that local breeds have very low milk productivity. There are problems related to milking places and drainage systems that might have affected the quality of milk produced and delivered to the next buyer in the value chain. Another study in the area on milk quality indicated a high microbial load in milk supplied from those areas (Estifanos et al., 2015). Only 40% of the producers had a separate milking place and 18% of them had a properly functioning drainage system for their dairy farm (Table 2). Limited access to training on dairy production and milk hygiene and limited access to credit were mentioned by producers as major problems in the two milkshed areas. Only 4.3% of the producers have attended training on dairy production and 3.2% of them on milk hygiene. When expressed in percentage terms, the share of each of the trainings was less than 8%. As a result, milk product quality and safety is a major concern in the areas
(Estifanos et al., 2015). Besides, less than 5% of the producers have accessed credit services. This implies that provision of credit to the dairy producers requires due attention as it would enable them to acquire necessary infrastructures like improved storage and transport facilities. Producers’ perception on benefits: Producers were asked to indicate the actor or actors benefiting most from the milk value chain in the two milkeshed areas. About 38% of the producers perceived that wholesalers are most benefiting actors while about 32% of them indicated that producers are most benefiting. Small proportions (14%) of producers believed that collectors are most benefiting. This implied that the maximum benefits might go to the wholesalers while the minimum is to the collectors, among all milk value chain actors in the area (Table 2). This implies the need to support producers and other actors for a fair distribution of benefits. This could be done, among others, by organizing producers in to cooperatives for boosting their bargaining power, fostering viable linkages among the actors for their mutual benefits (Bardhan et al., 2012), and putting in place a system that makes unfair interferers legally accountable. Table 2. Descriptive values of some variables at producers’ level
Variables Proportion of producers (%)
Marital status Single 5.4 Married 94.6
Education Illiterate 72.0 Literate 28.0
Residence Rural 71 Urban 29
Breed types of dairy cattle
Exotic or hybrid 7.5 Local 92.5
Have separate milking space 39.8 Have functioning drainage system 18.3 Attended training on milk production 4.3 Attended training on hygiene 3.2 Producers accessing credit 3.2 Producers perceiving that they benefit most 32.3 Producers perceiving collectors benefit most
14
Producers perceiving wholesalers benefit most
37.6
Producers perceiving retailers benefit most 16.1 Brief profile of other value chain actors Most of the collectors, wholesalers, and retailers were females implying their high involvement in dairy value chain in the study area. As far as their marital status was concerned, 83% of them were married and 17% were single. Almost all of the wholesalers, retailers, and consumers were based in urban areas. In contrast, all the collectors were based in rural areas. Milk is sold at small markets to collectors in rural areas and transported by donkeys to urban areas. Milk value chain mapping Milk value chain in Harar and Dire Dawa milkshed areas looks like the one depicted in Figure 1.
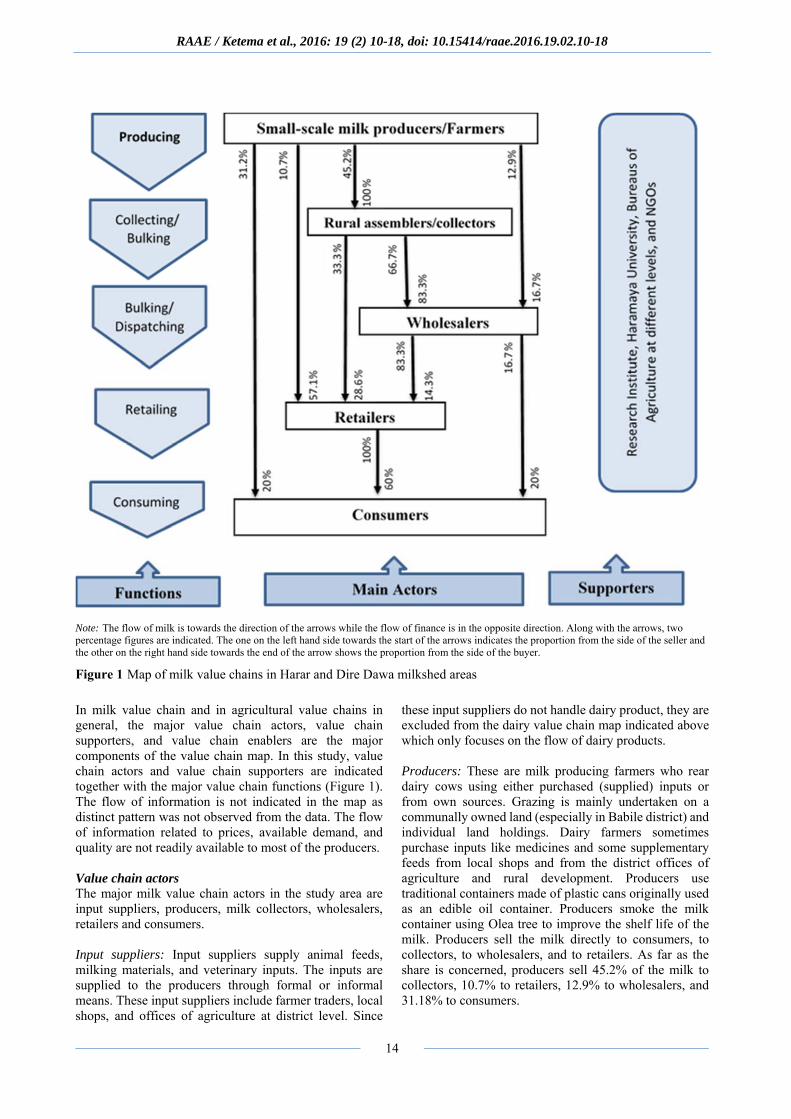
Note: The flow of milk is towards the direction of the arrows while the flow of finance is in the opposite direction. Along with the arrows, two percentage figures are indicated. The one on the left hand side towards the start of the arrows indicates the proportion from the side of the seller and the other on the right hand side towards the end of the arrow shows the proportion from the side of the buyer.
Figure 1 Map of milk value chains in Harar and Dire Dawa milkshed areas
In milk value chain and in agricultural value chains in general, the major value chain actors, value chain supporters, and value chain enablers are the major components of the value chain map. In this study, value chain actors and value chain supporters are indicated together with the major value chain functions (Figure 1). The flow of information is not indicated in the map as distinct pattern was not observed from the data. The flow of information related to prices, available demand, and quality are not readily available to most of the producers. Value chain actors The major milk value chain actors in the study area are input suppliers, producers, milk collectors, wholesalers, retailers and consumers. Input suppliers: Input suppliers supply animal feeds, milking materials, and veterinary inputs. The inputs are supplied to the producers through formal or informal means. These input suppliers include farmer traders, local shops, and offices of agriculture at district level. Since
these input suppliers do not handle dairy product, they are excluded from the dairy value chain map indicated above which only focuses on the flow of dairy products. Producers: These are milk producing farmers who rear dairy cows using either purchased (supplied) inputs or from own sources. Grazing is mainly undertaken on a communally owned land (especially in Babile district) and individual land holdings. Dairy farmers sometimes purchase inputs like medicines and some supplementary feeds from local shops and from the district offices of agriculture and rural development. Producers use traditional containers made of plastic cans originally used as an edible oil container. Producers smoke the milk container using Olea tree to improve the shelf life of the milk. Producers sell the milk directly to consumers, to collectors, to wholesalers, and to retailers. As far as the share is concerned, producers sell 45.2% of the milk to collectors, 10.7% to retailers, 12.9% to wholesalers, and 31.18% to consumers.
Collectors: Collectors perform the function of assembling/collecting milk supplied in small amounts by large number of producers and bulk it to increase the volume that they supply to wholesalers and retailers. Collectors collect milk from producers only (100%). They sell 67% of the milk to wholesalers and the remaining 33% to retailers. Collectors do not have milk storage facilities but transport the milk to a distant urban area using donkeys and cars for hours. Wholesalers: Wholesalers bulk milk they obtain from many collectors and producers and bulk them for further dispatching of the product to retailers. They obtain the largest milk share (83.3%) from collectors and the remaining 16.7% from dairy farmers. At the point of collecting the milk, wholesalers boil the milk by using aluminium pots to further increase the shelf life of the milk. They then sell the milk mainly to retailers (83.3%) and to consumers (16.7%). Though the product is highly perishable, wholesalers do not have proper storage and transport facilities. Retailers: Retailers buy milk from dairy farmers, collectors, and wholesalers to resale it to consumers. Of the total milk they obtain, 57.1% is from producers while 28.6% and 14.3% are from collectors and wholesalers, respectively. They sell the product to different consumers usually in small amounts. Consumers: Milk consumers obtain milk from dairy farmers (20%), retailers (60%), and wholesalers (20%). The largest share is obtained from retailers as they are accessible to consumers in different locations where producers and wholesalers cannot be accessed. Constraints and opportunities of the milk value chain Dairy producing farmers in the study areas practice traditional production system mostly characterized by poor genetic makeup of the cattle, limited amount of supplemental feed, absence of housing for cattle, and substandard milking and milk handling practices. Furthermore, prevalence of different diseases, shortage of feed especially during the dry season, limited extension services focusing on cattle breeds and production practices, lack of modern milk handling facilities, limited credit facility, inadequate awareness on milk quality and hygienic requirements, and information barriers are among the major constraints of dairy production in the study areas. Similar challenges and constraints were indicated by Seifu and Doluschitz (2014) as potential limiting factors for the dairy development in Dire Dawa Town.
On the other hand, high demand for milk and milk products at the destination market owing to the proximity of big regional cities like Dire Dawa and Harar, availability of actors in the milk value chain though not well structured, better road infrastructure, and relatively better focus given by the government structures including agricultural offices, cooperative promotion offices, and credit institutions, employment opportunities and
diversification of family business are identified as major opportunities for improving the dairy business in the area. Channel choice decisions: econometric results Multinomial logit model was applied to assess factors affecting channel choice decisions of milk producers. Econometric model output from the multinomial logit model is indicated in Table 3 below. In order to take care of heteroscedasticity problem, robust standard errors were computed using ‘robust’ command of STATA. Likewise, multicollinearity problem was assessed using variance inflation factor (VIF) and it depicts that there is no severe multicollinearity problem.
There are four major channels available for milk producers to sell their milk products. These include selling to collectors, to wholesalers, to retailers, and to consumers. For simplifying discussions, selling to collectors is considered as a base category against which the other channels are compared. A number of variables have been found to affect channel choice decisions of producers.
Results for area dummy indicated the preference of urban producers to sell their product to wholesalers, retailers and consumers as compared to selling it to collectors. Producers’ location, in rural and remote areas, decreased the probability of selling to wholesalers, retailers and consumers by 14.5%, 8.9%, and 36.5%, respectively. This is related to the proximity of these producers to the indicated actors. In other words, rural producers prefer selling to collectors as compared to selling their product to the other actors as they have less access to these better-price paying actors. This indicates that rural producers have limited access to alternative market channels like selling to consumers, retailers, and wholesalers. This result is in line with a study undertaken in Kenya where producers in close proximity to Nairobi city were less likely to sale to the dairy cooperatives in rural areas (Mburu et al., 2007). Another study in India also indicated that producers in plain area are more likely to sell their milk to consumers as compared to those in the hill areas because of the indicated reasons (Bardhan et al., 2012).
Education of the household head is found to be positively and significantly related to the choice of wholesalers’ channel at 10% significance level. This means more educated households prefer wholesalers to collectors as their milk buyers, mainly because they have better awareness of getting premium prices from wholesalers as compared to that from collectors. The prices offered by collectors are found to be less than that by wholesalers. As the level of education of the household head increases, the likelihood of the producers to sell milk to wholesalers increases by 12.8%. This result is supported by a study on channel choice of livestock sale where educated farmers preferred selling to an actor that offered better prices (Mamo and Degnet, 2012) as the choice of a marketing channel by dairy farmers heavily depended on the price offered by that channel (Tsougiannis et al., 2008). Educated producers preferred selling to an actor that offered better prices due to the fact that education increases the ability of farmers to gather and analyse relevant market information.
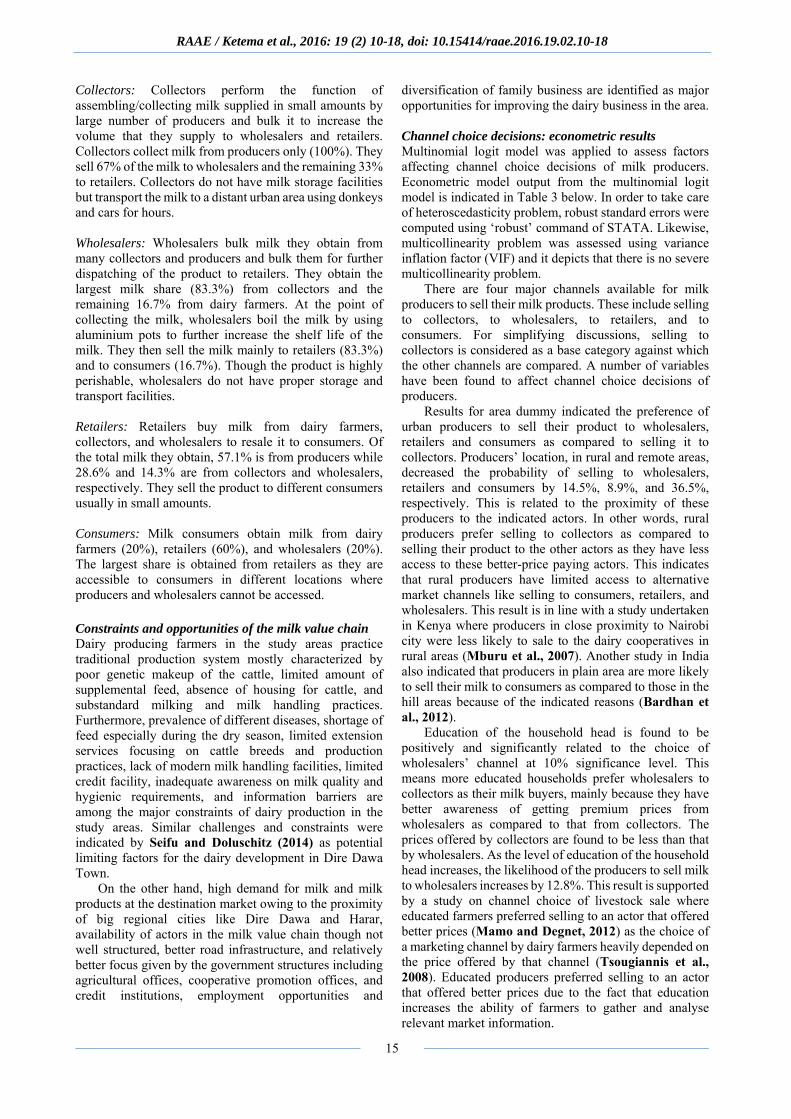
Table 3. Regression outputs of MNL model for milk marketing channel choice decisions Variables Wholesalers Retailers Consumers
Coef (s.e) ME Coef (s.e) ME Coef (s.e) ME Constant 3.971
(3.785) - 6.288**
(2.694) - 1.979
(1.747) -
Area dummy -4.528*** (1.653)
-0.145*** (.046)
-4.476** (1.911)
-0.089 (0.059)
-4.511*** (1.671)
-0.365*** (0.107)
Age 0.049 (0.061)
0.002 (0.004)
0.015 (0.046)
-0.001 (0.002)
0.050 (0.038)
0.005 (0.005)
Family size -0.063 (0.173)
-0.001 (0.012)
-0.324 (0.209)
-0.023 (0.011)
0.021 (0.192)
0.016 (0.024)
Level of education 1.543* (.920)
0.128** (0.064)
-0.562 (0.747)
-0.078 (0.052)
0.354 (0.782)
0.016 (0.103)
Breed type -11.799*** (1.454)
-1.186*** (0.301)
3.749** (1.601)
0.357*** (0.126)
3.172* (1.755)
0.786*** (0.244)
No. of cows -0.986 (0.897)
-0.077 (0.073)
0.039 (.068)
0.026 (0.019)
-0.204 (0.265)
0.003 (0.047)
Milking place -2.574** (1.231)
-0.067 (0.085)
-3.864*** (1.350)
-0.152* (0.088)
-2.367*** (0.846)
-0.131 (0.098)
Time after milking -0.241 (0.246)
-0.021 (0.020)
-0.390 (0.257)
-0.031 (0.017)
0.213** (0.103)
0.054*** (0.015)
Ways of transporting -0.161 (1.389)
-0.052 (0.120)
0.149 (1.350)
-0.020 (0.094)
0.975 (0.659)
0.149 (0.096)
Other milk products -0.246 (1.021)
0.033 (0.082)
-0.670 (0.755)
-0.002 (0.054)
-1.185 (0.935)
-0.148 (0.117)
Hay supplement -1.569* (0.872)
-0.041 (0.062)
-2.723** (1.346)
-0.125 (0.079)
-1.267* (.670)
-0.041 (0.095)
Note: Numbers in brackets indicate robust standard error, ***,**, and * indicate significance levels at 1, 5, and 10% , respectively; Coef. is for regression coefficients; s.e is for standard errors; and ME is for marginal effects.
Producers who own exotic breeds have better likelihood of selling to collectors than to wholesalers, and better likelihood of selling to retailers and consumers than to collectors. Ownership of exotic livestock breed influenced the choice to sell milk to wholesalers negatively and significantly at 1% significance level as compared to selling to collectors. In contrast, it increased the choice to sell milk to retailers and consumers positively and significantly at 5% and 10% significance levels, respectively. As producers own exotic dairy cattle, their probability of selling milk to retailers and consumers increases by 35.7% and 78.6%, respectively. Those farmers owning exotic dairy cattle breed are located in urban areas of Harar and Dire Dawa town and they sell the milk either to retailers or consumers fetching relatively better prices owing to their proximity to market.
Milking place was found to affect the choices of wholesalers, retailers, and consumers channels negatively and significantly in reference to the base category of selling to collectors. This implies dairy farmers that have separate milking place have better likelihood of selling milk to collectors than to wholesalers, retailers, or consumers. Availability of separate milking place reduced the probability of selling milk to retailers and to consumers by 15.2% and 13.1%, respectively. The main reason is that, those who have separate milking place are usually better off producers who produce milk in relatively larger amounts. Collectors are usually interested in large supplies and hence target producers who supply in larger amounts.
Time spent after milking positively and significantly affected the choice of selling to consumers. The longer the milk stays with producers after milking the higher the likelihood of selling to consumers as compared to selling
to collectors. As the milk stays for one additional hour, the probability that the producers sell to consumers increases by 5 %. As milk stays longer, collectors are not interested to buy if for re-sale to other actors. As a result, producers sell the milk directly to consumers, and sometimes in the form of butter, cheese and other milk products.
Supplying only hay for dairy cattle was found to negatively and significantly affect the choice of wholesalers, retailers, and consumers channel at 10%, 5%, and 10% significance level, respectively, as compared to those who supplement concentrate. This implies that those who are not able to supplement with concentrate are unable to produce more milk and hence they are not able to supply for wider urban customers like wholesalers, retailers, and consumers. CONCLUSION In Harar and Dire Dawa milkshed areas, the dairy farming activity was dominated by females. Access to education among producers was limited and 72% of them were found to be illiterate. Most of the producers were located in rural areas in the two milkshed areas. Furthermore, producers have no adequate access to credit and training on topics related to milk production and hygienic requirements. As a result, dairy production and milk handling in the area are very traditional resulting into concerns related to milk product quality and safety.
Prevalence of diseases, shortage of feed, limited extension services, lack of modern milk handling facilities, limited credit facilities, inadequate awareness on milk quality and hygiene requirements,, and information barriers are among the major constraints while high demand for milk and milk products, availability of actors