39
8/6/15 Mohan Guruswamy Chaopraya 16 1
| Date post: | 15-Apr-2017 |
| Category: |
Presentations & Public Speaking |
| Upload: | avidas |
| View: | 788 times |
| Download: | 0 times |

8/6/15Mohan Guruswamy Chaopraya 16 1

8/6/15Mohan Guruswamy Chaopraya 16 2
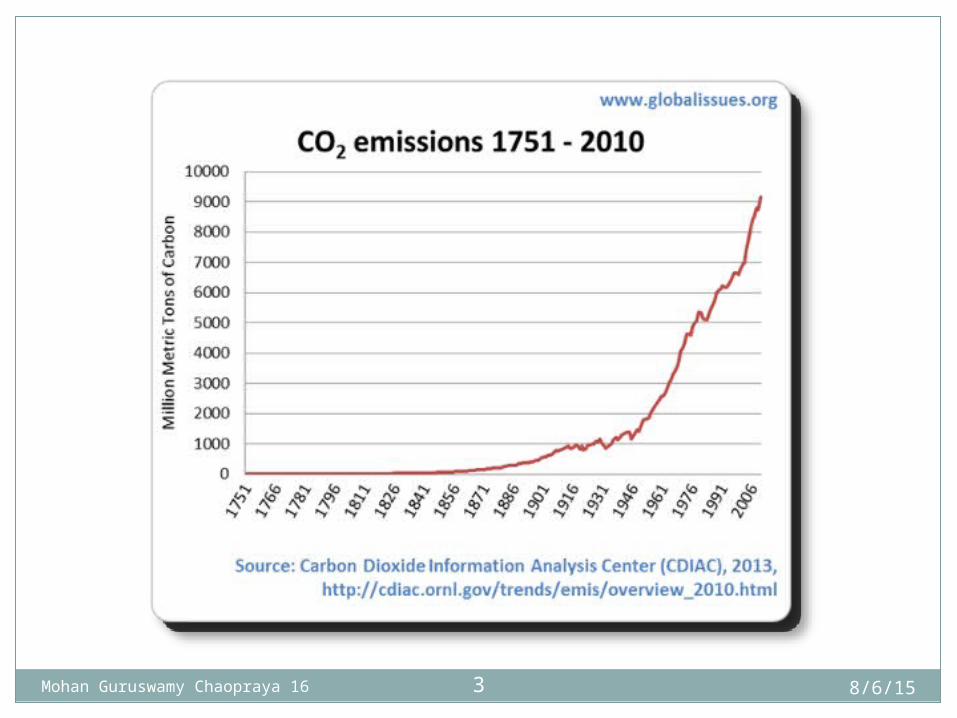
8/6/15Mohan Guruswamy Chaopraya 16 3

8/6/15Mohan Guruswamy Chaopraya 16 4
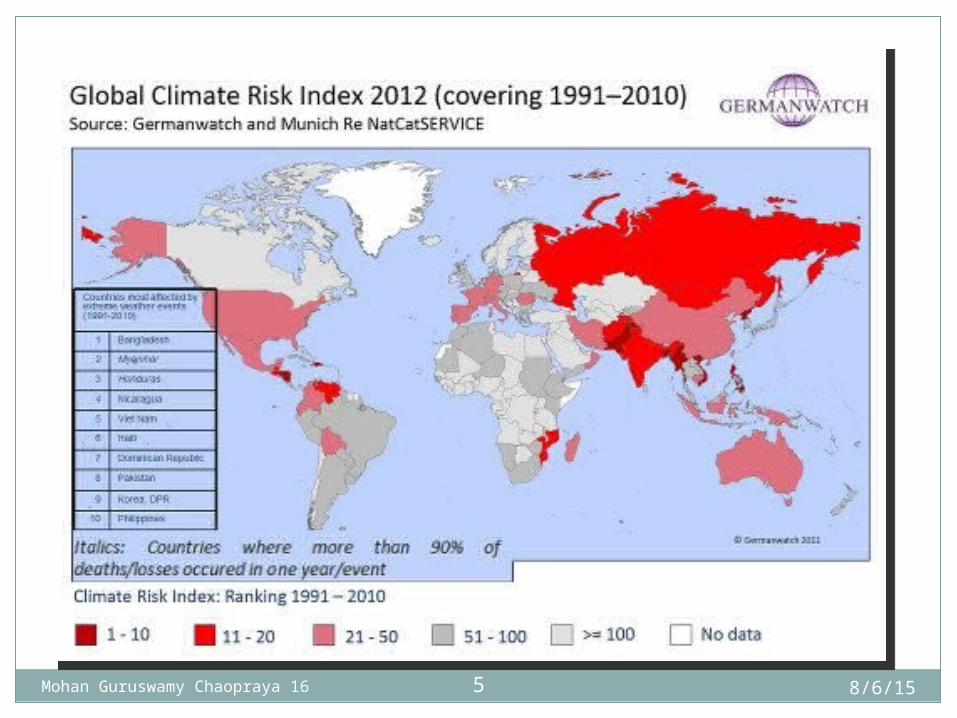
8/6/15Mohan Guruswamy Chaopraya 16 5
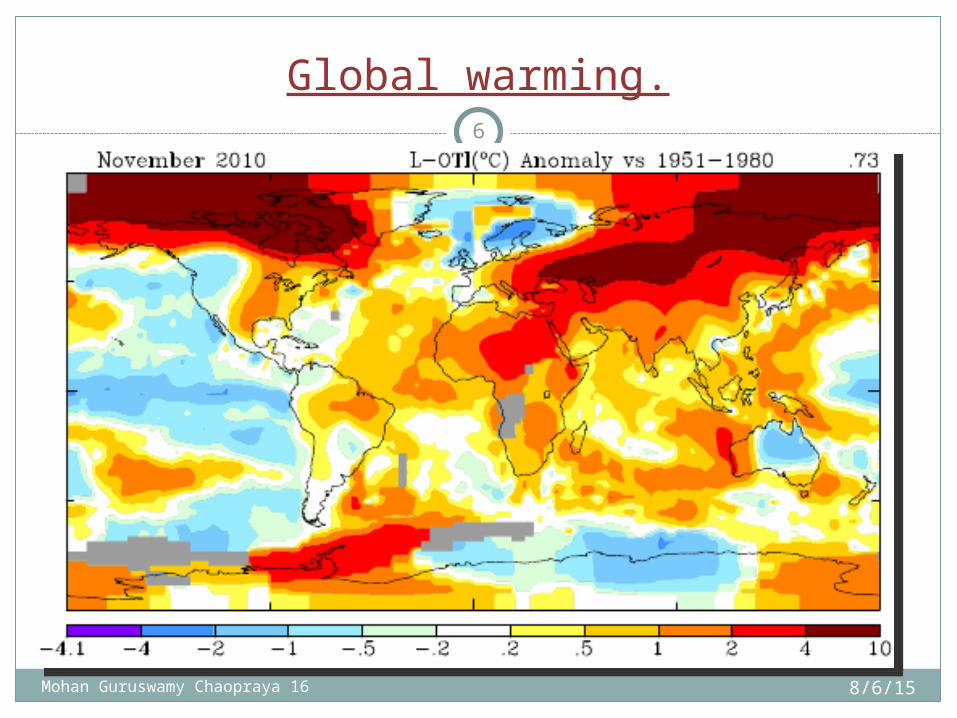
Global warming.
8/6/15Mohan Guruswamy Chaopraya 16
6

GDP growth rates of China, India and Pakistan 2000-2010.
8/6/15Mohan Guruswamy Chaopraya 16
7
8/6/15Mohan Guruswamy Chaopraya 16 8
8/6/15Mohan Guruswamy Chaopraya 16 9
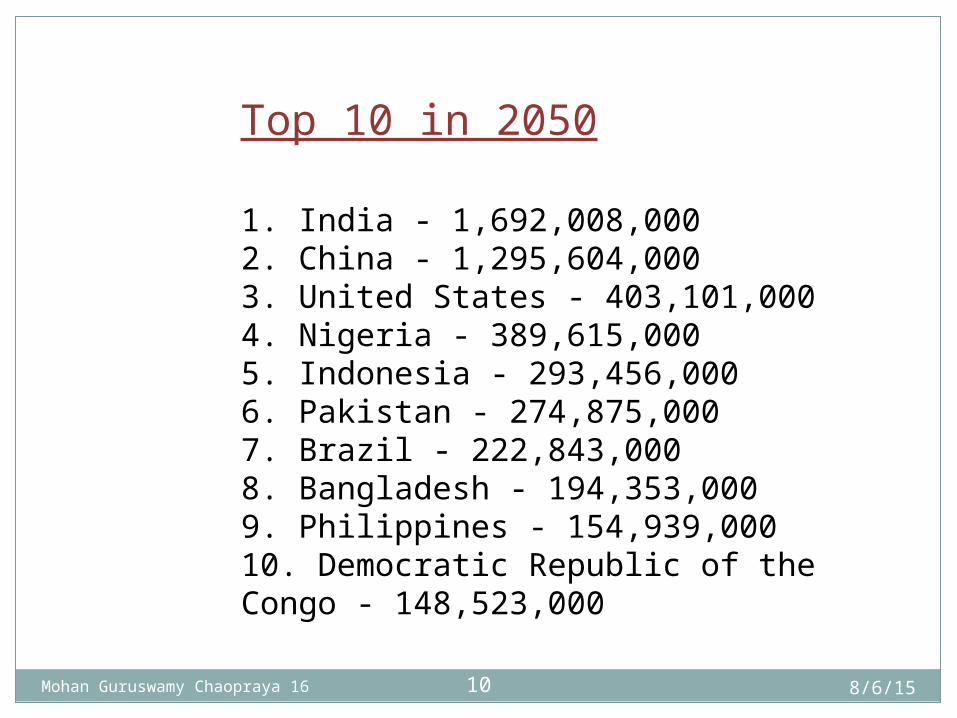
1. India - 1,692,008,0002. China - 1,295,604,0003. United States - 403,101,0004. Nigeria - 389,615,0005. Indonesia - 293,456,0006. Pakistan - 274,875,0007. Brazil - 222,843,0008. Bangladesh - 194,353,0009. Philippines - 154,939,00010. Democratic Republic of the Congo - 148,523,000
Top 10 in 2050
8/6/15Mohan Guruswamy Chaopraya 16 10

1) India - 1,550,899,0002) China - 941,042,0003) Nigeria - 729,885,0004) United States - 478,026,0005) Tanzania - 316,338,0006) Pakistan - 261,271,0007) Indonesia - 254,178,0008) DR of the Congo - 212,113,0009) Philippines - 177,803,00010) Brazil - 177,349,000
Top 10 in 2100.
8/6/15Mohan Guruswamy Chaopraya 16 11

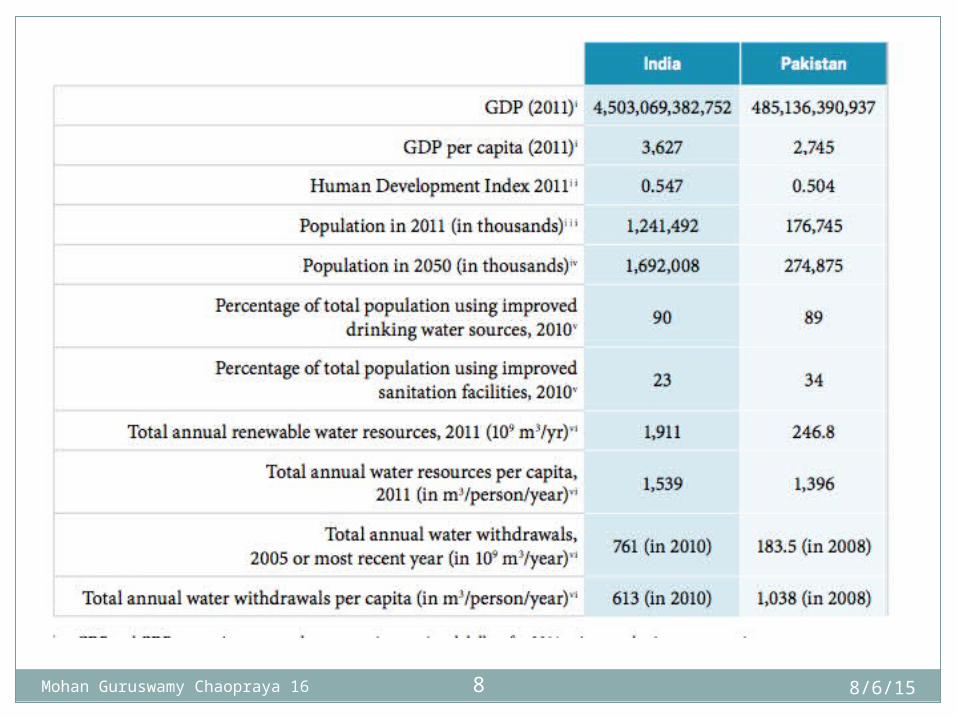
Population growth, urbanization, industrialization and increased reliance on irrigated agriculture have steadily increased regional demand for water.
These trends are only expected to accelerate in coming decades. In addition, as climate change alters weather patterns and shrinks glaciers, the quantity of water in these river systems is expected to become increasingly erratic, leading to a higher frequency of severe floods and droughts.
In the long-term, experts predict, the quantity of water in these river systems will decrease, especially in the Indus River system.
The combination of these two trends—increasing demand plus decreasing supply and access— is likely to exacerbate disputes over regional water resources.
The South Asia scenario.
8/6/15Mohan Guruswamy Chaopraya 16
12

8/6/15Mohan Guruswamy Chaopraya 16 13
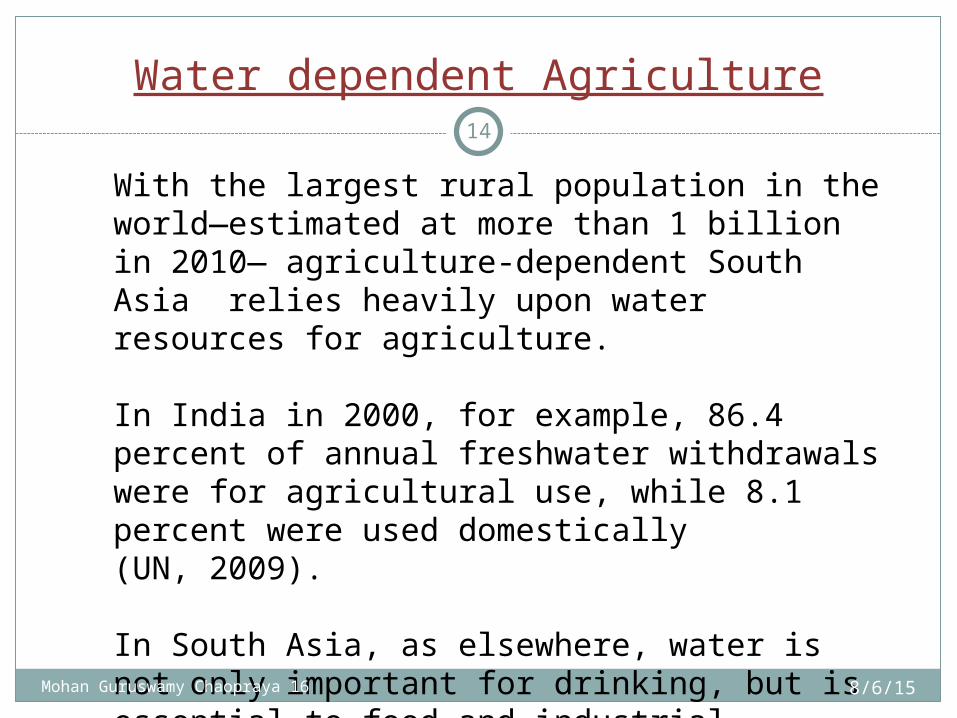
With the largest rural population in the world—estimated at more than 1 billion in 2010— agriculture-dependent South Asia relies heavily upon water resources for agriculture.
In India in 2000, for example, 86.4 percent of annual freshwater withdrawals were for agricultural use, while 8.1 percent were used domestically(UN, 2009).
In South Asia, as elsewhere, water is not only important for drinking, but is essential to food and industrial production.
Water dependent Agriculture
8/6/15Mohan Guruswamy Chaopraya 16
14

Agriculture constitutes 90 percent of all water use in South Asia, making it by far the most significant sector for water demand.
Agriculture is also the most important economic activity and largest employer in the region.
Approximately 68 percent of India’s workforce rely on farming, though agricultural contributions accounted for 19 percent of total gross domestic product in 2010.
According to the World Bank (2008), agriculture accounts for one-quarter of Pakistan’s gross domestic product, two-thirds of its employment and 80 percent of its exports.
The continued importance of Agriculture.
8/6/15Mohan Guruswamy Chaopraya 16
15

The developing world alone will be home to 90 percent of the 3 billion people expected to be added to the global population by 2025.
The changes in lifestyle of those living in developing countries, where rising rates of economic development will increase demand for water as diets shift from primarily grain-based to include a greater diversity of meats and vegetables, is also an important factor.
As the latest UNESCO World Water Assessment Report notes,the relevant question for contemporary water issues is often not “How much water do people drink?” but rather “How much water do people eat?”
Eating more water!
8/6/15Mohan Guruswamy Chaopraya 16
16
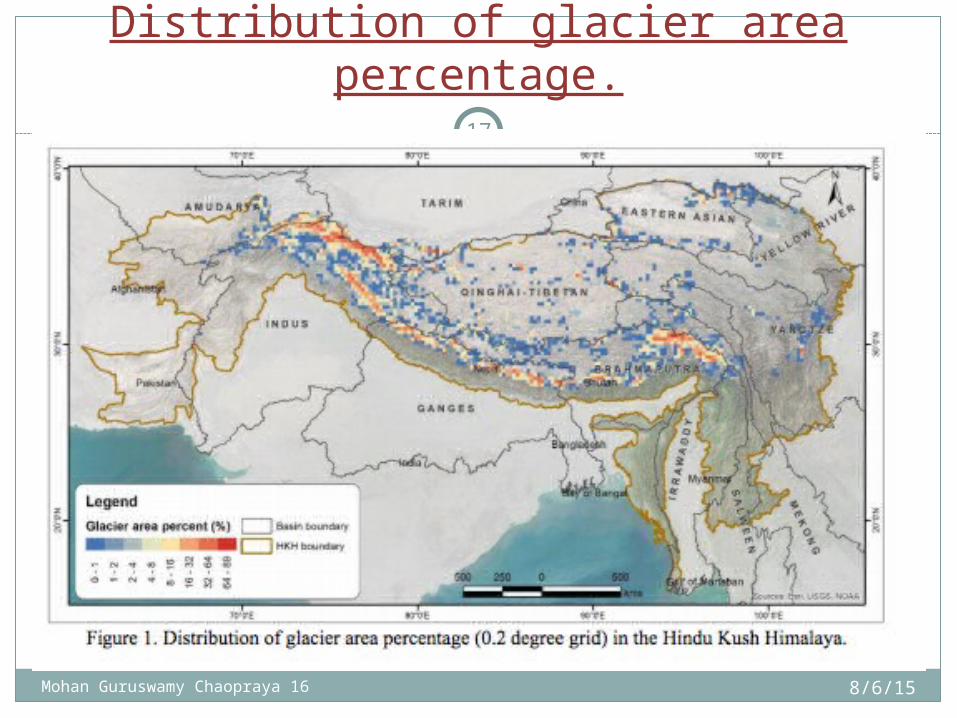
Distribution of glacier area percentage.
8/6/15Mohan Guruswamy Chaopraya 16
17

Snow leopard range.
8/6/15Mohan Guruswamy Chaopraya 16
18
8/6/15Mohan Guruswamy Chaopraya 16 19
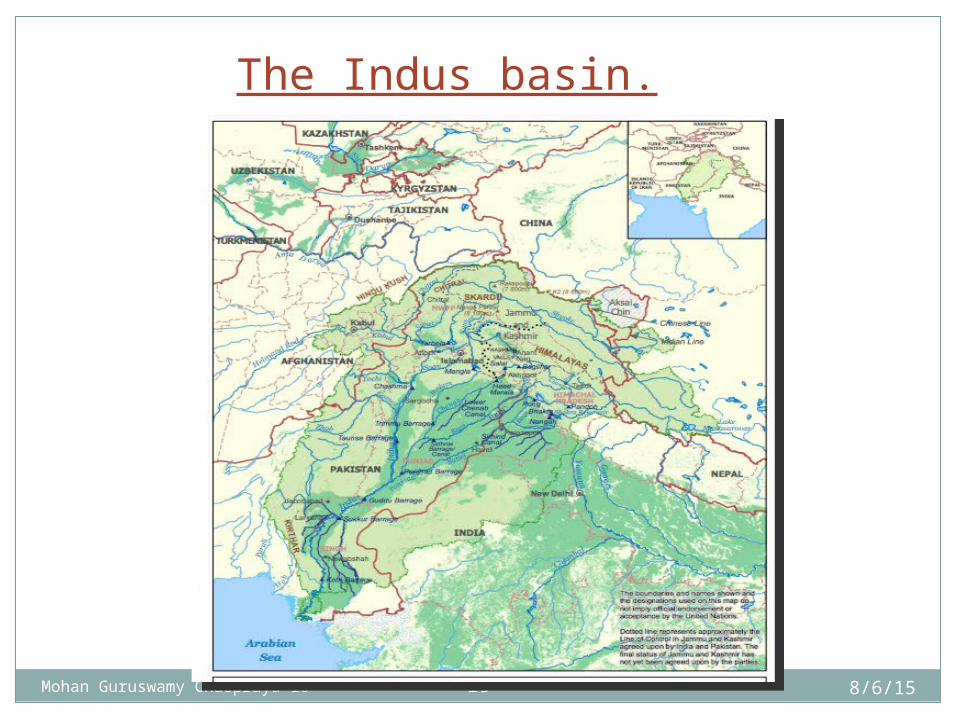
The Indus basin.
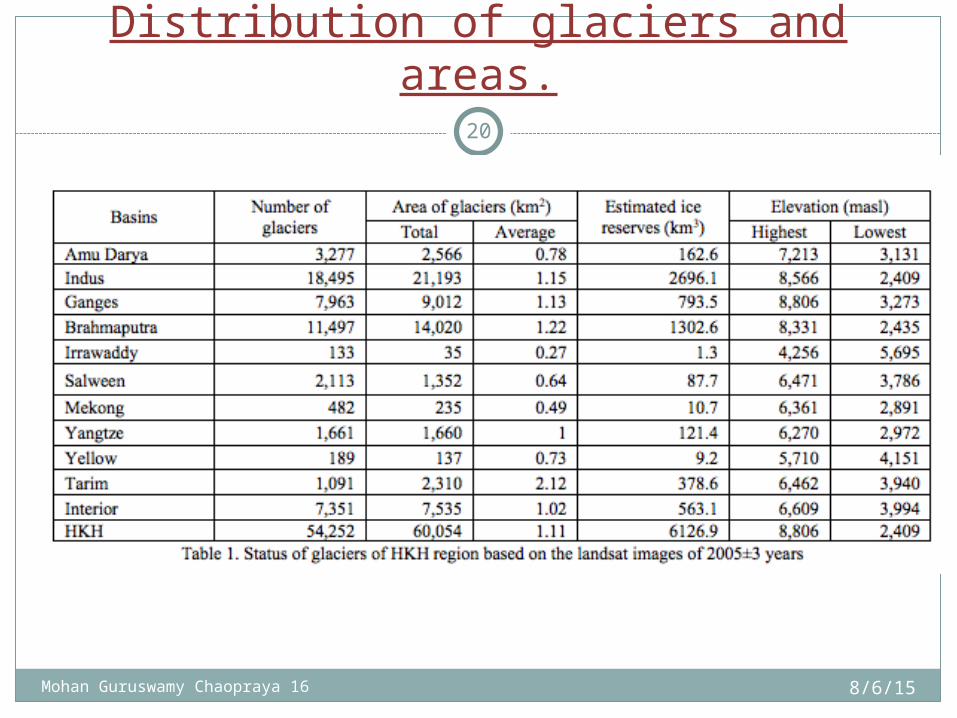
Distribution of glaciers and areas.
8/6/15Mohan Guruswamy Chaopraya 16
20

The glacial waters of the Himalayas feed South Asia’s major river systems.
The accelerating retreat of these glaciers as a direct result of global warming has already had troubling consequences for the region. These consequences are projected to worsen:
Some climate change scenarios suggest these glaciers could shrink by as much as 80 percent by 2030.
The glaciers’ retreat will increase supply in the short term, in many cases leading to flooding.
Over the long run, however, diminished glaciers will be incapable of sustaining consistent supplies to the major rivers of the region
Consequences of glacial melt.
8/6/15Mohan Guruswamy Chaopraya 16
21

Climate change is likely to limit the flow of the Indus River.
Unlike the Ganges and Brahmaputra River systems, which rely more heavily on rainfall, the Indus River system is fed primarily by glacial meltwater.
Meltwater provides approximately 70 to 80 percent of all the water in the Indus River. Global warming thus has a disproportionate impact on the amount of water entering the Indus and its tributaries.
The precise effects of climate change on the Indus River system are highly dependent on how climate change is modeled.
However, widely referenced estimates indicate a troublinglong-term trend for the flow of the Indus River.
Immediate consequences for the Indus.
8/6/15Mohan Guruswamy Chaopraya 16 22
8/6/15Mohan Guruswamy Chaopraya 16 23

8/6/15Mohan Guruswamy Chaopraya 16 24
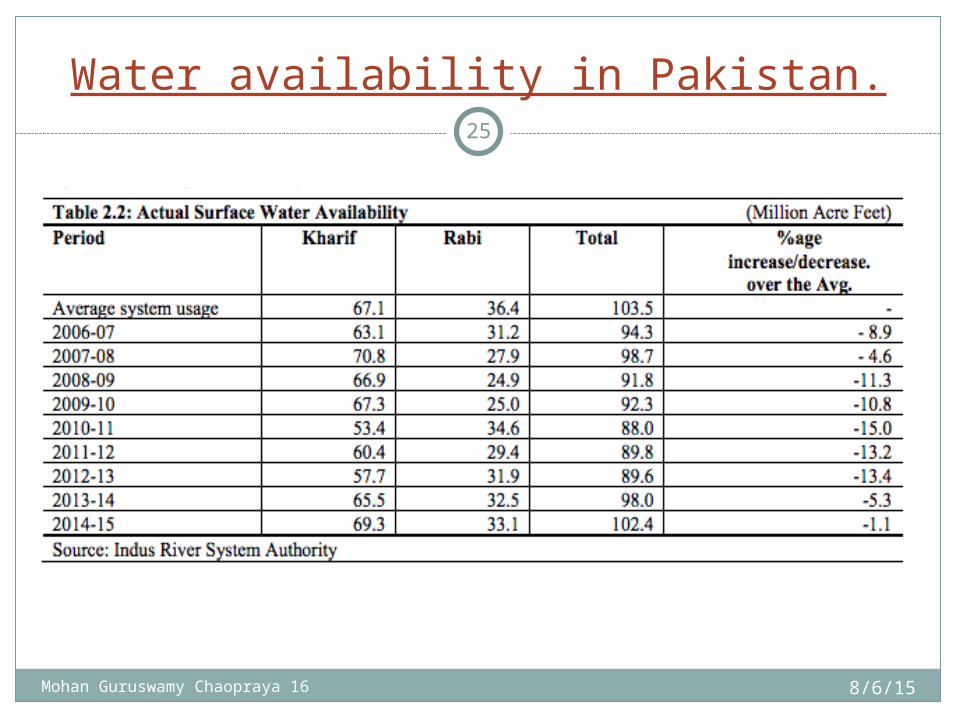
Water availability in Pakistan.
8/6/15Mohan Guruswamy Chaopraya 16
25
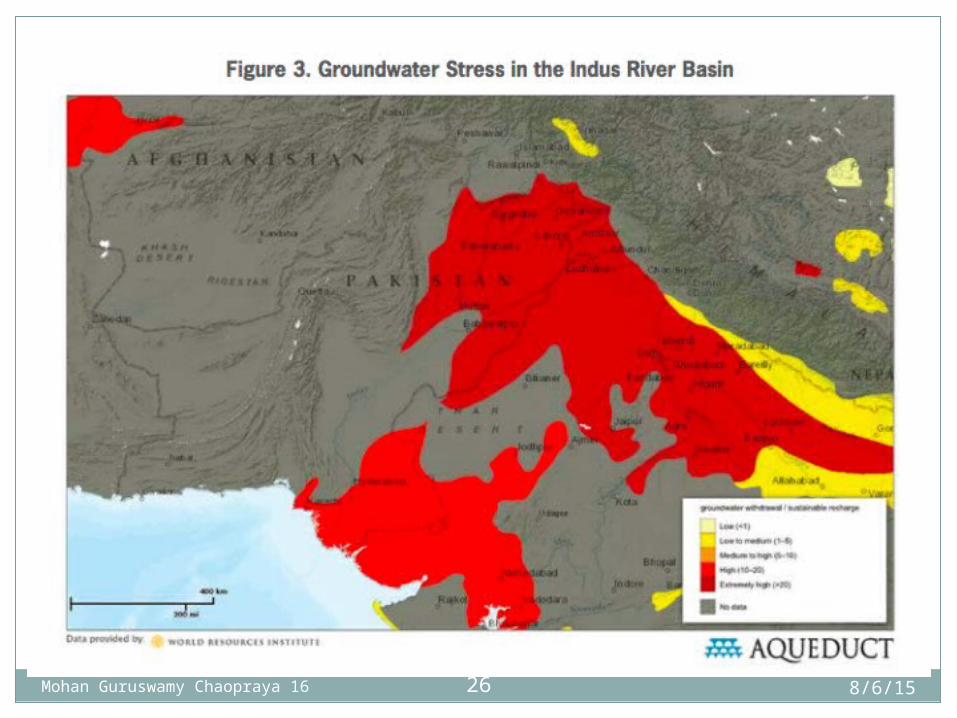
8/6/15Mohan Guruswamy Chaopraya 16 26

River water provides 80 percent of all irrigation water for Pakistan’s critical agriculture sector. These water sources are already near their limits, with most water diverted to northern Pakistan’s agricultural regions at the expense of the south. In fact, so much water is diverted from the Indus before it reaches the ocean that seawater has invaded the river channel miles inland.
Based on current projections, the Indus River system is expected to fall below 2000 flow levels between 2030 and 2050. The drop-off is estimated to be most serious between 2030 and 2040, with a new equilibrium flow of 20 percent below that of 2000 reached after 2060.
IPCC prognosis for Pakistan.
8/6/15Mohan Guruswamy Chaopraya 16
27

Demographic factors in Pakistan's problems.
8/6/15Mohan Guruswamy Chaopraya 16
Pakistan has a population growth rate of 2.13 percent, compared to 1.27 percent in India and .61 percent in China. More people are a source of prosperity only to the extent that they are engaged in productive activity. Pakistan scores poorly in that regard.
Pakistan's dependency ratio, as of 2010, was 69, compared to 56 for India and just 39 for China.
Pakistan's total fertility rate remains high, and as long as it does so, its dependency ratio will remain high as well.
28

The Importance of Agriculture in India.
8/6/15Mohan Guruswamy Chaopraya 16
Provides employment to 56.7% of the workforce of over 460 million. Work force growing by about 8 million a year now.
Provides livelihood to 56% of populationAccounts for 18% of the GDP ($ 1.142 trillion in
2007 or $205 bn.). It was 42.8% in 1980 and supported almost 60% of the population.
India’s population will stabilize around 2060 at 1.8 billion.
To support a 8-9% GDP growth, Agriculture needs to grow at 4%.
29

8/6/15Mohan Guruswamy Chaopraya 16 30
India’s Irrigated and Rainfed Areas.

% of Irrigated Acreage by Source.
Govt Private1980-81 37.32 2.17 8.22 45.70 6.591985-86 37.54 1.11 6.60 48.77 5.981990-91 35.34 1.00 6.13 51.42 6.111995-96 31.01 1.05 5.84 55.61 6.491999-00 30.66 0.78 4.73 58.76 5.08
Years
Source: Ministry of Agriculture
Other SourcesTanks Tube-wells
and wellsCanals
8/6/15Mohan Guruswamy Chaopraya 16
31
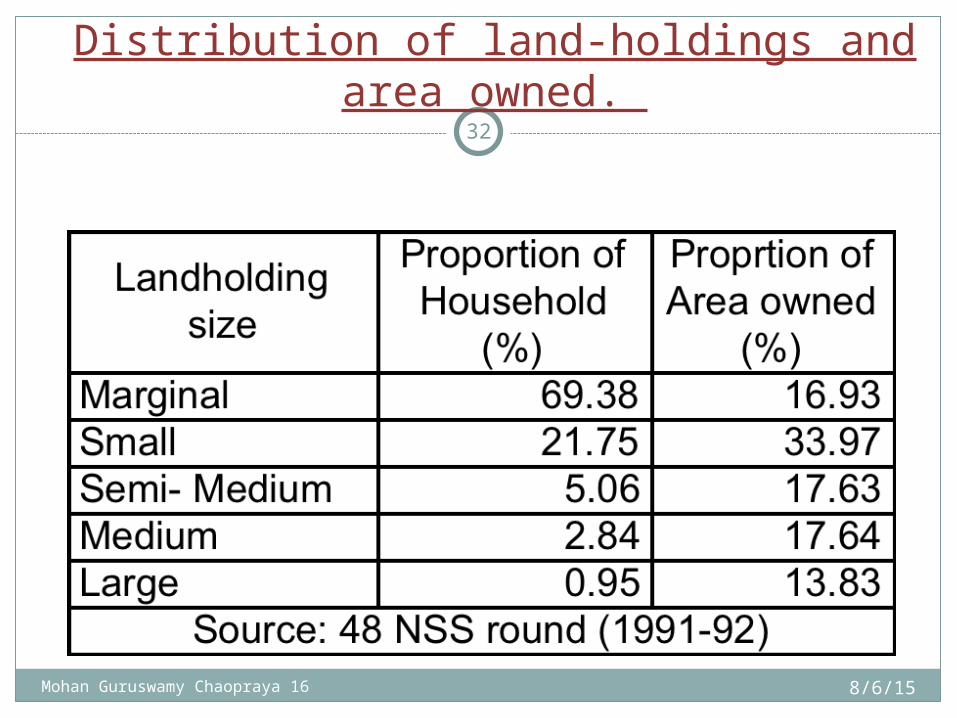
Distribution of land-holdings and area owned.
8/6/15Mohan Guruswamy Chaopraya 16
32
8/6/15Mohan Guruswamy Chaopraya 16 33
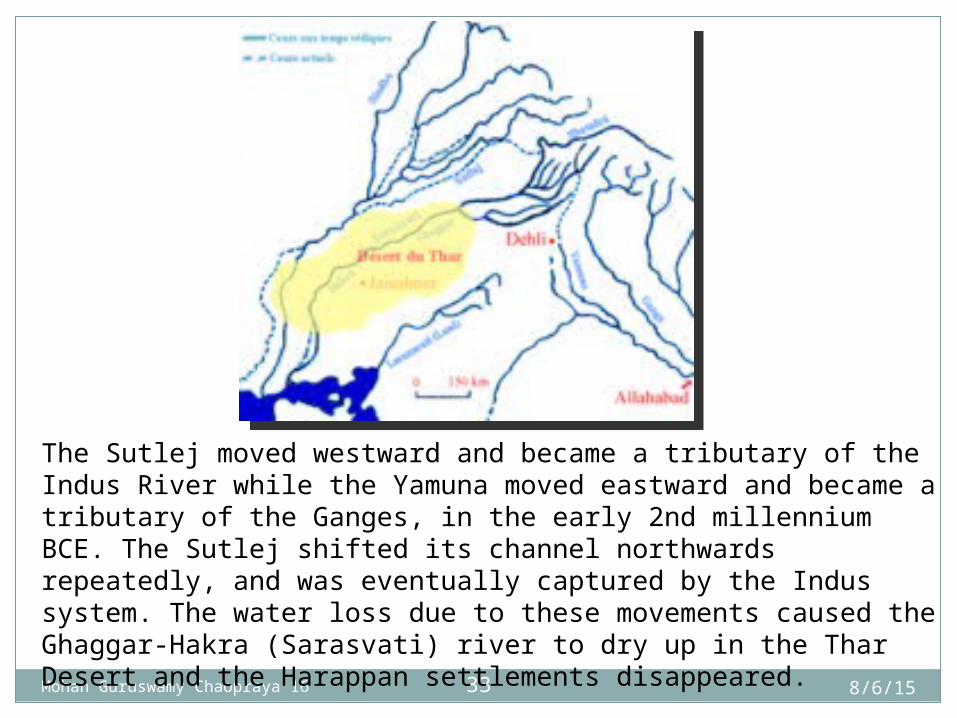
The Sutlej moved westward and became a tributary of the Indus River while the Yamuna moved eastward and became a tributary of the Ganges, in the early 2nd millennium BCE. The Sutlej shifted its channel northwards repeatedly, and was eventually captured by the Indus system. The water loss due to these movements caused the Ghaggar-Hakra (Sarasvati) river to dry up in the Thar Desert and the Harappan settlements disappeared.

8/6/15Mohan Guruswamy Chaopraya 16 34
Clearly global warning is inevitable and hence water problems in the sub-continent will get further exacerbated.
We can only hope to mitigate effects by early and meaningful co-operation.
We suffer from a knowledge deficit about the state of the glaciers and on changing monsoon patterns.
We know even less about our groundwater resources. Aquifers have no borders.
What can be done together?
Finally!

8/6/15Mohan Guruswamy Chaopraya 16 35
Thank you!
8/6/15Mohan Guruswamy Chaopraya 16 36

Cheap water.
8/6/15Mohan Guruswamy Chaopraya 16
37
Climate change is the second major driver of pressure on water supply and access.
As temperatures rise, glaciers that feed the world’s most important rivers are retreating at an accelerating rate.
Rainfall patterns are becoming more extreme, with greater rainfall during the monsoon months—leading to more frequent and severe floods in vulnerable lowlands—and less rainfall in the dry season, when it is needed most
The impact of climate change.
8/6/15Mohan Guruswamy Chaopraya 16
38

Distribution of operational holdings in India.
1970-71 1990-91 1970-71 1990-91 1970-71 1990-9135682 63389 14545 24894 0.41 0.39(50.6) (59.4) (09.0) (15.1) - -13432 20092 19282 28827 1.44 1.43(19.1) (18.8) (11.9) (17.4) - -10681 13923 29999 38375 2.81 2.76(15.2) (13.1) (18.4) (23.2) - -7932 7580 48234 44752 6.08 5.90
(11.3) (07.1) (29.8) (27.0) - -2766 1654 50064 28659 18.10 17.33
(03.9) (01.6) (30.9) (17.3) - -70493 106637 162124 165507 2.30 1.55
(100.0) (100.0) (100.0) (100.0)
Category Number ( ' 000 ) Area ( ' 000 Hectares) Average Size
Marginal (Less Than 1 Ha)Small (1.0 to 2.0 Ha)Semi-Medium (2.0 to 4.0 Ha)Medium (4.0 to 10.0 Ha)Large (10.0 ha and above )
Total
( ) : Percentage share of various categories to the total (vertical) of a particular yearSource : Fertiliser Statistics, 1999-2000, The Fertiliser Association of India
8/6/15Mohan Guruswamy Chaopraya 16
39


