Research Collection Doctoral Thesis Analysis of stress response and type III secretion system mediated biocontrol in fluorescent pseudomonads protecting plants from soil-borne diseases Author(s): Rezzonico, Fabio Publication Date: 2004 Permanent Link: https://doi.org/10.3929/ethz-a-004834694 Rights / License: In Copyright - Non-Commercial Use Permitted This page was generated automatically upon download from the ETH Zurich Research Collection . For more information please consult the Terms of use . ETH Library
Transcript
Research Collection
Doctoral Thesis
Analysis of stress response and type III secretion systemmediated biocontrol in fluorescent pseudomonads protectingplants from soil-borne diseases
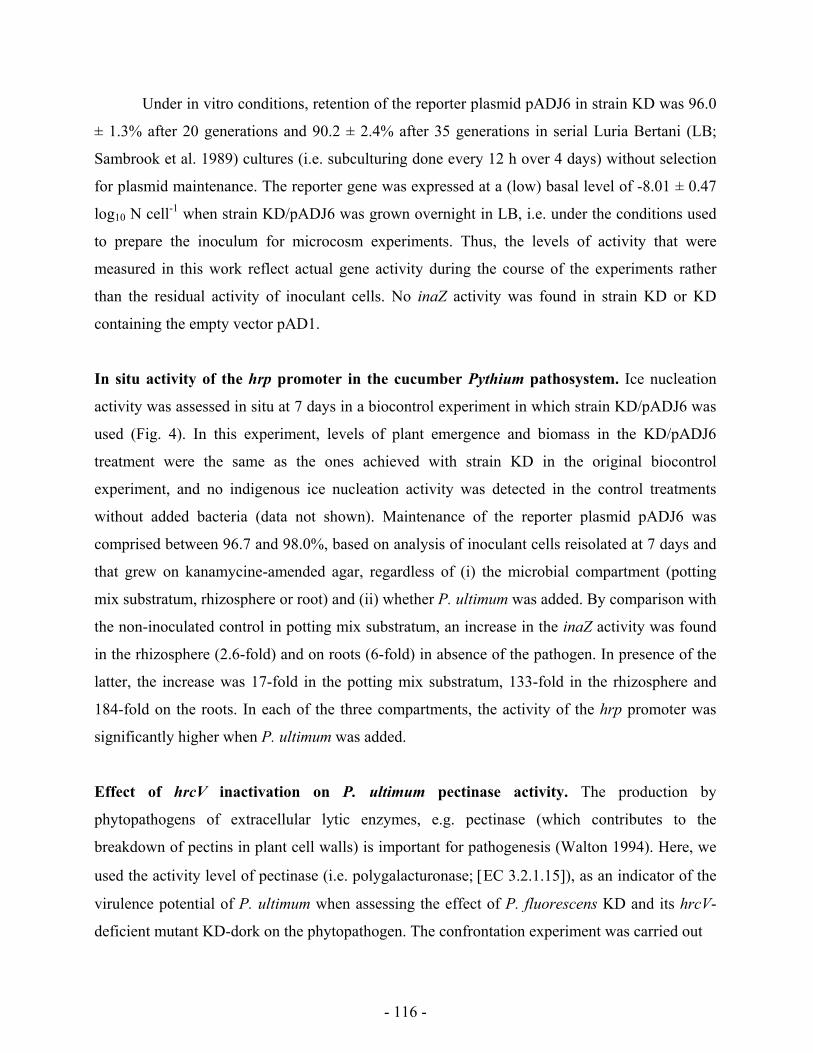
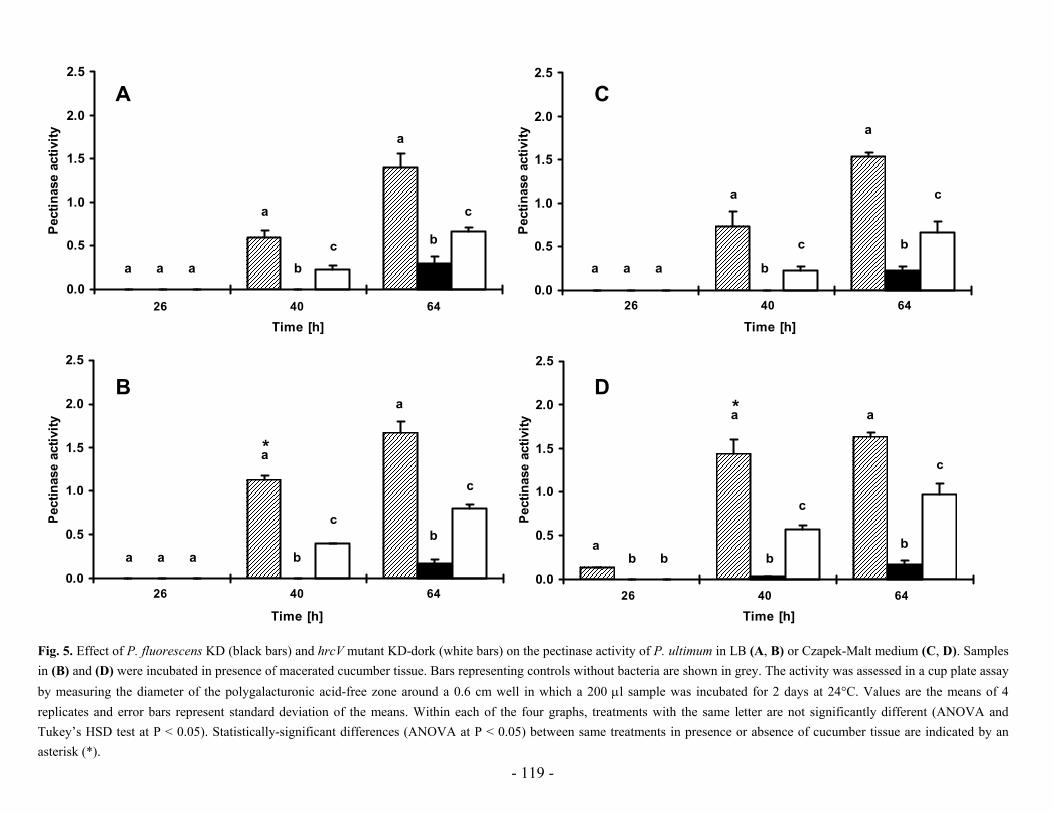
Analysis of stress response and type III secretion system
mediated biocontrol in fluorescent pseudomonads
protecting plants from soil-borne diseases
A dissertation submitted to the SWISS FEDERAL INSTITUTE OF TECHNOLOGY, ZÜRICH
For the degree of DOCTOR OF NATURAL SCIENCES
Presented by FABIO REZZONICO
Dipl. sc. nat. ETH
born February 1st, 1973
citizen of Lugano (TI)
Accepted on the recommendation of
Prof. Dr. G. Défago, referent (Zürich)
Prof. Dr. Yvan Moënne-Loccoz, co-referent (Lyon)
Prof. Dr. Bruce McDonald, co-referent (Zürich)
2004
The great tragedy of science – the slaying of a beautiful hypothesis by an ugly fact. T. H. Huxley, Biogenesis and abiogenesis (1870)
- 1 -
TABLE OF CONTENTS
ABBREVIATIONS AND SYMBOLS 3
SUMMARY 5
RIASSUNTO 7
CHAPTER 1 - GENERAL INTRODUCTION 11
CHAPTER 2 57 Effect of stress on the performance of a phlA-based quantitative competitive PCR assay
to monitor biocontrol Pseudomonas fluorescens CHA0
CHAPTER 3 73 Comparison of ATPase-encoding type III secretion system gene hrcN in biocontrol
fluorescent pseudomonads and phytopathogenic proteobacteria
CHAPTER 4 107 Evolutionary recycling of phytopathology-related type III secretion system gene(s) leads
to development of beneficial plant-microbe interaction
CHAPTER 5 - GENERAL DISCUSSION 133
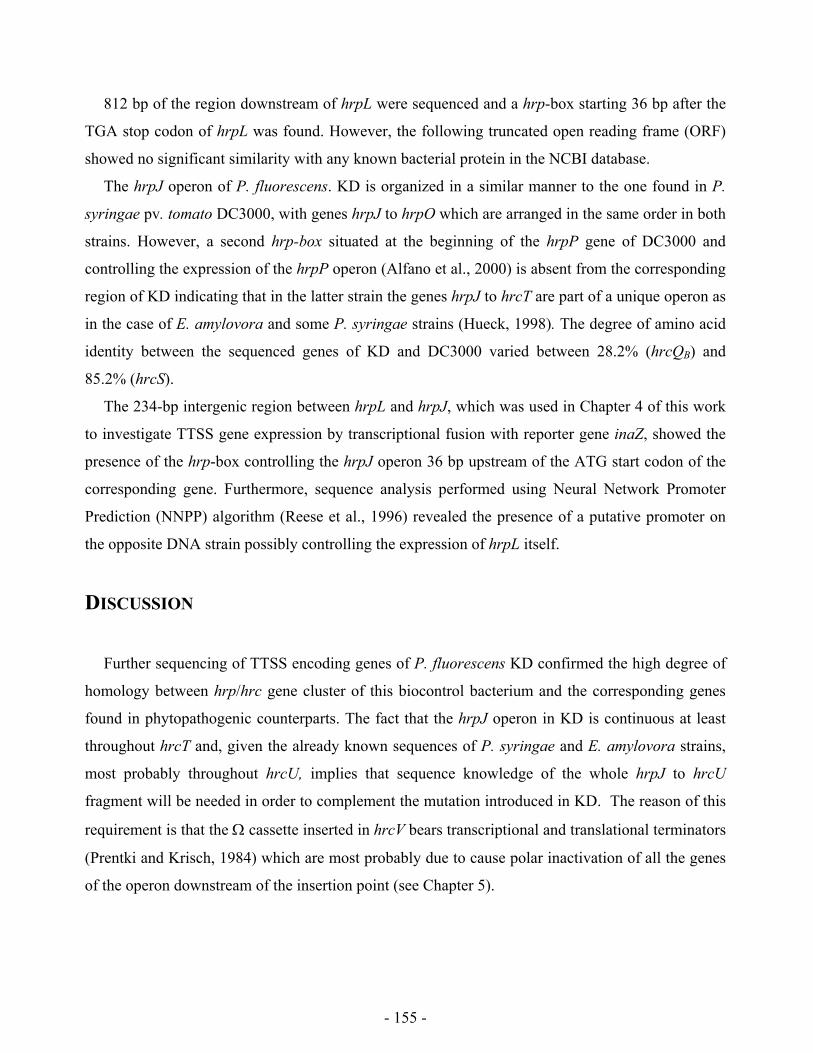
CHAPTER 6 - APPENDIX 151 Sequencing of type III secretion system genes of P. fluorescens KD downstream of hrcN
ADDENDUM 158 Annotated TTSS sequence of P. fluorescens KD
ACKNOWLEDGEMENTS 161
CURRICULUM VITAE 163
PUBLICATIONS 164
- 2 -
- 3 -
ABBREVIATIONS AND SYMBOLS
1D One dimensional 2D Two dimensional aa Amino acid ACC 1-aminocyclopropane-1-carboxylate ARDRA Amplified ribosomal DNA restriction analysis avr Avirulence gene bp Base pair CEL Conserved effector locus CFU Colony-forming units CTC Cyanoditolyl tetrazolium chloride dN Number of nonsynonymous substitutions per nonsynonymous site dS Number of synonymous substitutions per synonymous site DVC Direct viable count ECF Extracytoplasmic function EEL Exchangeable effector locus EPEC Enteropathogenic Escherichia coli HCN Hydrogen cyanide HGT Horizontal gene transfer HR Hypersensitive response IAA Indole-3-acetic acid IM Inner membrane INT p-Iodonitrotetrazolium violet IS Insertion sequence ISR Induced systemic resistance IVET In vitro expression technology JC Jukes-Cantor K2P Kimura-2-parameter KB King’s medium B LB Luria Bertani LPS Lipopolysaccharides MA Malt agar mPhl Monoacetylphloroglucinol NCBI National center for biotechnology information NJ Neighbor joining OD Optical density OM Outer membrane ORF Open reading frame P Probability value of a statistic test PAIs Pathogenicity island PCA Phenazine-1-carboxylic acid PCR Polymerase chain reaction PGA Polygalacturonase
- 4 -
PGPR Plant growth promoting rhizobacteria Phl 2,4-diacetylphloroglucinol Plt Pyoluteorin Pvd Pyoverdine QC-PCR Quantitative competitive PCR R Resistance gene RAPD Random amplified polymorphic DNA rDNA Ribosomal DNA rRNA Ribosomal RNA SA Salicylic acid SAR Systemic acquired resistance SDS-PAGE Sodium dodecyl sulfate polyacrylamide gel electrophoresis sec General secretory pathway TTSS Type three secretion system VBNC Viable but not culturable
- 5 -
SUMMARY
The utilization of Pseudomonas strains as inoculants for biological control of
soilborne plant diseases offers a promising alternative solution to the application of
chemical pesticides, but their inconsistent performance under field conditions has
hindered a widespread commercialization. To overcome these problems, it is therefore
important to understand the ultimate fate of released bacteria in a stressful environment
such as natural soil and to fully comprehend the mechanisms involved in plant protection.
The purpose of this work was to analyze the physiological status and the traceability of
stressed Pseudomonas cells using a polymerase chain reaction (PCR) approach and to
study the potential role of the type III secretion system (TTSS) in biocontrol interactions.
In the first part, the effect of different types of abiotic stresses on the physiological
status of the bacteria was investigated and correlated with their enumerability by
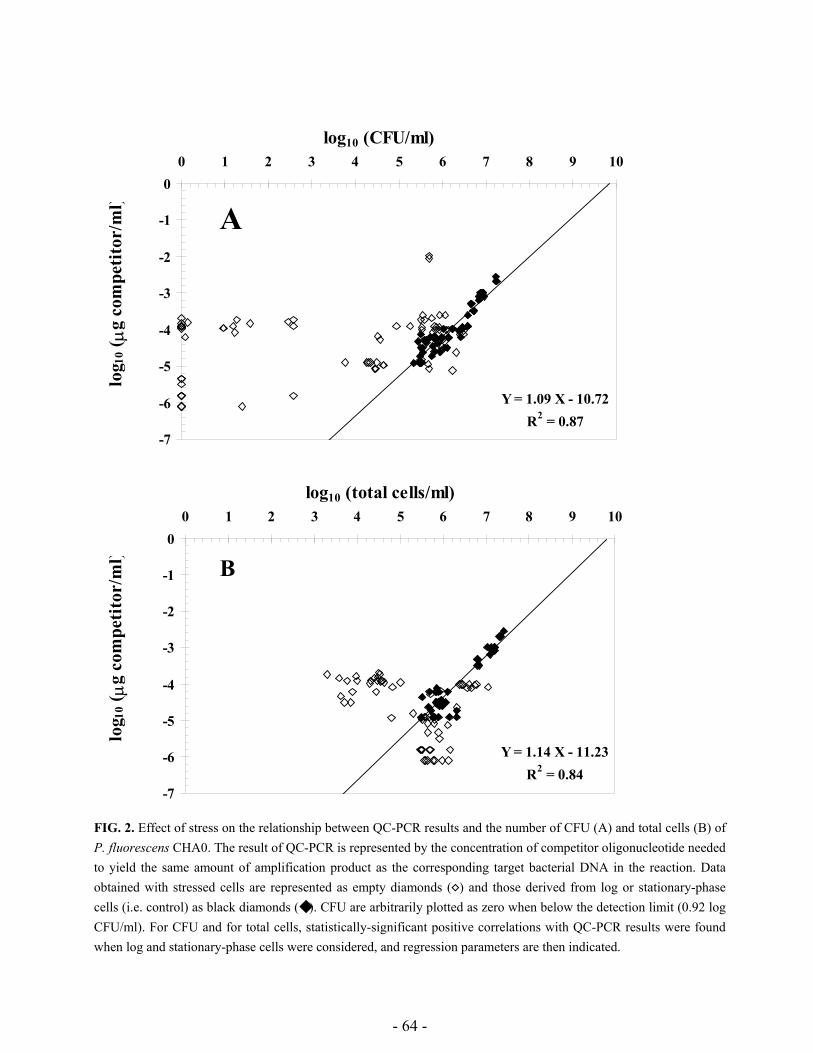
quantitative competitive PCR (QC-PCR). Good statistical correlations were found
between QC-PCR and both culturable and total cell number when studying cells in fresh
laboratory cultures, but not when using stressed cultures containing viable but non-
culturable cells (VBNC). In the latter case the amount of DNA detected by PCR was in
most cases higher than the one expected to be detected in colony forming units (CFUs)
alone. Conversely, this was found to be either higher or lower than the amount expected
in total cells enumerated by immunofluorescence, depending on the type of stress factor
applied. This suggests that different stresses affect DNA availability to PCR (hence also
to bacterial RNA polymerase) in different ways, producing distinct types of non-
culturable cells. These factors make QC-PCR a method difficult to use for bacterial
quantification in environmental samples, but which may however enable to gain insight
about the physiological state of bacteria subjected to environmental stresses.
In the second part of this work, the presence of genes belonging to the TTSS was
studied among a well-characterized worldwide collection of biocontrol pseudomonads
using PCR and DNA hybridization. TTSS gene hrcN was found in about 60% of
biocontrol fluorescent pseudomonads studied, with no particular predilection for the
geographical origin of the strains, their different biocontrol ability or the plant species
- 6 -
from which they were originally isolated. The TTSS sequences found were analyzed to
establish the phylogenetic relationships among them and compared to those found in
plant pathogenic pseudomonads. Data were used to build a phylogenetic tree, which was
compared to the tree derived from 16S-rDNA sequences. The fact that 16S rDNA and
hrcN have followed a similar evolution points to the ancestral origin of TTSS both in
pathogenic and non-pathogenic strains. In the hrcN tree most biocontrol pseudomonads
clustered separately from their phytopathogenic counterparts, there were however few
exceptions suggesting that in some cases, e.g. in P. fluorescens KD, TTSS genes might
have experienced an horizontal gene transfer (HGT).
The impact of this HGT event on biological control was investigated in the third part
of this work, where the biocontrol performance of a hrcV mutant of KD against P.
ultimum in cucumber was compared with those of wildtype KD and found to be
significantly lower. This effect was not to ascribe to an altered cucumber root
colonization ability, which was unaffected in the mutant strain. In order to understand
which interactions are important for the activation of TTSS, the promoter region
controlling the hprJ-operon of P. fluorescens KD, which contains hrcV, was fused to an
inaZ reporter gene and its activity was measured both in vitro and in vivo in presence of
plant and pathogen. The expression of the hprJ’-inaZ reporter fusion was similar in non-
sterile potting mix substratum and in the cucumber rhizosphere, but in both cases it was
significantly higher when P. ultimum was also present, especially in the rhizosphere. In
vitro, an increase in inaZ activity was observed when strain KD was cultivated in
presence of P. ultimum but not with wheat pathogen Gaeumannomyces graminis var.
tritici, against which KD shows no biocontrol activity. The effect on P. ultimum was
assessed in vitro by measuring the activity of fungal polygalacturonase (PGA), which is a
key pathogenicity enzyme for this fungus. When P. ultimum was confronted to P.
fluorescens KD, PGA production was delayed and enzyme levels were statistically lower.
In contrast, the hrcV– mutant KD-dork did not delay pectinase production in P. ultimum
and enzyme levels were statistically higher with KD-dork compared to KD. Taken
together, these results indicate that the expression of TTSS genes in P. fluorescens KD is
induced by the presence of the pathogen rather than the root, and they suggest that the
contribution of TTSS to the biocontrol activity of this strain targets the pathogen directly.
- 7 -
RIASSUNTO
Analisi della risposta allo stress e ruolo dell’apparato di secrezione delle proteine di
tipo III nell'attività di controllo biologico in batteri appartenenti al genere
Pseudomonas in grado di proteggere le piante da agenti patogeni residenti nel suolo.
L’utilizzo di ceppi batterici appartenenti al genere Pseudomonas quali agenti di
controllo biologico rappresenta una promettente alternativa all’uso di pesticidi chimici
per la protezione delle coltivazioni da agenti patogeni residenti nel suolo, ma la scarsa
efficacia della loro applicazione pratica su vasta scala ne ha per ora impedito una loro
estesa commercializzazione. Per risolvere questi problemi è perciò importante capire
quale è il destino dei batteri rilasciati nell’ambiente a questo scopo e quali sono i
meccanismi molecolari coinvolti nell’azione di biocontrollo. L’obiettivo di questo lavoro
è quello di analizzare le conseguenze degli stress ai quali sono sottoposti i batteri una
volta rilasciati nel suolo, con particolare attenzione all’analisi del loro stato fisiologico e
della loro reperibilità attraverso una tecnica basata sulla reazione a catena della
polimerasi (PCR), e lo studio del potenziale coinvolgimento dell’apparato di secrezione
delle proteine di tipo III (SS3) nell’attività di biocontrollo.
Nella prima parte di questo lavoro è stata studiata l’influenza di differenti tipi di stress
abiotici sullo stato fisiologico di Pseudomonas fluorescens CHA0. La PCR quantitativa
(QC-PCR) è stata utilizzata quale tecnica alternativa per la conta batterica. Una buona
correlazione statistica è stata trovata tra i risultati della QC-PCR, il numero di unità
formanti colonie (UFC) e il numero totale di cellule rilevate, quando questa tecnica è
stata applicata a colture batteriche cresciute in condizioni standard. Quando l’analisi è
stata estesa a colture di cellule vitali ma non coltivabili (VBNC, viable but non
culturable) sottoposte a differenti tipi di stress abiotici questa correlazione non è stata
riscontrata. La quantità di DNA rilevata mediante PCR è risultata, nella maggior parte dei
casi, più elevata rispetto a quella attesa nelle sole UFC e rispetto al conteggio delle
cellule totali al microscopio a immunofluorescenza è stata rilevata una maggiore o
minore quantità di DNA a in relazione al tipo di stress applicato.
- 8 -
Questo risultato porta ad ipotizzare che i differenti tipi di stress influenzino
diversamente la disponibilità del DNA batterico all’amplificazione durante la PCR (e
quindi, di riflesso, probabilmente anche alla RNA polimerasi batterica), producendo
tipologie di cellule vitali ma non coltivabili (VBNC) differenti tra loro.
In conclusione, la QC-PCR risulta un metodo di difficile applicazione per la
quantificazione dei batteri, ma può essere utilizzata per analizzare la reazione fisiologica
dei batteri agli stress ai quali sono sottoposti nel loro ambiente naturale.
Nella seconda parte di questo lavoro, una collezione di ceppi di Pseudomonas
provenienti da tutto il mondo con proprietà di biocontrollo, è stata studiata mediante PCR
ed ibridazione per verificare la presenza di geni appartenenti al SS3. Il gene hrcN,
codificante per una ATPasi del SS3, è stato trovato in circa 60% dei ceppi di
Pseudomonas studiati, indipendentemente dal loro luogo di provenienza, dalle proprietà
di biocontrollo espresse dal ceppo o dalla specie della pianta dalla quale erano stati
originalmente isolati.
Le sequenze hrcN trovate nei ceppi di biocontrollo sono state paragonate tra di loro
per determinare le relazioni filogenetiche e confrontate con sequenze appartenenti a ceppi
fitopatogeni. I dati ottenuti sono stati usati per costruire un albero filogenetico, che è stato
comparato a quello ottenuto utilizzando le sequenze dei geni codificanti per l’RNA
ribosomale (16S-rDNA).
Come nel caso dell’RNA ribosomale, la maggior parte dei ceppi Pseudomonas di
biocontrollo rappresentati nell’albero basato sulla sequenza di hrcN appartiene ad una
clade separata rispetto ai batteri fitopatogeni. Il fatto che entrambi i geni si siano evoluti
parallelamente suggerisce che vi sia un’origine ancestrale comune tra l’apparato di
secrezione dei ceppi saprofiti e quello dei ceppi patogeni. Alcune incongruenze tra i due
alberi filogenetici, come per esempio nel caso di P. fluorescens KD, suggeriscono però la
possibilità che un trasferimento orizzontale di geni del SS3 da saprofiti a patogeni possa
essere in alcuni casi avvenuto.
L’influsso del trasferimento e dell’acquisizione di geni appartenenti al SS3 sull’attività
di biocontrollo di P. fluorescens KD è stato studiato nella terza parte di questo lavoro,
con la creazione e l’analisi di un mutante nel gene hrcV. Questo mutante, denominato
KD-dork, ha dimostrato una minor efficacia rispetto al ceppo selvatico nel proteggere
- 9 -
piante di cetriolo (Cucumis sativus) dagli attacchi causati dal fungo Pythium ultimum,
agente eziologico della marcescenza delle radici (root rot), ma il minor biocontrollo non è
da ascrivere ad una inferiore capacità da parte del batterio di colonizzare le radici della
pianta. Allo scopo di analizzare quali sono le interazioni importanti per l’attivazione del
SS3 nel processo di biocontrollo, la regione promotrice dell’operone hrpJ (contentente
anche hrcV) è stata fusa a un gene reporter (inaZ), la cui attività è stata misurata sia in
vivo che in vitro in presenza di pianta e patogeno. L’espressione del costrutto si è rivelata
simile sia in substrato non sterile che nella rizosfera del cetriolo, aumentando
sensibilmente in entrambi i casi, ma in modo più accentuato nella rizosfera, nel caso di
presenza del patogeno P. ultimum. In vitro, un aumento dell’attività di inaZ è stato
osservato in presenza di P. ultimum ma non del patogeno del frumento Gaeumannomyces
graminis var. tritici contro il quale KD non mostra alcuna attività di biocontrollo.
L’effetto sulla patogenicità di P. ultimum è stato misurato in vitro analizzando la
produzione fungina di poligalacturonasi (PGA). Alla presenza di P. fluorescens KD la
produzione di PGA da parte di P. ultimum è ritardata e risulta statisticamente più bassa.
Al contrario, la presenza del mutante hrcV– KD-dork non ritarda la produzione di PGA da
parte del fungo e gli permette una produzione dell’enzima che è statisticamente più alta
rispetto al ceppo selvatico. Concludendo, questi risultati indicano come l’espressione dei
geni del SS3 in P. fluorescens KD sia indotta proprio dalla presenza del patogeno
piuttosto che da quella della pianta e della sua radice, e suggeriscono come probabilmente
sia proprio il fungo ad essere l’obiettivo diretto dell’attività del SS3 acquisito da KD.
Biological control of soilborne plant pathogens by fluorescent pseudomonads
Chemical control of plant diseases has been extensively and successfully used in the past
century. However, application of pesticides to the soil is not always effective and few products are
actually available. This fact, together with the appearance of pesticide resistance, the presence of
chemical residues on crop, and concerns about environmental and food-chain pollution have led to
an effort to seek alternative control strategies exploiting antagonism in the microbial world.
Biological control (or biocontrol) using plant beneficial root colonizing bacteria is therefore
increasingly being considered as an alternative for disease suppression in the field.
Biocontrol is defined as the use of natural or modified organisms, gene or gene products to
decrease the damage of deleterious organisms, and to favor crops and beneficial organisms (Cook,
2000). Among the organisms with promising properties for biological control of soilborne
pathogens there are root colonizing bacteria like fluorescent pseudomonads (Moënne-Loccoz and
Défago, 2004), which are part of the natural suppressiveness found in some soils (Stutz et al., 1989;
Mazzola, 2002; Ramette et al., 2003) and are able to control many crop diseases caused by fungal
root pathogens in greenhouse and field experiments (Thomashow and Weller, 1996; Ellis et al.,
1999; Paulitz and Belanger, 2001).
Mechanisms of biocontrol by fluorescent pseudomonads
Several mechanisms have been taken into account to explain how bacteria exert their biocontrol
activity, and many of them have been found, mixed in various blends, in different strains of plant
growth promoting rhizobacteria (PGPR) (Lugtenberg and Dekkers, 1999). Even for a single strain
different mechanisms may be important for the suppression of different plant diseases (Glick et al.,
1999; Moënne-Loccoz and Défago, 2004). Fluorescent Pseudomonas spp., have been demonstrated
to reduce plant diseases by suppressing soilborne pathogens through antibiosis, siderophore-
mediated competition for iron or nutrients, or induction of plant defenses (Fig. 1). In general,
biocontrol pseudomonads are not specific for one pathogen or plant species only, but have a wide
host range and suppress several pathogens (Thomashow and Weller, 1996). Effective root
colonization appears to be an essential, but not sufficient, prerequisite for biocontrol activity
- 14 -
(Weller, 1988; Bloemberg and Lugtenberg, 2001; Walsh et al., 2001) and superiority in the
competition for nutrient or infection sites has also been suggested to be a property of good
biocontrol strains (Paulitz et al., 1992; Ellis et al., 2000). By living in close association with plants,
PGPR use root exudates to drive their primary and secondary metabolism (Lugtenberg et al., 1999),
whereby right many of the secondary metabolites produced play different key roles in disease
suppression (Dowling and O’Gara, 1994; Raaijmakers et al., 2002).
Secondary metabolites involved in biocontrol
Secondary metabolites are substances that are produced by bacteria and that are not essential to
their basic metabolism. Under appropriate circumstances they can however benefit the producer
organism by conferring selection advantages and improving their fitness in a given ecological niche
(Haas and Keel, 2003).
One class of these metabolites produced by pseudomonads are antimicrobial compounds, which
include among the most important 2,4-diacetylphloroglucinol (Phl) (Vincent et al., 1991; Keel et al.,
1992; Ramette, 2002), hydrogen cyanide (HCN) (Voisard et al., 1989; Ramette et al., 2003)
pyoluteorin (Plt) (Howell and Stipanovich, 1980; Brodhagen et al., 2004), phenazine-1-carboxylic
acid (PCA) (Thomashow and Weller, 1988; Tambong and Höfte, 2001; Chin-A-Woeng et al.,
2003), pyrrolnitrin (Ligon et al., 2000), oomycin A (Howie and Suslow, 1991) or biosurfactants
(Nielsen et al., 1999; Nielsen et al., 2000). The implication of many of these bacterial antifungal
compounds in disease suppression has been demonstrated by comparing wildtype pseudomonads
with mutant derivatives in which production of antifungal compound(s) was altered (Keel and
Défago, 1997; Haas and Keel, 2003). The action exerted by these substances consists mostly in a
direct deleterious effect against the pathogen as shown by in vitro inhibition experiments (Haas and
Keel, 2003).
Other secondary metabolites, e.g. pyochelin, pyocyanin or salicylic acid (SA), have been
proposed to reduce disease by activating induced systemic resistance (ISR) (Audenaert et al., 2002),
a plant-mediated resistance mechanism that extends to the aerial plant parts and is phenotypically
similar to systemic acquired resistance (SAR, which is induced upon pathogen infection) in being
effective against different types of plant pathogens. Some rhizobacteria have been shown to trigger
- 15 -
the SAR signaling pathway by producing SA at the root surface (Maurhofer et al., 1998). In other
cases, ISR-inducing rhizobacteria have been demonstrated to trigger a different signaling pathway
that does not require SA. In those cases, bacterial determinants such as lipopolysaccharides (LPS)
from the outer membrane of Pseudomonas fluorescens have been shown to play an important role
in eliciting ISR (Pieterse et al., 2003).
Secondary metabolites are also involved in siderophores mediated iron competition through the
production of chelating pyoverdines (Pvd) (Leong, 1986; Meyer and Hohnadel, 1988; Meyer, 2000;
Weller, 1988), and in plant growth promotion, either by direct production of phytohormones like
indole-3-acetic acid (IAA) which promotes root elongation (Kloepper et al., 1989; Xie et al., 1996;
Patten and Glick, 2002), or by influencing the in planta levels of other hormones such as ethylene,
which is involved in ISR induction (Glick, 1998; Wang et al., 2003).
2,4-diacetylphloroglucinol (Phl)
Secondary metabolite Phl is produced by a wide variety of fluorescent Pseudomonas strains
(Keel et al., 1996), which are often naturally found in disease suppressive soils (Wang et al., 2001;
Ramette, 2002; de Souza et al., 2003) and is a key substance involved in disease suppression in
many pathosystems (Stutz et al., 1986; Keel et al., 1992, Sharifi-Therani et al., 1999). A significant
correlation was found between Phl production on King’s B (KB) plates (King et al., 1954) and
protection of tomato against Fusarium crown and root (Sharifi-Therani et al., 1999). Beside
antifungal activity it displays also antibacterial (Reddy and Borovkov, 1970, Keel et al., 1992),
antiviral (Tada et al., 1990), antihelmentic (Bowden et al., 1965), and phytotoxic properties
(Kataryan and Torgashova, 1976).
In P. fluorescens CHA0 the expression of phlA, the first gene of the Phl biosynthetic operon
(Fig. 2), is specifically autoinduced by Phl itself, but is blocked by other secondary metabolites like
SA or Plt (Schnider-Keel et al., 2000). Biotic factors affecting Phl production include plant species,
age or cultivar (Notz et al., 2001) and fusaric acid produced by fungal antagonist Fusarium
oxysporum (Duffy and Défago, 1997; Notz et al., 2002).
In strain Q2-87 six genes involved in Phl production and clustered on a 6.5-kb DNA fragment
have been identified (Bangera and Thomashow, 1999) (Fig. 2) and similar loci where shown to be
present in a collection of Phl+ fluorescent pseudomonads by hybridization with a 4.8-kb DNA probe
- 16 -
Fig. 1. Cross-talk in the rhizosphere. Infection is the process by which pathogens establish contact with the
susceptible plant cells or tissues, releasing a number of biologically active substances which affects host cell
physiology. Microorganisms that produce biochemical active compounds against pathogens can be used successfully
to limit or suppress the disease. Bacteria may enable plants to protect themselves by inducing systemic acquired
resistance. Pathogens can produce toxins to defend themselves against biocontrol or concurrent microorganisms
Plant exudates may serve as signals to induce secondary metabolite production in bacteria Introduced biocontrol
bacteria may have an impact on resident soil microbiota Plants may develop resistance to a broad spectrum of
pathogens (induced systemic resistance) or to specific ones (gene-for-gene hypothesis).
- 17 -
of Q2-87 (Keel et al., 1996). Monitoring the presence of one of the biosynthetic genes belonging to
this cluster, e.g. PhlA, may therefore allow quantitation (and determination of the physiological
status, see below) of whole fluorescent pseudomonads populations involved in biocontrol and
conferring suppressiveness to a particular soil.
Fig. 2. Schematic representation of the gene cluster for synthesis of Phl and reactions catalyzed by the derived proteins.
The products of phlA, phlC, and phlB function collectively, as mutations in any one of the three genes give rise to a
common phenotype. PhlA, PhlC and PhlB appear to have a dual role in Phl synthesis. All three are necessary and
sufficient for the conversion of monoacetylphloroglucinol (mPhl) to Phl, and they also appear to be required for the
synthesis of mPhl by catalyzing a condensation reaction needed to provide the primer unit for PhlD, which in turn is
essential for mPhl synthesis and has high homology to plant chalkone synthases. PhlE retains structural features of an
integral membrane permease and is required for the export of mPhl and Phl, while the product of the phlF gene contains
a helix-turn-helix motif, that is strongly predictive of DNA-binding activity typical of well-characterized repressor
genes. Two additional open reading frames designated as PhlG and PhlH, have been found downstream of PhlF in
strain CHA0 (Schnider-Keel et al., 2000). While the function of PhlG is still unknown, the product of PhlH is believed
to act as a second TetR-like regulator near PhlF (Haas and Keel, 2003).
phlE
Conversion of the precursors to Acetoacetyl-CoA and Phl
phlD phlB phlC phlA phlF
Acetoacetyl-CoA
PhlD PhlABC
Phl mPhl (precursor)
O O
HO
OH
OH
CH3 H3C
O
HO
OH
OH
CH3
Membrane Permease Transcriptional Regulator
2x Acetyl-CoA
PhlABC
- 18 -
Physiological status of introduced bacteria in soil
Culturable bacteria constitute only a small fraction (1-10%) of the global bacterial diversity
(Amman et al., 1995; Oliver, 1999) and also bacteria that are culturable under normal conditions
may loose their ability to grow on agar plates during incubation in environmental samples (Colwell
et al., 1985; Troxler et al., 1997) or following exposure to artificial stress conditions (Oliver et al.,
1991; Ravel et al., 1995). Even if they loose their colony forming ability, these bacteria retain
certain characteristics of living cells such as cellular integrity and the potential for metabolic
activity and respiration. This metabolic state is thus referred as viable but not-culturable (VBNC).
Factors inducing the entrance in the VBNC status include nutrient starvation (Hase et al., 1999) or
abiotic stress factors such as altered temperature (Oliver, 1993), salinity or redox potential (Mascher
et al., 2000), pH (Chaveerac et al., 2003), or critical concentrations of cations such as divalent
copper (Grey and Steck, 2001; C. Hase, personal communication).
While caution must be paid when evaluating resuscitation experiments, since they are prone to
experimental artifacts due to the (re)growth of residual culturable cells (Bogosian et al., 2000), it is
not clear if the VBNC state constitutes a survival strategy of active adaptation induced by the
challenging environmental conditions or is just a moribund status condition in which cells become
progressively debilitated until cell death finally occurs (McDougald et al., 1998). There are both
reports of successful resuscitation of VBNC cells (Nilsson et al., 1991; Oliver et al., 2000; Baffone
et al., 2003) and reports that show that the majority of cells in a non-culturable population have
degraded nucleic acid and are thus nonviable (Yamamoto et al., 1996; Weichart et al., 1997). It
seems therefore reasonable to assume that in fact the VBNC cells are constituted from
subpopulations that are a reflection of the stages of VBNC formation. In the initial stage, cells lose
culturability while maintaining intact membranes and nucleic acids, possibly maintaining the
potential for resuscitation (viability). In the later stages of the VBNC state cells gradually
experience degradation of nucleic acids and thus lose the potential for resuscitation becoming
nonviable.
If bacteria are introduced in the environment for artificial purposes (such as biocontrol or
bioremediation), loss of culturability may be equivalent to loss of the desired function (Moënne-
Loccoz and Défago, 2004) and will make the cells difficult to monitor, as plating techniques
become by definition worthless. Furthermore, while dead cells disappear very rapidly when released
- 19 -
into soil microcosms, VBNC cells may persist in the environment for longer periods of time
(Mukamalova et al., 2003). This fact, along with the possibility that the cells may finally resuscitate,
may be of true concern when talking about the release of genetically modified bacteria and long
term impact on the existing microbial community. This is even truer given the fact that application
of beneficial bacteria in soil often necessitates a relatively high inoculum to achieve the desired
effect and to retain it over a longer time (Hase, 1999). It becomes thus necessary to observe
inoculant in situ using alternative techniques such as microscopy or molecular biology techniques.
Methods to enumerate culturable cells in environmental samples
Determining colony forming units (CFU) by selective plating is the most common method to
enumerate culturable cells. In order to retrieve the inoculant in the sample the cells have to be
tagged, either by inserting a genetic marker which confers a distinct visible phenotype (reporter
gene), or by introducing an antibiotic resistance which allows to selectively recover the desired
cells. Both strategies have advantages and drawbacks and the decision on which method to adopt
depends finally on the background question posed. For example, introduction of lacZY genes
producing β-galactosidase and lactose permease, which can be activated a posteriori on plate after
bacterial isolation, enables bacteria to form blue colonies on media containing X-gal, without
burdening bacterial metabolism (Flemming et al., 1994). However, if the number of introduced
CFUs decays to a level which is much smaller than that of resident bacteria (e.g. by two or more log
units), the colony forming activity of the inoculant may be impaired and emerging colonies may
become difficult to discriminate against the background of native microorganisms (Mascher, 2001).
In this case marking the strain with antibiotic resistance genes may help to solve the problem
although, as shown for kanamycine resistance gene aph-1 (de Leij et al., 1998), this may cause a
decrease in bacterial fitness. The use of spontaneous rifampicine resistance mutants may be a valid
alternative solution (Mascher, 2001).
In the last ten years, several reporter genes that enable, alongside to plate recognition of the
strains, also in situ detection of the single cells or colonies (Jansson and de Bruijn, 1999) have
become available. Examples thereof are genes conferring to the bacteria light emission capability
(bioluminescence) like luxAB encoding luciferase (Flemming et al., 1994), or coding for the red
- 20 -
(RFP or DsRed) (Matz et al., 1999) or the green fluorescent protein (GFP) (Chalfie et al., 1994) and
its derivatives (Bloemberg et al., 2000). Bacteria tagged with luciferase or fluorescent protein
markers can be visualized in situ by direct fluorescent microscopy. However, this usually requires
the genes to be constitutively expressed and thus energy for protein synthesis or production of light
(in form of ATP, or FMNH2 in the case of luciferase) that may burden cell metabolism and
negatively affect the fitness of the inoculum in nutrient-poor environments such as soil (de Leij et
al., 1998; Tombolini et al., 1999).
Fluorescent microscopy can also be used in combination with immunofluorescence to recognize
specific bacteria. A primary antibody binds specifically on the target bacterium and is then detected
and amplified by a secondary antibody labeled with a fluorescent dye (Bohlool and Schmidt, 1980).
This method has the advantage that bacteria are grown as wildtype strains and thus more closely
reflects the natural situation in which bacteria thrive (or starve) in the environment. It is however
difficult and time consuming to establish since it requires a specific primary antibody against the
organism of interest to be raised and purified in a first mammalian (e.g. in mouse or rabbit) and a
second, anti first-mammalian antibody, to be raised in a subsequent animal (e.g. in goat). Both
culturable and non-culturable cells are visualized by immunofluorescence, so that additional
techniques are required to discriminate the physiological status of the cells.
Methods to monitor physiological status of the cells
Minimum requirements for a cell to be considered viable are (i) membrane intactness and (ii) at
least some metabolic activity (Weichart, 1999). Both properties that can be used to discriminate
viable cells microscopically.
Membrane integrity demonstrates the protection of cell constituents and their potential to
generate gradients, thus cell’s capability of metabolic activity. Cells without an intact membrane
can not maintain any electrochemical gradient and can be classified as dead. Membrane integrity
can be assayed by using dyes which are under normal circumstances unable to penetrate living cells,
but that are able to permeate across damaged membrane to stain internal cellular components.
Cellular uptake of rhodamine 123 and exclusion of oxanol indicates the presence of an intact
membrane and a functional proton pump system (Kaprelyants and Kell, 1992). Calcafluor reacts
- 21 -
with intracellular fatty acids forming a fluorescent dye, but is not able to penetrate across the intact
membrane of a living cell (Mason et al., 1995). In the BacLight viability kit (Molecular Probes,
Oregon, USA) the nucleic acid-dye propidium iodide stains cellular DNA of injured cells in red,
while intact cells appear green by staining with membrane permeable SYTO9, which is less
intensive than the red dye (Millard et al., 1997).
Enzymatic tests of metabolic activity show that cells have sufficient organization to have
retained the single enzymes required for a given reaction. However, exactly which proteins and
coenzymes are required for positive reactions is not always clear. In the case of tetrazolium salt
reactions, much is made of the capacity of reagents such as INT (p-Iodonitrotetrazolium violet)
(Gribbon and Barer, 1995) and CTC (cyanoditolyl tetrazolium chloride) (Zimmermann et al., 1978)
to indicate respiration by being reduced into traceable red fluorescent dyes (CTC- respectively INT-
formazan). Yet, respiration is essentially a series of redox reactions involving oxygen or other
inorganic compounds as electron acceptors. Pure preparations of many of the enzymes involved,
combined with appropriate coenzymes and completely devoid of any living system can also reduce
tetrazolium salts, thus whether these tests really indicate viability or rather the persistence of dead
cells as "bags of enzymes" remains to be established (Gribbon and Barer, 1995).
A broader test of metabolic activity is the Kogure’s cell elongation test, also referred as direct
viable count (DVC) (Kogure et al., 1979). Bacteria are incubated with yeast extract, which
promotes cells growth, and the quinolone inhibitor of cell division nalidixic acid. After
counterstaining, elongated nutrient responsive cells differ from short non-responsive ones (Fig. 3).
It seems reasonable to assume that the changes observed in cell length must involve cell growth
with all the accessory metabolic reactions that it implies (RNA transcription, DNA replication,
protein and cell wall synthesis). Indeed, inhibition of the reaction by chloramphenicol and
rifampicine was observed, indicating that both transcription and translation must be involved (Barer
et al., 1999). The Kogure’s procedure may be seen therefore, as an indirect test of all these
processes and as the most confident way to determine cell viability, although the specific nature of
the stimulus provided by nalidixic acid remains to be established.
In the last two decades, several nucleic acid based methods have been developed to specifically
detect and determine bacteria. Among these, polymerase chain reaction (PCR) (Mullis et al., 1986)
- 22 -
Fig. 3. Immunofluorescence microscopy of P. fluorescens CHA0 cells subjected to the Kogure’s DVC method.
Metabolic still active (viable) cells appear elongated after 1 hour incubation with nalidixic acid and yeast extract, while
inactive (non responsive) cells remain small-sized. Original picture by Fabio Mascher (ETH Zürich).
offers the highest specificity and sensitivity. With the rapidly growing knowledge of DNA
sequences of different bacterial species, these methods became increasingly powerful tools for
microbiological routine analysis in the most different natural environments like water (Delabre et
al., 1998; Rompre et al., 2002) or soil (Nesme et al., 1995; Lee et al., 2002), or in food (China et al.,
2002) and medical samples (Fredricks and Relman, 1999; Harris and Hartley, 2003).
Despite its broad use in detection and enumeration of bacteria little is known about how PCR is
affected by the physiological status of the target cells. PCR amplification should theoretically apply
to sufficiently intact nucleic acids extracted from all cells, albeit viable and culturable, viable but
non-culturable or dead. Consequently, PCR-based assays should not in principle be able to provide
any information on the physiological status of targeted cells (Rompre et al., 2002). However, a loss
of random amplified polymorphic DNA (RAPD) signal, presumably linked to modification in DNA
packaging, was detected in starving Vibrio vulnificus cells entering the VBNC state (Oliver and
Warner, 1998), suggesting that physiology nevertheless plays an important role in DNA availability
for PCR.
- 23 -
Quantitative competitive PCR
While traditional PCR can easily be designed to be highly specific, it is by no means quantitative
because its exponential time course (and the equally exponential amplification of errors) makes the
estimation of the amount of DNA in the original sample (template) from the amount of obtained
PCR products (amplicons) impossible. In fact, considering only the exponential phase of the
reaction, amplification of genomic DNA occurs according to the equation:
G = G0 · e k · c (1)
where G is the amount of genomic DNA obtained, G0 is the initial amount, c is the number of
cycles, and k is a constant accounting for the efficiency of amplification which dependent from
multiple factors, such as concentration of reagents, reaction temperatures, primer sequences, and so
on. The trivialistic conception by which the amount of amplicons in PCR doubles at each cycle is in
fact far from the reality. Furthermore a linear relationship between input template and amplification
product occurs only within the exponential range of amplification, which is strictly dependent on
the amount of the starting material and is heavily influenced by differences in sample preparation,
machine performance, reaction conditions, and presence of inhibitors (Chelly et al., 1990).
An approach to overcome these variations has been the coamplification within the same tube of a
reference template, or competitor (Diviacco et al., 1992), that shares with the target sequence the
same primer annealing sites and near totality of the amplified sequence, so that the two templates
compete for the same primer set and subsequently amplify at the same rate. This technique is called
quantitative competitive PCR (QC-PCR). The two amplified products can be recognized because of
their different lengths (Wang et al., 1989), by the presence of a mutation in the competitor which
creates a novel restriction site (Becker-André and Hahlbrock, 1989), or can be resolved by
temperature gradient gel electrophoresis (Hence and Heibey, 1990). In this work the internal
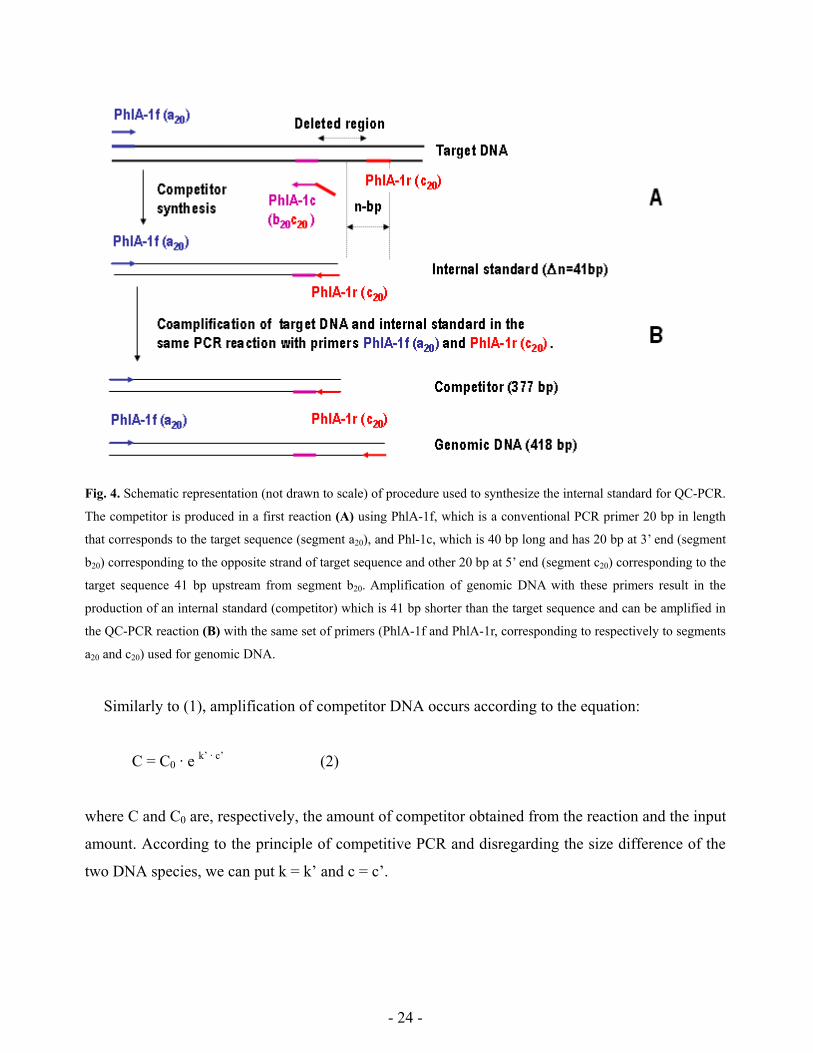
standard for QC-PCR was synthesized using a simple PCR procedure (Fig. 4) proposed by Celi et
al. (1993). To perform QC-PCR on P. fluorescens CHA0 key biocontrol gene PhlA was chosen as
target.
- 24 -
Fig. 4. Schematic representation (not drawn to scale) of procedure used to synthesize the internal standard for QC-PCR.
The competitor is produced in a first reaction (A) using PhlA-1f, which is a conventional PCR primer 20 bp in length
that corresponds to the target sequence (segment a20), and Phl-1c, which is 40 bp long and has 20 bp at 3’ end (segment
b20) corresponding to the opposite strand of target sequence and other 20 bp at 5’ end (segment c20) corresponding to the
target sequence 41 bp upstream from segment b20. Amplification of genomic DNA with these primers result in the
production of an internal standard (competitor) which is 41 bp shorter than the target sequence and can be amplified in
the QC-PCR reaction (B) with the same set of primers (PhlA-1f and PhlA-1r, corresponding to respectively to segments
a20 and c20) used for genomic DNA.
Similarly to (1), amplification of competitor DNA occurs according to the equation:
C = C0 · e k’ · c’ (2)
where C and C0 are, respectively, the amount of competitor obtained from the reaction and the input
amount. According to the principle of competitive PCR and disregarding the size difference of the
two DNA species, we can put k = k’ and c = c’.
- 25 -
Thus, the ratio between competitor and genomic products is
0
0ck
0
'c'k0
GC
eGeC
GC
=⋅⋅
= ⋅
⋅
(3)
From the last equation is easy to see that the amount of PCR products obtained after the reaction
is proportional to the initial competitor to genomic DNA ratio. The amount of genomic DNA
initially present in the reaction is given by the reciprocal of the angular coefficient of the linear
equation represented in (3). Even if in theory a single dilution of competitor is sufficient to probe an
unknown amount of genomic template, from the practical point of view, the best results are usually
obtained by comparing several dilutions of the competitor with a fixed amount of unknown
genomic DNA in multiple reactions (Fig. 5).
A B
M 64 32 16 8 4 2 INPUT competitor [pg]
y = 0.394x + 1.132R2 = 0.978
0
1
2
-3 -2 -1 0 1 2log INPUT competitor [pg]
log
RA
TIO
com
petit
or /
geno
mic
DN
A .
Fig. 5. (A) QC-PCR of genomic DNA (upper band, 418-bp) against two-fold serial dilutions of competitor oligonucleotide (lower band, 377-bp). The competitor oligonucleotide is shorter than the genomic template and was synthesized by deleting a 41-bp fragment of the original sequence by PCR using the method proposed by Celi et al. (1993) (see Fig. 4). (B) The ratio of genomic-to-competitor DNA is analyzed by densitometric analysis of the EtBr stained bands and its logarithm is plotted on a graph against the logarithm of input template. The standard curve and the correlation value R2 were calculated using least squares analysis. Interpolation of the regression equation for a y value of 0 (log10 1=0, resulting from equal copy number of competitor and target genomic DNA) enables to calculate the amount of target template in the sample (Connolly et al., 1995).
- 26 -
Phylogenetic analysis
The primary cause of evolution is mutational change of genes. Mutant DNA sequences that are
reflected in the phenotype of the organism undergo natural selection and may eventually spread
across the whole population to become a fixed trait or be lost forever. Exploitation of vacant
ecological niches and competition between individuals are the two major forces that drive natural
selection. Other mutations may instead remain silent and be purified simply through genetic drift,
which is defined as the process by which the frequency of existing alleles in a population changes
by chance alone (Griffiths et al., 1996).
Overall, driven by natural selection and genetic drift, the evolutionary change of DNA follows a
more or less regular pattern over longer periods of time, so that analysis and comparison of DNA
sequences can be used, with the help of different mathematical models (Nei and Kumar, 2000), to
reconstruct the evolutionary history of living organisms and the relationships among them. For long
distance relationships ribosomal RNA genes are the ideal choice (Woese, 1994), first of all because
they are common to all living organisms, thus allowing the reconstruction of a veritable “tree of life
on Earth” as envisioned by Felsenstein (1983) and secondly because they evolve slowly, containing
therefore still enough similarity between distant species to allow evolutionary relationships to be
reconstructed. However, its use is not as effective for bacterial taxonomy where strains belonging to
different species by DNA-DNA hybridization (Nakamura, 1984) were found to share the same or
very similar 16S rDNA sequences (Fox et al., 1992). Obviously provided that the investigated genes
are common to all organisms investigated, protein-coding DNA genes are a well suitable alternative
for the investigation of bacterial taxonomy (Palys et al., 2000).
It may be argued that phylogenies inferred through different protein-coding genes will yield
different evolutionary histories because of diverging selective pressures on the different gene
products, but for bacteria this possibility is refused from the theory of evolutionary genetics (Cohan,
1994; Palys et al., 1997; Majewski and Cohan, 1999). Mutant that have inherited a competitive
advantage upon other individuals are called adaptive mutants and under normal circumstances they
will become the dominant genotype in a population occupying a particular ecological niche (Cohan,
1999). Since the whole bacterial genome forms practically one entire linkage group, this will affect
not only the mutated locus, but will also have consequences on all other loci in the bacterial
genome, which will be purged parallely unless recombination intervenes. Recombination rates in
- 27 -
bacteria are nonetheless low and can not counteract the effects of genetic mutations (Cohan, 1999).
As a result, with the accumulation of selection events, the diversity between different ecological
populations, each one adapted to its own ecological niche increases and is reflected at all loci, also
those that are not directly under selection pressure.
Comparing phylogenies inferred from different protein-coding genes or from a protein-coding
gene and rDNA genes may offer clues about the evolutionary history of the organism and the
occurrence of eventual horizontal gene transfer (HGT) events (Gogarten et al., 2002). Since not a
single instance of phylogenetic ambiguity resulting from the transfer of rDNA genes has been
described so far (Kurland, 2000) HGT will almost certainly pertain protein coding genes.
Horizontal gene transfer
Normal transfer of genetic information in bacterial populations occurs vertically through clonal
division towards individuals of the same species and bacteria usually adapt themselves to the ever-
changing environmental conditions by the means of slowly accumulated and selected mutations.
However, independent of reproduction, bacteria can also transfer minor portions their genome (up
to 300 kb) horizontally among their population (Nielsen and Townsend, 2001; Davison, 1999). This
transfer of DNA is monodirectional (from a donor to a recipient) and is called lateral or horizontal
gene transfer. HGT may occur between individuals belonging to the same species or even being
interspecific and may allow an evolutionary leap to the recipient population by the sudden
acquisition of a novel trait. Three natural occurring mechanisms of HGT are known: conjugation,
transformation and transduction.
Conjugation (or mating) is mediated by a bacterial pilus and allows plasmid DNA transfer from a
donor to a recipient bacterial cell (Clewell, 1993). It requires cell to cell contact, but can occur
between distantly related bacteria and is able to transfer long fragments of DNA. Foreign DNA
integrates then into the chromosome of the donor thanks to the presence of insertion sequences on
the plasmid. Transformation consists in the uptake by the bacterial cell of naked DNA from the
environment and can mediate the exchange of any part of a chromosome: typically only short DNA
fragments are exchanged (Lorencz and Wackernagel, 1994). Transduction is the transfer of bacterial
DNA, packed into a bacteriophage head, to a new cell when the latter is infected by the virus
- 28 -
(Marsch and Wellington, 1994). Since it requires that the donor and recipient share cell surface
receptors for phage binding it is usually limited to closely related bacteria and the length of DNA
transferred is limited by the size of the phage head. DNA acquired by transformation or transduction
can integrate into the chromosome by homologous recombination, which may occur even with
DNA sequences with as low as 75% similarity (Cohan, 1999).
However, most horizontally transferred DNA is unlikely to function in the transformed bacteria
because of basic physiological differences to the donor and in those cases where a function is
actually horizontally acquired it will seldom confer a selective advantage to the bacterial
transformant. At the end, natural selection and random genetic drift will mostly drive the eventual
loss of the transformants from the bacterial population (Nielsen and Townsend, 2001).
Nevertheless, sequence analyses of both bacterial genes and genomes have provided ample
evidence for the occurrence and evolutionary significance of HGT. Indeed, HGT events can be
detected by establishing differences between topologies of species (i.e. rDNA-based) and gene
phylogenetic trees, or among phylogenetic trees belonging to different genes (Boc and Makarenkov,
2003). Further clues which are indicative of an HGT event are the characterization of the acquired
regions by a distinct GC content and a different codon usage with respect to the rest of the genome
(Eisen, 2000; Koonin et al., 2001). Ochman and co-workers (2000) analyzed codon-usage patterns
and GC-content in 19 sequenced bacterial genomes and estimated that up to 16 % of the protein-
coding DNA could have been horizontally acquired. The comparison of the genomes of
enterohaemorrhagic Escherichia coli strain O157:H7 and the commensal strain K-12 suggested that
major portions of the pathogenicity traits were horizontally acquired (Perna et al., 2001). This is not
surprising in so far that many of the responsible genes are known to reside on so called
pathogenicity islands (PAIs, described more in detail below), that is regions of chromosomal DNA
which are essential for pathogenicity but that appear to be “extraneous” the genome. Indeed, PAIs
are flanked by specific DNA sequences, such as direct repeats or insertion sequence (IS) elements
which are indicative for mobile genetic elements (Macsas and Strauss, 1996). While acquisition of
PAIs by HGT is fairly good documented among bacteria, little or nothing is known about lateral
acquisition of biocontrol features.
- 29 -
Secretion systems in gram negative bacteria
In gram-negative bacteria secretion is defined as the active transport of proteins across the inner
and outer membrane onto the surface of the bacterial cell or into the supernatant. It has to be
distinguished from export which defines the transport of proteins from the cytoplasm into the
periplasm across the inner membrane only (Pugsley, 1993; Salmond and Reeves, 1993).
Four diverse and sophisticated mechanisms of protein secretion (types I to IV) have been
described in gram-negative bacteria so far (Fath and Kolter, 1993; Salmond and Reeves, 1993; van
Gijsegem et al., 1993). A fifth, less well characterized system, is involved in secretion not only of
proteins, e.g. Bordetella pertussis toxin (Weiss et al., 1993), but also of other macromolecules, e.g.
in conjugal transfer of T-plasmid in Agrobacter tumefaciens from which it’s likely to have adapted
(Winans et al., 1996). All secretion systems use the energy of ATP hydrolysis to drive secretion
(Fig. 6). Type II, IV and V secretion systems are addicted to the general secretory pathway (sec) as a
separate step for the transport of the proteins into the periplasm and are thus called sec-dependent
pathways. An about 30-amino acid (aa) long N-terminal signal sequence, which is cleaved off in the
periplasm by a signal peptidase, is a characteristic feature of proteins exported from sec-dependent
pathways.
Type IV secretion systems (Finlay and Falkow, 1997) include a group of autotransporters, so
called because they apparently form a pore in the outer membrane through which they pass before
being released into the supernatant following to autoproteolitic cleavage. Information required for
transport across the outer membrane resides entirely within the secreted protein. Examples of
proteins using type IV secretion include the vacuolating cytotoxin of Helicobacter pylori (Cover et
al., 1994) or the IgA proteases of Haemophyus influenzae (Poulsen et al., 1989).
Type II secretion is thought to be the primary export pathway in gram-negative bacteria and
requires an accessory set of inner and outer membrane proteins to move the exported molecules
across the outer membrane. The genes coding for the array of accessory proteins (about 14) are
usually found clustered in a single operon. Examples of type II secretion are the out pathway of
Erwinia spp. for the secretion of pectinolytic enzymes and cellulases, and secretion of other
virulence factors in several plant pathogens (Hobbs and Mattick, 1993).
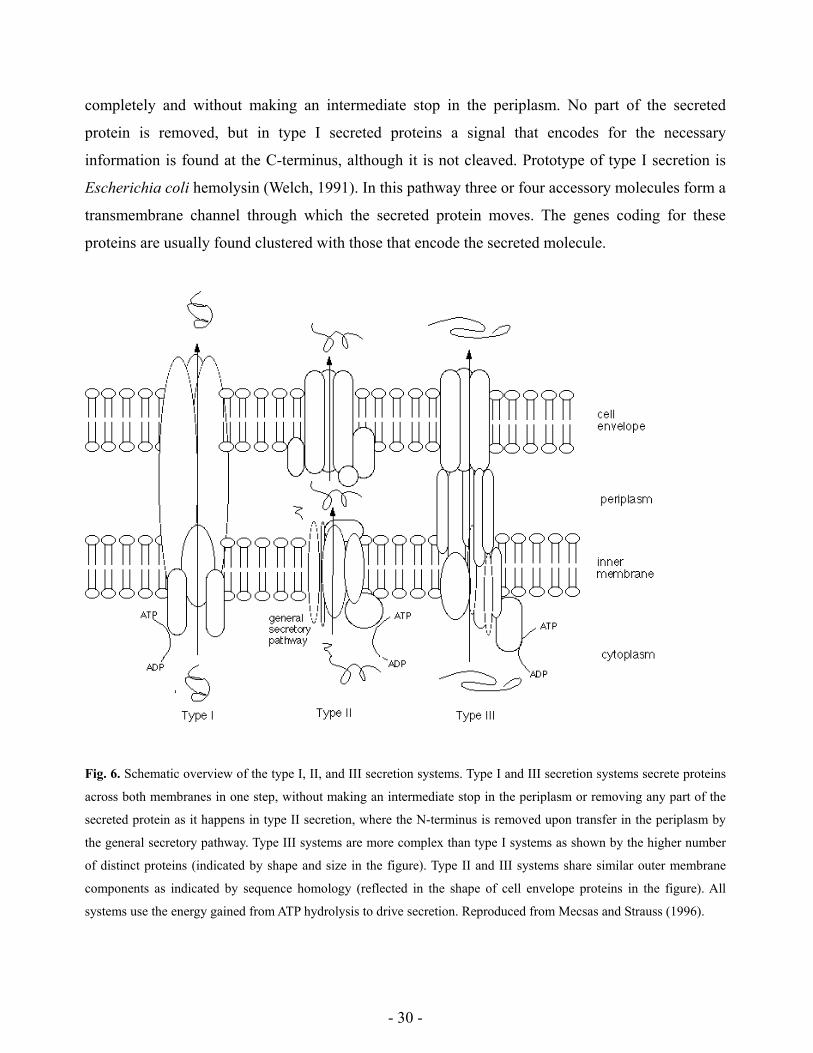
On the other hand, proteins secreted by the type I and III secretion systems cross both
membranes from the cytoplasm to the cell surface in one step, bypassing the sec-pathway
- 30 -
completely and without making an intermediate stop in the periplasm. No part of the secreted
protein is removed, but in type I secreted proteins a signal that encodes for the necessary
information is found at the C-terminus, although it is not cleaved. Prototype of type I secretion is
Escherichia coli hemolysin (Welch, 1991). In this pathway three or four accessory molecules form a
transmembrane channel through which the secreted protein moves. The genes coding for these
proteins are usually found clustered with those that encode the secreted molecule.
Fig. 6. Schematic overview of the type I, II, and III secretion systems. Type I and III secretion systems secrete proteins
across both membranes in one step, without making an intermediate stop in the periplasm or removing any part of the
secreted protein as it happens in type II secretion, where the N-terminus is removed upon transfer in the periplasm by
the general secretory pathway. Type III systems are more complex than type I systems as shown by the higher number
of distinct proteins (indicated by shape and size in the figure). Type II and III systems share similar outer membrane
components as indicated by sequence homology (reflected in the shape of cell envelope proteins in the figure). All
systems use the energy gained from ATP hydrolysis to drive secretion. Reproduced from Mecsas and Strauss (1996).
- 31 -
Type III secretion systems
Similarly to type I secretion systems, also type III secretion systems are sec-independent
pathways and the effector proteins cross the inner and outer membrane of gram-negative bacteria in
a single step. As in type I pathway no part of the secreted protein is removed, but unlikely to the
latter no signal for secretion is known to reside on the protein sequence (Hueck, 1998), which do
not show any recognizable structural similarities that could serve this purpose. However, since the
first 15 to 20 N-terminal amino acids are necessary and suffice for secretion of fusion proteins, it
has been suggested that such a signal may instead reside in the 5’ region of the messenger RNA that
encodes for the secreted proteins (Altmeyer et al., 1993; Anderson and Schneewind, 1997). The
type III secretion machinery is composed of about 20 proteins, most of which are located in the
inner membrane. Unlikely to type I apparatus there is no single channel formed by a single gene
encoded protein spanning the two membranes. Export through the inner membrane is genetically
distinct from secretion through the outer membrane so that, even if in normal circumstances there is
no periplasmatic intermediate, proteins can accumulate there if outer membrane proteins are
impaired in their function by a mutation (Charkowski et al., 1997).
At least eight type III secretion components, mostly located on the inner membrane, have
paralogs in the flagellar assembly machinery with which they share sequence similarities (Fig. 7).
This fact led to the common believe that these secretion systems are derived from the presumably
more ancient flagellar assembly apparatus counterparts (Macnab, 1999; Nguyen et al., 2000; Galán
and Collmer, 1999), although recently the alternative that in fact both systems rather share a
common ancestor has been raised (Gophna et al., 2003).
A class of proteins, called chaperones, plays a critical function in the secretion mechanism by
interacting with the effector molecules to be secreted in the cytoplasm. Several modes of action
have been proposed for chaperones (Wattiau et al., 1996). They may bind effector proteins and
stabilize them, preventing them from folding into a conformation that can be either impossible to
secrete or that can affect negatively the bacterial cell (Frithz-Lindsten et al., 1995). Another
possibility is that they are needed to deliver molecules to the secretion apparatus. In Shigella it has
been shown that chaperones prevent effector molecules from improperly associating with one
another before secretion (Ménard et al., 1994).
- 32 -
Fig. 7. Genetic organization of type III secretion systems and of flagellum biosynthesis genes from Bacillus subtilis and Escherichia coli. Homologies of encoded proteins are indicated by the color. The type III secretion systems of animal and plant pathogens are grouped according to genetic similarities. Solid arrows indicate broadly conserved genes, while genes which are conserved only between subgroups are outlined by thicker, colored lines. A thin black outline indicates that no homolog of the respective gene has been identified so far. The filling patterns indicate genes which encode transcription factors. A small s inside a gene symbol indicates secretion of the encoded protein, while the genes which encode chaperonic proteins are labeled ch. The known transcriptional units are indicated by arrows underneath the genes. For type III secretion systems belonging to plant pathogens, the hrc and hrp gene designations are sometimes replaced with c and p, respectively. Reproduced from Hueck (1998).
- 33 -
Genes involved in type III secretion are physically linked with each other in clusters and operons
and have been shown to reside on mobile genetic elements like plasmids or pathogenicity islands on
the chromosome (Collazo and Galan, 1997; Macsas and Strauss, 1996). The majority of
pathogenicity islands discovered so far was shown to contain a type III secretion system.
Pathogenicity islands are often missing in non-virulent isolates of bacterial species which are
generally known as pathogens and constitute a potent mean for evolving virulence by a single
genetic event, i.e. their acquisition from another bacterial host. Therefore, HGT of PAIs provides a
means of transmitting virulence properties to distantly related bacteria (Macsas and Strauss, 1996)
by transforming nonpathogenic species into pathogenic ones.
Another noticeable characteristic of type III secretion is that its function seems to be mediated
upon contact with eukaryotic host cells (Rosqvist et al., 1994; Watarai et al., 1995) and has thus
been called contact dependent secretion (Galán, 1996). This fact is strongly related to what was
probably thought to be the most characteristic feature of type III secretion systems, which is their
strong correlation with pathogenicity in bacterial strains. In fact, type III secretion systems are
widespread among both animal and plant pathogenic bacteria of highly diverse evolutionary origin
(He, 1998), such as plague causing agent Yersinia pestis (Plano et al., 1991), gastroenteritis and
typhoid fever causing agents from Salmonella spp. (Galan et al., 1992), opportunistic pathogens like
P. aeruginosa (Frithz-Lindsten et al., 1997), and other gram negative bacteria such as Shigella
flexneri (Andrews and Maurelli, 1992), Chlamydia psittaci (Hsia et al., 1997) and enteropathogenic
Escherichia coli (EPEC) (Jarvis et al., 1995) (Fig. 7). In E. coli strains a very tight relationship
between the presence of TTSS and pathogenicity has been established, with TTSS found in EPEC
strains (Jarvis et al., 1995; Stuber et al., 2003), but not in innocuous E. coli isolated from healthy
volunteers or genetically well characterized strains such as K-12 and its derivatives (Muhldorfer et
al., 1996; Muhldorfer and Hacker, 1994), commonly considered to be biological containment strains
and recommended as safe hosts for propagation and expression of cloned genes (National Institutes
of Health, 1996).
Surprisingly, type III secretion systems similar to those found in unrelated animal pathogens,
have also been found in all four major genera of plant pathogenic bacteria: Pseudomonas, Erwinia,
Ralstonia and Xanthomonas (Bonas, 1994; Collmer and Bauer, 1994; Alfano and Collmer, 1997)
(Fig. 7). In phytopathogenic bacteria components of TTSS are encoded by so called hrp genes (for
hypersensitive reaction and pathogenicity) (Lindgren et al., 1986) and they are required for
- 34 -
pathogenicity in susceptible host plants and for the elicitation of the hypersensitive response (HR)
in resistant plants that are not normally host for that particular pathogen. The HR is a defense
reaction of resistant plants consisting in a rapid cell death response to the attempted infection of an
incompatible pathogen. It is characterized by localized tissue necrosis and the production of
antimicrobial agents and phenolic compounds at the site of bacterial contact. (Klement, 1982;
Lindsay et al., 1993).
Responsible proteins for both processes have been identified in some plant pathogens (Arlat et
al., 1994; He et al., 1993; Gopalan et al., 1996; van den Ackerveken et al., 1996). Whether bacterial
infection leads to an HR or to plant disease is determined by the presence of an avirulence gene
(avr) in the pathogen and the presence, respectively the absence, of a matching dominant resistance
gene (R) in the host (Staskawicz et al., 1995; Vivian and Gibbon, 1997). In this so called gene-for-
gene hypothesis (Flor, 1971) the plant R gene encodes a receptor for the pathogen Avr protein and
their interactions is believed to trigger a signalling cascade which ultimately leads to the elicitation
of HR and cell death, which prevents further sprading of the infection in the host plant. Absence of
a compatible Avr-R pair leads to suppression of the HR or to infection (Fig. 8). It is still not clear
whether elicitor of plant disease and Avr protein may in some case be coincident, but Avr proteins
almost certainly play a role in bacterial virulence or fitness in susceptible plant hosts in the absence
of the corresponding R protein (Lorang et al., 1994; Ritter and Dangl, 1995). This is supported by
the fact that avr genes are often physically linked to hrp gene clusters as part of pathogenicity
islands (Alfano et al., 1997; Lorang and Keen, 1995) and answers to the often raised objection of
why bacteria should send avirulence into plant cell at all. It can be argued in fact that bacterial
proteins that use TTSS originally served pathogenicity functions, but that during host-pathogen
coevolution, host plants have learned to recognize some of these virulence proteins as elicitors of
their defense response (He, 1998).
- 35 -
Fig. 8. The receptor-elicitor model of gene-for-gene interactions. Only the presence of a matching pair of Avr and R
proteins results in recognition of the pathogen by the plant and in a hypersensitive reaction. The pathogen may elude
plant defenses by mutation of its Avr protein, becoming thereby invisible to plant defenses or, inversely, the plant may
recognize a new pathogen by mutation of its R protein. Alongside a non-matching Avr protein, one or more virulence
factors are required for the pathogen to produce disease symptoms in susceptible host plants.
DNA sequence analysis of the hrp/hrc regions in P. syringae pv. syringae 61, P. syringae pv.
syringae B728a, and P. syringae pv. tomato DC3000 has revealed a Hrp pathogenicity island (PAIs)
with a tripartite mosaic structure (Alfano et al., 2000). The hrp/hrc gene cluster coding for the TTSS
machinery is conserved in all three strains and is flanked by a unique exchangeable effector locus
(EEL) and a conserved effector locus (CEL) (Fig. 9). The EEL encodes diverse putative effectors
and is likely involved in fine-tuning the parasitic fitness of P. syringae strains with various plants
hosts. It contains also mobile genetic elements sequences with a significantly lower GC content
- 36 -
hrp-box: 5’- NtGGAACcg-N15-CCACNcANN -3’
Fig. 9. Schematic representation of Pseudomonas syringae pvs. syringae and tomato hrp pathogenicity island (not
drawn to scale). Arrows indicate direction of transcription, red squares indicate hrp promoters (hrp-boxes), and names
of operons (as defined by Fouts et al, 2002b) are given below putative transcriptional units. The hrc and hrp gene
designations are replaced with c and p, respectively. The consensus sequence of the hrp-box is indicated at the bottom.
Nucleotides denoted by uppercase exhibit >90% conservation, whereas nucleotides denoted by lowercase letters retain
at least 50% conservation among the surveyed hrp and avr promoters in Pseudomonas syringae pv. tomato DC3000
(Fouts et al., 2002a). Adapted from Hueck (1998) and Fouts et al (2002b).
than the rest of the hrp genes or the P. syringae genome, thereby pointing to an acquisition by the
means of HGT. The CEL carries at least seven ORFs that are conserved between P. syringae pv.
syringae B728a and P. syringae pv. tomato DC3000, and it makes no discernible contribution to
Hrp secretion but contributes strongly to parasitic fitness and is required for DC3000 pathogenicity
in tomato. In fact in DC3000 applied to tomato plants, deletion of the EEL slightly reduces bacterial
growth, whereas deletion of a large portion of the CEL strongly reduces growth and abolishes
pathogenicity.
The expression of hrp genes in P. syringae is controlled by a three component regulatory cascade
consisting of transcriptional regulators HrpR and HrpS (Hutcheson et al., 2001) which positively
control the expression of hrpL. The product of this gene, alternate sigma factor HrpL (Xiao et al.,
1994), activates the expression of hrp-operons and avr-genes by the means of a conserved promoter
element known as the hrp-box (Xiao and Hutcheson, 1994), a 34-bp fragment containing the
conserved motif GGAACC-N16-CCAC-N2-A (Fouts et al., 2002a) (Fig. 9). A summary of the
known genes belonging to the hrp/hrc gene cluster of P. syringae with the size of the corresponding
- 37 -
products, their predicted function, and the known Yersinia homolog and flagellar paralog proteins is
found in Table 1.
Although most bacteria from which TTSSs have been identified and characterized are
pathogenic, TTSSs have also been found in strains of the genus Rhizobium (Meinhardt et al., 1993;
Freiberg et al., 1997; Gottfert et al., 2001), which is an endophytic plant symbiont, where they are
required for host specificity and nodulation efficiency in leguminous plants (Bellato et al., 1997;
Viprey et al., 1998). In symbiotic Rhizobium, as in plant pathogens, the TTSS secretes factors that
modulate host metabolism and enhance, or limit, interactions between bacteria and host cells.
More recently, multiple genes belonging to the hrp cluster have been found also in P. fluorescens
SBW25 (Rainey and Bailey, 1996) and few other plant-colonizing Pseudomonas and plant-growth
promoting bacteria (PGPR) (Preston et al., 2001). PGPR strains, as plant pathogenic bacteria and
symbiotic rhizobia, also modulate host metabolism, resulting in an increased disease resistance and
improved plant growth. However, the effect of PGPR is ultimately dependent to the efficient
colonization of plant tissues and surfaces, particularly roots (O'Sullivan and O'Gara, 1992).
Although it was hypothesized that TTSSs in PGPR could serve for host specificity and colonization
similarly to what happens in Rhizobium, a correlation between plant colonization and plant growth
promotion by PGPR which involves TTSS-mediated interactions with plant cells was not yet
demonstrated (Preston et al., 2001).
Objectives and experimental approach
The general objectives of this thesis were to analyze the influence some poorly known and newly
emerging aspects of biocontrol involving the physiological status and traceability of non-culturable
pseudomonads and the possibility of the acquisition of novel biocontrol traits by lateral gene
transfer.
In the first part the conditions in which DNA is available to PCR both in culturable and non-
culturable biocontrol pseudomonads was investigated. On one side this may help to better
understand biocontrol aspects involving the physiological status of the cells and their functionality
in the rhizosphere, while at the same time it may provide an alternative quick method to monitor
cell number and the physiological status of biocontrol bacteria. Phl biosynthetic gene PhlA was
- 38 -
chosen as a target for QC-PCR and a method was developed and tested in vitro using stressed and
non-stressed P. fluorescens CHA0 cells. Different types of stress were applied to make cells
unculturable and correlation between PCR and CFU was analyzed. The role of extracellular DNA
was assessed with help of restriction enzymes, while antibiotics preventing de novo protein
synthesis and DNA supercoiling were employed to analyze entrance of cells into the VBNC status.
In the second part the presence of pathogenicity genes belonging to TTSS was investigated
among a worldwide collection of biocontrol pseudomonads using both PCR and DNA
hybridization. hrcN sequences obtained were compared to available sequences of known pathogenic
strains and data were used to build a phylogenetic tree. To understand the relationship between
TTSS in biocontrol and pathogenic pseudomonads and to explore the likelihood of potential HGTs,
the hrcN tree obtained was compared to the one derived from 16S rDNA sequences. The TTSS of P.
fluorescens KD was partially sequenced and compared to pathogenic P. syringae strains.
In the third part the impact of the recent acquisition by HGT, presumably from related
pathogenic strains, of a TTSS by P. fluorescens KD on the biocontrol activity of the strain was
analyzed. A mutant in the hrcV gene was constructed and its biocontrol performance against P.
ultimum in cucumber was investigated. Cucumber root colonization of wild type and mutant strains
were compared by colony counts. In order to understand which interactions are important for the
activation of TTSS, the promoter region controlling the hprJ-operon of KD was fused to an inaZ
reporter gene and its activity was measured both in vitro and in vivo in presence of plant and
pathogen. The effect on P. ultimum pathogenicity was assessed in vitro by measuring the production
of fungal pectinase.
- 39 -
hrp cluster ORFs P. syringae pv. syringae 61 ORF (aa)a
Yersinia homolog proteins
Flagellar paralog proteins
Predicted functionb
hrpR 305 σ54- and ATP-dependent regulator hrpS 302 Cytoplasmic transcriptional activator hrpA 108 Secreted structural component of pilus hrpB 124 YscI Cytoplasmic hrpZ 341 Secreted accessory protein hrcJ 268 YscJ FliF IM/OM, lipoprotein hrpD 133 YscK Cytoplasmic (?) hrpE 193 YscL FliH Cytoplasmic (?) hrpF 75 Cytoplasmic hrpG 130 Cytoplasmic accessory protein hrcC 701 YscC OM hrpT 67 OM accessory protein hrpV 115 Cytoplasmic negative regulator of hrp/rsp expression hrcU 359 YscU FlhB IM hrcT 264 YscT FliR IM hrcS 88 YscS FliQ IM hrcR 208 YscR FliP IM hrcQB 133 YscQ FliY/ FliN IM? hrcQA 238 FliY/ FliM IM hrpP 192 Cytoplasmic or secreted accessory protein (?) hrpO 142 Cytoplasmic or secreted accessory protein (?) hrcN 449 YscN FliI Cytoplasmic, probably membrane associated hrpQ 330 YscD FliG IM accessory protein (?) hrcV 695 LcrD FlhA IM hrpJ 346 YopN Cytoplasmic accessory protein (?) hrpL 184 Cytoplasmic ECF sigma factor, regulated by σ54 hrpK 767 Conserved structural or effector proteinc (?) hrmA (hopPsyA) 375 Hrp-secreted Avr/effector protein belonging to the EELd ORF1 112 Effector protein belonging to the EELe Table 1. Comparison of hrp cluster proteins in P. syringae pv. syringae 61 and Yersinia pestis to flagellar paralogs. aLength of predicted peptides (aa, amino acids); bPredicted function and properties of each P. syringae pv. syringae 61 protein (cytoplasmic, inner membrane associated (IM); outer membrane associated (OM); or secreted), ECF: extracytoplasmic function; adapted from Preston et al. (2001); cHrpK protein are 79% identical between P. syringae pv. syringae 61 and P. syringae pv. tomato DC3000 (Alfano et al., 2000); dExchangeable effector locus (EEL), HopPsyA is an effector protein that has avirulence activity when it is heterologously expressed in P. syringae pv. tabaci cells that are subsequently infiltrated into tobacco leaves (Alfano et al., 1997); eORF1 is similar (BLAST E-value=6·10-4) to hypothetical protein Y0008 (Accession number: AL117189) on Yersinia pestis low-Ca2+-response plasmid pCD1 (Perry et al., 1998)
- 40 -
CITED REFERENCES
1. Alfano, J. R., A. O. Charkowski, W. -L. Deng, J. L. Badel, T. Petnicki-Ocwieja, K. Van
Dijk, and A. Collmer. 2000. The Pseudomonas syringae Hrp pathogenicity island has a
tripartite mosaic structure composed of a cluster of type III secretion genes bounded by
exchangeable effector and conserved effector loci that contribute to parasitic fitness and
pathogenicity in plants. Proc. Natl. Acad. Sci. U.S.A. 97:4856-4861.
2. Alfano, J., and A. Collmer. 1997. The type III (Hrp) secretion pathway of plant pathogenic
bacteria: trafficking harpins, Avr proteins, and death. J. Bacteriol. 179:5655-5662.
3. Alfano, J. R., H. S. Kim, T. P. Delaney, and A. Collmer. 1997. Evidence that the
Pseudomonas syringae pv. syringae hrp-linked hrmA gene encodes an Avr-like protein that
acts in an hrp-dependent manner within tobacco cells. Mol. Plant-Microbe Interact. 10:580-
588.
4. Altmeyer, R. M., J. K. McNern, J. C. Bossio, I. Rosenshine, B. B. Finlay, and J. E. Galan.
1993. Cloning and molecular characterization of a gene involved in Salmonella adherence and
invasion of cultured epithelial cells. Mol. Microbiol. 7:89-98.
5. Amann, R. I., W. Ludwig, and K. H. Schleifer. 1995. Phylogenetic identification and in situ
detection of individual microbial cells without cultivation. Microbiol. Rev. 59:143-169.
6. Anderson, D., and O. Schneewind. 1997. A mRNA signal for the type III secretion of Yop
proteins by Yersinia enterocolitica. Science 278:1140-1143.
7. Andrews, G. P., and A. T. Maurelli. 1992. mxiA of Shigella flexneri 2a, which facilitates export
of invasion plasmid antigens, encodes a homolog of the low-calcium-response protein, LcrD, of
Yersinia pestis. Infect. Immun. 60:3287-3295.
8. Arlat, M., F. Van Gijsegem, J. C. Huet, J. C. Pernollet, and C. A. Boucher. 1994. PopA1, a
protein which induces a hypersensitivity-like response on specific Petunia genotypes, is
secreted via the Hrp pathway of Pseudomonas solanacearum. EMBO J. 13:543-553.
9. Audenaert, K., T. Pattery, P. Cornelis, and M. Hofte. 2002. Induction of systemic resistance
to Botrytis cinerea in tomato by Pseudomonas aeruginosa 7NSK2: Role of salicylic acid,
pyochelin, and pyocyanin. Mol. Plant-Microbe Interact. 15:1147-1156.
10. Baffone, W., B. Citterio, E. Vittoria, A. Casaroli, R. Campana, L. Falzano, and G. Donelli.
2003. Retention of virulence in viable but non-culturable Vibrio spp. Int. J. Food Microbiol.
89:31-39.
- 41 -
11. Bangera, M. G., and L. S. Thomashow. 1999. Identification and characterization of a gene
cluster for synthesis of the polyketide antibiotic 2,4-diacetylphloroglucinol from Pseudomonas
fluorescens Q2-87. J. Bacteriol. 181:3155-3163.
12. Barer, M. R., L. T. Gribbon, A. S. Whiteley, R. Smith, A. Newton, and A. G. O’Donnell.
1999. Relationships between cellular activity and culturability. In To grow or not to grow:
nonculturability revisited. C. R. Bell, M. Brylinsky, and P. Johnson-Green (eds.), Proceedings
of the 8th International Symposium on Microbial Ecology, Halifax, Canada.
13. Becker-André, M., and K. Hahlbrock. 1989. Absolute mRNA quantification using the
polymerase chain reaction (PCR). A novel approach by a PCR aided transcript titration assay
(PATTY). Nucleic Acids Res. 17:9437-9499.
14. Bellato, C., H. B. Krishnan, T. Cubo, F. Temprano, and S. G. Pueppke. 1997. The soybean
cultivar specificity gene nolX is present, expressed in a nodD-dependent manner, and of
symbiotic significance in cultivar-nonspecific strains of Rhizobium (Sinorhizobium) fredii.
Microbiology 143:1381-1388.
15. Bloemberg, G. V., and B. J. J. Lugtenberg. 2001. Molecular basis of plant growth promotion
and biocontrol by rhizobacteria. Curr. Opin. in Plant Biol. 4:343-350.
16. Bloemberg, G. V., A. H. M Wijfjes, G. E. M. Lamers, N. Stuurman, and B. J. J.
Lugtenberg. 2000. Simultaneous imaging of Pseudomonas fluorescens WCS365 populations
expressing three different autofluorescent proteins in the rhizosphere: new perspectives for
9-27 5’ GAG TTT GAT CCT GGC TCA G 3’ 5 a The sequence in boldface is the overhanging end used for the construction of the competitor. b Primers PhlA-1f and PhlA-1r enabled amplification of phlA sequences in fluorescent pseudomonads from
ARDRA groups 1 (e.g. CHA0) and 3 (e.g. F113), but not strains from ARDRA group 2 (e.g. Q2-87). No PCR
product was obtained when testing Phl-negative pseudomonads. c RAPD analysis was carried out using primer GAC or D7, as described by Keel et al. (6). d PCR with primers PSMG and 9-27 was performed as described by Johnsen et al. (5).
DNA extraction and PCR reactions. Various methods were tested to extract and amplify
DNA from CHA0. Direct amplification of cell lysate was carried out, as it proved to give
reproducible results, which were as good as when purified DNA was used (data not shown). Cell
suspensions (5 µl) were heated for 10 min at 99°C with 95 µl of lysis buffer (50 mM KCl, 10 mM
Tris-HCl pH 8.3, 0.1% Tween 20) in a PTC-100 thermal cycler (MJ Resarch, Waltham, MA).
PCR amplification was carried out in 20 µl reaction mixtures containing 4 µl of cell lysate, 4 µl of
internal standard (for QC-PCR only) and 1× PCR buffer. The latter contained 100 µM each of
2.5 × 10⁻⁴ µg/ml; right, 3.13 × 10⁻⁵ µg/ml); N, negative control (blank). Reactions yielding two bands of the same intensity are indicated by an asterisk (*).
- 64 -
Y = 1.09 X - 10.72R2 = 0.87
-7
-6
-5
-4
-3
-2
-1
00 1 2 3 4 5 6 7 8 9 10
log10 (CFU/ml) lo
g 10 (µg
com
petit
or/m
l) A
Y = 1.14 X - 11.23R2 = 0.84
-7
-6
-5
-4
-3
-2
-1
00 1 2 3 4 5 6 7 8 9 10
log10 (total cells/ml)
log 1
0 (µg
com
petit
or/m
l) B
FIG. 2. Effect of stress on the relationship between QC-PCR results and the number of CFU (A) and total cells (B) of P. fluorescens CHA0. The result of QC-PCR is represented by the concentration of competitor oligonucleotide needed to yield the same amount of amplification product as the corresponding target bacterial DNA in the reaction. Data obtained with stressed cells are represented as empty diamonds (◊) and those derived from log or stationary-phase cells (i.e. control) as black diamonds ( ). CFU are arbitrarily plotted as zero when below the detection limit (0.92 log CFU/ml). For CFU and for total cells, statistically-significant positive correlations with QC-PCR results were found when log and stationary-phase cells were considered, and regression parameters are then indicated.
- 65 -
were incubated for 2 h with 5 units (in a 30 µl volume) of restriction enzyme Sau3A I (↓GATC,
which predictively cuts 5 times in the target sequence) prior to PCR (data not shown). Yet,
elimination of extracellular DNA by Sau3A I digestion (which had no effect on cell culturability
of CHA0), was not sufficient to bring QC-PCR results down to the level of culturable cells (Fig.
3). This means that extracellular DNA could not explain the discrepancy between both types of
results. In Fig. 2B, the points for cells subjected to stress are found on both sides of the regression
line obtained in the absence of stress. One implication is that not all the DNA present in some of
the samples was amplified by PCR, although complete cell lysis took place (confirmed by
microscopy). Perhaps this was caused by a particular conformation of DNA in stressed cells.
QC-PCR in the presence of stress. No correlation was obtained when considering
samples of CHA0 cells subjected to stress, regardless of whether QC-PCR results were compared
with the number of total cells or CFU (Fig. 2). A proportion of the non-culturable cells in some of
these samples responded to Kogure’s cell elongation test (8), yielding as many as 6.2 log nutrient-
responsive (i.e. presumably viable) but non-culturable cells/ml in certain cases, but no correlation
was found between Kogure’s counts of nutrient-responsive cells (done as described previously; 3,
10) and QC-PCR results based on 31 stress samples studied (data not shown).
In Fig. 2A, most of the points derived from stress situations are located left of the
regression line obtained in the absence of stress, meaning that cell numbers estimated by QC-PCR
were higher than CFU. This excess DNA might have belonged to non-culturable cells (including
dead cells) and/or corresponded to extracellular DNA (probably released by natural lysis of dead
cells). The presence of extracellular DNA was indicated by the fact that cell-free samples obtained
by filtration through a 0.2 µm Minisart-plus membrane (Sartorius, Göttingen, Germany) still
enabled PCR amplification of phlA, whereas no amplification took place when cell-free samples
were incubated for 2 h with 5 units (in a 30 µl volume) of restriction enzyme Sau3A I (↓GATC,
which predictively cuts 5 times in the target sequence) prior to PCR (data not shown). Yet,
elimination of extracellular DNA by Sau3A I digestion (which had no effect on cell culturability
of CHA0), was not sufficient to bring QC-PCR results down to the level of culturable cells (Fig.
3). This means that extracellular DNA could not explain the discrepancy between both types of
results. In Fig. 2B, the points for cells subjected to stress are found on both sides of the regression
line obtained in the absence of stress. One implication is that not all the DNA present in some of
- 66 -
the samples was amplified by PCR, although complete cell lysis took place (confirmed by
microscopy). Perhaps this was caused by a particular conformation of DNA in stressed cells.
-7
-6
-5
-4
-3
-2
-1
00 1 2 3 4 5 6 7 8 9 10
log10 (CFU/ml) lo
g 10 (µg
com
petit
or/m
l)
A
-7
-6
-5
-4
-3
-2
-1
00 1 2 3 4 5 6 7 8 9 10
log10 (total cells/ml)
log 1
0 (µg
com
petit
or/m
l)
B
FIG. 3. Contribution of extracellular DNA to QC-PCR results and comparison of the latter with the number of CFU
(A) and total cells (B) of P. fluorescens CHA0 exposed to CuSO4 stress (n = 18 samples). In each case, half the
sample was digested with Sau3A I to eliminate extracellular DNA (indicated by a plus sign; +), whereas the other half
was not digested (represented as empty diamond; ◊). CFU are arbitrarily plotted as zero when below the detection
limit (0.92 log CFU/ml). The line of best fit for control samples obtained in Fig. 2 is also represented.
- 67 -
TABLE 2. Effect of chloramphenicol (200 µg/ml) and ciprofloxacin (20 µg/ml) on survival (CFU) and PCR amplification of
P. fluorescens CHA0 (used at 7.7 log CFU/ml) incubated at pH 7 (control) or pH 4 (acidity stress)
pH 7 pH 4
No antibiotic Chloramphenicol Ciprofloxacin No antibiotic Chloramphenicol Ciprofloxacin
0.5 h 4 h 1 d 0.5 h 4 h 1 d 0.5 h 4 h 1 d 0.5 h 4 h 1 d 0.5 h 4 h 1 d 0.5 h 4 h 1 d
RAPD GAC (+) + ++ (+) + ++ + + + 0 0 0 0 0 0 0 0 0 a Mean ± standard deviation. b Efficiency of PCR amplification was rated as follows: 0, no amplification; (+), weak or non-specific amplification; +, normal amplification; ++, strong amplification. c BD, below detection (detection limit = 0.92 log CFU/ml). d From 0 to 2 colonies recovered per plate.
- 68 -
Effect of antibiotics affecting DNA conformation and packing. Oliver and Warner (12) have
shown that the loss of RAPD signal in starved Vibrio vulnificus, presumably linked to
modifications in DNA packing and conformation, could be prevented by inhibiting de novo
protein synthesis using chloramphenicol or DNA supercoiling using ciprofloxacin. Incubation of
CHA0 cells in the presence of either antibiotics had no effect on phlA PCR efficacy at pH 7, even
in the case of ciprofloxacin which caused loss of colony-forming ability. The phlA PCR signal
disappeared shortly after exposure of cells to pH 4, along with a decrease in the number of
culturable cells, even when chloramphenicol or ciprofloxacin was used. Similar results were
obtained when amplifying rrs instead of phlA, or performing RAPD analysis (Table 2). In
summary, the two antibiotics were unable to prevent the disappearance of the PCR signals under
acidic stress.
Search for cytoplasmic PCR inhibitors. Another explanation for the incomplete PCR
amplification might be the presence of cytoplasmic PCR inhibitors released during PCR lysis of
stressed cells. To test this hypothesis, CHA0 samples from pH 7 cultures were mixed with pH 4
CHA0 samples, either before or after having implemented cell lysis, and PCR was performed. No
significant loss of PCR amplification was found (Fig. 4), ruling out the hypothesis. In fact, the
same fading of the PCR signal observed when increasing progressively the relative proportion of
pH 4 samples, from 50:50 up to a 1:99 vol/vol ratio, was obtained when using water or pH 4
buffer instead (data not shown).
M 1 2 3 4 5 6 7 8 9 M FIG. 4. PCR amplificaton of phlA gene in P. fluorescens CHA0 (cells from one-day-old cultures; used at 7.7 log CFU/ml) following the addition (50:50 vol/vol) of cell samples obtained after incubation for one day at pH 4 (2.09 ± 0.36 log CFU/ml). M, 100-bp ladder; 1, pH 7 cells; 2, pH 4 cells; 3, pH 7 cells and pH 4 cells mixed before lysis; 4, pH 7 cells and pH 4 cells mixed after lysis; 5, pH 4 cells and pH 7 buffer mixed before lysis; 6, pH 7 cells and pH 4 buffer mixed before lysis; 7, pH 7 buffer; 8, pH 4 buffer; 9, water blank. Identical results were obtained when PCR was performed after DNA purification of pH 7 and pH 4 samples (cell lysates) by direct ethanol precipitation (16) or phenol:chloroform:isoamyl alcohol extraction (followed by precipitation with one volume of 2M NaCl and two volumes of ice-cold 95% ethanol) instead of using cell lysates directly (data not shown). Each treatment was replicated at least four times.
- 69 -
DISCUSSION
Successful detection of P. fluorescens CHA0 by PCR depended strongly on the physiological
state of the cells, and QC-PCR gave affordable results in vitro only when applied to samples
where most CHA0 cells where culturable. When cells were stressed, the amount of DNA
estimated by QC-PCR was higher than the total amount of DNA present in culturable cells, which
at least in the case of CuSO4 stress was likely due to the contribution of non-culturable cells rather
than that of extracellular DNA. However, the amount of DNA estimated by QC-PCR did not
necessarily correspond to that present in all CHA0 cells either, and the loss of amplification
efficacy following stress was not due to PCR inhibitors synthesized by stressed cells. Overall, it
appears that stress affected negatively the ability of cell DNA to be amplified by PCR. These
findings may limit the usefulness of PCR amplification to monitor pseudomonads in stressful
environments (e.g. bulk soil). They have also implications when studying the genetic diversity of
bacterial communities by culture-independent methods, which often take for granted that DNA
can be equally amplified from cells of different taxonomic and/or physiological status.
ACKNOWLEDGEMENTS
We thank Fabio Mascher and Carsten Hase for helpful discussion. This work was supported by
the Swiss Biotechnology SPP (project 5002-04502311), the Swiss Federal Office for Education
and Science (COST Action 830), the Fachverein für Arbeit und Umwelt (FAU, Zürich), and the
French Embassy in Switzerland (France-Switzerland research grant).
- 70 -
CITED REFERENCES
1. Celi, F. S., M. E. Zenilman, and A. R. Shuldiner. 1993. A rapid and versatile method to
synthesize internal standards for competitive PCR. Nucleic Acid Res. 21:1047.
2. Défago, G., C. Keel, and Y. Moënne-Loccoz. 1997. Fate of released Pseudomonas bacteria
in the soil profile: Implications for the use of genetically-modified microbial inoculants, p.
403-418. In J. T. Zelikoff, J. M. Lynch, and J. Shepers (ed.), Ecotoxicology: responses,
biomarkers and risk assessment. SOS Publications, Fair Heaven, NJ.
3. Hase, C., F. Mascher, Y. Moënne-Loccoz, and G. Défago. 1999. Nutrient deprivation and
the subsequent survival of biocontrol Pseudomonas fluorescens CHA0 in soil. Soil Biol.
Biochem. 31:1181-1188.
4. Hase, C., M. Hottinger, Y. Moënne-Loccoz, and G. Défago. 2000. Survival and cell
culturability of biocontrol Pseudomonas fluorescens CHA0 in the rhizosphere of cucumber
grown in two soils of contrasting fertility status. Biol. Fertil. Soils 32:217-221.
5. Johnsen, K., O. Enger, C. S. Jacobsen, L. Thirup, and V. Torsvik. 1999. Quantitative
selective PCR of 16S ribosomal DNA correlates well with selective agar plating in describing
population dynamics of indigenous Pseudomonas spp. in soil hot spots. Appl. Environ.
Microbiol. 65:1786-1789.
6. Keel, C., D. M. Weller, A. Natsch, G. Défago, R. J. Cook, and L. S. Thomashow. 1996.
Conservation of the 2,4-diacetylphloroglucinol biosynthesis locus among fluorescent
Pseudomonas strains from diverse geographic locations. Appl. Environ. Microbiol. 62:552-
563.
7. King, E. O., M. K. Ward, and D. E. Raney. 1954. Two simple media for the demonstration
of pyocyanin and fluorescein. J. Lab. Clin. Med. 44:301-307.
8. Kogure, K., U. Simidu, and U. Taga. 1979. A tentative direct microscopic method for
counting living marine bacteria. Can. J. Microbiol. 25:415-420.
9. Li, W. and M. A. Drake. 2001. Development of a quantitative competitive PCR assay for
detection and quantification of Escherichia coli O157:H7 cells. Appl. Environ. Microbiol.
67:3291-3294.
- 71 -
10. Mascher, F., C. Hase, Y. Moënne-Loccoz, and G. Défago. 2000. The viable-but-
nonculturable state induced by abiotic stress in the biocontrol agent Pseudomonas fluorescens
CHA0 does not promote strain persistence in soil. Appl. Environ. Microbiol. 66:1662-1667.
11. Natsch, A., C. Keel, H. A. Pfirter, D. Haas, and G. Défago. 1994. Contribution of the global
regulator gene gacA to persistence and dissemination of Pseudomonas fluorescens biocontrol
strain CHA0 introduced into soil microcosms. Appl. Environ. Microbiol. 60:2553-2560.
12. Oliver, J. D., and J. M. Warner. 1998. Randomly amplified polymorphic DNA analysis of
starved and viable but nonculturable Vibrio vulnificus cells. Appl. Environ. Microbiol.
64:3025-3028.
13. Sambrook J., E. F. Fritsch, and T. Maniatis. 1989. Molecular cloning. A laboratory manual
(2nd edn). Cold Spring Harbor Laboratory Press, Cold Spring Harbor, NY.
14. Schnider-Keel, U., A. Seematter, M. Maurhofer, C. Blumer, B. Duffy, C. Gigot-
Bonnefoy, C. Reimmann, R. Notz, G. Défago, D. Haas, and C. Keel. 2000. Autoinduction
of 2,4-diacetylphloroglucinol biosynthesis in the biocontrol agent Pseudomonas fluorescens
CHA0 and repression by the bacterial metabolites salicylate and pyoluteorin. J. Bacteriol.
182:1215-1225.
15. Troxler, J., M. Zala, A. Natsch, Y. Moënne-Loccoz, C. Keel, and G. Défago. 1997b.
Predominance of nonculturable cells of the biocontrol strain Pseudomonas fluorescens CHA0
in the surface horizon of large outdoor lysimeters. Appl. Environ. Microbiol. 63:3776-3782.
16. Wang, C., E. Knill, B. Glick, and G. Défago. 2000. Effect of transferring 1-
aminocyclopropane-1-carboxylic (ACC) deaminase genes into Pseudomonas fluorescens
strain CHA0 and its gacA derivative CHA96 on their growth-promoting and disease-
suppressive capacities. Can. J. Microbiol. 46:898-907.
E. amylovora 22716 Apple (fire blight) Apple CH + This study
E. amylovora 22770 Pear (fire blight) Pear CH + + This study
E. amylovora 23482 Pyracantha (fire blight) Firethorn CH + This study
X. campestris ATCC 33913 Rutabaga (not documented) Rutabaga USA + 44 a The corresponding pathogens are Eca, Erwinia carotovora subsp. carotovora; FORL, Fusarium oxysporum f. sp. radicis-lycopersici; Ggt, Gaeumannomyces graminis
var. tritici; Mp, Magnaporthe poae; Ps, Phomopsis sclerotioides; Pu, Pythium ultimum; Rs, Rhizoctonia solani; St, Septoria tritici; Tb, Thielaviopsis basicola. b All biocontrol pseudomonads were isolated from macerated roots or roots previously washed of soil. c CH, Switzerland; CzR, Czech Republic; TX, Texas; UK, United Kingdom; WA, State of Washington.
- 81 -
MATERIAL AND METHODS
PCR amplification and sequencing of hrcN. The hrcN sequences of P. syringae pv. tomato
DC3000 (accession number AF232004) and Erwinia amylovora strain CNPB136 (L25828) were
aligned using LAlign software (26). The consensus sequence was used to design the degenerate
20-mer primers hrcN-5rR (forward) and hrcN-4r (reverse) (Table 2 and Fig. 1A). Primers were
synthesized by MWG Biotech (Münchenstein, Switzerland).
The bacteria used in this study (Table 1) were grown at 27°C on King’s B agar (31) or Luria
Bertani (LB) agar (54). PCR amplification was carried out in 20-µl reaction mixtures containing
5 µl of cell lysate (for pseudomonads), which was obtained by heating the cultures for 10 min at
99°C with 95 µl of lysis buffer (50 mM KCl, 10 mM Tris-HCl pH 8.3, 0.1% Tween 20) in a
PTC-100 thermal cycler (MJ Resarch, Waltham, MA), or 200 pg of genomic DNA of E.
amylovora strains 22716, 22770 and 23482 (DNA kindly provided by E. Holliger, FAW
Wädenswil, Switzerland). PCR was performed in 1× PCR buffer containing of 100 µM each of
dATP, dCTP, dGTP, and dTTP, 0.07 U of Taq polymerase (Amersham Pharmacia Biotech,
Piscataway, NJ) per µl, and 0.20 µM of each primer, with an initial denaturation of 5 min at
95°C, followed by 30 cycles of 30 s at 95°C, 30 s at 60°C, and 1 min at 72°C, then a final
elongation of 10 min at 72°C. The size of PCR products was checked by electrophoresis in 1.5%
agarose.
PCR amplicons were purified from PCR mix by washing twice with 100 µl double distilled
water (ddH2O) on a MultiScreen PCR Plate (Millipore, Molsheim, France), resuspended in 30 µl
ddH2O and visually quantified in agarose gel. The cycle sequencing reaction was performed with
3 to 10 ng of purified PCR product using the ABI PRISM BigDye Terminators v3.0 Cycle
Sequencing Kit (Applied Biosystems, Foster City, CA), according to the manufacturer’s
instructions, and primers hrcN-4r and hrcN-5rR each at a final concentration of 0.16 µM. Cycle
sequencing products were cleaned through water-swelled Sephadex G-50 columns (Amersham
Biosciences, Uppsala, Sweden) on MultiScreen HV plates (Millipore) and sequenced on an ABI
PRISM 3100 Genetic Analyzer. Sequences were obtained for 43 strains and they are available at
the NCBI database at accession numbers AY456994 to AY457036 (listed in Fig. 2). The identity
of the sequenced fragments was analyzed by BLASTN comparison with known sequences.
Q13-87 (AY457033), K94.08 (AY457034), PILH1 (AY457035) and P. syringae ATCC19310 (AY457036), and for
E. amylovora 22716 (AY456995), 22770 (AY456996) and 23482 (AY456997). The G+C content of the hrcN
fragment studied was 58.3 ± 2.5 % for the Erwinia cluster (n = 5), 60.4 ± 2.0 % for the cluster (n = 9) comprised of
established/putative pathogenic pseudomonads and strain KD (itself at 60.6%), and 61.7 ± 1.0 % for the cluster (n =
33) gathering all biocontrol pseudomonads (but KD) and the saprophytic pseudomonad P3. The values for the latter
two clusters were significantly different (Mann-Whitney test; P < 0.05).
- 90 -
PILH1
Q2-87
Q12-87
P3
Q86-87
PITR2
Q1-87
Q4-87
Q7-87
Q9-87
Q13-87
C*1A1
Q107-87
Q128-87
TM1'A4
K94.23
K94.31
TM1'A5
Q65c-80
CM1'A2
Q95-87
P97.30
TM1B2
Q139-87
TM1A3
P12
F113
Q37-87
K92.46
P97.38
K94.14
2-79
K94.08
P.syringae pv. phaseolicola
P.caricapapayae LMG2152
P.syringae pv. tomato DC3000
KD
P.syringae ATCC19310
BE08
VS02
VS01
BE07
E.herbicola
E.amylovora 22716
E.amylovora 23482
E.amylovora
E.amylovora 22770
X.campestris pv. campestris ATCC33913
R.solanacearum
fliI of P.putida KT2440
99
100
98
97
53
87
95
99
100
93
78
94
72
99
59
96
99
99
57
5354
95
66
0.05 Fig. 2
Group 1
Group 2
Group 3
Group 4
Group 5
Group 6
Group 7
Group 10
hrcN groups
Group 8
Group 9
Biocontrol pseudomonads
Biocontrol pseudomonad
Biocontrol pseudomonads
Saprophytic pseudomonad
Pathogenic pseudomonads
Pathogenic and putative pathogenic pseudomonads
- 91 -
P.syringae pv. phaseolicola
P.caricapapayae LMG2152
P.syringae pv. tomato DC3000
KD
P.syringae ATCC19310
BE08
VS02
VS01
BE07
97
52
84
95
0.02
P.syringae pv. phaseolicola
P.caricapapayae LMG2152
P.syringae pv. tomato DC3000
P.syringae ATCC19310
VS02
BE08
VS01
BE07
KD
92
52
63
95
5
P.syringae pv. phaseolicola
P.caricapapayae LMG2152
P.syringae pv. tomato DC3000
KD
P.syringae ATCC19310
BE08
VS02
VS01
BE07
99
64
53
70
98
99
0.02
P.syringae pv. phaseolicola
P.caricapapayae LMG2152
P.syringae pv. tomato DC3000
KD
P.syringae ATCC19310
BE08
BE07
VS01
VS02
90
58
71
65
86
95
5 Fig. 3. Relationship between the biocontrol Pseudomonas sp. KD and pathogenic (or putative pathogenic) pseudomonads within the P. syringae cluster obtained via
phylogenetic analysis of TTSS sequences. All trees were constructed using the full collection of strains listed in Fig. 2, but only the P. syringae cluster is shown here. Trees
were obtained from partial hrcN sequences using the NJ (A) or MP (B) methods and the flagellar ATPase gene fliI of P. putida KT2440 as the outgroup, and from deduced
HrcN sequences using the NJ (C) or MP (D) methods and FliI of P. putida KT2440 as the outgroup. The JC formula was used for nucleotidic sequences and the Poisson
correction for deduced amino acid sequences. Nodal supports were assessed by 1000 bootstrap replicates, and only bootstrap values greater than 50% are shown. The scale
bars represent the number of substitutions per site (NJ) or the number of changes (MP).
A – hrcN (NJ) B – hrcN (MP)
C – HrcN (NJ) D – HrcN (MP)
- 92 -
sequences, and the number of amino acid substitutions per site was less than 0.049 within the
groups. Mainly two hrcN groups (i.e. groups 2 and 3) were evidenced. Group 2 gathered mostly
biocontrol pseudomonads isolated from wheat in Washington State, along with a wheat isolate
from Italy (strain PITR2) and another monocot strain (i.e. the barley isolate P3, which has no
biocontrol activity). Group 3 included biocontrol strains from wheat, cucumber or tomato, which
originated from Washington State, Switzerland and the Czech Republic. Several groups were
comprised of a single strain. These results were strongly supported by MP or ML analysis of
hrcN and analysis of deduced HrcN sequences (NJ or MP method).
TABLE 3. Relationship between hrcN, phlD, hcnBC and RAPD groups for HCN+ Phl+ biocontrol pseudomonadsa
hrcN group and corresponding strains phlD group hcnBC group RAPD group
P97.38 PhlD8 Hcn-3 ND a phlD, hcnBC and RAPD groups were determined respectively by Wang et al. (64), Ramette et al. (51) and Keel et al. (30). b These strains produced the same phlD restriction pattern (HaeIII) as PhlD3 strain Q2-87, but phlD was not sequenced
(unlike in Q2-87). c These strains produced the same phlD restriction pattern (HaeIII) as PhlD4 strains TM1A3, TM1B2 and C*1A1, but phlD
was not sequenced (unlike in TM1A3, TM1B2 and C*1A1). d Not determined.
- 93 -
Certain strains used in this work can produce the biocontrol metabolites HCN and/or Phl and
have been compared based on hcnBC or phlD properties (50, 51, 64). Here, a relationship was
found between hrcN groups and previous Pseudomonas biocontrol groups derived from the
analysis of hcnBC, phlD or RAPD markers (Table 3). For instance, hrcN group 2 gathered strains
belonging to groups PhlD3/Hcn-3 and PhlD7/Hcn-2, whereas hrcN group 3 included strains from
groups PhlD4 (or PhlD2) and Hcn-1. This relationship was not perfect, as for example certain
strains from hrcN groups 1, 2 and 4 belonged to a single hcnBC group (i.e. Hcn-2). When
comparing hrcN groups and rrs properties, it appeared that hrcN group 1 was only found in the
rrs-defined “P. chlororaphis” complex (Fig. 2 and 4). Within the “P. fluorescens” complex, hrcN
groups 2, 4, 5, 7 and 10 were associated with the P. corrugata/P. brassicacearum cluster and
hrcN group 9 with the P. marginalis/P. fluorescens cluster, but hrcN group 3 was found in both
clusters.
Fig. 4. Phylogenetic relationships based on 16S rDNA sequences between biocontrol fluorescent pseudomonads and reference bacteria belonging to the genera Pseudomonas and Erwinia. The distance tree was generated by the NJ method with the JC formula, using X. campestris pv. campestris ATCC33913 (accession number AE012540) as the outgroup. Nodal supports were assessed by 1000 bootstrap replicates. Only bootstrap values greater than 50% are shown. The scale bar represents the number of substitutions per site. The “P. chlororaphis”, “P. fluorescens”, “P. syringae” and “P. aeruginosa” complexes were those defined in Anzai et al. (5). Strains for which the hrcN sequence is available are marked by a full diamond ( ) for new sequences or an empty diamond ( ) for hrcN sequences already published (NCBI). The two strains positive by hrcN hybridization but hrcN–negative by PCR are marked by a full circle ( ). Sequences were obtained in this work for Pseudomonas strains KD (accession number AY456697), VS01 (AY456698), VS02 (AY456699), BE07 (AY456700), BE08 (AY456701), K92.46 (AY456702), K94.08 (AY456703), K94.14 (AY456704), K94.23 (AY456705), P3 (AY456706), P97.26 (AY456707), SBW25 (AY456712) and PILH1 (AY456708), and for E. amylovora 22716 (AY456709), 22770 (AY456710) and 23482 (AY456711). The other sequences used were for pseudomonads CHA0 (AJ278812), Q2-87 (AJ278813), F113 (AJ278814), CM1’A2 (AJ417068), Q37-87 (AJ417069), PGNR1 (AJ417071), Pf-5 (AJ417072), PF (AJ417073), Q65c-80 (AJ417074), DR54 (AY622219), Pf1 (AY622220), P. chlororaphis ATCC13985 (AF094722) and IFO3904 (D86004), P. aureofaciens (Z76656), P. corrugata 2172 (= strain ATCC29736) (D84012), P. brassicacearum (AF100322), P. marginalis (AB021401), P. fluorescens IAM12022 (D84013), P. gessardii (AF074384), P. rhodesiae (AF064459), P. veronii (AB056120), P. caricapapayae ATCC33615 (D84010), P. syringae pv. phaseolicola (AB001448), ATCC19310 (D84026), pv. tomato DC3000 (AE016875) and pv. syringae FG11 (AY242068), P. putida KT2440 (AE016775), ATCC17642 (AF094744) and IAM1236 (D84020), P. flavescens B62 (V01916), P. straminea (D084023), P. mendocina (D84016), P. pseudoalcaligenes (Z76675), P. oleovorans (D84018), P. alcaligenes (Z76653), P. resinovorans (Z76668), P. aeruginosa PAO1 (AE004844) and ATCC15442 (AF094718), P. thermaerum (AB088116), and for E. herbicola (U80202), E. amylovora BC201 (AF141892) and BC224 (AF140339).
- 94 -
PILH1
P.aureofaciens
P.chlororaphis ATCC13985
P.chlororaphis IFO3904
P.corrugata 2172
P97.26
F113
Q2-87
Q37-87
K92.46
CM1'A2
Q65c-80
K94.14
KD
P.brassicacearum
P.marginalis
DR54
P.gessardii
P.fluorescens IAM12022
K94.08
P.rhodesiae
K94.23
BE08
SBW25
P.veronii
Pf1
PGNR1
CHA0
PF
Pf-5
P.caricapapayae ATCC33615
P.syringae pv. phaseolicola
P.syringae ATCC19310
P.syringae pv. tomato DC3000
P.syringae pv. syringae FG11
VS01
VS02
P.putida ATCC17642
P.putida KT2440
P3
P.putida IAM1236
P.flavescens B62
P.straminea
BE07
P.mendocina
P.pseudoalcaligenes DSM50018T
P.oleovorans
P.alcaligenes
P.resinovorans
P.aeruginosa ATCC15440
P.aeruginosa PAO1
P.thermaerum
E.herbicola
E.amylovora BC201
E.amylovora BC224
E.amylovora 22716
E.amylovora 23482
E.amylovora 22770
X.campestris pv. campestris ATCC33913
55
95
100
100
100
69
64
51
96
89
64
56
73
8261
59
82
99
99
100
97
6373
94
77
5796
82
86
86
80
82
73
66
0.02 Fig. 4
“P.fluorescens” complex
P.putida
“P.aeruginosa” complex
“P.syringae” complex
ARDRA 1 group
“P.chlororaphis” complex
- 95 -
Organization of TTSS genes in biocontrol Pseudomonas sp. KD. Pseudomonas sp. KD was
the only biocontrol strain for which an incongruence was found when comparing hrcN and rrs
trees. If the horizontal gene transfer hypothesis is valid for this strain, it can be anticipated that in
addition to having a similar hrcN allele strain KD would display the same organization of TTSS
genes as in P. syringae. Therefore, the organization of TTSS genes was investigated in
Pseudomonas sp. KD. This was carried out using a hrcV probe derived from E. amylovora
CNPB136 (as described by Stuber et al., 58) and that as expected hybridised with E. amylovora
CNPB136 and Erwinia chrysanthemi (data not shown). A positive response was observed with
strain KD (and with the hrcN+ biocontrol pseudomonads K92.46 and K94.14).
In strain KD, the hrcV probe hybridized with a PstI fragment of approximately 1.7 kb in size,
which was subsequently cloned in plasmid pUK21 and sequenced. The insert was verified by
digestion with PstI and dot-blot hybridization to the hrcV probe, and its size determined as 1718
bp based on sequencing results. The insert corresponded to a region including the last 219 bp of
hrpJ and the first 1503 bp of hrcV, with the two genes overlapping over 4 bp (Fig. 5). The
plasmid was named pCBTypeIII.
Several degenerate PCR primer sets were designed (Table 2) based on sequence alignment of
TTSS genes from P. syringae pv. tomato DC3000 and E. amylovora CNPB136, and they were
tested in strain KD at twelve different annealing temperatures between 52°C and 66°C. Fragment
KD-vq (990 bp; Fig. 5) was obtained with primers pKD2cV-1r and hrpQ-1rR, using an annealing
temperature (Tm) of 60°C. Fragment KD-n (902 bp) was obtained with primers hrcN-1r and
hrcN-5rR at Tm = 62°C, and fragment KD-vn (2816 bp) with primers pKD2cV-1r and hrcN-3rR
at Tm = 58°C. Assembled together, the three PCR amplicons and the 1718-bp PstI fragment from
pCBTypeIII yielded a 4499-bp sequence spanning from hrpJ to hrcN, which was homologous to
the corresponding region on the hrpJ operon of P. syringae pv. tomato DC3000 (Fig. 5). This
hrpJ operon is a 5651-bp long regulation unit, which includes hrpJ, hrcV, hrpQ, and hrcN.
Other primers (Table 2) were used to sequence upstream of the PstI fragment and recover the
remaining 897 bp of hrpJ. Fragment KD-j (1446 bp) was obtained with primers prottss-1r and
T3f2 at Tm = 62°C and fragment KD-l (1242 bp) with primers T3r8 and T3f5 at Tm = 63°C (Fig.
5E). The presence of an open reading frame homologous (61.5% nucleotide identity) to the hrpL
- 96 -
Fig. 5. Comparison of the organization of TTSS genes in the biocontrol strain Pseudomonas sp. SBW25 (A), the
phytopathogen P. syringae pv. tomato DC3000 (B), and the biocontrol strain Pseudomonas sp. KD (accession
number AY463491) (C), along with levels of nucleotide and amino acid sequence identity between strains DC3000
and KD (D) and the position of PCR primers used for sequencing (E). In A, B and C, the length of each gene (bp) is
shown below its name, one gene (i.e. hrcN) being sequenced only partially (indicated by an asterisk (*)). The length
of non-coding, intergenic gaps is indicated underlined. The number of bases shared by overlapping genes is indicated
between parentheses. The arrows above the genes represent the operons and the direction in which they are
transcribed in DC3000. The white triangles indicate the position and orientation of the hrp transcription boxes. In E,
the position and direction of primers used for sequencing are indicated by black triangles. The hash sign (#) displays
the position of the hrcN-4r/-5rR fragment used for phylogenetic analysis.
gene of DC3000 was demonstrated. hrpL encodes a TTSS-specific sigma factor necessary for
recognition of hrp boxes and transcription of the corresponding TTSS genes.
- 97 -
Overall, it appears that the TTSS region studied in Pseudomonas sp. KD is organized in a
similar manner in P. syringae pv. tomato DC3000 and in Pseudomonas sp. SBW25 and KD,
except that in SBW25 part of the hrpJ operon is absent (Fig. 5A). Both for DNA and deduced
protein sequences, the identity levels between strains KD and DC3000 varied according to the
TTSS gene considered (Fig. 5D). With strain SBW25, comparisons could only be made for hrpL,
and the identity levels were higher between KD and DC3000 (61.5% for nucleotides, 46.0% for
amino acids) than between KD and SBW25 (56.2% for nucleotides, 40.5% for amino acids). In
contrast, the genes or sequences downstream of hrpL were different in the three strains. This
position is often occupied by effector genes, which are usually poorly conserved (2, 11).
DISCUSSION
In this work, hrcN was found in about 60% of the biocontrol pseudomonads studied. The gene
is absent from Pseudomonas sp. SBW25 (which was confirmed here), a strain that nevertheless
contains other TTSS genes (47). One prominent group of biocontrol pseudomonads gathers
strains producing HCN, Phl and Plt (previously designated group ARDRA 1; 30), and nine of ten
strains studied from this group were hrcN-negative. PCR on the ten strains also failed when using
alternative PCR primers or targeting other TTSS genes. This indicates that TTSS is mostly absent
from this phylogenetic group.
For a majority of hrcN+ biocontrol strains, the hrcN and rrs trees were largely congruent,
which means that hrcN has evolved in parallel with rrs and diverged sometimes in the past in the
corresponding taxa, rather than resulting from recent gene transfer. In this context, the hrcN
alleles of most biocontrol pseudomonads differed clearly from those found in phytopathogenic
counterparts where, at least for P. syringae pathovars, the hrp gene cluster is considered to be
ancestral (55). Two main groups of non-pathogenic pseudomonads were defined based on the
hrcN tree (Fig. 2). Considering within each of these two groups the geographic origin of the
strains, it appears that both groups displayed a cosmopolitan distribution worldwide. One of them
was only comprised of monocot isolates, which might have ecological implications in terms of
adaptation to the plant, whereas the other gathered pseudomonads from monocots and dicots.
The ability to produce biocontrol metabolites e.g. HCN and Phl is widespread in biocontrol
pseudomonads, and many strains included here have also been analyzed based on hcnBC and
- 98 -
phlD sequences (50, 51). In the current work, a relationship could be found to some extent
between the hrcN phylogeny and those based on phlD or hcnBC. The existence of this
relationship can be explained by the fact that the phlD, hcnBC and rrs phylogenies were highly
congruent to one another, which is also illustrated by the relationship between hrcN, phlD,
hcnBC and RAPD groups (Table 3).
In Pseudomonas spp., the 16S rDNA-based phylogeny can be considered as the species
phylogeny (e.g. 5, 40). Based on this assumption, incongruent results were obtained for four
strains (BE07, BE08, P3 and KD) when comparing the hrcV and rrs trees, which raises the
possibility of lateral gene transfer. This did not come as a surprise, as it is established that TTSS
genes are often present in pathogenicity islands, which are prone to lateral gene transfer (38).
Strains BE07 and BE08 clustered with P. syringae based on hrcN phylogeny. Strain BE07 is
probably a pathogen since it was isolated from a sugarbeet disease lesion and displays 98.4% rrs
identity with the walnut blight canker isolate Pseudomonas flavescens B62 (24) (accession
number U01916), which is distinct from P. syringae. Therefore, this finding points to lateral
transfer of TTSS genes between different pathogenic Pseudomonas species. The status of strain
BE08 is less clear because the closest relatives of this sugarbeet disease lesion isolate are
bioremediation strains from Pseudomonas veronii (1) (99.5% rrs identity; accession number
AB056120) and biocontrol pseudomonads (including the hypersensitive response-inducing strain
SBW25), both types of bacteria belonging to the “P. fluorescens” complex. P. putida P3, which
contains also hrcV (data not shown), clustered with biocontrol strains of the “P. fluorescens”
group based on hrcN, but the bacterium has no biocontrol capacity.
The case of Pseudomonas sp. KD is of particular interest since it was the only biocontrol
strain that clustered among P. syringae pathogens in the hrcN tree. Strain KD belongs to the “P.
fluorescens” complex. It produces HCN and siderophore(s) but not Phl or Plt, and efficiently
suppresses Pythium ultimum on cucumber and Fusarium oxysporum f. sp. radicis-lycopersici
(FORL) on tomato (56). Although it can be hypothesised that this biocontrol bacterium has
acquired TTSS gene(s) from P. syringae, no plasmid was found in strain KD using alkaline lysis
(54), Wizard Plus SV Minipreps DNA Purification System (Promega), or QIAGEN Plasmid
Maxi and Mega Kits (QIAGEN), indicating that hrcN is chromosomal. Despite the presence of P.
syringae-like TTSS gene(s), this strain did not elicit a hypersensitive response in tobacco or
cucumber (data not shown) and is not known to cause any plant disease. When additional TTSS
- 99 -
genes were sought in strain KD, it appeared that unlike in Pseudomonas sp. SBW25 (i) other
TTSS genes such as hrpQ were present and (ii) the organization of the oprJ operon was the same
as in P. syringae. Thus, it is conceivable that KD acquired several TTSS genes, or even a whole
pathogenicity island, from P. syringae. The position of KD within the P. syringae cluster differed
somewhat in the MP hrcN tree compared with the two other hrcN trees and the MP HrcN tree,
which might correspond to a long-branch attraction (LBA) artefact (13).
This work was based on the assumption that gene transfer took place from phytopathogenic to
biocontrol bacteria rather than the other way around, because individual pathogens were never
found within biocontrol clusters in the TTSS trees, despite the fact that all available hrcN
sequences from phytopathogens were considered. In contrast, one biocontrol pseudomonad
(strain KD) clustered with pathogenic counterparts. However, it must be kept in mind that very
little has been done to date to analyze the organization and role of TTSS in plant-beneficial
bacteria, and this area deserves further work. For instance, when estimating the numbers of non-
synonymous substitutions per non-synonymous site (dN) and synonymous substitutions per
synonymous site (dS) for hrcN, using the Kumar method (41) under MEGA, it appeared that dS
was significantly greater (Fisher-Exact tests) than dN, both for pathogenic pseudomonads (0.314
± 0.070 versus 0.022 ± 0.008) and biocontrol pseudomonads (0.218 ± 0.039 versus 0.031 ± 0.008
for hrcN groups 1-9, i.e. without KD; and 0.250 ± 0.043 versus 0.045 ± 0.009 for hrcN groups 1-
10, i.e. when KD was included). For comparison, dS and dN values for the five Erwinia strains
studied were 0.246 ± 0.077 and 0.042 ± 0.014, respectively. These results indicate that hrcN is
subjected to purifying selection in both types of pseudomonads, pointing to an important
ecological role played by this gene in biocontrol pseudomonads, as it does in pathogenic strains.
Accordingly, the TTSS gene rscC/hrcC is expressed in Pseudomonas sp. SBW25 (in the
rhizosphere (48)), and preliminary results obtained using transcriptional fusions indicate that
TTSS genes hrpJ (from the same operon as hrcN) and hrpL are transcribed in Pseudomonas sp.
KD under in vitro conditions (our unpublished data). This suggests that TTSS genes are
functional in biocontrol pseudomonads.
In conclusion, it appears that the presence of hrcN in biocontrol pseudomonads is ancient in
most cases, but in the biocontrol strain Pseudomonas sp. KD a set of TTSS genes has probably
been acquired in more recent times from phytopathogenic P. syringae. Nothing is known on the
possible role of TTSS in biocontrol, and it will be of interest to determine whether TTSS genes
- 100 -
contribute or interfere with the biocontrol activity of strain KD and other biocontrol
pseudomonads.
ACKNOWLEDGEMENTS
We thank C. Binder (ETH Zürich) for technical help with cloning of hrcV and hybridization
experiments, C. Prigent-Combaret (Université Lyon 1) for useful discussion, G.M. Preston
(University of Oxford, UK) for strain SBW25, T.H. Nielsen (Royal Veterinary and Agricultural
University, Copenhagen, Denmark) for strain DR54, and E. Holliger (FAW Wädenswil,
Switzerland) for the gift of purified DNA from Erwinia strains. This work was supported by the
Swiss National Foundation for Scientific Research (project 31-64048.00), the French Embassy in
Switzerland (France-Switzerland research grant) and the PAI project 'Germaine de Staël'.
CITED REFERENCES
1. Ajithkumar, B., V. P. Ajithkumar, and R. Iriye. 2003. Degradation of 4-amylphenol and
4-hexylphenol by a new activated sludge isolate of Pseudomonas veronii and proposal for a
new subspecies status. Res. Microbiol. 154:17-23.
2. Alfano, J. R., A. O. Charkowski, W. -L. Deng, J. L. Badel, T. Petnicki-Ocwieja, K. van
Dijk, and A. Collmer. 2000. The Pseudomonas syringae Hrp pathogenicity island has a
tripartite mosaic structure composed of a cluster of type III secretion genes bounded by
exchangeable effector and conserved effector loci that contribute to parasitic fitness and
pathogenicity in plants. Proc. Nat. Acad. Sci. U.S.A. 97:4856-4861.
3. Alfano, J., and A. Collmer. 1997. The type III (Hrp) secretion pathway of plant pathogenic
bacteria: trafficking harpins, Avr proteins, and death. J. Bacteriol. 179:5655–5662.
4. Altschul, S. F., W. Gish, W. Miller, E. W. Myers, and D. J. Lipman. 1990. Basic local
alignment search tool. J. Mol. Biol. 215:403-410.
5. Anzai, Y., H. Kim, J. -Y. Park, H. Wakabayashi, and H. Oyaizu. 2000. Phylogenetic
affiliation of the pseudomonads based on 16S rRNA sequence. Int. J. Syst. Evol. Microbiol.
50:1563-1589.
- 101 -
6. Beer, S. V., D. W. Bauer, X. H. Jiang, R. J. Laby, B. J. Sneath, Z. M. Wei, D. A. Wilcox,
and C. H. Zumoff. 1991. The hrp gene cluster of Erwinia amylovora. p. 53-60. In
Advances in molecular genetics of plant-microbe interactions. H. Hennecke and D. P. S.
Verma (eds.), Kluwer Academic Publishers, Dordrecht, The Netherlands.
7. Bogdanove, A. J., Z. M. Wei, L. Zhao, and S. V. Beer. 1996. Erwinia amylovora secretes
harpin via a type III pathway and contains a homolog of yopN of Yersinia spp. J. Bacteriol.
178:1720-1730.
8. Brown, N. A. 1934. A gall similar to crown gall, produced on Gypsophila by a new
bacterium. J. Agri. Res. 48:1099-1112.
9. Burkholder, W. H. 1926. A new bacterial disease of the bean. Phytopathology 16:915-928.
10. Cuppels, D. A. 1986. Generation and characterization of Tn5 insertion mutations in
contain the motif (shown in bold) GGAACC-N16-CCAC-N2-A (Fouts et al. 2002). IR: Inverted repeats flanking the
Ω cassette.
- 113 -
Pseudomonas colonies displaying the 2.4-kb PCR band showed for 6 of them (and for KD) a
1718-bp fragment hybridizing with the hrcV probe. For each of the ten others (and for
DH5α/pCBW), two hybridization bands (2139 and 903 bp) were obtained, which is consistent
with insertion of the Ω cassette (which carries two PstI sites) in the gene hrcV. In one colony,
chromosomal integration of the cassette by double homologous recombination was further
confirmed by sequencing (performed by Microsynth GmbH, Balgach, Switzerland), and the
mutant was named KD-dork. Plasmid extractions using the Wizard® Plus SV Minipreps DNA
Purification System confirmed the absence of pCBW (and of other plasmids) in KD-dork.
Effect of hrcV inactivation in P. fluorescens KD on biocontrol of damping-off of cucumber.
In the absence of the pathogen P. ultimum, inoculation of P. fluorescens KD or its hrcV-deficient
mutant KD-dork to non-sterile potting mix had no effect on emergence, fresh weight or health of
cucumber plants at 7 days under greenhouse conditions (Fig. 2). Addition of the pathogen P.
ultimum alone lowered seedling emergence to only 21% and reduced significantly the average
biomass of surviving plants from 1.13 to 0.45 g per plant, which overall resulted into a 91% loss
in the total plant biomass per pot. In presence of P. ultimum, the biocontrol strain KD increased
plant emergence from 21% to 72% and the biomass of individual surviving plants from 0.45 to
0.79 g per plant (i.e. +76%). Therefore, total plant biomass per pot was increased more than four
times when compared with the non-protected treatment. The hrcV-deficient mutant KD-dork had
also statistically-significant positive effects on plant emergence (Fig. 2B) and the biomass of
surviving plants (Fig. 2C), but these effects were much lower than those of the wild-type,
especially when considering plant emergence. Consequently, total plant biomass per pot was
only 40% of that in the KD treatment (Fig. 2A).
To determine whether the disruption of the hrcV gene had any influence on the ability of KD to
survive in potting mix and to colonize cucumber roots, CFU of the bacteria in the biocontrol
assay were determined at 7 days. Results indicate that both inoculants survived well in potting
mix and colonized the rhizosphere and roots at high cell numbers by day 7 (Fig. 3). Importantly,
there was no statistically-significant difference in population level between strains KD and for
KD-dork, regardless of (i) the compartment studied and (ii) whether the pathogen was present.
We infer that, at least during the observation period, the hrcV mutation did not reduce the
ecological fitness of the inoculant.
- 114 -
0
1
2
3
4
5
6
Gro
wn
plan
ts p
er p
ot
Control KD KD-dork Control KD KD-dork
Without P. ultimum With P. ultimum
a a a
b
c
d
B
-2
-1
0
1
2
3
4
5
6
Plan
t fre
sh w
eigh
t per
pot
[g]
Control KD KD-dork Control KD KD-dork
α α α
c
b
β βγ
Without P. ultimum With P. ultimum
a a a
d
A
-0.2
0.0
0.2
0.4
0.6
0.8
1.0
1.2
Fres
h w
eigh
t per
indi
vidu
al p
lant
[g]
Control KD KD-dork Control KD KD-dork
α α α β γ β
Without P. ultimum With P. ultimum
a a a
b
c
d
CFig. 2. Biocontrol of P. ultimum-mediated damping-off of cucumber by P.
fluorescens KD and the hrcV mutant KD-dork in non-sterile potting mix. (A) Total
fresh weight of shoots (in black, upper part of the figure) and roots (in white,
lower part of the figure) recorded per pot. (B) Number of grown plants per pot (out
of five). (C) Fresh weight of shoots (in black, upper part of the figure) and roots
(in white, lower part of the figure) of individual plants still alive at 7 days. Means
and standard errors (error bars) were derived from 9 replicates. Data with the same
Latin or Greek letter are not significantly different (ANOVA and Tukey’s HSD
test at P < 0.05).
- 115 -
5
6
7
8
9In
ocul
ant c
ell n
umbe
r [lo
g10
CFU
per
g]
With P. ultimum
Without P. ultimum
With P. ultimum
Without P. ultimum
With P. ultimum
Without P. ultimum
Substratum Rhizosphere Root
a a
a ab
ab b a ab ab b
a a
* *
Fig. 3. Survival of P. fluorescens KD (black bars) and hrcV mutant KD-dork (white bars) at 7 days in the
substratum, rhizosphere and roots of cucumber grown in non-sterile potting mix. CFU are expressed per g of potting
mix (for substratum and rhizosphere) or root (for the root compartment). Bacteria were inoculated at 107 CFU per g
of potting mix. Means and standard deviations (error bars) were derived from four replicates. Within each
compartment, data with the same letter are not significantly different (ANOVA and Tukey’s HSD test at P < 0.05).
Both in presence or in absence of added pathogen, the data for substratum and rhizosphere were also compared
together (since both are expressed per g potting mix) for each corresponding treatment and statistically-significant
differences (ANOVA at P < 0.05) between the two are indicated by an asterisk (*) on the bars of the latter
compartment.
Construction of a hrpJ’-inaZ promoter transcriptional fusion. A hrpJ’-inaZ promoter
transcriptional fusion was constructed in the pPROBE’gfp[tagless] (Miller et al. 2000) derivative
pAD1, in which gfp is replaced with the ice nucleation gene inaZ from P. syringae S203
(accession number X03035; N. Chaney and J. Loper, personal communication). A 405-bp PCR
amplicon containing the promotor region of the hrpJ operon of strain KD was ligated upstream
of inaZ within pAD1, yielding pADJ6 (Fig. 1). The correct orientation of a single insert in the
plasmid was confirmed by restriction analysis and PCR. Plasmid pADJ6 was purified from E.
coli and transformed into CaCl2-competent KD cells.
- 116 -
Under in vitro conditions, retention of the reporter plasmid pADJ6 in strain KD was 96.0
± 1.3% after 20 generations and 90.2 ± 2.4% after 35 generations in serial Luria Bertani (LB;
Sambrook et al. 1989) cultures (i.e. subculturing done every 12 h over 4 days) without selection
for plasmid maintenance. The reporter gene was expressed at a (low) basal level of -8.01 ± 0.47
log10 N cell-1 when strain KD/pADJ6 was grown overnight in LB, i.e. under the conditions used
to prepare the inoculum for microcosm experiments. Thus, the levels of activity that were
measured in this work reflect actual gene activity during the course of the experiments rather
than the residual activity of inoculant cells. No inaZ activity was found in strain KD or KD
containing the empty vector pAD1.
In situ activity of the hrp promoter in the cucumber Pythium pathosystem. Ice nucleation
activity was assessed in situ at 7 days in a biocontrol experiment in which strain KD/pADJ6 was
used (Fig. 4). In this experiment, levels of plant emergence and biomass in the KD/pADJ6
treatment were the same as the ones achieved with strain KD in the original biocontrol
experiment, and no indigenous ice nucleation activity was detected in the control treatments
without added bacteria (data not shown). Maintenance of the reporter plasmid pADJ6 was
comprised between 96.7 and 98.0%, based on analysis of inoculant cells reisolated at 7 days and
that grew on kanamycine-amended agar, regardless of (i) the microbial compartment (potting
mix substratum, rhizosphere or root) and (ii) whether P. ultimum was added. By comparison with
the non-inoculated control in potting mix substratum, an increase in the inaZ activity was found
in the rhizosphere (2.6-fold) and on roots (6-fold) in absence of the pathogen. In presence of the
latter, the increase was 17-fold in the potting mix substratum, 133-fold in the rhizosphere and
184-fold on the roots. In each of the three compartments, the activity of the hrp promoter was
significantly higher when P. ultimum was added.
Effect of hrcV inactivation on P. ultimum pectinase activity. The production by
phytopathogens of extracellular lytic enzymes, e.g. pectinase (which contributes to the
breakdown of pectins in plant cell walls) is important for pathogenesis (Walton 1994). Here, we
used the activity level of pectinase (i.e. polygalacturonase; [EC 3.2.1.15]), as an indicator of the
virulence potential of P. ultimum when assessing the effect of P. fluorescens KD and its hrcV-
deficient mutant KD-dork on the phytopathogen. The confrontation experiment was carried out
- 117 -
5
6
7
8In
ocul
ant c
ell n
umbe
r [lo
g10
CFU
per
g] * * *
Substratum Rhizosphere Root Control P. ultimum Control P. ultimum Control P. ultimum
-7
-6
-5
-4
-3
inaZ
act
ivity
[log
10 N
per
cel
l]
* *
*
Substratum Rhizosphere Root Control P. ultimum Control P. ultimum Control P. ultimum
Fig. 4. Survival (A) and activity of the hrpJ-inaZ fusion (B) of P. fluorescens KD/pADJ6 at 7 days in the
substratum, rhizosphere and roots of cucumber grown in non-sterile potting mix inoculated (white bars) or not
(black bars) with P. ultimum. CFU are expressed per g of potting mix (for substratum and rhizosphere) or root (for
the root compartment). inaZ activity is expressed as the logarithm of the number of ice nuclei per cell of strain
KD/pADJ6. Values in A and in B are the means of four replicates and error bars represent standard deviations.
Statistically-significant differences resulting from P. ultimum inoculation (ANOVA at P < 0.05) are marked by an
asterisk (*).
- 118 -
in liquid media and aliquots sampled periodically to assess pectinase activity. No pectinase
activity could be detected in the absence of P. ultimum (data not shown). When P. ultimum was
incubated alone, pectinase production was first detected at 40 hours (Fig. 5). When P. ultimum
was confronted to P. fluorescens KD, pectinase production was delayed and levels were
statistically lower. In contrast, the hrcV– mutant KD-dork did not delay pectinase production in
P. ultimum. In addition, pectinase levels were statistically higher with KD-dork compared with
KD. Similar results were obtained with the two media used (Fig. 5) or when the medium was
supplemented with macerated cucumber root tissue (data not shown).
- 119 -
0.0
0.5
1.0
1.5
2.0
2.5
1 2 3Time [h]
Pect
inas
e ac
tivity
a c
c
a
b
a a a b
26 40 64 0.0
0.5
1.0
1.5
2.0
2.5
1 2 3Time [h]
Pect
inas
e ac
tivity
26 40 64
a c
c b
a
a a a b
0.0
0.5
1.0
1.5
2.0
2.5
1 2 3Time [h]
Pec
tinas
e ac
tivity
a
a a a b
a
b c
c
*
26 40 64 0.0
0.5
1.0
1.5
2.0
2.5
1 2 3Time [h]
Pect
inas
e ac
tivity
a
a a
c
c
*
b
26 40 64
b b b
Fig. 5. Effect of P. fluorescens KD (black bars) and hrcV mutant KD-dork (white bars) on the pectinase activity of P. ultimum in LB (A, B) or Czapek-Malt medium (C, D). Samples in (B) and (D) were incubated in presence of macerated cucumber tissue. Bars representing controls without bacteria are shown in grey. The activity was assessed in a cup plate assay by measuring the diameter of the polygalacturonic acid-free zone around a 0.6 cm well in which a 200 µl sample was incubated for 2 days at 24°C. Values are the means of 4 replicates and error bars represent standard deviation of the means. Within each of the four graphs, treatments with the same letter are not significantly different (ANOVA and Tukey’s HSD test at P < 0.05). Statistically-significant differences (ANOVA at P < 0.05) between same treatments in presence or absence of cucumber tissue are indicated by an asterisk (*).
A C
B D
- 120 -
DISCUSSION
The unexpected occurrence of TTSS genes in antagonistic biocontrol bacteria has been
documented in recent years (Preston et al. 2001; Mazurier et al. 2004; Rezzonico et al. 2004). For
instance, Preston et al. (2001) have shown the presence in P. fluorescens SBW25 of a 20-kb gene
cluster (named rsp, for rhizosphere-expressed secretion) that resembles the type III (hrp) gene
cluster of plant pathogenic P. syringae. For one of these genes, expression was demonstrated in
the rhizosphere, but a knock-out mutant was not available to assess the ecological significance of
TTSS in this bacterium. Such a mutant was obtained in the current work with the insertion of an
Ω cassette containing a kanamycine-resistance determinant (2237 bp long) into the hrcV of P.
fluorescens KD.
Most TTSS genes found so far in KD (Rezzonico et al. 2004) are organized as in the plant
pathogens Erwinia amylovora Ea321 (Bogdanove et al. 1998), P. syringae pv. tomato DC3000
(Fouts et al. 2003) and P. syringae pv. syringae 61 (Alfano et al. 2000), with hrpJ, hrcV, hrpO
and hrcN located in a same operon controlled by a unique hrp-box sequence (Fouts et al. 2002),
which is recognised by the alternate sigma factor HrpL (Xiao and Hutcheson 1994). Therefore, in
addition to the inactivation of hrcV, the presence of the Ω cassette in hrcV causes a frameshift
likely to impair expression of the genes following hrcV in the same operon (polar mutation).
However, the hrcV mutant KD-dork did not differ from the wild-type strain KD when grown
alone under in vitro conditions, based on comparison of growth rate in laboratory media and key
physiological traits related to primary (utilisation of 95 compounds as sole C source in Biolog
GN microplates (BIOLOG Inc., Hayward, CA)) and secondary metabolisms (production of
biocontrol compounds such as hydrogen cyanide and pyoverdine) (data not shown).
P. fluorescens KD is an effective biocontrol agent (Sharifi-Tehrani et al. 1998). The
results of our study indicate that inactivation of hrcV strongly reduced the biocontrol capacity of
P. fluorescens KD against damping-off in the P. ultimum-cucumber pathosystem. This effect was
not due to a lower ecological fitness of the hrcV mutant KD-dork, as the latter persisted in potting
mix and colonised plant roots to the same extent as the wild-type strain KD did, regardless of
whether the pathogen was present or not. To our knowledge, this is the first report of TTSS being
involved in the biocontrol activity of a plant-beneficial bacterium. Interestingly, the hrcV mutant
KD-dork displayed weak but statistically-significant biocontrol effects, in accordance with the
- 121 -
fact that it produces biocontrol compounds such as hydrogen cyanide and pyoverdine. Therefore,
when taking into account the hypothesis of an evolutionary-recent horizontal transfer of TTSS
genes from the phytopathogen P. syringae to P. fluorescens KD (Rezzonico et al. 2004), it points
to the possibility that acquisition of virulence genes could turn weak biocontrol agents into
Effects of the physiological state of CHA0 on QC-PCR efficiency
Bacterial cells can lose culturability under unfavorable environmental conditions, yet still
exhibiting signs of metabolic activity and thus viability (McDougald et al., 1998). The
physiological and molecular determinants for the entrance into the so-called viable but non
culturable (VBNC) state are for Pseudomonas fluorescens CHA0, as for other bacteria known to
become unculturable (e.g. Vibrio vulnificus or Micrococcus luteus), to most extent still obscure
(Mukamalova et al., 2003). Also the possibility and the requirements for recovery from the VBNC
state (“resuscitation”) remain largely unexplored (Kell et al., 1998). At this place it must be
stressed that loss of culturability does not automatically mean formation of viable but non-
culturable cells (VBNC) (and thus possibility of resuscitation), since the bacteria could be simply
dead, even if they may still look intact to microscopic analysis.
It was demonstrated that a series of physiological changes take place in the bacterial cells upon
entrance in the VBNC state. These changes are supposedly directed toward conferring resistance
to the cells in order to enhance bacteria survival under unfavorable environmental conditions.
Beside obvious alterations in the metabolic activity, which is reduced to minimize energy
consumption, these modifications include both changes in DNA conformation and packaging
(Oliver and Warner, 1998; Gupta et al., 2002) and in the membrane structure and composition
(Linder et al., 1989). These factors have already been shown to have an impact also on the
availability of DNA to molecular based detection techniques like the polymerase chain reaction
(PCR) (Silva and Batt, 1995; Oliver and Warner, 1998). Thickening of the cell wall may enhance
bacterial resistance to lysis, hindering both DNA extraction and direct PCR amplification of
lysates (which is the technique that was used in this work), while changes in nucleic acid
conformation and packaging may change the availability of DNA to the PCR reaction itself.
Therefore, understanding the mechanisms by which a technique like quantitative competitive PCR
(QC-PCR) is affected by VBNC formation in bacteria is important not only for the evaluation of
the method itself as a detection and enumeration procedure, but may also deliver deeper insights
into the physiology of a bacterial population undergoing different environmental stresses.
The results obtained in Chapter 2 indicate that the QC-PCR targeting phlA-gene can affordably
be used to enumerate P. fluorescens CHA0 (and other 2,4-diacetylphloroglucinol producing
- 136 -
ARDRA-1 and ARDRA-3 pseudomonads) in fresh laboratory cultures, if cell lysates are used
directly as templates for PCR. Performing a DNA extraction step before PCR was shown to
introduce an additional uncertainty factor due to sample-to-sample differences and non-linear
DNA yields in extractions carried out on cultures of different cell densities (Fig. 1). This problem
was even more evident for natural soil samples and stressed cells. In this case it may be necessary
to use an external standard (e.g. fresh reference bacteria not containing phlA) to control the
efficiency of DNA extraction, as even commercial kit available do not guarantee reproducible
recoveries (Mumy and Findlay, 2004). Yet, since it was hypothesized that even the efficiency of
DNA isolation can be affected by the physiological status of the cells (Marsh et al., 1998), there is
a distinct probability that even the DNA extraction from the internal standard could not be
representative of the situation in the real sample, in other words that the isolation of target DNA
may not be performed with the same efficiency as the extraction of the reference DNA.
Fig. 1. Effect of using different dilutions of the same cell culture on the yield of DNA extraction. DNA was extracted
by cell lysis at 65 °C in 0.15% SDS followed by direct precipitation in 20% ethanol. For each dilution triplicate
extractions are shown. Similar results were obtained also with a standard phenol:chloroform:isoamylalcohol
extraction procedure (data not shown). Lanes 1-3: λ-DNA standard [ng/µl].
When cells experience various types of stresses (e.g. NaCl stress, oxygen limitation and low
redox potential, acidity stress, copper stress or starvation by prolonged incubation) and become
unculturable, the correlation between QC-PCR and cell number disappears even if cell lysates are
used in the reaction (see Figure 2, Chapter 2). The amount of DNA detected by PCR is in most
cases higher than the one expected in colony forming units (CFUs) alone, which means that actual
CFUs (which represent culturable cells) are overestimated by this method. Some of this excess
DNA is extracellular, originating most probably from dead cells that have already undergone lysis
in the sample, and can be eliminated by digesting the sample with an appropriate restriction
enzyme prior to lysis of the cells for PCR (see Figure 3, Chapter 2), but the largest part of it is not
affected by this treatment, meaning that it must belong to non-culturable cells with a sufficiently
- 137 -
intact cell membrane to prevent the entrance of a functional restriction enzyme. Conversely, the
total cell number (as measured by immunofluorescence microscopy counts) can also be
underestimated when using QC-PCR, endorsing the hypothesis that part of the DNA may become
invisible to PCR in bacterial cells that lose culturability (Oliver and Warner, 1998). This can be
caused by nucleic acid degradation in dead cells (which must however retain a certain membrane
integrity to allow the cells to be counted under immunofluorescent microscopy) or, if we accept
the hypothesis that VBNC formation is an active process triggered by the cells themselves for their
own survival, by the structural modifications that come along with the entrance of bacteria in the
non-culturable state. It is interesting to note that for the CHA0 samples studied in this work such
underestimation is evident only in cells cultivated at pH 3 and 4 (acidity stress), but not when
bacteria undergo other kinds of stresses (Fig. 2) and that this result is not caused by the conditions
in the PCR reaction itself (see Figure 4, Chapter 2).
Y = 1.14 X - 11.23R2 = 0.84
-7
-6
-5
-4
-3
-2
-1
00 1 2 3 4 5 6 7 8 9 10
log10 (total cells/ml)
log 1
0 (µ
g co
mpe
titor
/ml)
Fig. 2. Effect of different types of stress on the relationship between QC-PCR and the total cells of P. fluorescens CHA0. Modified from Figure 2B, Chapter 2 to evidence data belonging to pH-stressed cells ( ). The result of QC-PCR is represented by the concentration of competitor oligonucleotide needed to yield the same amount of amplification product as the corresponding target bacterial DNA in the reaction. Data obtained derived from log or early stationary-phase cells (i.e. control) are represented as full black diamonds ( ). Cells subjected to different stresses (NaCl stress, oxygen limitation and low redox potential, copper stress or starvation by prolonged incubation), are represented as empty grey diamonds ( ) and those subjected to low pH stress are evidenced by empty red triangles ( ). Statistically-significant positive correlations with QC-PCR results were found when log and early stationary-phase cells were considered, and regression parameters are then indicated.
- 138 -
One hypothesis is that this result may be indicative of the various modes by which CHA0 adapt
to (or is debilitated by) different kind of stresses, since previous reports have already shown that
different stresses were able to affect bacterial culturability in different manners, that is to produce
different types of non-culturable cells (Nilsson et al., 2002). Overall, it seems that QC-PCR results
obtained in Chapter 2 from pH-stressed fluorescent pseudomonads may hint to an active process
of DNA packaging and thus could more closely reflect the situation of a controlled entrance in a
non-culturable state, while other kind of stresses (e.g. oxygen limitation and low redox potential,
or high salt concentration) are apparently causative of a situation in which the cells may be
actually debilitated. This fact could explain the findings of Mascher and coworkers (2000), who
found that the VBNC state induced by abiotic stress in CHA0 does not promote strain persistence
in soil. In their study non-culturable cells were obtained by exposing the cells to oxygen limitation
and low redox potential as well as to high salt concentration, but not to low pH. In this hindsight it
would be interesting to compare the persistence in soil of non-culturable cells obtained also at low
pH and with other types of stresses.
A second possibility to explain the fact that in stressed cells QC-PCR does not correlate neither
with CFU nor with viable or total cells, even in presence of antibiotics inhibiting de novo protein
synthesis or DNA supercoiling (see Table 2, Chapter 2), or after complete digestion of
extracellular DNA (see Figure 3, Chapter 2) is that under stress conditions CHA0 forms a mixed
population of cells in which DNA is variedly available to the PCR and thus probably as well to
cellular RNA polymerase. DNA fading due to entrance in the VBNC state and amplification of
both extracellular DNA and DNA belonging to non-culturable cells are probably counteracting
antagonistic effects. Together they are likely to yield a situation in which the single contributions
to the final PCR result are difficult to disentangle. This makes this technique difficult to use for
bacterial quantification in environmental samples. As stated above, the present-day commonly
accepted theory views the VBNC state as an active strategy of survival implemented by bacteria
under adverse environmental conditions. However, it is likely that there is not just one VBNC
status, but rather that VBNC cultures consist of subpopulations that are reflection of the stages of
VBNC formation. At the beginning, cells to lose culturability while maintaining a certain
metabolic level, intact membranes and intact nucleic acids, hence retaining potential for
resuscitation. In the later stages cells gradually experience degradation of DNA and become
- 139 -
nonviable, finally losing membrane permeability and releasing nucleic acids and cytosolic content
in the environment (McDougald et al., 1998). Therefore the PCR results obtained in Chapter 2
could reflect the fact that in CHA0, the formation VBNC does not lead to the generation of a
single class of bacteria all living (or dying) in the same physiological state, but is rather
representative of cells with diversified metabolic competences, different viability and culturability
levels, and different resuscitation potentials.
Type III secretion systems in biocontrol pseudomonads
The role of type III secretion systems (TTSSs) in bacterial pathogenicity has been demonstrated
for various genera of animal and plant pathogens (Hueck, 1998). TTSSs have more recently also
been reported in non-pathogenic bacteria, such as symbiotic rhizobia, which are responsible for
biological nitrogen fixation in the roots of leguminous plants. In these bacteria, TTSSs have been
implicated in the plant-bacteria molecular dialogue mediating the establishment and the activity of
the symbiotic association (Marie et al., 2001), in other words they are needed for host specificity
and induction of nodulation. Conversely, reports of the presence of TTSSs in saprophytic and
plant protecting biocontrol bacteria were scarce, so that it was generally believed that these
instances represented the exception rather than the general rule. The best known example to date
was probably the discovery of a partial TTSS gene cluster in biocontrol strain P. fluorescens
SBW25, were an hrcC gene homologue was even found to be expressed in the rhizosphere
(Preston et al., 2001).
The results obtained in Chapter 3 show instead that TTSSs are indeed widely spread also
among biocontrol pseudomonads. In fact, a combined PCR- and hybridization-approach targeting
hrcN, a gene encoding a conserved ATPase of the TTSS machinery, showed that this gene is in
fact present in about 60% of the bioncontrol pseudomonads investigated, irrespectively of the
cosmopolitan origin of the strains, their different biocontrol ability and the plant species from
which the strains were originally isolated.
These results were strenghtened by an indipendent work which, using a similar approach, was
able to identify a fragment spanning the hrcRST genes among a collection of saprophytic
pseudomonads isolated from different bulk soils and various plant rhizospheres (Mazurier et al.,
- 140 -
2004). Therefore pathogenic and saprophytic strains can not be discriminated, as previously
thought (Stuber et al., 2003), on the basis of the presence of TTSS genes alone. Alongside the
finding that TTSS is widespread also among non-pathogenic fluorescent pseudomonads, also other
conclusions drawn by Mazurier and coworkers are to a great extent in agreement with what was
found in this work. When comparing the topology of the corresponding dendrograms, a
correspondence could be established between the ribotypes and the TTSS sequences for all the
strains, regardless whether they are beneficial, saprophytic or phytopathogenic. This observation
suggests that 16S rDNA and TTSS genes have followed a similar evolution, pointing the ancestral
origin of the latter both in pathogenic and non-patogenic strains. However, in both works some
incongruences between the two trees were found, e.g. P. fluorescens KD (this work) or P. gingeri
CFBP2810T (Mazurier et al., 2004), suggesting that in some cases TTSS genes might have
experienced an horizontal gene transfer (HGT).
Nevertheless, between the two works there seems to be a substantial disagreement on the
topology of TTSS trees. While the hrcN tree obtained in Chapter 3 of this work showed mainly a
discrete clustering between biocontrol strains and phytopathogens, the tree based on the hrcRST
fragment didn’t allow the discrimination of phytopathogenic and saprophytic strains on the base of
the polymorphism of the corresponding sequences. The reasons of such discrepancy are difficult
to ascertain, since a direct comparison of the two TTSS trees is impossible given that only two
Pseudomonas strains have been taken in consideration simultaneously by both works (F113 and
SBW25) and the latter strain lacks the hrcN fragment (Preston et al., 2001) which was studied
here. However, due to their close physical and functional relatedness (see Figure 9, Chapter 1) it
seemes unlikely that the two gene fragments may have underwent different phylogenetic histories.
One of the aims of the present discussion is therefore to further investigate this discrepancy.
It must be noted that Mazurier and co-workers constructed their 16S-rDNA tree using
restriction fragment length polymorphism (RFLP) data, which is a method that doesn’t allow as
much resolution as DNA sequencing. They also clustered the hrcRST tree using the unweighted
pair-group method with arithmetic averages (UPGMA) algorithm only, instead of the more
accurate neighbor joining (NJ) and maximum parsimony (MP) algorithms used here. Deeper
analysis of their hrcRST tree shows that Group I is mainly composed of pathogenic strains (with
the exception of P. fluorescens C7), Group II exclusively of saprophytic ones (plus a biocontrol
strain F113), and Group III also contains mostly saprophytes (with the exception of pathogenic P.
- 141 -
marginalis strains, which anyhow clusters with P. fluorescens in the species phylogeny (Anzai et
al., 2000), and both P. blatchfordae and P. salomonii for which this information is however not
available).
If we look at F113, we see that it fits into hrcRST Group II (0.120 subst./site) and into hrcN
Group 4 (0.022 to 0.040 subst./site) respectively, but if we consider the hrcN group size based on
the same substitution per site criteron used for hrcRST, F113 could be part of a bigger group
comprising hrcN Groups 1 to 5 (< 0.100 subst./site) or even 1 to 7 (0.139 subst./site). It is thus
possible that the strains contained in hrcN Groups 1 to 7 correspond in fact to hrcRST Group II,
which is also devoid of pathogens. Moreover, an hrcRST tree built for the purpose of this
discussion using sequence information obtained with the primers published by Mazurier and
coworkers (2004), but based on our collection of strains (Fig. 3), showed a topology that is in
large agreement with the hrcN tree obtained previously (see Figure 2, Chapter 3). Therefore the
apparently diverging results may just be associated with a bias due to the different choice of
strains, with bigger hrc groups clustered by Mazurier and coworkers. The phylogenetic location of
model biocontrol strain P. fluorescens C7 is remarkable: in both hrcRST trees it’s in the apparently
self-contraddictory situation of finding itself in a hrcRST group containing exclusively plant
pathogens (with the exception of KD, which has however probably acquired the TTSS by HGT
from a related pathogen strain), but yet clustering among saprophytic P. fluorescens in the 16S-
rDNA tree constructed by Mazurier and coworkers. Since the latter seems also to be fairly in
accordance with the species phylogeny tree defined by Anzai and coworkers (2000) two
alternative explainations are possible: (1) C7 is indeed a pathogenic strain (e.g. a P. syringae or
similar one), as would be supported by the fact that it induces an hypersensitve response (HR) on
tobacco and tomato leaves (Mazurier et al., 2000). In this case the position of this strain and other
pathogens in the 16S-rDNA tree needs to be reviewed using more precise sequencing data. (2)
Alternatively C7 belongs effectively to the “P. fluorescens” complex and was subjected, just as
KD, to an HGT. Merging the data of both works and obtaining 16S-rDNA sequences for at least
some type strains used by Mazurier and coworkers would undoubtly help to solve this question
and to expand the knowledge on this topic. Unfortunately their hrcRST sequences were not yet
available online at NCBI by the time the this discussion was written.
- 142 -
PILH1
PITR2
F113
P12
CM1'A2
TM1A3
P97.30
TM1'A4
TM1'A5
K94.31
C*1A1
Q65c-80
TM1B2
Q95-87
Q107-87
Q128-87
Q139-87
P97.38
SBW25
DR54
96.578
KD
P.syringae pv. phaseolicola (AY530203)
P.syringae ATCC19310
C7 (AJ271105)
P.syringae pv. tomato DC3000 (AF232004)
P.caricapapayae LMG2152
E.herbicola (X99768)
E.amylovora (L25828)
X.campestris pv. campestris ATCC33913 (NC 003902)
96
100
84
57
99
100
96
87
79
99
9979
56
100
62
81
99
0.1 Fig. 3. Phylogenetic relationships on the basis of partial hrcRST sequences between biocontrol fluorescent
pseudomonads and phytopathogenic bacteria belonging to the genera Pseudomonas, Erwinia, and Xanthomonas. New sequences were obtained as described by Mazurier et al. (2004) and compared with the ones already available at GenBank (accession numbers are then indicated between parentheses). The distance tree was generated by the NJ method with the JC formula, using the hrcRST sequence of X. campestris pv. campestris as the outgroup. Nodal supports were assessed by 1000 bootstrap replicates. Only bootstrap values greater than 50% are shown. The scale bar represents the number of substitutions per site. hrcN groups defined for biocontrol pseudomonads based on the topology of the hrcN tree are indicated (see Figure 2, Chapter 3). PITR2 was the sole representative among the 10 strains investigated belonging to hrcN Group 2 to yield a positive hrcRST signal in the PCR. No representatives of hrcN Groups 5, 7, 8 and 9 were tested. aNo amplification with hrcN primers could be obtained with any member of this group, although hybridization with an hrcN probe was clearly positive for DR54 and a dubious result for 96.578 was scored as negative, while SBW25 is known to be devoid of the targeted hrcN fragment (Preston et al., 2001).
hrcN Group 1
hrcN Group 2
hrcN Group 4
hrcN Group 3
hrcN Group 6
no hrcN groupa
hrcN Group 10
Biocontrol pseudomonads
Biocontrol pseudomonas
Pathogenic pseudomonads
Pathogenic pseudomonads
- 143 -
Role of TTSS in the biocontrol activity of P. fluorescens KD
Biocontrol strain Pseudomonas fluorescens KD was shown to effectively protect tomato against
Fusarium oxysporum f. sp radici-lycopersici (FORL) and cucumber against damping-off caused
by Pythium ultimum (Sharifi-Tehrani et al., 1998). However, this strain does not produce neither
2,4-diacetylphloroglucinol (Phl) nor pyoluteorin (Plt), which is known to inhibit the growth of
oomycetes, including plant pathogens belonging the genus Pythium (Howell and Stipanovic,
1980). Thus the mechanisms of plant protection by KD are largely still obscure.
The affiliation of KD to the “P. fluorescens” complex as defined by Anzai and coworkers
(2000) was verified on the base on its 16S rDNA sequence (see Figure 4, Chapter 3). Also
analysis of other genes such as response regulator gene gacA (De Souza et al., 2003) showed that
KD is much closely related to the “P. fluorescens” complex than to “P. syringae” (Fig. 4).
Nevertheless, analysis based on the sequences of the hrcN fragment obtained (see Figure 2,
Chapter 3) and hrcRST (Fig. 3) revealed that the TTSS found in KD is phylogenetically more
similar to the one of plant pathogenic Pseudomonas rather than those found in biocontrol strains.
This was confirmed also by the genetic organization found, which more closely resembles to the
one found in pathogen strain P. syringae pv. tomato DC3000 than that of P. fluorescens SBW25
(see Chapter 3, Fig. 5). These facts are indicative of a gene transfer that has recently taken place
from plant pathogenic Pseudomonas strains to KD.
In Chapter 4 the impact of the horizontally acquired TTSS on the biocontrol performance of
KD was investigated by inactivating the TTSS gene hrcV (encoding for a conserved membrane
protein) through the insertion of an Ω cassette. The resulting mutant KD-dork showed a
significantly reduced biocontrol performance against P. ultimum on cucumber (see Figure 2,
Chapter 4), without being affected in its root colonisation ability. A transcriptional reporter fusion
with ice nucleation gene inaZ was created to investigate the activity of the promotor controlling
hrcV expression in natural soil using the P. ultimum-cucumber pathosystem (i.e. reproducing the
conditions of the biocontrol experiment). The TTSS promotor was found to be activated upon
contact with P. ultimum, but not by the plant alone, even though the highest activation was found
when both organisms were simultaneously present. No positive or negative effect on plant growth
could be determined by the presence in the soil neither of wildtype KD nor hrcV- strain KD-dork
- 144 -
PILH1
PITR2
SSB17 (AF502421)
SSB33 (AF502420)
Q37-87
F113 (AF502414)
P12
P97.30
K94.31
Q65c-80
CM1'A2
P97.38
Q2-87 (AF502419)
KD
SBW25
PfO-1
CHA0 (M80913)
Pf-5 (AF065156)
P.aureofaciens 30-84 (AF115381)
P.chlororaphis LMD82.53 (AF502415)
P.putida 4101 (AJ629219)
P.putida WCS358S (AF502422)
P.putida KT2440 (AE016789)
P.aeruginosa PAO1 (U27988)
P.aeruginosa DSM1128 (AF502413)
P.syringae pv. tomato DC3000 (NC 004578)
P.syringae pv. pisi 24.7 (AF502418)
P.syringae pv. syringae B728a (U09767)
100
100
99
100
100
99
99
74
50
60
77100
99
68
69
60
54
72
99
0.02
Fig. 4. Phylogenetic relationships on the basis of partial gacA nucleotide sequences between biocontrol and phytopathogenic pseudomonads. New sequences were obtained as described by De Souza et al. (2003) and compared with the ones already available at GenBank (accession numbers are then indicated between parentheses). The distance tree was generated by the NJ method with the JC formula. Nodal supports were assessed by 1000 bootstrap replicates. Only bootstrap values greater than 50% are shown. The scale bar represents the number of substitutions per site. The “P. fluorescens”, “P. chlororaphis”, “P. putida”, “P. aeruginosa” and “P. syringae” complexes were those defined by Anzai et al. (2000) and used also in Figure 4, Chapter 3.
“P. fluorescens”
“P. putida”
“P. aeruginosa”
“P. syringae”
“P. chlororaphis”
- 145 -
alone. Furthermore infiltration of KD suspensions in the leaf apoplast of cucumber or tobacco did
not yield neither any disease symptoms nor it did elicit an hypersensitive response (HR),
indicating that KD is not a (compatible or incompatible) pathogen for both plant species.
Conversely, in vitro investigation of pectinase production by P. ultimum showed that co-
cultivation with KD resulted in a reduced production of this key pathogenicity enzyme for at least
64 hours either when compared to co-cultivation with TTSS mutant KD-dork or to P. ultimum
alone. Failure to produce pectinase during the early stages of cucumber emergence, could allow
the seedlings to grow beyond the stage in which they start to incorporate suberin and lignin into
the cell wall, which can not be degraded by the pathogen, developing therefore a certain resistance
against the fungus and thus mitigating disease symptoms. Taken togheter this facts suggests that
the adoption of a TTSS from related phytopathogenic strains may have conferred a detrimental
trait to KD which affects negatively P. ultimum. Thus, pathogenicity toward the fungal pathogen
would result in an improved biocontrol activity. To my knowledge, this would be the first report
of a TTSS not directed against a plant or animal, but against a fungus. In fact, when KD is
incubated simultaneously with P. ultimum on KB-agar, even if it can not stop the growth of the
fungus on the plate, it seems to be able to grow on its mycelium (Fig. 5). However, microscopic
analysis needs to be performed to better understand this interaction and to assess if the bacterium
simply overgrows the fungus or if there is a real colonization of the mycelium.
No effector proteins secreted via the TTSS could be identified in culture supernatants by
comparative proteome analysis of KD and KD-dork using both 1D- and 2D- SDS-PAGE. This
could be due to the fact that they are produced only in small amounts and thus that more sensitive
techniques such as immunoblotting are required to detect them. Alternatively, it is conceivable
that these effectors are not released into the supernatant, but that they are only sythesized upon
contact with the host and that they are secreted directly into its cells (Casper-Lindley et al., 2002).
Unfortunately, in spite of the efforts made, the whole sequence of the hrpJ-operon could not be
obtained for KD (see Chapter 6), so that it was not possible to complement hrcV and the
subsequent genes and to test the restored mutant. A recovered biocontrol ability would have
constituted the definitive proof of the involvment of TTSS in this process. In absence of the native
sequence information an alternative method would be to attempt complementation with an
heterologous hrpJ operon. Complete sequences are available for hrpJ-operons in related TTSS of
P. syringae pv. tomato DC3000 (accession number AF232004) and P. syringae pv. phaseolicola
- 146 -
(accession number AY530203). However, failure to positively complement the mutation would
not necessary mean that the lower biocontrol activity of KD-dork is barely the result of a
pleiotropic mutation affecting the same phenotype of hrcV. In fact it is conceivable that, hrcV
being a structural gene, the chromosomal defective allele could negatively influence the assembly
of the TTSS apparatus even in presence of the plasmid-borne undamaged gene.
Fig. 5. Colonization of fungal mycelium by P. fluorescens KD (left) and TTSS system mutant KD-dork (right) on
KB-agar. Four 10 µl droplets of an overnight culture of bacteria were spotted on agar together with a 7 mm disk of
potato dextrose agar overgrown with P. ultimum and cultured for 3 days at 24 °C. Bacteria growing on P. ultimum
appear as a yellowish coating in the center of the plate, while fungal mycelium growing undisturbed is visible between
the bacterial spots (white area).
Beside the effects related to biocontrol, i.e. biocontrol activity itself and effect on in vitro
pectinase production by P. ultimum, no other significant phenotipic differences could be
established between KD and KD-dork. Analysis of C-source utilization performed with Biolog
plates as well as the production of hydrogen cyanide and pyoverdines revealed no substantial
differences between TTSS mutant and the wildtype strain, pointing to the fact that the reduced
biocontrol ability of KD-dork is not simply due to a general debilitation of the strain.
- 147 -
Role of TTSS in other biocontrol pseudomonads
While some details about the function of TTSS and its involvement in the biocontrol activity of
the strain could be evinced for P. fluorescens KD in this work, its role in other biocontrol
pseudomonads, where the TTSS seems to be an ancestral attribute, still remains obscure.
However, a strong indication of an active ecological role of HrcN in biocontrol pseudomonads,
and thus probably of the whole TTSS, is represented by the ongoing purifying selection on the
corresponding gene (see Chapter 4), which is comparable to the one found in phytopatogenic
strains. The fact that evolution is selecting against non-synonymous nucleotide substitutions
suggests that these genes are indeed important for adaptation and survival of biocontrol
fluorescent pseudomonads in their natural environment (i.e. the rhizosphere).
Phylogenetic and sequence analysis indicates ancestral origin and a certain degree of
distinctness between HrcN encoded by biocontrol Pseudomonas versus those encoded by
pathogenic Pseudomonas. For biocontrol bacteria, this could be indicative of differences also in
the sequence and in the arrangement of other TTSS genes and it may eventually reflect a different
function or target of their TTSS with respect to that of plant pathogenic strains. It would be
interesting to obtain larger sequence portions of one “ancestral” TTSS belonging to a plant
beneficial P. fluorescens strain and to study if and how its biocontrol activity is affected by a
mutation similar to the one introduced in KD. This may answer the questions whether all TTSS in
plant beneficial pseudomonads have a role in biocontrol and if this is always mediated by
pathogenicity toward the pathogen as in KD or may also operate by inducing host plant defenses.
In the latter case the TTSS could have a similar role to the one fullfilled in symbiotic rhizobia, that
is plant host recognition and specificity.
Outlook
This work has offered the first evidence of a possible ecological role of TTSS in fluorescent
biocontrol pseudomonads. However, many questions are still open and the mechanism of action in
KD and particularly in other biocontrol strains in which the TTSS is ancestral, still remains to be
fully elucidated. Sequencing of whole “pathogenicity” islands in different plant beneficial bacteria
- 148 -
could allow to establish the exact relationship between their TTSS and those found in symbiotic
and pathogenic bacteria. Studying expression patterns with microarrays and identifying the
proteins secreted by biocontrol bacteria upon contact with the host (either plant or pathogen)
would help to understand how the different organism interact with each other and to decode the
exact role of TTSSs in plant protection. The construction of a TTSS-mutant defective also in the
mechanisms regulating secondary metabolism (e.g. gacA/gacS genes) may help to understand if
the residual biocontrol capacity of KD-dork is just due its HCN and pyoverdine production or if
the TTSS maintains a certain biocontrol activity despite the hrcV mutation. This could arise for
example from a retained host recognition mediated by intact exchangeable effector locus (EEL) or
conserved effector locus (CEL) regions (Alfano et al., 2000). Mutants in EEL/CEL regions may be
used to solve this issue and to find host specificities against plant or fungi for each single
biocontrol strain. And finally of course, one can wonder if the case of KD is unique. So far, no
other reports are known of naturally occurring gene transfers conferring new biocontrol abilities to
a saprophytic strain. The possibility to improve or modulate the performance of plant beneficial
strains by transformation with TTSS or parts thereof is certainly intriguing for a better
understanding of the interactions between microbes and eukaryotes in the rhizosphere.
CITED REFERENCES 1. Alfano, J. R., A. O. Charkowski, W. L. Deng, J. L. Badel, T. Petnicki-Ocwieja, K. Van
Dijk, and A. Collmer. 2000. The Pseudomonas syringae Hrp pathogenicity island has a
tripartite mosaic structure composed of a cluster of type III secretion genes bounded by
exchangeable effector and conserved effector loci that contribute to parasitic fitness and
pathogenicity in plants. Proc. Natl. Acad. Sci. U.S.A. 97:4856-4861.
2. Anzai, Y., H. Kim, J. -Y. Park, H. Wakabayashi, and H. Oyaizu. 2000. Phylogenetic
affiliation of the Pseudomonads based on 16S rRNA sequence. Int. J. Syst. Evol. Microbiol.
50:1563-1589.
3. Casper-Lindley, C., D. Dahlbeck, E. T. Clark, and B. J. Staskawicz. 2002. Direct
biochemical evidence for type III secretion-dependent translocation of the AvrBs2 effector
protein into plant cells. Proc. Natl. Acad. Sci. U.S.A. 99:8336-8341.
- 149 -
4. De Souza, J. T., M. Mazzola, and J. M. Raaijmakers. 2003. Conservation of the response
regulator gene gacA in Pseudomonas. Environ. Microbiol. 5:1328-1340. 5. Gupta, S., S. B. Pandit, N. Srinivasan, and D. Chatterji. 2002. Proteomics analysis of
carbon-starved Mycobacterium smegmatis: induction of Dps-like protein. Prot. Engineering
15:503-511.
6. Howell, C. R., and R. D. Stipanovic. 1980. Suppression of Pythium ultimum induced
damping-off of cotton seedlings by Pseudomonas fluorescens and its antibiotic pyoluteorin.
Phytopathology 70:712-715.
7. Hueck, C. J. 1998. Type III protein secretion systems in bacterialpathogens of animal and
plants. Microbiol. Mol. Biol. Rev. 62:379-433.
8. Kell, D. B., A. S. Kaprelyants, D. H. Weichart, C. R. Harwood, and M. R. Barer. 1998.
Viability and activity in readily culturable bacteria: a review and discussion of the practical
issues. Antonie van Leeuwenhoek. 73:169-187.
9. Linder, K., and J. D. Oliver. 1989. Membrane fatty acid and virulence changes in the viable
but nonculturable state of Vibrio vulnificus. Appl. Environ. Microbiol. 55:2837-2842.
10. Marie, C., W. J. Broughton, and W. J. Deakin. 2001. Rhizobium type III secretion systems:
legume charmers or alarmers. Curr. Opin. Plant Biol. Infect. 4:336-342.
11. Marsh, P., N. Z. Morris, and E. M. H. Wellington. 1998. Quantitative molecular detection
of Salmonella typhimurium in soil and demonstration of persistence of an active but non-
GAGCGTTGGGTCCTGGCTCATCCGGTCATCGTTGGGCGCATGGATTTGCTGGTCAATCAGCTGCGCTCATTACGTCCAGGTGATGTGTTGTTGCCTGCCGAGGCGGTCTTCGACGTTCAAGGTCGGGGAAACCTGCAACTGGGCAACCAGCGGTGGGCGGTTTGTAGCGAAGACCGGAATGATCACTTACAGCTCAGGCTGATTCACGAAGAAGGCTCCATTCATGAGCAATGAACTGCAGGATGAAGAACCGTTGTACGAGTTCGACAGTAACGATGACTTGGCGGCCCGGGAAGCGAACGACGACCAGCAGGAACGGCTCGATCCGGCGCAGCCAGACGACGCCCTCCCGCAAGACGCTGCGCCGCAGCCGCCATCGCCCTTGGCCGGTGTGACCCTGGCGTTGACCGTACGGTGCGGCGAAGTGAAGCTGAGCCTCGGAGCGCTCGGCCGCCTGGCGGCCGGTTCCGTGGTGGATGTCACGGGCATGGCGCCGGGCGCAGCGACGTTGTGCCATGAAGAGCGGGTGGTCGCCTACGGTGAGCTGGTAGACGTGGATGGACGCTTGGGCATGCAAATCACTCGCTTGGTATTTTGATCAATGATTCTGGATGGCATGAACCCGATCATGCTCGCGCTGTTTCTGGGGGCGCTCTCGCTGATCCCGTTGTTTTTGATTGTCTGCACCGCATTTCTGAAAATCTCCATGGTGTTGCTGATAACGCGCAATGCCATCGGCGTGCAACAGGTTCCGCCCAATATGGCGTTGTATGGCATTGCCCTGGCGGCGACGATGTTCGTGATGGCTCCGGTGGCTTATGAAATCCAGCAACGGGTGGCTGAAAATCCTTTGCAGATAGGCACTACCGAACAACTTCAAGCCAGCGTGAACACGGTCATCGCCCCGCTGCAAAACTTCATGAGCCGTAACACCGATCCGGACGTCCTGGCGCATCTGGTCGACAACACCCACCGTATGTGGCCTGCGGAACTGGCCGAAAAAGCCAGCAGCAAGGATCTGCTGCTGGCGATTCCAGCCTTCGTATTGTCGGAGCTGCAGGCCGGGTTCGAGATCGGTTTTCTGATTTACATTCCGTTCATCGTCATTGATCTGATCGTGTCCAACCTGCTGCTTGCGCTTGGCATGCAATGGTCTCGCCGATTGACCATTTCGCTGCCGCTCAAATTGCTGCAGTTCGTCCTTGTCCAGGGCTGGACGCGGTTACTCGACAGTCTGTTCTATTCCTATCTGTGAGGCTGCCATGGAAGCGCTGGAGTTGTTCAAACAGGGCATGTACCTGGTGGTGATTCTTACCGCACCACCGCTGCTGGTCGCGGTGCTGGTAGGCGTGTTGACGTCTCTCGTGCAAGCCTTGATGCAGATCCAGGACCAGACCCTGCCCTTTGGTATCAAACTGGTCGCCGTGGGCGTGACCCTGGCGGCGACCGGCCGCTGGATCGGCGTTGAATTGATCCTGTTCATCAACATGGCGTTCGACCTGATCGCGCGCACCGGAGGCGCCGTTTGATGCCATTCAATGCCGAGTATTTGTTCGAACTGATGCTCGGTATCGCTTTAGCCATGGCCAGGATTCTGCCGTGCATGATGCTGGTGCCAGCGTTTTGCTTCAAATACCTCAAGGGGCCGCTGCGTTACGCCGTGACCTGCGCGGTTGCGATGGTTCCAGCGCCGAGCATCGGTCGGGTGTTGTCTGGGCAACATGAGAACTGGCTGATGATCGGCGGTTTGTTGCTCAAGGAAATGGTCCTGGGCGTGCTGTTGGGGTTGCTGCTGTATATGCCGTTCTGGATGTTCGCAACGGTAGGCGCCTTGCTCGACAGCCAGCGCGGCGCTCTCAGCGGCGGCCAGATCAACCCTTCCCTGGGGCCCGACGCGACGCCACTGGGCGAGTTGCTGCAGGAAGTGCTGATCATGCTAGTCATCCTKCCGGCGCTCTCG... to hrcC (rev)
Putative start codon are underlined, alternating colors indicate regions of overlapping genes, and non-coding regions are marked black and are not in bold fonts.
- 161 -
Acknowledgements
Gogo: merci de m’avoir donné la chance de faire ce doctorat, pour tes conseils et tes
recommendations et la liberté que tu m’as toujours laissé dans ce travail. Yvan: merci
de m’avoir suivi pendant tout mon travail, pour la fantastique supervision et pour avoir
participé à la correction de mes articles et du manuscript final. Bruce: thank you for
your support and for having accepted to be my co-referent. Prof. Ulrich Burger:
vielen Dank für Ihre Anstrengungen die geheimnisvolle Natur der von KD (Kamarad
Deng) produzierten gelben Verbindung dxp (dengxiaopin) zu entschlüsseln. Fabio #1:
grazie per avermi accettato quale tuo schiavo ed avermi così introdotto nel favoloso
modo della fitopatologia, per avermi aiutato nel muovere i primi passi in questo
laboratorio, per il supporto fisico e morale ai miei esperimenti e per la tua disponibilità ed
amicizia (e non da ultimo per avermi insegnato a pilotare il Götz-Götz). Carsten:
herzlichen Dank für Deine Hilfe und Tipps bei allen Experimenten mit VBNC
(a.k.a.Visible But Not by Carsten) Bakterien. Christian B: danke, dass du den
schwarzen Peter “Typ III Sekretionssystem“ bei mir landen liess. Dank deiner
Vorbereitungsarbeit könnte ich am Schluss doch etwas daraus machen! Lazaro:
muchisimas gracias por tu ayuda y tus consejos en el uso de las tecnicas de clonaje como
tambien en el uso de las enzimas de restriccion (olé!). Regina: herzlichen Dank für
Deine Hilfe für alles was mit Reportergenen und inaZ zu tun hatte. Sonja und Simone:
danke für eure freiwilligen Einsatz als Diplomandin beziehungsweise Sklavin an dieser
Arbeit. Ich hoffe es hat zumindest ein bisschen Spaß gemacht! Elena: grazie per
avermi così schiettamente offerto la tua amicizia, per avere corretto la versione in italiano
del riassunto di questa tesi (o per meglio dire per averla tradotta dal ticinese) e per avermi
finalmente trascinato a vedere la parata dei pinguini allo zoo di Zurigo. Gob: grazie per
essere stato mio coinquilino e amico per tanti lunghi anni, ma soprattutto per avermi
tediato con i dati tecnici di tutte le funivie svizzere e con i racconti delle tue carrellate.
Marcello: grazie per la tua amicizia, per le gite in bici a Lägeren e per avere fornito un
favoloso supporto materiale e morale a questo lavoro ordinando sempre prontamente tutti
i kit necessari al suo avanzamento e contrabbandando le slinzighe dalla Valtellina. Hasta
- 162 -
la victoria siempre! Un ringraziamento va anche agli altri Anamorphs (Celeste, Pascal
e Rubik) che hanno pedalato assieme a me durante questi anni contribuendo a rendere
più lieve sia la fatica della salita che quella del lavoro. Grazie a tutti i componenti della
tessiner Mafia che hanno contribuito a farmi sentire a casa anche qui a Zurigo: Andrea
(con le sue Pato-stories sulla pesca ai ciurlitt, il salmone dell’Alaska e la sua torta mitica
di castagne da 32.6 g/cm3), Laura (con le sue infinite lamentele sul suo lavoro di
diploma), Caterina, Cesare, Dafne (per il Vegorness), Giorgia, Torria, Giovanni (per
la macchina del caffé) e Frep. Thanks also to all other past and present members of the
Phytopathology group for the nice working atmosphere they contributed to create &
danke auch an alle diejenigen die mit praktische Hilfe, fruchtbaren Diskussionen oder
moralische Unterstüzung geholfen haben: Monika, Alban, Chunxia, Christian R., Ueli,
Flori, Champa, Maggie, Monday, Tuesday and even Wednesday… (and sorry if I forgot
someone!) Come dimenticare poi i miei fantastici amici Samantha, Guya e Giambo
con i quali ho trascorso belle serate a giocare a Risiko (Hasbro Italy s.r.l., Rozzano, Italia)
e innumerevoli pause a giocare a Peppa e Jass? Ringrazio mia mamma, la mia
famiglia e tutti coloro che attraverso la mia educazione mi hanno permesso di arrivare
fino a questo punto. E in special modo il mio amore e la mia gratitudine vanno a Moira
che mi ha sostenuto ed ha avuto la pazienza di aspettarmi per tutti questi lunghi anni!
- 163 -
CURRICULUM VITAE FABIO REZZONICO Born on February 1, 1973 in Sorengo (TI), Switzerland. Citizen of Lugano (TI), Switzerland. 11/1999 - 09/2004 Research assistant and PhD student. Subject: “Analysis of stress response and molecular mechanisms involved in biocontrol activity of biocontrol pseudomonads”. Swiss Federal Institute of Technology, Phytopathology group, Zürich, Switzerland. 01/1999 - 10/1999 Scientific collaborator. Swiss Federal Institute of Technology, Phytopathology group, Zürich, Switzerland. 10/1993 - 10/1998 Study of biology Degree certificate in biology ETH. Swiss Federal Institute of Technology, Zürich, Switzerland. Subjects: microbiology, molecular biology, cell biology, biotechnology and plant physiology. Semester work: “Effect of altered gravity conditions on growth, morphology and physiology of yeast Saccharomyces cerevisae”. Space Biology Group ETH, Zürich, Switzerland. Diploma thesis: “Early gene expression in mitogen-activated T lymphocytes under simulated microgravity conditions”. Space Biology Group ETH, Zürich, Switzerland. 10/1992 - 10/1993 Study of Chemistry (2 semesters only). 09/1988 - 07/1992 School-leaving examination Type C, scientific. Liceo Diocesano, Breganzona (TI) 09/1984 - 06/1988 Secondary school. Istituto Elvetico, Lugano (TI). 09/1979 - 06/1984 Primary school. Istituto Elvetico, Lugano (TI).
- 164 -
PUBLICATIONS IN PEER REVIEWED JOURNALS Rezzonico F., Binder C., Défago G., Moënne-Loccoz Y. 2004. Evolutionary recycling of phytopathology-related type III secretion system gene(s) leads to development of beneficial plant-microbe interaction. Molecular Plant-Microbe Interactions (submitted, in review). Rezzonico F., Défago G., Moënne-Loccoz Y. 2004. Comparison of ATPase-encoding type III secretion system gene hrcN in biocontrol fluorescent pseudomonads and phytopathogenic proteobacteria. Applied and Environmental Microbiology 70: 5119-5131. Rezzonico F., Moënne-Loccoz Y., Défago G. 2003. Effect of stress on the ability of a phlA-based quantitative competitive PCR assay to monitor biocontrol strain Pseudomonas fluorescens CHA0. Applied and Environmental Microbiology 69: 686-690. IN PROCEEDINGS Rezzonico F., Moënne-Loccoz Y., Défago G. Impact of cell stress on the efficacy of phlA-based quantitative competitive PCR in biocontrol Pseudomonas fluorescens CHA0. Proceedings of APS 2002 Annual Meeting, Milwaukee, Wisconsin (July 27-31, 2002). Phytopathology 92: S69. IN PERIODICALS Rezzonico F. 2002. Giove veglia sui pesci... Meridiana 161: 9-10. Organo della Società Astronomica Ticinese. POSTERS AND SCIENTIFIC PRESENTATIONS Rezzonico F., Défago G., Moënne-Loccoz Y.: Acquisition of a type III protein secretion system by Pseudomonas KD is evolutionary recent and contributes to its biocontrol activity against Pythium. “Rhizosphere 2004”, Munich, Germany, (September 12-17, 2004). Rezzonico F., Käser S., Moënne-Loccoz Y., Défago G.: A type III protein secretion system is implicated in the biocontrol activity of Pseudomonas sp. KD against Pythium ultimum. “Plant health”, 6th Symposium of the Zurich-Basel Plant Science Center, Zürich, Switzerland (December 05, 2003). Rezzonico F., Käser S., Moënne-Loccoz Y., Défago G.: A type III protein secretion system is implicated in the biocontrol activity of Pseudomonas sp. KD against Pythium ultimum. 6th PGPR Workshop, Calicut, India (October 05 -10, 2003). Rezzonico F., Moënne-Loccoz Y., Défago G.: Impact of cell stress on the efficacy of phlA-based quantitative competitive PCR in biocontrol Pseudomonas fluorescens CHA0. APS 2002 Annual Meeting, Milwaukee, Wisconsin (July 27-31, 2002).
- 165 -
Rezzonico F., Molina L., Binder C., Défago G.: Type III protein secretion system in biocontrol strain Pseudomonas putida KD. 4th Symposium of the Competence Center for Plant Sciences, Zürich, Switzerland (December 07, 2001). Rezzonico F., Molina L., Binder C., Défago G.: Biocontrol implications of type III protein secretion system in Pseudomonas putida KD. Herbsttagung der Schweizerischen Gesellschaft für Phytomedizin, ETH-Zürich, Switzerland (October 04, 2001). Rezzonico F., Molina L., Binder C., Défago G.: Type III protein secretion system in biocontrol strain Pseudomonas putida KD. ISME-9 (International Society for Microbial Ecology), Interactions in the Microbial World, Amsterdam, Netherlands (August 26-31, 2001). Molina L., Rezzonico F., Binder C., Défago G.: Implications of the type III secretion system in the biocontrol activity of Pseudomonas putida strain KD. Microbial Adherence and Signal Transduction, in: Gordon Research Conferences. Salve Regina University, Newport, Rhode Island (July-August, 2001). Rezzonico F., Binder C., Défago G.: Biocontrol implications of type III protein secretion system in Pseudomonas putida. 60th Annual Assembly of the Swiss Society for Microbiology, Lausanne, Switzerland (March 08-09, 2001).