Chapter 01 - Limits, Alternatives, and Choices 1-1 Chapter 01 Limits, Alternatives, and Choices True / False Questions 1. Rational individuals may make different choices because their information and circumstances differ. TRUE Accessibility: Keyboard Navigation Difficulty: Easy Learning Objective: 01-02 Define economics and the features of the economic way of thinking. Topic: 01-05 Marginal Analysis: Comparing Benefits and Costs 2. Certain inherently desirable products such as education and health care should be produced so long as resources are available. FALSE Accessibility: Keyboard Navigation Difficulty: Medium Learning Objective: 01-02 Define economics and the features of the economic way of thinking. Topic: 01-07 Microeconomics and Macroeconomics 3. Marginal analysis means that decision-makers compare the extra benefits with the extra costs of a specific choice. TRUE Accessibility: Keyboard Navigation Difficulty: Easy Learning Objective: 01-02 Define economics and the features of the economic way of thinking. Topic: 01-08 Microeconomics
Transcript
Chapter 01 - Limits, Alternatives, and Choices
1-1
Chapter 01
Limits, Alternatives, and Choices
True / False Questions
1. Rational individuals may make different choices because their information and
circumstances differ.
TRUE
Accessibility: Keyboard Navigation
Difficulty: Easy
Learning Objective: 01-02 Define economics and the features of the economic way of thinking. Topic: 01-05 Marginal Analysis: Comparing Benefits and Costs
2. Certain inherently desirable products such as education and health care should be produced
so long as resources are available.
FALSE
Accessibility: Keyboard Navigation
Difficulty: Medium Learning Objective: 01-02 Define economics and the features of the economic way of thinking.
Topic: 01-07 Microeconomics and Macroeconomics
3. Marginal analysis means that decision-makers compare the extra benefits with the extra
costs of a specific choice.
TRUE
Accessibility: Keyboard Navigation
Difficulty: Easy
Learning Objective: 01-02 Define economics and the features of the economic way of thinking. Topic: 01-08 Microeconomics
Chapter 01 - Limits, Alternatives, and Choices
1-2
4. Choices entail marginal costs because resources are scarce.
TRUE
Accessibility: Keyboard Navigation
Difficulty: Easy Learning Objective: 01-02 Define economics and the features of the economic way of thinking.
Topic: 01-08 Microeconomics
5. If economic theories are solidly based on relevant facts, then there can be no question as to
Learning Objective: 01-06 List the categories of scarce resources and delineate the economic problem.
Topic: 01-18 Income Changes
14. The production possibilities curve shows various combinations of two products which an
economy can produce when achieving full employment and productive efficiency.
TRUE
Accessibility: Keyboard Navigation
Difficulty: Easy
Learning Objective: 01-07 Apply the concepts of production possibilities analysis; increasing opportunity costs; and economic growth. Topic: 01-23 Labour
15. An economy will always operate at some point on its production possibilities curve.
FALSE
Accessibility: Keyboard Navigation
Difficulty: Medium Learning Objective: 01-07 Apply the concepts of production possibilities analysis; increasing opportunity costs; and economic growth.
Topic: 01-23 Labour
Chapter 01 - Limits, Alternatives, and Choices
1-5
16.
Refer to the above production possibilities curves. Given production possibilities curve (a),
point Y indicates that society is failing to use available resources efficiently.
FALSE
Difficulty: Medium
Learning Objective: 01-07 Apply the concepts of production possibilities analysis; increasing opportunity costs; and economic growth.
Topic: 01-23 Labour
Chapter 01 - Limits, Alternatives, and Choices
1-6
17.
Refer to the above production possibilities curves. The movement from curve (a) to curve (b)
implies an increase in the quantity and/or quality of society's productive resources.
TRUE
Difficulty: Hard
Learning Objective: 01-07 Apply the concepts of production possibilities analysis; increasing opportunity costs; and economic growth.
Topic: 01-23 Labour
Chapter 01 - Limits, Alternatives, and Choices
1-7
18.
Refer to the above production possibilities curves. Given production possibilities curve (a),
the combination of civilian and war goods indicated by point X is unattainable to this
economy.
FALSE
Difficulty: Easy
Learning Objective: 01-07 Apply the concepts of production possibilities analysis; increasing opportunity costs; and economic growth.
Topic: 01-23 Labour
19. An economy cannot produce at a point outside of its production possibilities curve
because human material wants are insatiable.
FALSE
Accessibility: Keyboard Navigation
Difficulty: Medium
Learning Objective: 01-07 Apply the concepts of production possibilities analysis; increasing opportunity costs; and economic growth. Topic: 01-23 Labour
Chapter 01 - Limits, Alternatives, and Choices
1-8
20. Although sleeping in on a work day or school day has an opportunity cost, sleeping late on
the weekend does not.
FALSE
Accessibility: Keyboard Navigation
Difficulty: Hard Learning Objective: 01-07 Apply the concepts of production possibilities analysis; increasing opportunity costs; and economic growth.
Topic: 01-23 Labour
21. Recessions are characterised by points that are not attainable on the production
possibilities curve.
FALSE
Accessibility: Keyboard Navigation Difficulty: Medium
Learning Objective: 01-07 Apply the concepts of production possibilities analysis; increasing opportunity costs; and economic growth.
Topic: 01-23 Labour
Chapter 01 - Limits, Alternatives, and Choices
1-9
22. Refer to the production possibilities curves. The movement from curve (a) to curve (c)
indicates an improvement in civilian goods technology but not in war goods technology.
FALSE
Difficulty: Medium
Learning Objective: 01-08 Explain how economic growth and international trade increase consumption possibilities. Topic: 01-27 Production Possibilities Table
23. The present choice of position on the production possibilities curve will not influence the
future location of the curve.
FALSE
Accessibility: Keyboard Navigation Difficulty: Medium
Learning Objective: 01-08 Explain how economic growth and international trade increase consumption possibilities.
Topic: 01-27 Production Possibilities Table
Multiple Choice Questions
Chapter 01 - Limits, Alternatives, and Choices
1-10
24. The economic concept that serves as the basis for the study of economics is:
A. inflation.
B. unemployment.
C. money.
D. scarcity.
Accessibility: Keyboard Navigation
Difficulty: Easy Learning Objective: 01-01 List the ten key concepts to retain for a lifetime.
Topic: 01-01 Ten Key Concepts to Retain for a Lifetime
25. As a consequence of the condition of scarcity:
A. there is always enough of everything.
B. production has to be centrally planned.
C. things which are plentiful have relatively high prices.
D. individuals and communities have to make choices among alternatives.
Learning Objective: 01-04 Distinguish microeconomics from macroeconomics; and positive economics from normative economics.
Topic: 01-12 Limited Income
83. The individuals and society both face an economic problem. This problem arises from the
fact that:
A. wants are limited but the resources are not.
B. resources are scarce relative to individual's wants.
C. individuals and institutions behave only in their self-interest.
D. both wants and resources are unlimited.
Accessibility: Keyboard Navigation
Difficulty: Easy
Learning Objective: 01-05 Explain the individual's economic problem and how trade-offs; opportunity costs; and attainable combinations can be illustrated with budget lines.
Topic: 01-14 The Budget Line
Chapter 01 - Limits, Alternatives, and Choices
1-30
84. The individual's limited income problem:
A. persists only because countries have failed to achieve continuous full employment.
B. exists because material wants are limited.
C. has been solved in all industrialized nations.
D. has been eliminated in affluent societies such as Canada and the United States.
Accessibility: Keyboard Navigation
Difficulty: Easy Learning Objective: 01-05 Explain the individual's economic problem and how trade-offs; opportunity costs; and attainable combinations
can be illustrated with budget lines.
Topic: 01-15 Attainable and Unattainable Combinations
85. When an economist says that material wants are insatiable, this means that:
A. economic resources are valuable only because they can be used to produce consumer
goods.
B. economic resources—land, labour, capital, and entrepreneurial ability—are scarce.
C. these wants are virtually unlimited and therefore incapable of complete satisfaction.
D. the structure of consumer demand varies from time to time and from country to country.
Accessibility: Keyboard Navigation
Difficulty: Easy
Learning Objective: 01-05 Explain the individual's economic problem and how trade-offs; opportunity costs; and attainable combinations can be illustrated with budget lines.
Topic: 01-14 The Budget Line
86. As used in economics, the notion of scarce resources means that:
A. mineral deposits are only available in finite amounts.
B. resources are not so plentiful that all individuals' material wants can be fulfilled.
C. some resources are free while others have price tags on them.
D. the quantities available of some resources exceed the demand for them.
Accessibility: Keyboard Navigation
Difficulty: Easy
Learning Objective: 01-05 Explain the individual's economic problem and how trade-offs; opportunity costs; and attainable combinations
can be illustrated with budget lines. Topic: 01-14 The Budget Line
Chapter 01 - Limits, Alternatives, and Choices
1-31
87. The budget line shows:
A. the amount of product A which a consumer is willing to give up to obtain one more unit of
product B.
B. all possible combinations of two goods which can be purchased, given money income and
the prices of the goods.
C. all equilibrium points on an indifference map.
D. all possible combinations of two goods which yield the same level of utility to the
consumer.
Accessibility: Keyboard Navigation
Difficulty: Easy Learning Objective: 01-05 Explain the individual's economic problem and how trade-offs; opportunity costs; and attainable combinations
can be illustrated with budget lines.
Topic: 01-17 Choice
88. The price ratio of the two products is the:
A. marginal rate of substitution.
B. slope of the budget line.
C. point of tangency for equilibrium.
D. elasticity of demand for the two products.
Accessibility: Keyboard Navigation
Difficulty: Easy
Learning Objective: 01-05 Explain the individual's economic problem and how trade-offs; opportunity costs; and attainable combinations can be illustrated with budget lines.
Topic: 01-17 Choice
Chapter 01 - Limits, Alternatives, and Choices
1-32
89. Refer to the budget line shown in the diagram below. If the consumer's money income is
$20, the:
A. prices of C and D cannot be determined.
B. price of C is $2 and the price of D is $4.
C. consumer can obtain a combination of 5 units of both C and D.
D. price of C is $4 and the price of D is $2.
Difficulty: Hard Learning Objective: 01-05 Explain the individual's economic problem and how trade-offs; opportunity costs; and attainable combinations
can be illustrated with budget lines.
Topic: 01-17 Choice
Chapter 01 - Limits, Alternatives, and Choices
1-33
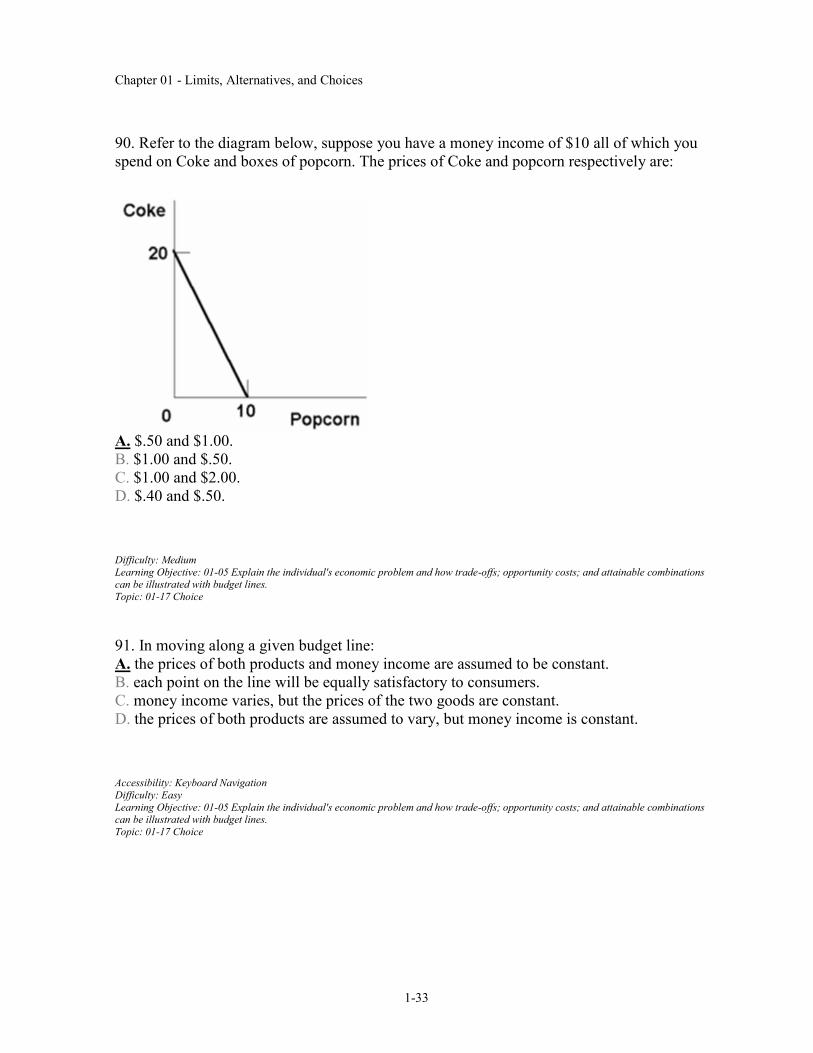
90. Refer to the diagram below, suppose you have a money income of $10 all of which you
spend on Coke and boxes of popcorn. The prices of Coke and popcorn respectively are:
A. $.50 and $1.00.
B. $1.00 and $.50.
C. $1.00 and $2.00.
D. $.40 and $.50.
Difficulty: Medium
Learning Objective: 01-05 Explain the individual's economic problem and how trade-offs; opportunity costs; and attainable combinations can be illustrated with budget lines.
Topic: 01-17 Choice
91. In moving along a given budget line:
A. the prices of both products and money income are assumed to be constant.
B. each point on the line will be equally satisfactory to consumers.
C. money income varies, but the prices of the two goods are constant.
D. the prices of both products are assumed to vary, but money income is constant.
Accessibility: Keyboard Navigation
Difficulty: Easy
Learning Objective: 01-05 Explain the individual's economic problem and how trade-offs; opportunity costs; and attainable combinations can be illustrated with budget lines.
Topic: 01-17 Choice
Chapter 01 - Limits, Alternatives, and Choices
1-34
92. In drawing a budget line it is assumed that:
A. consumer preferences are fixed.
B. the prices of the two products are variable.
C. money income is fixed.
D. consumer willingness to substitute between the two products is fixed.
Accessibility: Keyboard Navigation
Difficulty: Easy Learning Objective: 01-05 Explain the individual's economic problem and how trade-offs; opportunity costs; and attainable combinations
can be illustrated with budget lines.
Topic: 01-17 Choice
93. Any combination of goods lying outside of the budget line:
A. implies that the consumer is not spending all of his income.
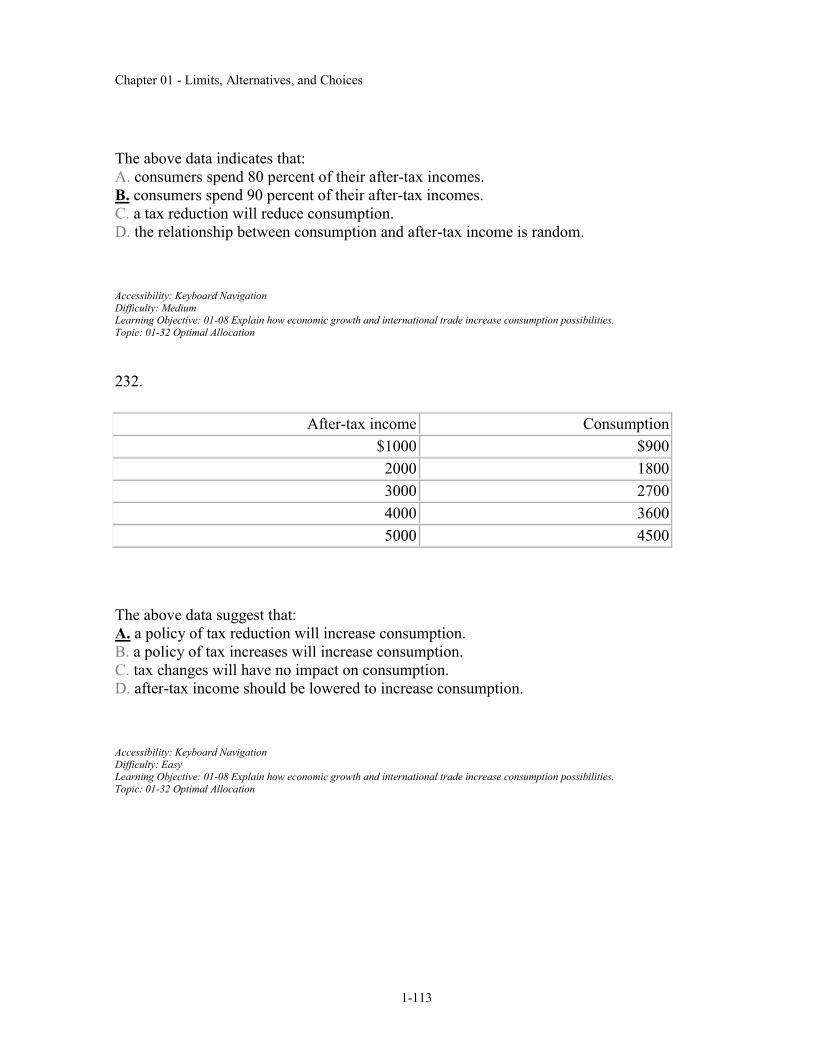
B. yields less utility than any point on the budget line.
C. yields less utility than any point inside the budget line.
D. is unattainable, given the consumer's income.
Accessibility: Keyboard Navigation
Difficulty: Easy
Learning Objective: 01-05 Explain the individual's economic problem and how trade-offs; opportunity costs; and attainable combinations can be illustrated with budget lines.
Topic: 01-17 Choice
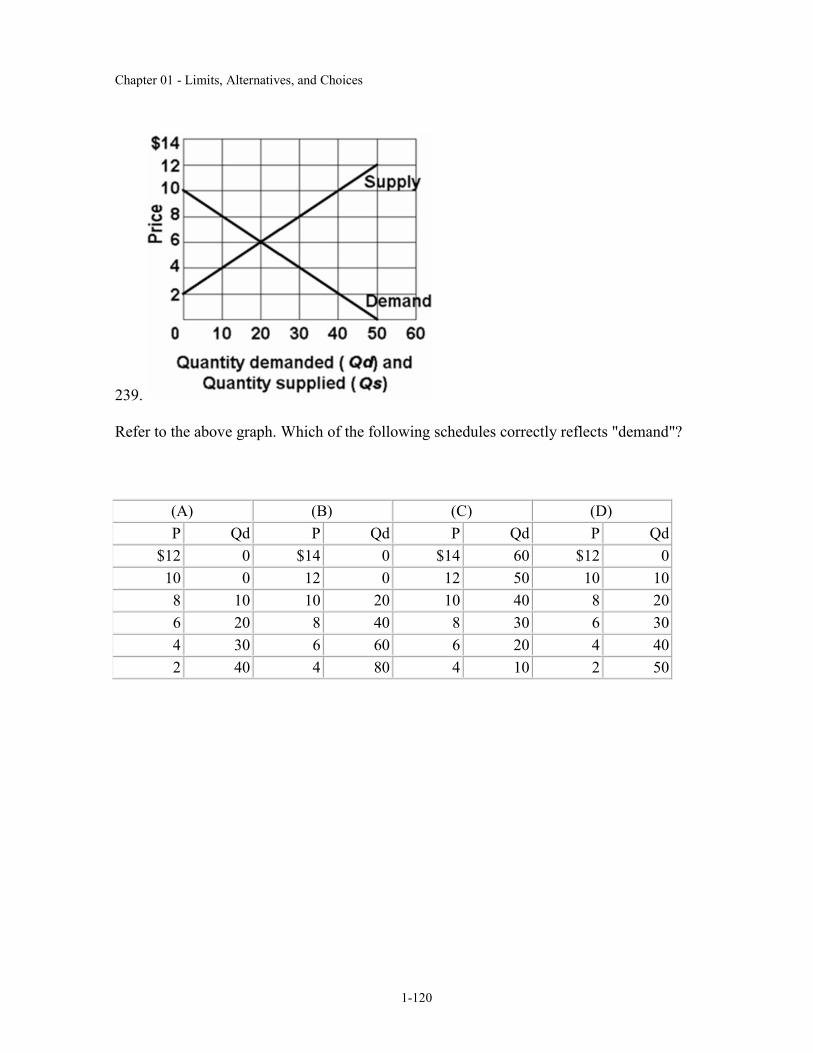
Chapter 01 - Limits, Alternatives, and Choices
1-35
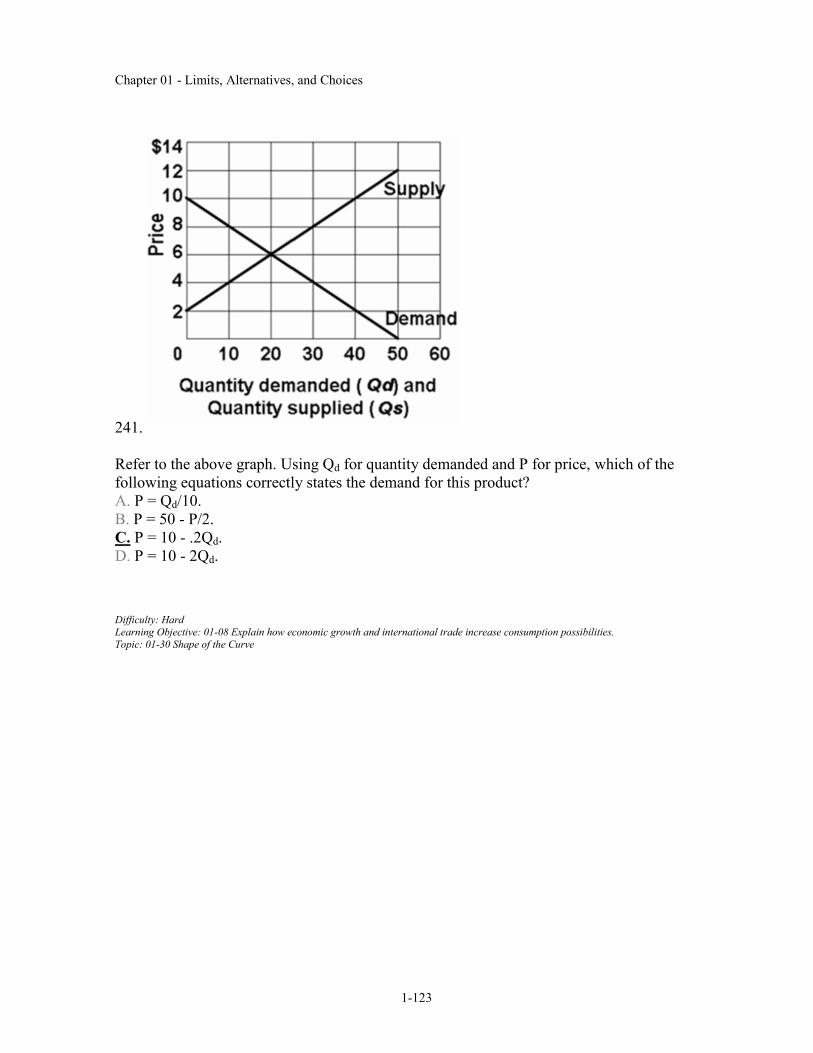
94. The budget line shift from cd to ab in the below figure is consistent with:
A. decreases in the prices of both M and N.
B. an increase in the price of M and a decrease in the price of N.
C. a decrease in money income.
D. an increase in money income.
Difficulty: Easy
Learning Objective: 01-05 Explain the individual's economic problem and how trade-offs; opportunity costs; and attainable combinations can be illustrated with budget lines.
Topic: 01-17 Choice
95. A leftward shift of a consumer's budget line to a position parallel with the original one
could indicate that the:
A. price of one product has decreased in relation to the other.
B. prices of both products have decreased in the same proportion.
C. marginal utilities derived from both products have decreased.
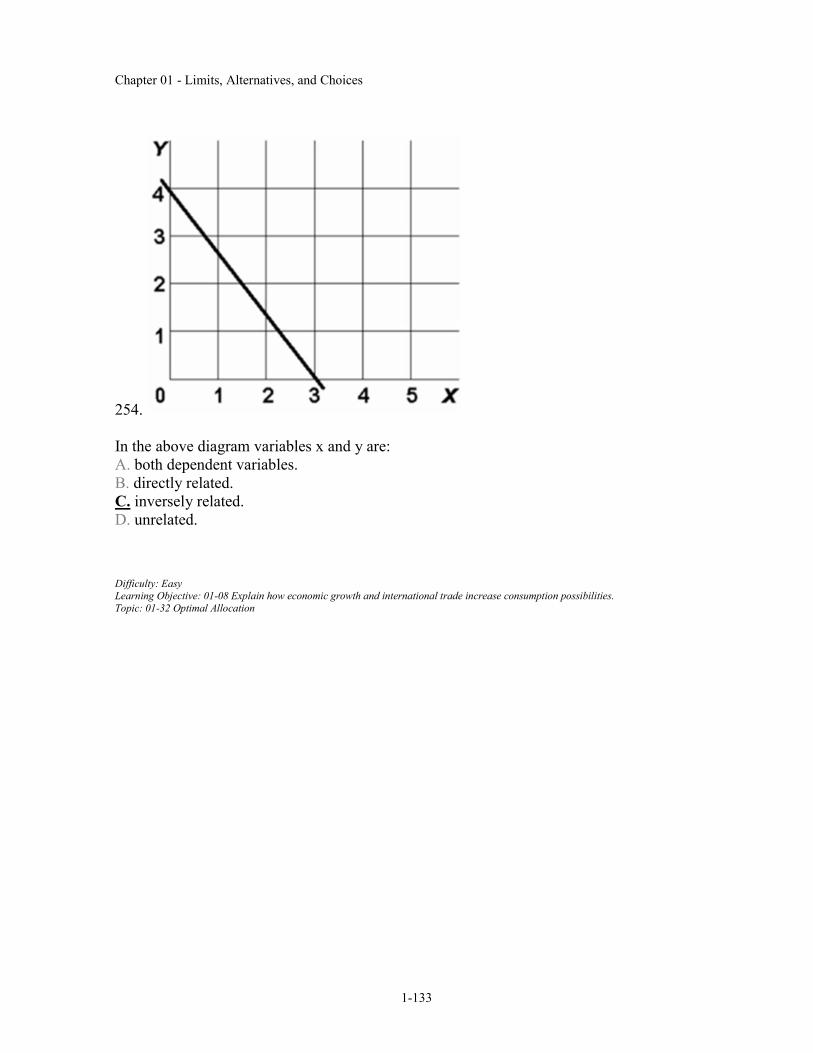
D. consumer's money income has increased but the prices of both products have increased
proportionately more.
Accessibility: Keyboard Navigation
Difficulty: Medium
Learning Objective: 01-05 Explain the individual's economic problem and how trade-offs; opportunity costs; and attainable combinations can be illustrated with budget lines.
Topic: 01-17 Choice
Chapter 01 - Limits, Alternatives, and Choices
1-36
96. Which of the following statements is not correct?
A. A reduction in money income will shift the budget line to the right.
B. A reduction in money income accompanied by an increase in product prices will
necessarily shift the budget line to the left.
C. An increase in product prices will shift the budget line to the left.
D. An increase in money income will shift the budget line to the right.
Accessibility: Keyboard Navigation
Difficulty: Medium Learning Objective: 01-05 Explain the individual's economic problem and how trade-offs; opportunity costs; and attainable combinations
can be illustrated with budget lines.
Topic: 01-17 Choice
97. The society must also make choices under conditions of scarcity. This problem arises
from the fact that:
A. society's wants are limited but the resources are not.
B. resources are scarce relative to society's wants.
C. societies behave only in their self-interest.
D. society's wants and resources are both unlimited.
Accessibility: Keyboard Navigation
Difficulty: Easy
Learning Objective: 01-06 List the categories of scarce resources and delineate the economic problem. Topic: 01-19 Society's Economic Problem
98. The fundamental problem of economics is:
A. to establish a democratic political framework for the provision of social goods and
services.
B. the establishment of prices which accurately reflect the relative scarcities of products and
resources.
C. the scarcity of productive resources relative to material wants.
D. to achieve a more equitable distribution of money income in order to mitigate poverty.
Accessibility: Keyboard Navigation
Difficulty: Easy Learning Objective: 01-06 List the categories of scarce resources and delineate the economic problem.
Topic: 01-19 Society's Economic Problem
Chapter 01 - Limits, Alternatives, and Choices
1-37
99. Economic resources are also called:
A. free gifts of nature.
B. consumption goods.
C. units of money capital.
D. factors of production.
Accessibility: Keyboard Navigation
Difficulty: Easy Learning Objective: 01-06 List the categories of scarce resources and delineate the economic problem.
Topic: 01-20 Scarce Resources
100. Money is not considered to be an economic resource because:
A. money, as such, is not productive.
B. idle money balances do not earn interest income.
C. the terms of trade can be determined in non-monetary terms.
Learning Objective: 01-07 Apply the concepts of production possibilities analysis; increasing opportunity costs; and economic growth.
Topic: 01-23 Labour
111. The production possibilities curve shows:
A. the various combinations of two goods which can be produced when society uses its scarce
resources efficiently.
B. the minimum outputs of two goods which will sustain a society.
C. the various combinations of two goods which can be produced when some resources are
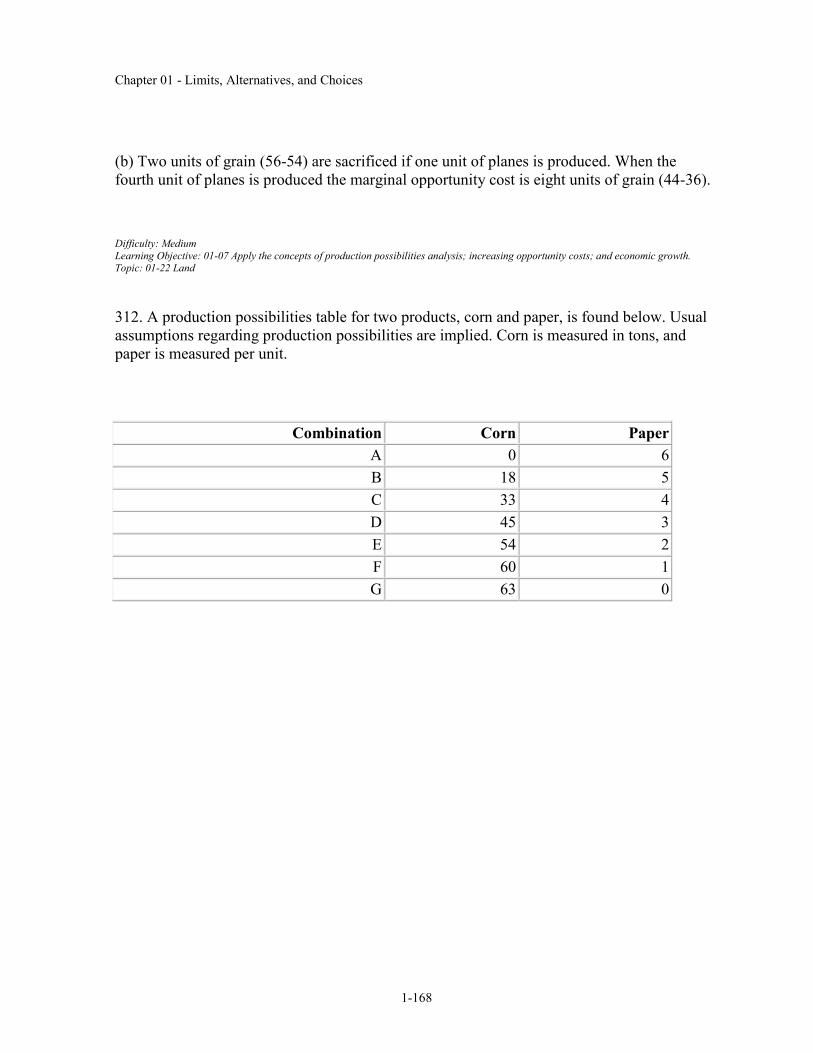
unemployed.
D. the ideal, but unattainable, combinations of two goods which would maximize consumer
satisfactions.
Accessibility: Keyboard Navigation
Difficulty: Easy
Learning Objective: 01-07 Apply the concepts of production possibilities analysis; increasing opportunity costs; and economic growth. Topic: 01-23 Labour
Chapter 01 - Limits, Alternatives, and Choices
1-43
112. The negative slope of the production possibilities curve is a graphical way of indicating
that:
A. any economy "can have its cake and eat it too."
B. to produce more of one product we must accept less of another.
C. the principle of increasing opportunity costs does not apply to the economy as a whole.
D. consumers buy more when prices are low than they do when prices are high.
Accessibility: Keyboard Navigation
Difficulty: Easy Learning Objective: 01-07 Apply the concepts of production possibilities analysis; increasing opportunity costs; and economic growth.
Topic: 01-23 Labour
113. If an economy is operating on its production possibilities curve for consumer goods and
capital goods, this means that:
A. it is impossible to produce more consumer goods.
B. resources cannot be reallocated between the two goods.
C. it is impossible to produce more capital goods.
D. more consumer goods can only be produced at the cost of fewer capital goods.
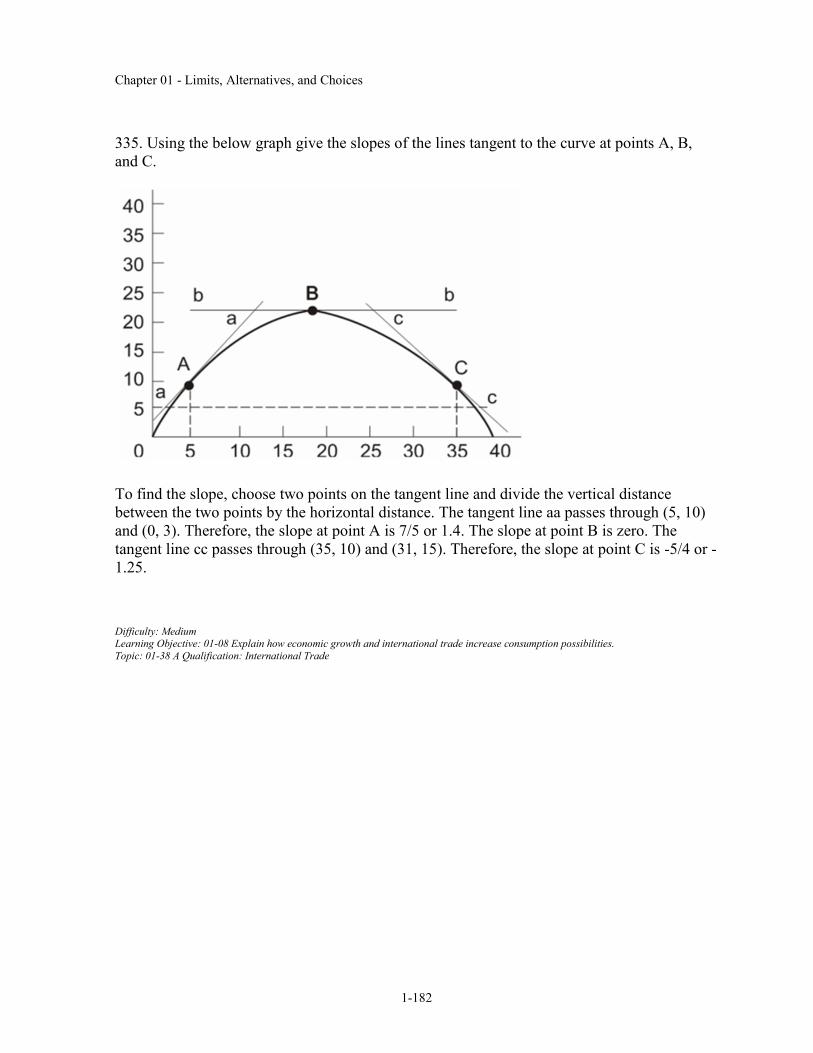
Learning Objective: 01-07 Apply the concepts of production possibilities analysis; increasing opportunity costs; and economic growth.
Topic: 01-23 Labour
114. In drawing a production possibilities curve we hold constant:
A. the money supply.
B. the consumer price index.
C. both technology and resource supplies
D. resource supplies only.
Accessibility: Keyboard Navigation
Difficulty: Easy
Learning Objective: 01-07 Apply the concepts of production possibilities analysis; increasing opportunity costs; and economic growth. Topic: 01-23 Labour
Chapter 01 - Limits, Alternatives, and Choices
1-44
115. The production possibilities curve tells us:
A. what specific combinations of two products is most desired by society.
B. that costs do not change as society varies its output.
C. costs are irrelevant in a society which has fixed resources.
D. what combinations of two goods can be produced with society's available resources.
Accessibility: Keyboard Navigation
Difficulty: Easy Learning Objective: 01-07 Apply the concepts of production possibilities analysis; increasing opportunity costs; and economic growth.
Topic: 01-23 Labour
116. When an economy is operating with maximum efficiency, the production of more of
commodity A will mean the production of less of commodity B because:
A. of the law of decreasing opportunity costs.
B. material wants are insatiable.
C. resources are limited.
D. resources are not specialized and are imperfectly substitutable.
Learning Objective: 01-07 Apply the concepts of production possibilities analysis; increasing opportunity costs; and economic growth.
Topic: 01-23 Labour
117. The production possibilities curve:
A. shows all of those levels of production which are consistent with a stable price level.
B. indicates that any combination of goods lying outside the curve is economically inefficient.
C. is a frontier between all combinations of two goods which can be produced and those
combinations which cannot be produced.
D. shows all of those combinations of two goods which are most preferred by society.
Accessibility: Keyboard Navigation
Difficulty: Easy
Learning Objective: 01-07 Apply the concepts of production possibilities analysis; increasing opportunity costs; and economic growth. Topic: 01-23 Labour
Chapter 01 - Limits, Alternatives, and Choices
1-45
118. The production possibilities curve illustrates the basic principle that:
A. the production of more of any one good will in time require smaller and smaller sacrifices
of other goods.
B. an economy will automatically seek that level of output at which all of its resources are
employed.
C. if all the resources of an economy are in use, more of one good can be produced only if
less of another good is produced.
D. an economy's capacity to produce increases in proportion to its population size.
Accessibility: Keyboard Navigation
Difficulty: Easy Learning Objective: 01-07 Apply the concepts of production possibilities analysis; increasing opportunity costs; and economic growth.
Topic: 01-23 Labour
119. A production possibilities curve illustrates:
Learning Objective: 01-07 Apply the concepts of production possibilities analysis; increasing opportunity costs; and economic growth.
Topic: 01-23 Labour
120. A production possibilities curve shows:
A. that resources are unlimited.
B. that people prefer one of the goods more than the other.
C. the maximum amounts of two goods which can be produced assuming the full and efficient
use of available resources.
D. combinations of capital and labour necessary to produce specific levels of output.
Accessibility: Keyboard Navigation
Difficulty: Easy
Learning Objective: 01-07 Apply the concepts of production possibilities analysis; increasing opportunity costs; and economic growth. Topic: 01-23 Labour
Chapter 01 - Limits, Alternatives, and Choices
1-46
121. In drawing the production possibilities curve we assume that:
A. technology is fixed.
B. unemployment exists.
C. economic resources are unlimited.
D. wants are limited.
Accessibility: Keyboard Navigation
Difficulty: Easy Learning Objective: 01-07 Apply the concepts of production possibilities analysis; increasing opportunity costs; and economic growth.
Topic: 01-23 Labour
122. Which of the following is assumed in constructing a typical production possibilities
curve?
A. the economy is using its resources inefficiently.
B. resources are perfectly shiftable among alternative uses.
C. production technology is fixed.
D. the economy is engaging in international trade.
Learning Objective: 01-07 Apply the concepts of production possibilities analysis; increasing opportunity costs; and economic growth.
Topic: 01-23 Labour
123. Which of the following is not correct? A typical production possibilities curve:
A. indicates how much of two products a society can produce.
B. reveals how much each additional unit of one product will cost in terms of the other
product.
C. specifies how much of each product society should produce.
D. indicates that to produce more of one product society must give up larger and larger
amounts of the other product.
Accessibility: Keyboard Navigation
Difficulty: Medium
Learning Objective: 01-07 Apply the concepts of production possibilities analysis; increasing opportunity costs; and economic growth. Topic: 01-23 Labour
Chapter 01 - Limits, Alternatives, and Choices
1-47
124. Which one of the following statements is correct?
A. Relative scarcity is no longer a central notion in economics because we are in an age of
abundance.
B. Most production possibilities curves are convex as viewed from the origin.
C. The production possibilities curve shows society's preferences for consumer goods relative
to capital goods.
D. The central concept underlying the production possibilities curve is that of limited
resources.
Accessibility: Keyboard Navigation
Difficulty: Medium Learning Objective: 01-07 Apply the concepts of production possibilities analysis; increasing opportunity costs; and economic growth.
Topic: 01-23 Labour
125. The typical production possibilities curve is:
A. an upward sloping line which is concave to the origin.
B. a downward sloping line which is convex to the origin.
C. a downward sloping line which is concave to the origin.
Learning Objective: 01-07 Apply the concepts of production possibilities analysis; increasing opportunity costs; and economic growth.
Topic: 01-23 Labour
Chapter 01 - Limits, Alternatives, and Choices
1-48
126. Refer to the diagram below. Points A, B, C, D, and E show:
A. that the opportunity cost of bicycles increases, while that of computers is constant.
B. combinations of bicycles and computers which society can produce by using its resources
efficiently.
C. that the opportunity cost of computers increases, while that of bicycles is constant.
D. that society's demand for computers is greater than its demand for bicycles.
Difficulty: Easy
Learning Objective: 01-07 Apply the concepts of production possibilities analysis; increasing opportunity costs; and economic growth. Topic: 01-24 Capital
Chapter 01 - Limits, Alternatives, and Choices
1-49
127. Refer to the following production possibilities curves. Curve (a) is the current curve for
the economy. Given production possibilities curve (a), the combination of capital and
consumer goods indicated by point L:
A. would entail substantial unemployment.
B. would entail an inefficient use of society's resources.
C. is beyond the productive capacity of this society.
D. suggests the productive capacity of the system is declining.
Difficulty: Easy Learning Objective: 01-07 Apply the concepts of production possibilities analysis; increasing opportunity costs; and economic growth.
Topic: 01-24 Capital
Chapter 01 - Limits, Alternatives, and Choices
1-50
128. A point on the frontier of the production possibilities curve is:
A. attainable and the economy is efficient.
B. attainable, but the economy is inefficient.
C. unattainable, but the economy is inefficient.
D. unattainable and the economy is efficient.
Accessibility: Keyboard Navigation
Difficulty: Easy Learning Objective: 01-07 Apply the concepts of production possibilities analysis; increasing opportunity costs; and economic growth.
Topic: 01-24 Capital
129. A point inside the production possibilities curve is:
Learning Objective: 01-07 Apply the concepts of production possibilities analysis; increasing opportunity costs; and economic growth.
Topic: 01-24 Capital
Chapter 01 - Limits, Alternatives, and Choices
1-51
130.
Refer to the above diagram. The combination of computers and bicycles shown by point G is:
A. attainable, but too costly.
B. unattainable, given currently available resources and technology.
C. attainable, but involves unemployment.
D. irrelevant because it is inconsistent with consumer preferences.
Difficulty: Easy
Learning Objective: 01-07 Apply the concepts of production possibilities analysis; increasing opportunity costs; and economic growth.
Topic: 01-24 Capital
Chapter 01 - Limits, Alternatives, and Choices
1-52
131.
Refer to the above diagram. The combination of computers and bicycles shown by point F:
A. is unattainable, given currently available resources and technology.
B. is attainable, but entails economic inefficiency.
C. is irrelevant because it is inconsistent with consumer preferences.
D. suggests that opportunity costs are constant.
Difficulty: Easy
Learning Objective: 01-07 Apply the concepts of production possibilities analysis; increasing opportunity costs; and economic growth.
Topic: 01-24 Capital
Chapter 01 - Limits, Alternatives, and Choices
1-53
132.
Refer to the above diagram. If society is currently producing the combination of bicycles and
computers shown by point D, the production of 2 more units of bicycles:
A. cannot be realized because resources are fully employed.
B. will cost 1 unit of computers.
C. will cost 2 units of computers.
D. will cause some resources to become unemployed.
Difficulty: Easy
Learning Objective: 01-07 Apply the concepts of production possibilities analysis; increasing opportunity costs; and economic growth. Topic: 01-24 Capital
Chapter 01 - Limits, Alternatives, and Choices
1-54
133.
Refer to the above diagram. The movement down the production possibilities curve from
point A to point E suggests that the production of:
A. computers, but not bicycles, is subject to increasing opportunity costs.
B. bicycles, but not computers, is subject to increasing opportunity costs.
C. both bicycles and computers is subject to constant opportunity costs.
D. both bicycles and computers is subject to increasing opportunity costs.
Difficulty: Medium
Learning Objective: 01-07 Apply the concepts of production possibilities analysis; increasing opportunity costs; and economic growth. Topic: 01-24 Capital
134. The slope of the typical production possibilities curve:
A. is positive.
B. increases as one moves southeast along the curve.
C. is constant as one moves down the curve.
D. decreases as one moves southeast along the curve.
Accessibility: Keyboard Navigation
Difficulty: Easy Learning Objective: 01-07 Apply the concepts of production possibilities analysis; increasing opportunity costs; and economic growth.
Topic: 01-24 Capital
Chapter 01 - Limits, Alternatives, and Choices
1-55
135. The production possibilities curve has:
A. a positive slope which increases as we move along it from left to right.
B. a negative slope which increases as we move along it from left to right.
C. a negative slope which decreases as we move along it from left to right.
D. a negative slope which is constant as we move along it from left to right.
Accessibility: Keyboard Navigation
Difficulty: Easy Learning Objective: 01-07 Apply the concepts of production possibilities analysis; increasing opportunity costs; and economic growth.
Topic: 01-24 Capital
136. The law of increasing opportunity costs states that:
A. if society wants to produce more of a particular good, it must sacrifice larger and larger
amounts of other goods to do so.
B. the sum of the costs of producing a particular good cannot rise above the current market
price of that good.
C. if the sum of the costs of producing a particular good rises by a specified percent, the price
of that good must rise by a greater relative amount.
D. if the prices of all the resources devoted to the production of goods increase, the cost of
producing any particular good will increase at the same rate.
Accessibility: Keyboard Navigation Difficulty: Medium
Learning Objective: 01-07 Apply the concepts of production possibilities analysis; increasing opportunity costs; and economic growth.
Topic: 01-24 Capital
Chapter 01 - Limits, Alternatives, and Choices
1-56
137.
Refer to the above diagram. This production possibilities curve is:
A. convex to the origin because opportunity costs are constant.
B. linear because opportunity costs are constant.
C. concave to the origin because of increasing opportunity costs.
D. convex to the origin because of increasing opportunity costs.
Difficulty: Easy
Learning Objective: 01-07 Apply the concepts of production possibilities analysis; increasing opportunity costs; and economic growth.
Topic: 01-24 Capital
Chapter 01 - Limits, Alternatives, and Choices
1-57
138.
Refer to the above diagram. If society is currently producing 9 units of bicycles and 4 units of
computers and it now decides to increase computer output to 6, the cost:
A. will be 4 units of bicycles.
B. will be 2 units of bicycles.
C. will be zero because unemployed resources are available.
D. of doing so cannot be determined from the information given.
Difficulty: Medium
Learning Objective: 01-07 Apply the concepts of production possibilities analysis; increasing opportunity costs; and economic growth. Topic: 01-24 Capital
139. The concept of opportunity cost:
A. is irrelevant in socialistic economies because of central planning.
B. suggests that the use of resources in any particular line of production means that alternative
outputs must be forgone.
C. is irrelevant if the production possibilities curve is shifting to the right.
D. suggests that insatiable wants can be fulfilled.
Accessibility: Keyboard Navigation
Difficulty: Easy Learning Objective: 01-07 Apply the concepts of production possibilities analysis; increasing opportunity costs; and economic growth.
Topic: 01-24 Capital
Chapter 01 - Limits, Alternatives, and Choices
1-58
140. Which of the following is not an illustration of the idea of opportunity cost?
A. A growing economy can produce more consumer goods and more capital goods at the
same time.
B. If I buy a pizza, I will not be able to afford a movie.
C. Resources devoted to consumer goods production are not available for capital goods
production.
D. The land a Manitoba farmer plants in wheat is not available for corn production.
Accessibility: Keyboard Navigation
Difficulty: Medium
Learning Objective: 01-07 Apply the concepts of production possibilities analysis; increasing opportunity costs; and economic growth.
Topic: 01-24 Capital
141. Opportunity cost is best defined as:
A. the monetary price of any productive resource.
B. the amount of labour which must be used to produce one unit of any product.
C. the ratio of the prices of imported goods to the prices of exported goods.
D. the amount of one product which must be given up to produce one more unit of another
Learning Objective: 01-07 Apply the concepts of production possibilities analysis; increasing opportunity costs; and economic growth.
Topic: 01-24 Capital
142. Production possibilities tables for two countries, North Cantina and South Cantina:
North Cantina
Production possibilities (alternatives)
A B C D E F
Capital goods 5 4 3 2 1 0
Consumer goods 0 10 18 24 28 30
Chapter 01 - Limits, Alternatives, and Choices
1-59
South Cantina
Production possibilities (alternatives)
A B C D E F
Capital goods 5 4 3 2 1 0
Consumer goods 0 8 15 21 25 27
Refer to the above tables. If South Cantina is producing at production alternative D, the
opportunity cost of the third unit of capital goods is:
A. 3 units of consumer goods.
B. 4 units of consumer goods.
C. 5 units of consumer goods.
D. 6 units of consumer goods.
Accessibility: Keyboard Navigation
Difficulty: Medium
Learning Objective: 01-07 Apply the concepts of production possibilities analysis; increasing opportunity costs; and economic growth. Topic: 01-22 Land
143. Production possibilities tables for two countries, North Cantina and South Cantina:
North Cantina
Production possibilities (alternatives)
A B C D E F
Capital goods 5 4 3 2 1 0
Consumer goods 0 10 18 24 28 30
Chapter 01 - Limits, Alternatives, and Choices
1-60
South Cantina
Production possibilities (alternatives)
A B C D E F
Capital goods 5 4 3 2 1 0
Consumer goods 0 8 15 21 25 27
Refer to the above tables. If North Cantina is producing at production alternative B, the
opportunity cost of the eleventh unit of consumer goods will be:
A. 10 units of capital goods.
B. 1/4 of a unit of capital goods.
C. 8 units of capital goods.
D. 1/8 of a unit of capital goods.
Accessibility: Keyboard Navigation
Difficulty: Medium
Learning Objective: 01-07 Apply the concepts of production possibilities analysis; increasing opportunity costs; and economic growth. Topic: 01-22 Land
144. Production possibilities tables for two countries, North Cantina and South Cantina:
North Cantina
Production possibilities (alternatives)
A B C D E F
Capital goods 5 4 3 2 1 0
Consumer goods 0 10 18 24 28 30
Chapter 01 - Limits, Alternatives, and Choices
1-61
South Cantina
Production possibilities (alternatives)
A B C D E F
Capital goods 5 4 3 2 1 0
Consumer goods 0 8 15 21 25 27
Refer to the above tables. The opportunity cost of the fifth unit of capital goods:
A. is higher in North Cantina than in South Cantina.
B. is the same in North Cantina and South Cantina.
C. is lower in North Cantina than in South Cantina.
D. cannot be determined from the information provided.
Accessibility: Keyboard Navigation
Difficulty: Medium
Learning Objective: 01-07 Apply the concepts of production possibilities analysis; increasing opportunity costs; and economic growth. Topic: 01-22 Land
Chapter 01 - Limits, Alternatives, and Choices
1-62
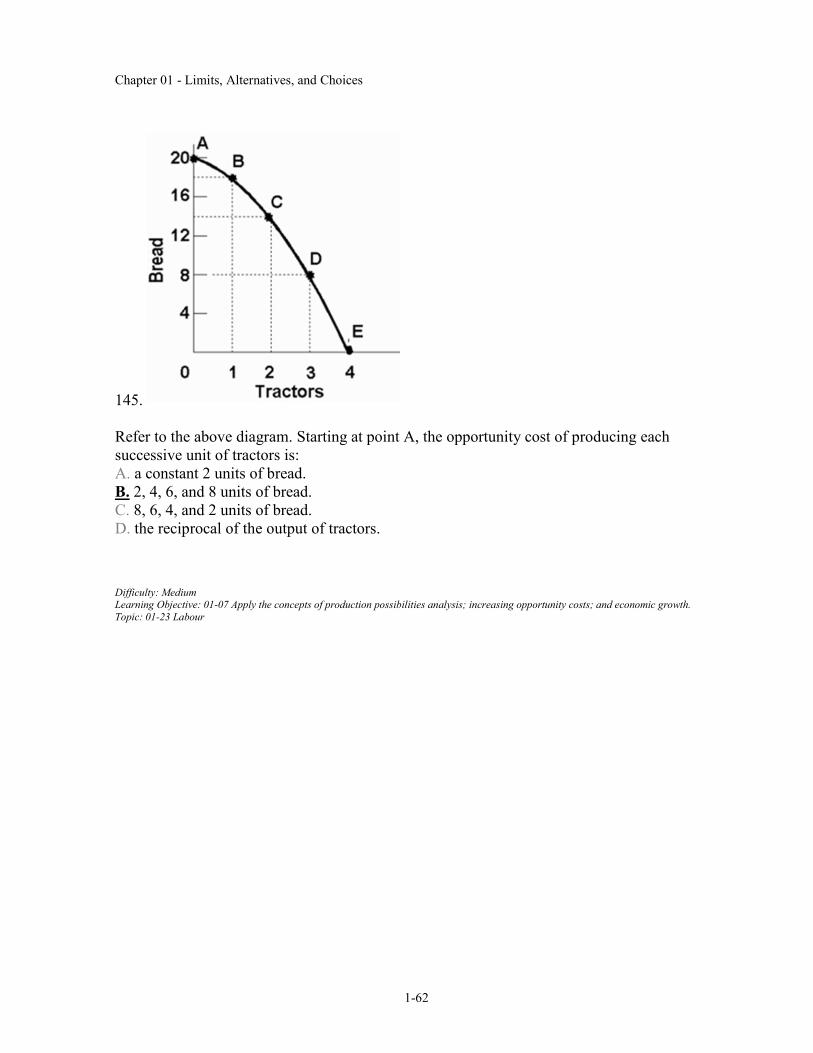
145.
Refer to the above diagram. Starting at point A, the opportunity cost of producing each
successive unit of tractors is:
A. a constant 2 units of bread.
B. 2, 4, 6, and 8 units of bread.
C. 8, 6, 4, and 2 units of bread.
D. the reciprocal of the output of tractors.
Difficulty: Medium Learning Objective: 01-07 Apply the concepts of production possibilities analysis; increasing opportunity costs; and economic growth.
Topic: 01-23 Labour
Chapter 01 - Limits, Alternatives, and Choices
1-63
146.
Refer to the above diagram. Starting at point E, the production of successive units of bread
will cost:
A. a constant 8 units of tractors.
B. a constant 6 units of tractors.
C. 1/8,
1/6,
1/4, and ½ units of tractors.
D. 1/2,
1/4,
1/6, and
1/8 units of tractors.
Difficulty: Hard
Learning Objective: 01-07 Apply the concepts of production possibilities analysis; increasing opportunity costs; and economic growth. Topic: 01-23 Labour
Chapter 01 - Limits, Alternatives, and Choices
1-64
147. Refer to the diagram below. The concept of opportunity cost is best represented by the:
A. shift of the production possibilities curve from PP1 to PP2.
B. move from B on PP1 to E on PP2.
C. move from B on PP1 to C on PP1.
D. move from D inside PP1 to B on PP1.
Difficulty: Easy
Learning Objective: 01-07 Apply the concepts of production possibilities analysis; increasing opportunity costs; and economic growth. Topic: 01-24 Capital
148. The fact that the slope of the production possibilities curve becomes steeper as we move
down along the curve indicates that:
A. the principle of increasing opportunity costs is relevant.
B. society's resources are limited.
C. the opportunity cost of producing each product is constant.
D. resources are perfectly shiftable between alternative uses.
Accessibility: Keyboard Navigation
Difficulty: Medium Learning Objective: 01-07 Apply the concepts of production possibilities analysis; increasing opportunity costs; and economic growth.
Topic: 01-24 Capital
Chapter 01 - Limits, Alternatives, and Choices
1-65
149. Production possibilities (alternatives)
A B C D E F
Capital goods 5 4 3 2 1 0
Consumer goods 0 5 9 12 14 15
Refer to the above table. If the economy is producing at production alternative C, the
opportunity cost of the tenth unit of consumer goods will be:
A. 4 units of capital goods.
B. 2 units of capital goods.
C. 3 units of capital goods.
D. 1/3 of a unit of capital goods.
Accessibility: Keyboard Navigation
Difficulty: Medium
Topic: 01-21 Resource Categories
150. Production possibilities (alternatives)
A B C D E F
Capital goods 5 4 3 2 1 0
Consumer goods 0 5 9 12 14 15
Chapter 01 - Limits, Alternatives, and Choices
1-66
Refer to the above table. For these data the law of increasing opportunity costs is reflected in
the fact that:
A. the amount of consumer goods which must be sacrificed to get more capital goods
diminishes beyond a point.
B. larger and larger amounts of capital goods must be sacrificed to get additional units of
consumer goods.
C. the production possibilities data would graph as a straight downsloping line.
D. the economy's resources are presumed not to be scarce.
Accessibility: Keyboard Navigation
Difficulty: Easy Learning Objective: 01-07 Apply the concepts of production possibilities analysis; increasing opportunity costs; and economic growth.
Topic: 01-24 Capital
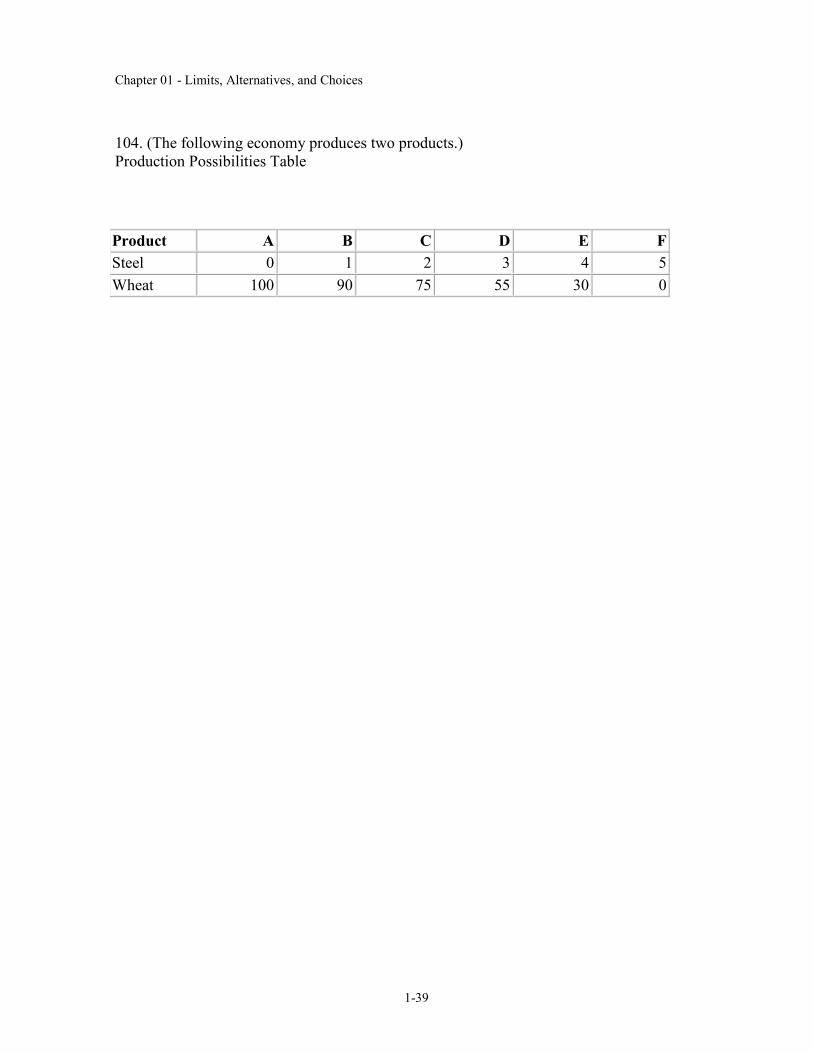
151. Refer to the table below. In moving from possibility A to F, the cost of a unit of steel in
terms of a unit of wheat:
(The following economy produces two products.)
Production Possibilities
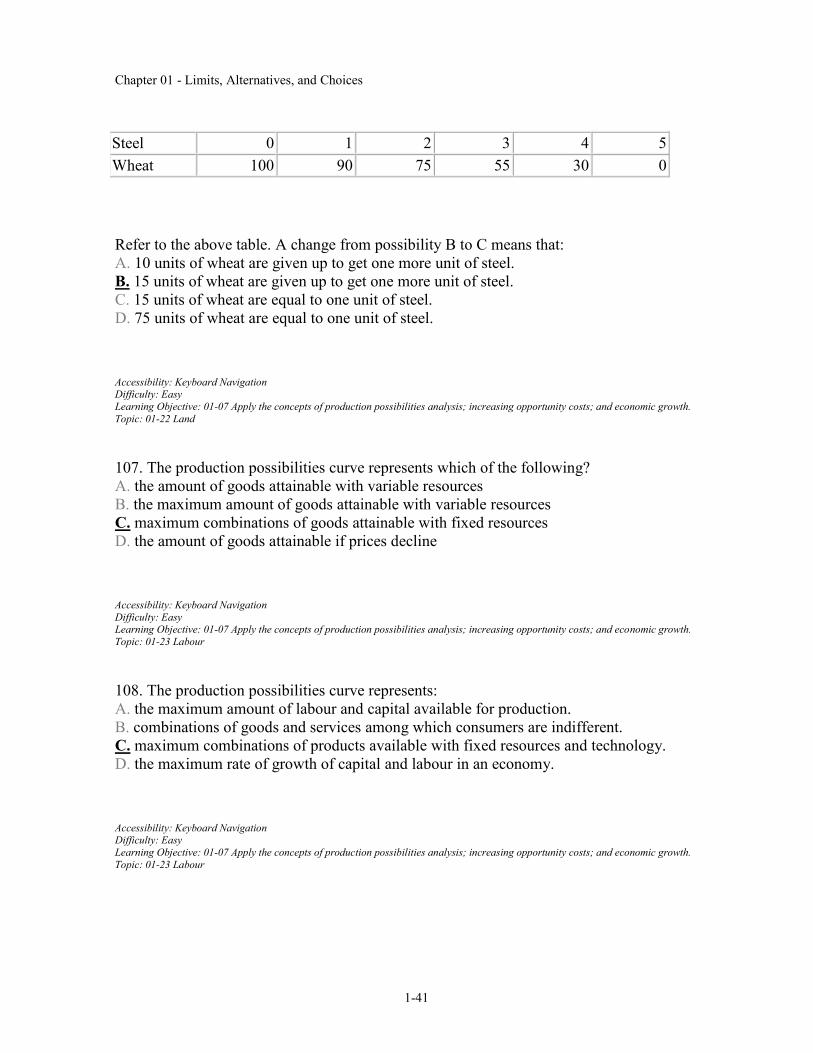
Product A B C D E F
Steel 0 1 2 3 4 5
Wheat 100 90 75 55 30 0
A. increases.
B. decreases.
C. remains constant.
D. increases from A to B, and decreases from B to F.
Accessibility: Keyboard Navigation
Difficulty: Easy Learning Objective: 01-07 Apply the concepts of production possibilities analysis; increasing opportunity costs; and economic growth.
Topic: 01-24 Capital
Chapter 01 - Limits, Alternatives, and Choices
1-67
152. A typical concave production possibilities curve implies:
A. that economic resources are scarce.
B. that society must choose among various attainable combinations of goods.
C. increasing opportunity costs.
D. all of the above.
Accessibility: Keyboard Navigation
Difficulty: Easy Topic: 01-21 Resource Categories
153. Refer to the diagram below. This production possibilities curve is constructed such that:
Product A B C D E F
Steel 0 1 2 3 4 5
Wheat 100 90 75 55 30 0
A. resources are presumed to be perfectly shiftable between bread and tractors.
B. the opportunity cost of bread diminishes as more bread is produced.
C. the opportunity cost of tractors diminishes as more bread is produced.
D. the opportunity cost of both bread and tractors in terms of each other increases as more of
each is produced.
Accessibility: Keyboard Navigation
Difficulty: Easy
Learning Objective: 01-07 Apply the concepts of production possibilities analysis; increasing opportunity costs; and economic growth. Topic: 01-23 Labour
Chapter 01 - Limits, Alternatives, and Choices
1-68
154. The law of increasing opportunity costs exists because:
A. resources are not equally efficient in producing various goods.
B. the value of the dollar has diminished historically because of persistent inflation.
C. wage rates invariably rise as the economy approaches full employment.
D. consumers tend to value any good more highly when they have little of it.
Accessibility: Keyboard Navigation
Difficulty: Easy Learning Objective: 01-07 Apply the concepts of production possibilities analysis; increasing opportunity costs; and economic growth.
Topic: 01-24 Capital
155. The law of increasing opportunity costs is reflected in a production possibilities curve
Learning Objective: 01-07 Apply the concepts of production possibilities analysis; increasing opportunity costs; and economic growth.
Topic: 01-24 Capital
156. The production possibilities curve below shows the hypothetical relationship between the
production of capital goods and consumer goods in an economy.
Production Alternatives
Products A B C D E
Capital goods 0 1 2 3 4
Consumer goods 22 18 13 7 0
Chapter 01 - Limits, Alternatives, and Choices
1-69
Refer to the above table. What is the opportunity cost of producing the third unit of capital
goods?
A. 4 units of consumer goods
B. 5 units of consumer goods
C. 6 units of consumer goods
D. 7 units of consumer goods
Accessibility: Keyboard Navigation
Difficulty: Easy
Learning Objective: 01-07 Apply the concepts of production possibilities analysis; increasing opportunity costs; and economic growth.
Topic: 01-24 Capital
157. The production possibilities curve below shows the hypothetical relationship between the
production of capital goods and consumer goods in an economy.
Production Alternatives
Products A B C D E
Capital goods 0 1 2 3 4
Consumer goods 22 18 13 7 0
Refer to the above table. What is the total opportunity cost of producing two units of capital
goods?
A. 4 units of consumer goods
B. 5 units of consumer goods
C. 9 units of consumer goods
D. 13 units of consumer goods
Accessibility: Keyboard Navigation
Difficulty: Medium Learning Objective: 01-07 Apply the concepts of production possibilities analysis; increasing opportunity costs; and economic growth.
Topic: 01-24 Capital
Chapter 01 - Limits, Alternatives, and Choices
1-70
158. The production possibilities curve below shows the hypothetical relationship between the
production of capital goods and consumer goods in an economy.
Production Alternatives
Products A B C D E
Capital goods 0 1 2 3 4
Consumer goods 22 18 13 7 0
Refer to the above table. What is the opportunity cost of producing the fourth unit of capital
goods?
A. 6 units of consumer goods
B. 7 units of consumer goods
C. 15 units of consumer goods
D. 22 units of consumer goods
Accessibility: Keyboard Navigation
Difficulty: Easy
Learning Objective: 01-07 Apply the concepts of production possibilities analysis; increasing opportunity costs; and economic growth. Topic: 01-24 Capital
159. The production possibilities curve below shows the hypothetical relationship between the
production of capital goods and consumer goods in an economy.
Production Alternatives
Products A B C D E
Capital goods 0 1 2 3 4
Consumer goods 22 18 13 7 0
Chapter 01 - Limits, Alternatives, and Choices
1-71
Refer to the above table. What is the total opportunity cost of producing three units of capital
goods?
A. 6 units of consumer goods
B. 7 units of consumer goods
C. 15 units of consumer goods
D. 22 units of consumer goods
Accessibility: Keyboard Navigation
Difficulty: Medium
Learning Objective: 01-07 Apply the concepts of production possibilities analysis; increasing opportunity costs; and economic growth.
Topic: 01-24 Capital
160.
Refer to the above diagram. As it relates to production possibilities analysis, the law of
increasing opportunity cost is reflected in curve:
A. A.
B. B.
C. C.
D. D.
Difficulty: Easy
Learning Objective: 01-07 Apply the concepts of production possibilities analysis; increasing opportunity costs; and economic growth. Topic: 01-24 Capital
Chapter 01 - Limits, Alternatives, and Choices
1-72
161.
Refer to the above diagram. Curve B is a:
A. production possibilities curve indicating constant opportunity costs.
B. production possibilities curve indicating increasing opportunity costs.
C. demand curve indicating that the quantity of consumer goods demanded increases as the
price of capital falls.
D. technology frontier curve.
Difficulty: Medium Learning Objective: 01-07 Apply the concepts of production possibilities analysis; increasing opportunity costs; and economic growth.
Topic: 01-24 Capital
162. If the production possibilities curve is a straight line:
A. the two products will sell at the same market prices.
B. economic resources are perfectly shiftable between the production of the two products.
C. the two products are equally important to consumers.
D. equal quantities of the two products will be produced at each possible point on the curve.
Learning Objective: 01-07 Apply the concepts of production possibilities analysis; increasing opportunity costs; and economic growth.
Topic: 01-25 Entrepreneurial Ability
169. If the output of product X is such that marginal benefit equals marginal cost:
A. the correct amount of resources is being allocated to X's production.
B. the value of producing X and the value of producing alternative products with available
resources is the same.
C. there can be no net gain to society by allocating either more or less resources to producing
X.
D. all of the above are true.
Accessibility: Keyboard Navigation
Difficulty: Medium
Learning Objective: 01-07 Apply the concepts of production possibilities analysis; increasing opportunity costs; and economic growth. Topic: 01-25 Entrepreneurial Ability
Chapter 01 - Limits, Alternatives, and Choices
1-76
170.
Refer to the above diagram for athletic shoes. The optimal output of shoes:
A. is Q1.
B. is Q2.
C. is Q3.
D. is greater than Q3.
Difficulty: Easy Learning Objective: 01-07 Apply the concepts of production possibilities analysis; increasing opportunity costs; and economic growth.
Topic: 01-25 Entrepreneurial Ability
Chapter 01 - Limits, Alternatives, and Choices
1-77
171.
Refer to the above diagram for athletic shoes. If the current output of shoes is Q1, then:
A. society would consider additional units of shoes to be more valuable than alternative
products.
B. society would consider additional units of shoes to be less valuable than alternative
products.
C. society would experience a net loss by producing more shoes.
D. resources are being allocated efficiently to the production of shoes.
Difficulty: Medium
Learning Objective: 01-07 Apply the concepts of production possibilities analysis; increasing opportunity costs; and economic growth.
Topic: 01-25 Entrepreneurial Ability
Chapter 01 - Limits, Alternatives, and Choices
1-78
172.
Refer to the above diagram for athletic shoes. If the current output of shoes is Q3, then:
A. resources are being allocated efficiently to the production of shoes.
B. society would consider additional units of shoes to be more valuable than alternative
products.
C. society would consider additional units of shoes to be less valuable than alternative
products.
D. society would experience a net gain by producing more shoes.
Difficulty: Medium Learning Objective: 01-07 Apply the concepts of production possibilities analysis; increasing opportunity costs; and economic growth.
Topic: 01-25 Entrepreneurial Ability
173. Recessions are typically characterised by points:
A. inside the production possibilities curve.
B. outside the production possibilities curve.
C. on the production possibilities curve.
D. that are not attainable on the production possibilities curve.
Accessibility: Keyboard Navigation
Difficulty: Easy
Learning Objective: 01-08 Explain how economic growth and international trade increase consumption possibilities. Topic: 01-26 Production Possibilities Model
Chapter 01 - Limits, Alternatives, and Choices
1-79
174. Production possibilities (alternatives)
A B C D E F
Capital goods 5 4 3 2 1 0
Consumer goods 0 5 9 12 14 15
Refer to the above table. As compared to production alternative D, the choice of alternative C
would:
A. tend to generate a more rapid growth rate.
B. be unattainable.
C. entail unemployment.
D. tend to generate a slower growth rate.
Accessibility: Keyboard Navigation
Difficulty: Medium
Learning Objective: 01-08 Explain how economic growth and international trade increase consumption possibilities. Topic: 01-27 Production Possibilities Table
175. Production possibilities (alternatives)
A B C D E F
Capital goods 5 4 3 2 1 0
Consumer goods 0 5 9 12 14 15
Chapter 01 - Limits, Alternatives, and Choices
1-80
Refer to the above table. A total output of 3 units of capital goods and 4 units of consumer
goods:
A. is irrelevant because the economy is capable of producing a larger total output.
B. will result in the maximum rate of growth available to this economy.
C. would involve an inefficient use of the economy's scarce resources.
D. is unobtainable in this economy.
Accessibility: Keyboard Navigation
Difficulty: Medium
Learning Objective: 01-08 Explain how economic growth and international trade increase consumption possibilities.
Topic: 01-27 Production Possibilities Table
176. Production possibilities (alternatives)
A B C D E F
Capital goods 5 4 3 2 1 0
Consumer goods 0 5 9 12 14 15
Refer to the above table. For this economy to produce a total output of 3 units of capital goods
and 13 units of consumer goods it must:
A. achieve economic growth.
B. use its resources more efficiently than the data in the table now indicate.
C. allocate its available resources most efficiently among alternative uses.
D. achieve the full employment of available resources.
Accessibility: Keyboard Navigation
Difficulty: Medium
Learning Objective: 01-08 Explain how economic growth and international trade increase consumption possibilities.
Topic: 01-27 Production Possibilities Table
Chapter 01 - Limits, Alternatives, and Choices
1-81
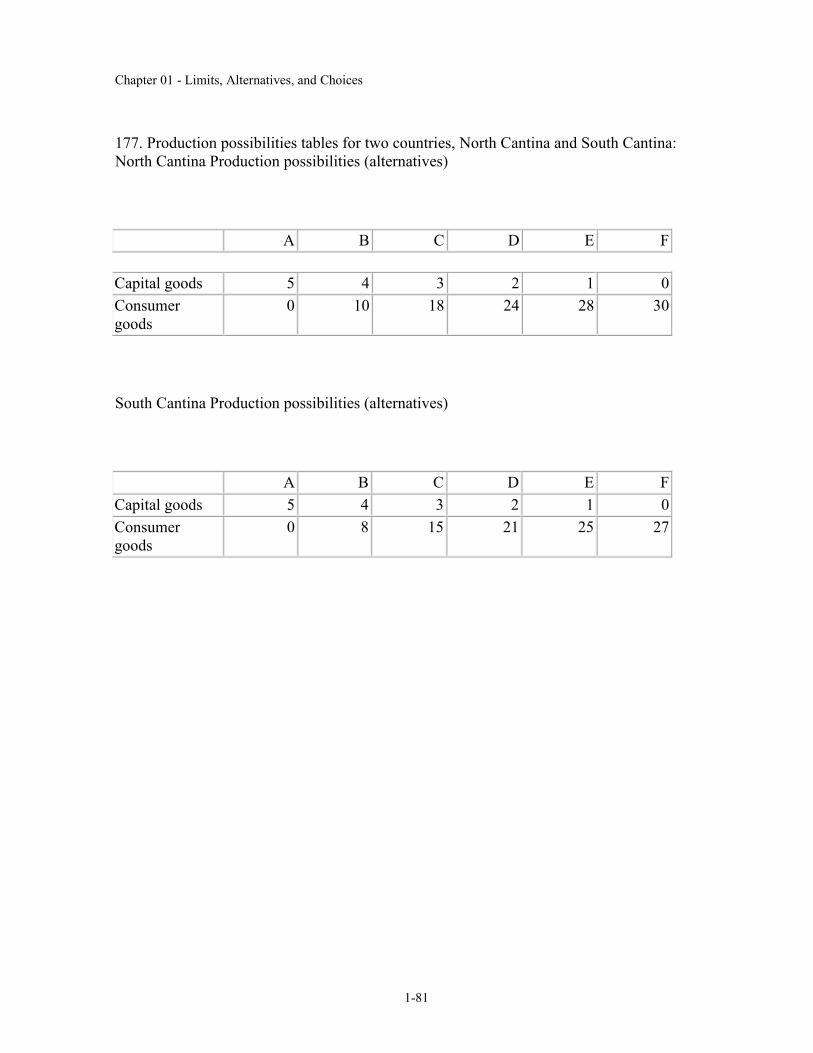
177. Production possibilities tables for two countries, North Cantina and South Cantina:
North Cantina Production possibilities (alternatives)
A B C D E F
Capital goods 5 4 3 2 1 0
Consumer
goods
0 10 18 24 28 30
South Cantina Production possibilities (alternatives)
A B C D E F
Capital goods 5 4 3 2 1 0
Consumer
goods
0 8 15 21 25 27
Chapter 01 - Limits, Alternatives, and Choices
1-82
Refer to the above tables. Suppose that North Cantina is producing 2 units of capital goods
and 17 units of consumer goods while South Cantina is producing 2 units of capital goods and
21 units of consumer goods. We can conclude that:
A. North Cantina is fully and efficiently using its resources, but South Cantina is not.
B. South Cantina is fully and efficiently using its resources, but North Cantina is not.
C. neither South Cantina nor North Cantina are fully and efficiently using their resources.
D. both South Cantina and North Cantina are fully and efficiently using their resources.
Accessibility: Keyboard Navigation
Difficulty: Medium Learning Objective: 01-08 Explain how economic growth and international trade increase consumption possibilities.
Topic: 01-27 Production Possibilities Table
178. Production possibilities tables for two countries, North Cantina and South Cantina:
North Cantina Production possibilities (alternatives)
A B C D E F
Capital goods 5 4 3 2 1 0
Consumer
goods
0 10 18 24 28 30
Chapter 01 - Limits, Alternatives, and Choices
1-83
South Cantina Production possibilities (alternatives)
A B C D E F
Capital goods 5 4 3 2 1 0
Consumer
goods
0 8 15 21 25 27
Refer to the above tables. Suppose that resources in North Cantina and South Cantina are
identical in quantity and quality. We can conclude that:
A. South Cantina has better technology than North Cantina in producing both capital and
consumer goods.
B. North Cantina has better technology than South Cantina in producing both capital and
consumer goods.
C. North Cantina is growing more rapidly than South Cantina.
D. North Cantina has better technology than South Cantina in producing consumer goods.
Accessibility: Keyboard Navigation
Difficulty: Hard
Learning Objective: 01-08 Explain how economic growth and international trade increase consumption possibilities. Topic: 01-27 Production Possibilities Table
179. Refer to the table below. According to the production possibilities schedule for the
economy which produces two products, a combination of four tanks and 650 autos is:
Production Possibilities
Product A B C D E F
Tanks 0 1 2 3 4 5
Autos 1000 950 850 650 350 0
Chapter 01 - Limits, Alternatives, and Choices
1-84
A. attainable, but involves an efficient use of society's resources.
B. attainable, but would not be in the best interests of a strong national defence.
C. not attainable because it is not listed in the schedule.
D. not attainable because society does not have sufficient resources to produce this
combination.
Accessibility: Keyboard Navigation
Difficulty: Medium Learning Objective: 01-08 Explain how economic growth and international trade increase consumption possibilities.
Topic: 01-27 Production Possibilities Table
180. Assume that a change in government policy results in the increased production of both
consumer goods and investment goods. It can be concluded that:
A. the economy was suffering from unemployment and/or the inefficient use of resources
before the policy change.
B. the economy's production possibilities curve has been shifted to the left as a result of the
policy decision.
C. this economy's production possibilities curve is convex (bowed inward) as viewed from the
origin.
D. the law of increasing opportunity costs does not apply in this society.
Accessibility: Keyboard Navigation Difficulty: Medium
Learning Objective: 01-08 Explain how economic growth and international trade increase consumption possibilities.
Topic: 01-27 Production Possibilities Table
Chapter 01 - Limits, Alternatives, and Choices
1-85
181. Refer to the diagram. This economy will experience unemployment if it produces at
point:
A. A.
B. B.
C. C.
D. D.
Difficulty: Easy
Learning Objective: 01-08 Explain how economic growth and international trade increase consumption possibilities. Topic: 01-27 Production Possibilities Table
Chapter 01 - Limits, Alternatives, and Choices
1-86
182.
Refer to the above production possibilities curve. At the onset of World War II Canada had
large amounts of idle human and property resources. Its economic adjustment from peacetime
to wartime can best be described by the movement from point:
A. c to point b.
B. b to point c.
C. a to point b.
D. c to point d.
Difficulty: Medium
Learning Objective: 01-08 Explain how economic growth and international trade increase consumption possibilities.
Topic: 01-27 Production Possibilities Table
Chapter 01 - Limits, Alternatives, and Choices
1-87
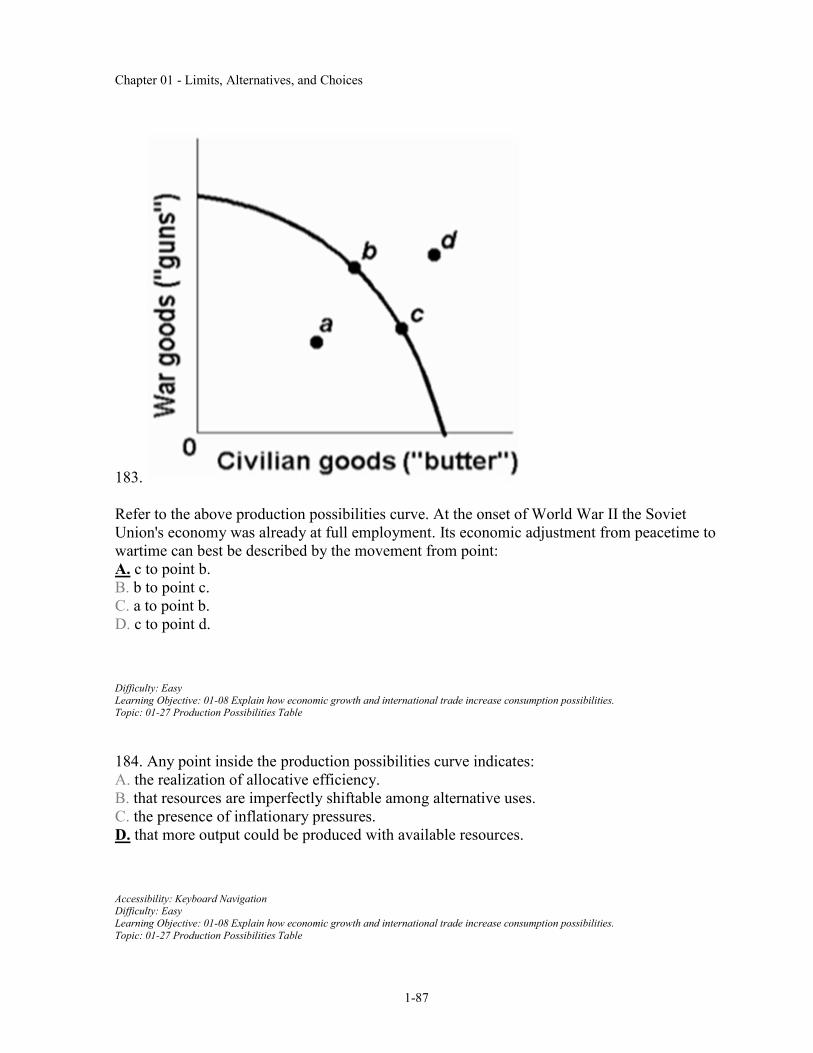
183.
Refer to the above production possibilities curve. At the onset of World War II the Soviet
Union's economy was already at full employment. Its economic adjustment from peacetime to
wartime can best be described by the movement from point:
A. c to point b.
B. b to point c.
C. a to point b.
D. c to point d.
Difficulty: Easy
Learning Objective: 01-08 Explain how economic growth and international trade increase consumption possibilities. Topic: 01-27 Production Possibilities Table
184. Any point inside the production possibilities curve indicates:
A. the realization of allocative efficiency.
B. that resources are imperfectly shiftable among alternative uses.
C. the presence of inflationary pressures.
D. that more output could be produced with available resources.
Learning Objective: 01-08 Explain how economic growth and international trade increase consumption possibilities.
Topic: 01-27 Production Possibilities Table
187. Assume an economy is incurring unemployment and failing to realize least-cost
production. The immediate effect of resolving these problems will be to:
A. move the level of actual output closer to the economy's production possibilities curve.
B. create a less equal distribution of income.
C. shift its production possibilities curve to the left.
D. shift its production possibilities curve to the right.
Accessibility: Keyboard Navigation
Difficulty: Medium
Learning Objective: 01-08 Explain how economic growth and international trade increase consumption possibilities.
Topic: 01-27 Production Possibilities Table
Chapter 01 - Limits, Alternatives, and Choices
1-89
188. If an economy is operating inside its production possibilities curve for consumer goods
and capital goods, this means that it:
A. can only produce more consumer goods by producing fewer capital goods.
B. can only produce more capital goods by producing fewer consumer goods.
C. can produce more of both consumer goods and capital goods by using its resources more
efficiently.
D. must improve its technology to produce more output.
Accessibility: Keyboard Navigation
Difficulty: Medium
Learning Objective: 01-08 Explain how economic growth and international trade increase consumption possibilities.
Topic: 01-27 Production Possibilities Table
189. Which of the following will not require an outward shift of the production possibilities
curve?
A. an upgrading of the quality of a nation's human resources
B. the reduction of unemployment
C. an increase in the quantity of a society's labour force
D. the improvement of a society's technological knowledge
Accessibility: Keyboard Navigation Difficulty: Medium
Learning Objective: 01-08 Explain how economic growth and international trade increase consumption possibilities.
Topic: 01-27 Production Possibilities Table
Chapter 01 - Limits, Alternatives, and Choices
1-90
190.
Refer to the above production possibilities curves. Curve (a) is the current curve for the
economy. The movement from curve (a) to curve (b) suggests:
A. a movement from unemployment to full employment.
B. an improvement in capital goods technology but not in consumer goods technology.
C. an improvement in consumer goods technology but not in capital goods technology.
D. a decline in the total output of this society.
Difficulty: Medium
Learning Objective: 01-08 Explain how economic growth and international trade increase consumption possibilities.
Topic: 01-27 Production Possibilities Table
Chapter 01 - Limits, Alternatives, and Choices
1-91
191.
Refer to the above production possibilities curves. Curve (a) is the current curve for the
economy. Other things being equal, society's current choice of point P on curve (a) will:
A. allow it to achieve more rapid economic growth than would the choice of point N.
B. entail a slower rate of economic growth than would the choice of point N.
C. entail the same rate of growth as would the choice of point N.
D. be unobtainable because it exceeds the productive capacity of the economy.
Difficulty: Medium
Learning Objective: 01-08 Explain how economic growth and international trade increase consumption possibilities.
Topic: 01-27 Production Possibilities Table
Chapter 01 - Limits, Alternatives, and Choices
1-92
192. The basic difference between consumer goods and capital goods is that:
A. consumer goods are produced in the private sector and capital goods are produced in the
public sector.
B. an economy that commits a relatively large proportion of its resources to capital goods
must accept a lower growth rate.
C. the production of capital goods is not subject to the law of increasing opportunity costs.
D. consumer goods satisfy wants directly while capital goods satisfy wants indirectly.
Accessibility: Keyboard Navigation
Difficulty: Medium
Learning Objective: 01-08 Explain how economic growth and international trade increase consumption possibilities.
Topic: 01-27 Production Possibilities Table
193. Which of the following would be most likely to shift the production possibilities curve to
the right?
A. a sudden and substantial expansion of consumer wants
B. an improvement in the literacy level and general level of education
C. a decline in the size of the population and labour force
D. shifting resources from butter to gun production
Accessibility: Keyboard Navigation Difficulty: Medium
Learning Objective: 01-08 Explain how economic growth and international trade increase consumption possibilities.
Topic: 01-27 Production Possibilities Table
194. Which of the following will not shift a nation's production possibilities curve?
A. the acquisition of more education and training by its labour force
B. the widespread application of irrigation to its agricultural land
C. an increase in the rate of unemployment
D. the discovery of new super-conductivity materials which makes manufacturing more
efficient
Accessibility: Keyboard Navigation
Difficulty: Medium
Learning Objective: 01-08 Explain how economic growth and international trade increase consumption possibilities. Topic: 01-27 Production Possibilities Table
Chapter 01 - Limits, Alternatives, and Choices
1-93
195. Which of the following will shift the production possibilities curve to the right?
A. an increase in the unemployment rate from 6 to 8 percent
B. a decline in the efficiency with which the present labour force is allocated
C. a decrease in the unemployment rate from 8 to 6 percent
D. a technological advance which allows farmers to produce more output from given inputs
Accessibility: Keyboard Navigation
Difficulty: Medium Learning Objective: 01-08 Explain how economic growth and international trade increase consumption possibilities.
Topic: 01-27 Production Possibilities Table
196. Other things equal, which of the following would shift an economy's production
possibilities curve to the left?
A. the discovery of a low-cost means of generating and storing solar energy
B. the entrance of more women into the labour force
C. a law requiring mandatory retirement from the labour force at age 55
D. an increase in the proportion of total output which consists of capital or investment goods
Accessibility: Keyboard Navigation Difficulty: Medium
Learning Objective: 01-08 Explain how economic growth and international trade increase consumption possibilities.
Topic: 01-27 Production Possibilities Table
Chapter 01 - Limits, Alternatives, and Choices
1-94
197.
Refer to the above diagram. An improvement in technology will:
A. shift the production possibilities curve from PP1 to PP2.
B. shift the production possibilities curve from PP2 to PP1.
C. move the economy from A to C along PP1.
D. move the economy from A, B, or C on PP1 to D.
Difficulty: Easy
Learning Objective: 01-08 Explain how economic growth and international trade increase consumption possibilities. Topic: 01-27 Production Possibilities Table
Chapter 01 - Limits, Alternatives, and Choices
1-95
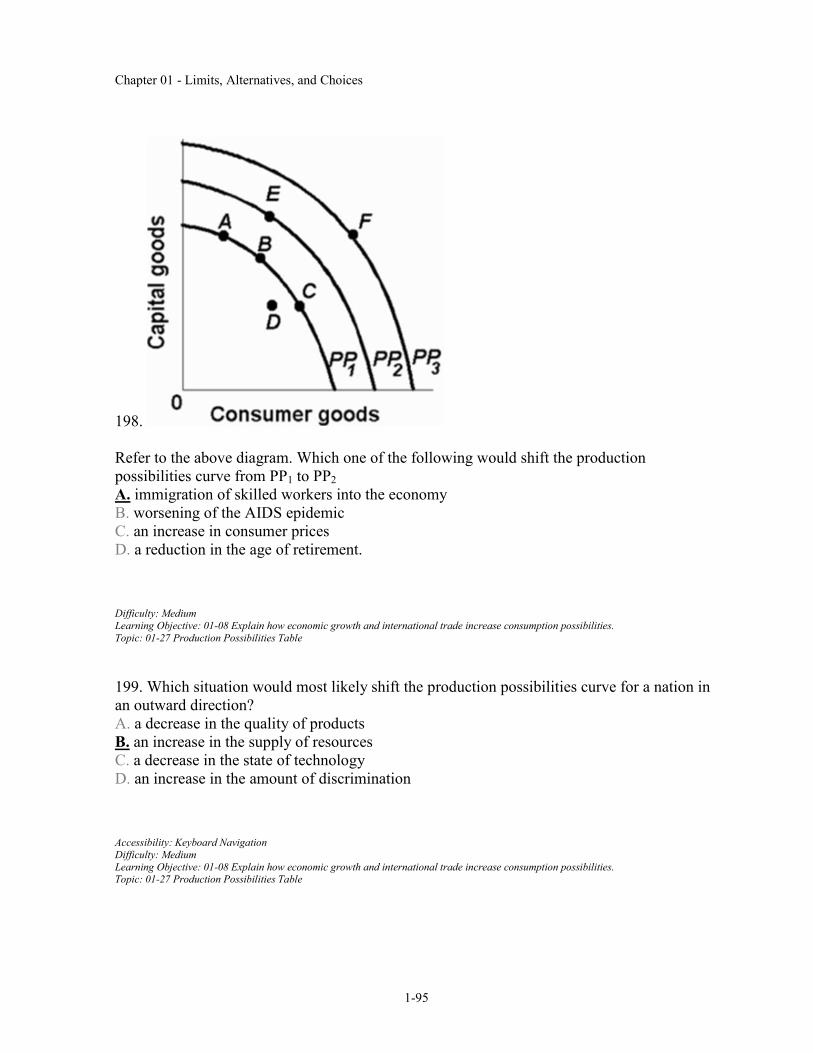
198.
Refer to the above diagram. Which one of the following would shift the production
possibilities curve from PP1 to PP2
A. immigration of skilled workers into the economy
B. worsening of the AIDS epidemic
C. an increase in consumer prices
D. a reduction in the age of retirement.
Difficulty: Medium
Learning Objective: 01-08 Explain how economic growth and international trade increase consumption possibilities.
Topic: 01-27 Production Possibilities Table
199. Which situation would most likely shift the production possibilities curve for a nation in
an outward direction?
A. a decrease in the quality of products
B. an increase in the supply of resources
C. a decrease in the state of technology
D. an increase in the amount of discrimination
Accessibility: Keyboard Navigation
Difficulty: Medium
Learning Objective: 01-08 Explain how economic growth and international trade increase consumption possibilities. Topic: 01-27 Production Possibilities Table
Chapter 01 - Limits, Alternatives, and Choices
1-96
200. Which situation would most likely cause a nation's production possibilities curve to shift
inward?
A. the construction of more capital goods
B. a decrease in discrimination based on race
C. an increase in the number of skilled immigrant workers
D. the destruction from bombing and warfare in a losing military conflict
Accessibility: Keyboard Navigation
Difficulty: Medium Learning Objective: 01-08 Explain how economic growth and international trade increase consumption possibilities.
Topic: 01-27 Production Possibilities Table
201. All of the following could immediately or eventually lead to an inward shift of a nation's
production possibilities curve, except:
A. an increase in the amount of discrimination.
B. a decline in the birth rate.
C. an increase in the average skill level of all occupational groups.
D. depletion and reduced availability of major energy resources.
Accessibility: Keyboard Navigation Difficulty: Medium
Learning Objective: 01-08 Explain how economic growth and international trade increase consumption possibilities.
Topic: 01-27 Production Possibilities Table
202. Some agricultural sub-Saharan nations of Africa have over-farmed and overgrazed their
land to the extent that significant portions of it have turned into desert. This suggests that:
A. the concavity of the production possibilities curves of such nations has increased.
B. the production possibilities curves of such nations have shifted inward.
C. the production possibilities curves of such nations have shifted outward.
D. these nations are operating at some point outside of their production possibilities curves.
Accessibility: Keyboard Navigation
Difficulty: Medium
Learning Objective: 01-08 Explain how economic growth and international trade increase consumption possibilities. Topic: 01-27 Production Possibilities Table
Chapter 01 - Limits, Alternatives, and Choices
1-97
203. Which of the following statements, if any, is correct for a nation which is producing only
consumption and capital goods?
A. Other things equal, the more consumer goods a nation produces, the greater will be its
future growth rate.
B. Other things equal, the more capital goods a nation produces, the greater will be its future
growth rate.
C. There is no general relationship between the current division of output between consumer
and capital goods and the future growth rate.
D. None of the above statements is correct.
Accessibility: Keyboard Navigation
Difficulty: Easy Learning Objective: 01-08 Explain how economic growth and international trade increase consumption possibilities.
Topic: 01-28 Production Possibilities Curve
204. If country A has been investing a larger proportion of its domestic output than Canada
has, then, we would expect:
A. a higher rate of growth of domestic output in country A than in Canada.
B. greater rightward shifts in country A's production possibilities curve as compared to
Canada.
C. that in the long run living standards would rise more rapidly in country A than in Canada.
D. all of the above to happen.
Accessibility: Keyboard Navigation Difficulty: Medium
Learning Objective: 01-08 Explain how economic growth and international trade increase consumption possibilities.
Topic: 01-28 Production Possibilities Curve
205. Deltonia produces both consumer and capital goods. If it reduces the percentage of its
output devoted to capital goods, then:
A. its rate of growth will tend to decline.
B. its production possibilities curve will necessarily shift to the left.
C. it must also reduce the percentage of its output devoted to consumer goods.
D. its rate of growth will tend to increase.
Accessibility: Keyboard Navigation
Difficulty: Medium Learning Objective: 01-08 Explain how economic growth and international trade increase consumption possibilities.
Topic: 01-28 Production Possibilities Curve
Chapter 01 - Limits, Alternatives, and Choices
1-98
206. Refer to the diagram below. Other things equal, this economy will achieve the most rapid
rate of growth if:
A. the ratio of capital to consumer goods is minimized.
B. it chooses point C.
C. it chooses point B.
D. it chooses point A.
Difficulty: Easy Learning Objective: 01-08 Explain how economic growth and international trade increase consumption possibilities.
Topic: 01-28 Production Possibilities Curve
207. The future location of the economy's production possibilities curve will be affected by:
A. the current division of domestic output between consumption and capital goods.
B. the rate of technological progress.
C. the growth of the economy's supplies of resources.
D. all of the above.
Accessibility: Keyboard Navigation Difficulty: Medium
Learning Objective: 01-08 Explain how economic growth and international trade increase consumption possibilities.
Topic: 01-28 Production Possibilities Curve
Chapter 01 - Limits, Alternatives, and Choices
1-99
208. Refer to the diagram below. Which of the following positions relative to PP1 would be
the most likely to result in a future production possibilities curve of PP3, rather than PP2?
A. A.
B. B.
C. C.
D. D.
Difficulty: Medium
Learning Objective: 01-08 Explain how economic growth and international trade increase consumption possibilities. Topic: 01-28 Production Possibilities Curve
209. Through specialization and international trade a nation:
A. can achieve some combination of goods lying outside its production possibilities curve.
B. can move from a high consumption-low investment to a high investment-low consumption
point on its production possibilities curve.
C. will achieve some combination of goods lying within its production possibilities curve.
D. will cause its production possibilities curve to shift leftward.
Accessibility: Keyboard Navigation
Difficulty: Medium
Learning Objective: 01-08 Explain how economic growth and international trade increase consumption possibilities.
Topic: 01-29 Law of Increasing Opportunity Costs
Chapter 01 - Limits, Alternatives, and Choices
1-100
210. A country can achieve some combination of goods outside its production possibilities
curve by:
A. idling some of its resources.
B. specializing and engaging in international trade.
C. buying the debt (bonds and stocks) of foreign nations.
D. producing more consumption goods and fewer capital goods.
Accessibility: Keyboard Navigation
Difficulty: Easy Learning Objective: 01-08 Explain how economic growth and international trade increase consumption possibilities.
Topic: 01-29 Law of Increasing Opportunity Costs
211. International specialization and trade:
A. allow a nation to get more of a desired good at less sacrifice of some other good.
B. can allow an economy to circumvent the output limits imposed by its domestic production
possibilities curve.
C. Has the same effect as having more and better resources.
D. All of the above.
Accessibility: Keyboard Navigation Difficulty: Medium
Learning Objective: 01-08 Explain how economic growth and international trade increase consumption possibilities.
Topic: 01-29 Law of Increasing Opportunity Costs
212. Economists:
A. always put the independent variable on the horizontal axis and the dependent variable on
the vertical axis.
B. always put the dependent variable on the horizontal axis and the independent variable on
the vertical axis.
C. are somewhat arbitrary in assigning independent and dependent variables to the horizontal
and vertical axes.
D. measure the slope of a line differently than do mathematicians.
Accessibility: Keyboard Navigation
Difficulty: Easy
Learning Objective: 01-08 Explain how economic growth and international trade increase consumption possibilities. Topic: 01-31 Economic rationale
Chapter 01 - Limits, Alternatives, and Choices
1-101
213. If we say that two variables are directly related, this means that:
A. the relationship between the two is purely random.
B. an increase in one variable is associated with a decrease in the other variable.
C. an increase in one variable is associated with an increase in the other variable.
D. the two graph as a downsloping line.
Accessibility: Keyboard Navigation
Difficulty: Easy Learning Objective: 01-08 Explain how economic growth and international trade increase consumption possibilities.
Topic: 01-32 Optimal Allocation
214. If we say that two variables are inversely related, this means that:
A. the two graph as an upsloping line.
B. an increase in one variable is associated with a decrease in the other.
C. an increase in one variable is associated with an increase in the other.
D. the resulting relationship can be portrayed by a straight line parallel to the horizontal axis.
Learning Objective: 01-08 Explain how economic growth and international trade increase consumption possibilities.
Topic: 01-32 Optimal Allocation
215. Which of the following statements is correct?
A. The value of the independent variable is determined by the value of the dependent variable.
B. The value of the dependent variable is determined by the value of the independent variable.
C. The dependent variable designates the "cause" and the independent variable the "effect."
D. Dependent variables graph as upsloping lines; independent variables graph as downward
sloping lines.
Accessibility: Keyboard Navigation
Difficulty: Medium
Learning Objective: 01-08 Explain how economic growth and international trade increase consumption possibilities.
Topic: 01-33 Unemployment, Growth, and the Future
Chapter 01 - Limits, Alternatives, and Choices
1-102
216.
Refer to the above diagram. Which line(s) show(s) a positive relationship between x and y?
A. A only
B. both A and D
C. A, B, and D
D. both C and E
Difficulty: Medium
Learning Objective: 01-08 Explain how economic growth and international trade increase consumption possibilities.
Topic: 01-32 Optimal Allocation
Chapter 01 - Limits, Alternatives, and Choices
1-103
217.
Refer to the above diagram. Which line(s) show(s) a negative relationship between x and y?
A. A only
B. both A and D
C. A, B, and D
D. both C and E
Difficulty: Medium
Learning Objective: 01-08 Explain how economic growth and international trade increase consumption possibilities.
Topic: 01-32 Optimal Allocation
Chapter 01 - Limits, Alternatives, and Choices
1-104
218.
Refer to the above diagram. Which line(s) show(s) a positive vertical intercept?
A. A and D only
B. B and C only
C. A, D, and E
D. A, D, and B
Difficulty: Medium
Learning Objective: 01-08 Explain how economic growth and international trade increase consumption possibilities. Topic: 01-32 Optimal Allocation
Chapter 01 - Limits, Alternatives, and Choices
1-105
219.
Refer to the above diagram. Which line(s) show(s) a negative vertical intercept?
A. C only
B. both C and E
C. B, C, and E
D. both B and C
Difficulty: Medium
Learning Objective: 01-08 Explain how economic growth and international trade increase consumption possibilities.
Topic: 01-32 Optimal Allocation
220. If two variables are inversely related, then as the value of one variable:
A. increases, the value of the other may either increase or decrease.
B. decreases, the value of the other decreases.
C. increases, the value of the other decreases.
D. increases, the value of the other increases.
Accessibility: Keyboard Navigation
Difficulty: Easy
Learning Objective: 01-08 Explain how economic growth and international trade increase consumption possibilities. Topic: 01-32 Optimal Allocation
Chapter 01 - Limits, Alternatives, and Choices
1-106
221. If a positive relationship exists between x and y:
A. an increase in x will cause y to decrease.
B. a decrease in x will cause y to increase.
C. the relationship will graph as an upsloping line.
D. the vertical intercept must be positive.
Accessibility: Keyboard Navigation
Difficulty: Easy Learning Objective: 01-08 Explain how economic growth and international trade increase consumption possibilities.
Topic: 01-32 Optimal Allocation
222.
Answer on the basis of the relationships shown in the above four figures. The amount of Y is
directly related to the amount of X in:
A. both 1 and 3.
B. both 1 and 2.
C. 2 only.
D. l only.
Difficulty: Medium
Learning Objective: 01-08 Explain how economic growth and international trade increase consumption possibilities.
Topic: 01-32 Optimal Allocation
Chapter 01 - Limits, Alternatives, and Choices
1-107
223.
Answer on the basis of the relationships shown in the above four figures. The amount of Y is
inversely related to the amount of X in:
A. 2 only.
B. both 1 and 3.
C. 3 only.
D. 1 only.
Difficulty: Medium
Learning Objective: 01-08 Explain how economic growth and international trade increase consumption possibilities.
Topic: 01-32 Optimal Allocation
224.
Answer on the basis of the relationships shown in the above four figures. The amount of Y is
unrelated to the amount of X in:
A. both 2 and 4.
B. 3 only.
C. 2 only.
D. 1
Difficulty: Medium
Learning Objective: 01-08 Explain how economic growth and international trade increase consumption possibilities.
Topic: 01-32 Optimal Allocation
Chapter 01 - Limits, Alternatives, and Choices
1-108
225. If price (P) and quantity (Q) are directly related, this means that:
A. a change in Q will alter P, but a change in P will not alter Q.
B. if P increases, Q will decrease.
C. if P increases, Q will also increase.
D. an increase in P will cause Q to change, but the direction in which Q changes cannot be
predicted.
Accessibility: Keyboard Navigation
Difficulty: Easy Learning Objective: 01-08 Explain how economic growth and international trade increase consumption possibilities.
Topic: 01-32 Optimal Allocation
226. Assume that if the interest rate that businesses must pay to borrow funds were 20
percent, it would be unprofitable for businesses to invest in new machinery and equipment so
that investment would be zero. But if the interest rate were 16 percent, businesses would find
it profitable to invest $10 billion. If the interest rate were 12 percent, $20 billion would be
invested. Assume that total investment continues to increase by $10 billion for each
successive 4 percentage point decline in the interest rate.
Refer to the above information. Which of the following is an accurate verbal statement of the
described relationship?
A. There is no regular or dependable relationship between business investment and the
interest rate.
B. The amount of business investment is unaffected by changes in the interest rate.
C. Investment spending by businesses varies inversely with the interest rate.
D. Investment spending by businesses varies directly with the interest rate.
Accessibility: Keyboard Navigation Difficulty: Medium
Learning Objective: 01-08 Explain how economic growth and international trade increase consumption possibilities.
Topic: 01-32 Optimal Allocation
Chapter 01 - Limits, Alternatives, and Choices
1-109
227. Assume that if the interest rate that businesses must pay to borrow funds were 20
percent, it would be unprofitable for businesses to invest in new machinery and equipment so
that investment would be zero. But if the interest rate were 16 percent, businesses would find
it profitable to invest $10 billion. If the interest rate were 12 percent, $20 billion would be
invested. Assume that total investment continues to increase by $10 billion for each
successive 4 percentage point decline in the interest rate.
Refer to the above information. Using i and I to indicate the interest rate and investment (in
billions of dollars) respectively, which of the following is the correct tabular presentation of
the described relationship?
(A) (B) (C) (D)
i I I I i I i I
20 $50 24 $10 20 $0 20 $10
16 40 20 20 16 10 16 20
12 30 16 30 12 20 12 30
8 20 12 40 8 30 8 40
4 10 8 50 4 40 4 50
0 0 4 60 0 50 0 60
A. column (A)
B. column (B)
C. column (C)
D. column (D)
Accessibility: Keyboard Navigation
Difficulty: Hard
Learning Objective: 01-08 Explain how economic growth and international trade increase consumption possibilities. Topic: 01-32 Optimal Allocation
Chapter 01 - Limits, Alternatives, and Choices
1-110
228. Assume that if the interest rate that businesses must pay to borrow funds were 20
percent, it would be unprofitable for businesses to invest in new machinery and equipment so
that investment would be zero. But if the interest rate were 16 percent, businesses would find
it profitable to invest $10 billion. If the interest rate were 12 percent, $20 billion would be
invested. Assume that total investment continues to increase by $10 billion for each
successive 4 percentage point decline in the interest rate.
Refer to the above information. Which of the following correctly expresses the indicated
relationship as an equation?
A. i = 20 - 4I.
B. i = 20 -.4I.
C. i = 24 -.4I.
D. i = 20 - 10I.
Accessibility: Keyboard Navigation
Difficulty: Hard Learning Objective: 01-08 Explain how economic growth and international trade increase consumption possibilities.
Topic: 01-32 Optimal Allocation
Chapter 01 - Limits, Alternatives, and Choices
1-111
229. Assume that if the interest rate that businesses must pay to borrow funds were 20
percent, it would be unprofitable for businesses to invest in new machinery and equipment so
that investment would be zero. But if the interest rate were 16 percent, businesses would find
it profitable to invest $10 billion. If the interest rate were 12 percent, $20 billion would be
invested. Assume that total investment continues to increase by $10 billion for each
successive 4 percentage point decline in the interest rate.
Refer to the above information. Which of the following is the correct graphical presentation of
the indicated relationship?
A. line 4
B. line 3
C. line 2
D. line 1
Difficulty: Hard
Learning Objective: 01-08 Explain how economic growth and international trade increase consumption possibilities. Topic: 01-32 Optimal Allocation
Chapter 01 - Limits, Alternatives, and Choices
1-112
230.
After-tax income Consumption
$1000 $900
2000 1800
3000 2700
4000 3600
5000 4500
The above data suggest that:
A. consumption varies inversely with after-tax income.
B. consumption varies directly with after-tax income.
C. consumption and after-tax income are unrelated.
D. a tax increase will increase consumption.
Accessibility: Keyboard Navigation
Difficulty: Medium
Learning Objective: 01-08 Explain how economic growth and international trade increase consumption possibilities. Topic: 01-32 Optimal Allocation
231.
After-tax income Consumption
$1000 $900
2000 1800
3000 2700
4000 3600
5000 4500
Chapter 01 - Limits, Alternatives, and Choices
1-113
The above data indicates that:
A. consumers spend 80 percent of their after-tax incomes.
B. consumers spend 90 percent of their after-tax incomes.
C. a tax reduction will reduce consumption.
D. the relationship between consumption and after-tax income is random.
Accessibility: Keyboard Navigation
Difficulty: Medium Learning Objective: 01-08 Explain how economic growth and international trade increase consumption possibilities.
Topic: 01-32 Optimal Allocation
232.
After-tax income Consumption
$1000 $900
2000 1800
3000 2700
4000 3600
5000 4500
The above data suggest that:
A. a policy of tax reduction will increase consumption.
B. a policy of tax increases will increase consumption.
C. tax changes will have no impact on consumption.
D. after-tax income should be lowered to increase consumption.
Accessibility: Keyboard Navigation
Difficulty: Easy
Learning Objective: 01-08 Explain how economic growth and international trade increase consumption possibilities.
Topic: 01-32 Optimal Allocation
Chapter 01 - Limits, Alternatives, and Choices
1-114
233.
Refer to the above diagram. The variables X and Y are:
A. inversely related.
B. directly related.
C. unrelated.
D. negatively related.
Difficulty: Easy Learning Objective: 01-08 Explain how economic growth and international trade increase consumption possibilities.
Topic: 01-32 Optimal Allocation
Chapter 01 - Limits, Alternatives, and Choices
1-115
234.
Refer to the above diagram. The vertical intercept:
A. is 40.
B. is 50.
C. is 60.
D. cannot be determined from the information given.
Difficulty: Medium
Learning Objective: 01-08 Explain how economic growth and international trade increase consumption possibilities.
Topic: 01-32 Optimal Allocation
Chapter 01 - Limits, Alternatives, and Choices
1-116
235.
Refer to the above diagram. The slope of the line:
A. is -1/4.
B. is +1/4.
C. is .40.
D. cannot be determined from the information given.
Difficulty: Medium
Learning Objective: 01-08 Explain how economic growth and international trade increase consumption possibilities.
Topic: 01-32 Optimal Allocation
Chapter 01 - Limits, Alternatives, and Choices
1-117
236.
Refer to the above diagram. The equation which shows the relationship between Y and X is:
A. Y = 50 + 1/4X.
B. X = 1/4Y.
C. Y = .4X.
D. Y = 1/4X - 50.
Difficulty: Hard
Learning Objective: 01-08 Explain how economic growth and international trade increase consumption possibilities.
Topic: 01-32 Optimal Allocation
Chapter 01 - Limits, Alternatives, and Choices
1-118
237.
The slope of a straight line can be determined by:
A. comparing the absolute horizontal change to the absolute vertical change between two
points on the line.
B. comparing the absolute vertical change to the absolute horizontal change between two
points on the line.
C. taking the reciprocal of the vertical intercept.
D. comparing the percentage vertical change to the percentage horizontal change between two
points on the line.
Difficulty: Medium
Learning Objective: 01-08 Explain how economic growth and international trade increase consumption possibilities.
Topic: 01-35 Increases in Factor Supplies
Chapter 01 - Limits, Alternatives, and Choices
1-119
238.
Refer to the above graph. Which of the following statements is correct?
A. Quantity demanded and quantity supplied are independent of price.
B. Price and quantity demanded are directly related.
C. Price and quantity supplied are directly related.
D. Price and quantity supplied are inversely related.
Difficulty: Medium
Learning Objective: 01-08 Explain how economic growth and international trade increase consumption possibilities.
Topic: 01-32 Optimal Allocation
Chapter 01 - Limits, Alternatives, and Choices
1-120
239.
Refer to the above graph. Which of the following schedules correctly reflects "demand"?
(A) (B) (C) (D)
P Qd P Qd P Qd P Qd
$12 0 $14 0 $14 60 $12 0
10 0 12 0 12 50 10 10
8 10 10 20 10 40 8 20
6 20 8 40 8 30 6 30
4 30 6 60 6 20 4 40
2 40 4 80 4 10 2 50
Chapter 01 - Limits, Alternatives, and Choices
1-121
A. schedule (A)
B. schedule (B)
C. schedule (C)
D. schedule (D)
Difficulty: Hard
Learning Objective: 01-08 Explain how economic growth and international trade increase consumption possibilities. Topic: 01-31 Economic rationale
240.
Chapter 01 - Limits, Alternatives, and Choices
1-122
Refer to the above graph. Which of the following schedules correctly reflects "supply"?
(A) (B) (C) (D)
P Qd P Qd P Qd P Qd
$12 0 $14 0 $14 60 $12 0
10 0 12 0 12 50 10 10
8 10 10 20 10 40 8 20
6 20 8 40 8 30 6 30
4 30 6 60 6 20 4 40
2 40 4 80 4 10 2 50
A. schedule (A)
B. schedule (B)
C. schedule (C)
D. schedule (D)
Difficulty: Hard
Learning Objective: 01-08 Explain how economic growth and international trade increase consumption possibilities.
Topic: 01-31 Economic rationale
Chapter 01 - Limits, Alternatives, and Choices
1-123
241.
Refer to the above graph. Using Qd for quantity demanded and P for price, which of the
following equations correctly states the demand for this product?
A. P = Qd/10.
B. P = 50 - P/2.
C. P = 10 - .2Qd.
D. P = 10 - 2Qd.
Difficulty: Hard
Learning Objective: 01-08 Explain how economic growth and international trade increase consumption possibilities.
Topic: 01-30 Shape of the Curve
Chapter 01 - Limits, Alternatives, and Choices
1-124
242.
Refer to the above graph. Using Qs for quantity supplied and P for price, which of the
following equations correctly states the supply of this product?
A. P = 4 + .2Qs.
B. P = 60/Qs.
C. P = 10Qs - 2P.
D. P = 2 + .2Qs.
Difficulty: Hard
Learning Objective: 01-08 Explain how economic growth and international trade increase consumption possibilities. Topic: 01-30 Shape of the Curve
Chapter 01 - Limits, Alternatives, and Choices
1-125
243. Assume a household would consume $100 worth of goods and services per week if its
weekly income were zero and would spend an additional $80 per week for each $100 of
additional income. Letting C represent consumption and Y represent income, the equation
which summarizes this relationship is:
A. C = 80 + 100Y.
B. C = 100 + .8Y.
C. C = 100 + 80Y.
D. C = 80 + .1Y.
Accessibility: Keyboard Navigation
Difficulty: Hard Learning Objective: 01-08 Explain how economic growth and international trade increase consumption possibilities.
Topic: 01-30 Shape of the Curve
244.
In line (1) on the above graph, the variables x and y are:
A. nonlinearly related.
B. positively related.
C. negatively related.
D. inversely related.
Difficulty: Easy
Learning Objective: 01-08 Explain how economic growth and international trade increase consumption possibilities. Topic: 01-32 Optimal Allocation
Chapter 01 - Limits, Alternatives, and Choices
1-126
245.
In line (3) on the above graph, variables x and y are:
A. directly related.
B. negatively related.
C. positively related.
D. nonlinearly related.
Difficulty: Easy Learning Objective: 01-08 Explain how economic growth and international trade increase consumption possibilities.
Topic: 01-32 Optimal Allocation
Chapter 01 - Limits, Alternatives, and Choices
1-127
246.
The linear equation for line (1) on the above graph is:
A. y = 8 + 2x.
B. y = 8 + .5x.
C. x = 8 + .5y.
D. y = 8 - 2x.
Difficulty: Hard
Learning Objective: 01-08 Explain how economic growth and international trade increase consumption possibilities. Topic: 01-37 Present Choices and Future Possibilities
Chapter 01 - Limits, Alternatives, and Choices
1-128
247.
The slope of line (2) on the above graph is:
A. 0
B. .66.
C. .75.
D. 1.50.
Difficulty: Hard
Learning Objective: 01-08 Explain how economic growth and international trade increase consumption possibilities. Topic: 01-35 Increases in Factor Supplies
Chapter 01 - Limits, Alternatives, and Choices
1-129
248.
The linear equation for line (3) on the above graph is:
A. y = 24 - 1.5x.
B. y = 16 - .5x.
C. y = 24 - .66x.
D. y = 24 - .75x.
Difficulty: Hard
Learning Objective: 01-08 Explain how economic growth and international trade increase consumption possibilities. Topic: 01-37 Present Choices and Future Possibilities
Chapter 01 - Limits, Alternatives, and Choices
1-130
249.
The vertical intercept of line (2) on the above graph is:
A. 8
B. 12
C. 16
D. 24
Difficulty: Medium
Learning Objective: 01-08 Explain how economic growth and international trade increase consumption possibilities. Topic: 01-36 Advances in Technology
Chapter 01 - Limits, Alternatives, and Choices
1-131
250. If the equation y = 5 + 6x was graphed, the:
A. slope would be -5.
B. slope would be +5.
C. slope would be +6.
D. vertical intercept would be +.6.
Accessibility: Keyboard Navigation
Difficulty: Medium Learning Objective: 01-08 Explain how economic growth and international trade increase consumption possibilities.
Topic: 01-37 Present Choices and Future Possibilities
251. If the equation y = 15 - 4x was plotted, the:
A. vertical intercept would be -4.
B. vertical intercept would be +4.
C. vertical intercept would be +9.
D. slope would be -4.
Accessibility: Keyboard Navigation Difficulty: Medium
Learning Objective: 01-08 Explain how economic growth and international trade increase consumption possibilities.
Topic: 01-37 Present Choices and Future Possibilities
252. If the equation y = -10 + 2.5x was plotted
A. the vertical intercept would be -10.
B. the slope would be +2.5.
C. it would graph as an upsloping line.
D. all of the above would be true.
Accessibility: Keyboard Navigation
Difficulty: Hard
Learning Objective: 01-08 Explain how economic growth and international trade increase consumption possibilities. Topic: 01-37 Present Choices and Future Possibilities
Chapter 01 - Limits, Alternatives, and Choices
1-132
253. Refer to the graph. The movement from line A to line A' represents a change in:
A. the slope only.
B. the intercept only.
C. both the slope and the intercept.
D. neither the slope nor the intercept.
Difficulty: Medium
Learning Objective: 01-08 Explain how economic growth and international trade increase consumption possibilities.
Topic: 01-36 Advances in Technology
Chapter 01 - Limits, Alternatives, and Choices
1-133
254.
In the above diagram variables x and y are:
A. both dependent variables.
B. directly related.
C. inversely related.
D. unrelated.
Difficulty: Easy
Learning Objective: 01-08 Explain how economic growth and international trade increase consumption possibilities.
Topic: 01-32 Optimal Allocation
Chapter 01 - Limits, Alternatives, and Choices
1-134
255.
In the above diagram the vertical intercept and slope are:
A. 4 and -11/3respectively.
B. 3 and -11/3respectively.
C. 3 and +3/4respectively.
D. 4 and +3/4respectively.
Difficulty: Medium
Learning Objective: 01-08 Explain how economic growth and international trade increase consumption possibilities.
Topic: 01-35 Increases in Factor Supplies
Chapter 01 - Limits, Alternatives, and Choices
1-135
256.
In the above diagram the equation for this line is:
A. y = 4 - 11/3x.
B. y = 3 + 3/4x.
C. y = 4 - 3/4x.
D. y = 4 + 11/3x.
Difficulty: Hard
Learning Objective: 01-08 Explain how economic growth and international trade increase consumption possibilities. Topic: 01-37 Present Choices and Future Possibilities
Chapter 01 - Limits, Alternatives, and Choices
1-136
257. If we are considering the relationship between two variables and release the "other things
equal" assumption, we would expect:
A. the relationship to change from direct to inverse.
B. the line representing that relationship on a graph to change locations.
C. the data points representing the relationship to become more randomly scattered.
D. the relationship to change from inverse to direct.
Accessibility: Keyboard Navigation
Difficulty: Hard Learning Objective: 01-08 Explain how economic growth and international trade increase consumption possibilities.
Topic: 01-34 A Growing Economy
258. The amount of pizzas that consumers want to buy per week is reflected in the equation P
= 15 -.02Qd, where Qd is the amount of pizzas purchased per week and P is the price of
pizzas. On the basis of this information we can say that:
A. if pizzas were free, people would consume 800 per week.
B. more pizzas will be purchased at a high price than at a low price.
C. if the price of pizzas is $6, then 150 will be purchased.
D. 50 fewer pizzas will be purchased per week for every $1 increase in price.
Accessibility: Keyboard Navigation Difficulty: Hard
Learning Objective: 01-08 Explain how economic growth and international trade increase consumption possibilities.
Topic: 01-34 A Growing Economy
Chapter 01 - Limits, Alternatives, and Choices
1-137
259.
Refer to the above diagram. The slope of curve ZZ at point B is:
A. infinity.
B. zero.
C. one.
D. none of the above.
Difficulty: Hard
Learning Objective: 01-08 Explain how economic growth and international trade increase consumption possibilities.
Topic: 01-38 A Qualification: International Trade
Chapter 01 - Limits, Alternatives, and Choices
1-138
260. The slope of a line parallel to the vertical axis is:
A. zero.
B. one.
C. infinite.
D. one-half.
Accessibility: Keyboard Navigation
Difficulty: Medium Learning Objective: 01-08 Explain how economic growth and international trade increase consumption possibilities.
Topic: 01-38 A Qualification: International Trade
261. The slope of a line parallel to the horizontal axis is:
A. zero.
B. one.
C. infinite.
D. one-half.
Accessibility: Keyboard Navigation Difficulty: Medium
Learning Objective: 01-08 Explain how economic growth and international trade increase consumption possibilities.
Topic: 01-38 A Qualification: International Trade
262. The measured slope of a line:
A. is independent of how the two variables are denominated.
B. will be affected by how the two variables are denominated.
C. necessarily diminishes as one moves rightward on the line.
D. necessarily increases as one moves rightward on the line.
Accessibility: Keyboard Navigation
Difficulty: Medium
Learning Objective: 01-08 Explain how economic growth and international trade increase consumption possibilities. Topic: 01-38 A Qualification: International Trade
Chapter 01 - Limits, Alternatives, and Choices
1-139
263. Slope of lines are especially important in economics because:
A. they measure marginal changes.
B. they always tell us something about profits.
C. positive slopes are always preferred to negative slopes.
D. they always relate to resource and output scarcity.
Accessibility: Keyboard Navigation
Difficulty: Medium Learning Objective: 01-08 Explain how economic growth and international trade increase consumption possibilities.
Topic: 01-38 A Qualification: International Trade
264. In a linear equation relating income and consumption, you know that the intercept is
$1,000 and the slope of the line is.4. If income is $20,000, then consumption is:
A. $8,000
B. $9,000
C. $10,000
D. $11,000
Accessibility: Keyboard Navigation Difficulty: Hard
Learning Objective: 01-08 Explain how economic growth and international trade increase consumption possibilities.
Topic: 01-37 Present Choices and Future Possibilities
265. Scarcity in relation to wants means you face trade-offs; therefore, having to make
choices is which of the ten key concepts to retain for a lifetime?
A. Facing trade-offs
B. Opportunity cost
C. Choosing a little more or a little less
D. The influence of incentives
Accessibility: Keyboard Navigation
Difficulty: Medium
Learning Objective: 01-01 List the ten key concepts to retain for a lifetime. Topic: 01-01 Ten Key Concepts to Retain for a Lifetime
Chapter 01 - Limits, Alternatives, and Choices
1-140
266. The cost of the choice you make is what you give up for it, is which of the ten key
concepts to retain for a lifetime?
A. Facing trade-offs
B. Opportunity cost
C. Choosing a little more or a little less
D. The influence of incentives
Accessibility: Keyboard Navigation
Difficulty: Medium Learning Objective: 01-01 List the ten key concepts to retain for a lifetime.
Topic: 01-01 Ten Key Concepts to Retain for a Lifetime
267. Choices are usually made at the margin, is which of the ten key concepts to retain for a
lifetime?
A. Facing trade-offs
B. Interest Expense
C. Marginal analysis
D. The influence of incentives
Accessibility: Keyboard Navigation Difficulty: Medium
Learning Objective: 01-01 List the ten key concepts to retain for a lifetime.
Topic: 01-01 Ten Key Concepts to Retain for a Lifetime
268. Markets usually do a good job of coordinating trade among individuals, groups, and
nations. Is which of the ten key concepts to retain for a lifetime?
A. Facing trade-offs
B. Opportunity cost
C. The effectiveness of markets
D. The influence of incentives
Accessibility: Keyboard Navigation
Difficulty: Medium
Learning Objective: 01-01 List the ten key concepts to retain for a lifetime. Topic: 01-01 Ten Key Concepts to Retain for a Lifetime
Chapter 01 - Limits, Alternatives, and Choices
1-141
269. The economic perspective focuses largely on:
A. marginal analysis.
B. rational task analysis.
C. total revenues.
D. total costs.
Accessibility: Keyboard Navigation
Difficulty: Easy Learning Objective: 01-02 Define economics and the features of the economic way of thinking.
Topic: 01-05 Marginal Analysis: Comparing Benefits and Costs
270. Like other branches of social science, economics relies on the:
Learning Objective: 01-03 Describe the role of economic theory in economics.
Topic: 01-06 Theories, Principles, and Models
271. Which of the following countries had the highest average income in 2015?
A. Norway
B. Switzerland
C. United States
D. Canada
Accessibility: Keyboard Navigation
Difficulty: Medium
Learning Objective: 01-05 Explain the individual's economic problem and how trade-offs; opportunity costs; and attainable combinations can be illustrated with budget lines.
Topic: 01-12 Limited Income
Chapter 01 - Limits, Alternatives, and Choices
1-142
272. Which of the following positions did Canada occupy with regard to average income in
2015?
A. First
B. Fourth
C. Ninth
D. Twelfth
Accessibility: Keyboard Navigation
Difficulty: Medium Learning Objective: 01-05 Explain the individual's economic problem and how trade-offs; opportunity costs; and attainable combinations
can be illustrated with budget lines.
Topic: 01-12 Limited Income
273. The attainable area for the budget line, per Figure 1.1, includes:
A. the area below the line but not the budget line itself.
B. the area below the budget line and the budget line.
C. the area above the budget line but no the budget line itself.
D. the area above the budget line and the budget line.
Accessibility: Keyboard Navigation
Difficulty: Easy Learning Objective: 01-05 Explain the individual's economic problem and how trade-offs; opportunity costs; and attainable combinations
can be illustrated with budget lines. Topic: 01-15 Attainable and Unattainable Combinations
Chapter 01 - Limits, Alternatives, and Choices
1-143
274. The production possibilities curve is bowed out from the origin because:
A. marginal benefits are equal.
B. marginal benefits decrease.
C. marginal benefits are unpredictable.
D. marginal benefits decrease and then increase in value.
Accessibility: Keyboard Navigation
Difficulty: Medium Learning Objective: 01-07 Apply the concepts of production possibilities analysis; increasing opportunity costs; and economic growth.
Topic: 01-30 Shape of the Curve
189. (Consider This) Free products offered by firms
A. may or may not be free to society but are never free to individuals.
B. may or may not be free to individuals but are never free to society.
C. are produced and distributed at no cost to society.
D. are usually items nobody wants.
Accessibility: Keyboard Navigation
Blooms: Remember Difficulty: Easy
Learning Objective: US21e
190. (Consider This) The assertion by economists that "there is no free lunch"
A. is contradicted by the presence of free goods offered by firms.
B. applies to goods that have prices, not to goods given away free by firms.
C. remains true even for goods given away free by firms.
D. applies to agricultural goods but not to manufactured goods.
212. (Last Word) A study found that the incidence of skin cancer increases along with the
amount of time people work under fluorescent light, leading some people to conclude
that fluorescent lighting is a cause of skin cancer. But further analysis found that people
who work in offices, where fluorescent light is common, suffer more sunburn on their
vacations than other workers. The sunburns, not the fluorescent light, were the cause of
the higher incidence of skin cancer. The original conclusion
illustrates
A. the fallacy of composition.
B. confusion of correlation and causation.
C. identifying marginal costs and marginal benefits.
D. biases and loaded terminology.
Accessibility: Keyboard Navigation
Blooms: Understand
Difficulty: Medium
Learning Objective: US21e
Chapter 01 - Limits, Alternatives, and Choices
1-149
Short Answer Questions
Chapter 01 - Limits, Alternatives, and Choices
1-150
275. What is a brief definition of economics? What are the conditions that give rise to this
definition?
It is the social science concerned with the efficient use of scarce resources to achieve the
maximum satisfaction of economic wants. Economic wants are many and diverse. People
seek many goods and services to satisfy their wants. Society uses productive resources to
produce goods and services that meet these wants. Unfortunately, the economic wants of
society exceeds the productive capacity of the economy to produce the goods and services to
satisfy those wants.
Accessibility: Keyboard Navigation
Difficulty: Medium Learning Objective: 01-01 List the ten key concepts to retain for a lifetime.
Topic: 01-01 Ten Key Concepts to Retain for a Lifetime
276. What are the key economic concepts that pertain to the individual?
The four key economic concepts that pertain to the individual are: (1) when individuals face
scarce resources relative to their wants, they must incur tradeoffs; (2) the cost of a choice is
what someone gives up for it or the opportunity cost; (3) decisions are usually made at the
margin where a little more or a little less of something is chosen; and (4) choices are
influenced by incentives.
Accessibility: Keyboard Navigation
Difficulty: Medium
Learning Objective: 01-01 List the ten key concepts to retain for a lifetime. Topic: 01-01 Ten Key Concepts to Retain for a Lifetime
277. What are the key economic concepts that pertain to interactions among individuals?
The three key economic concepts that pertain to interactions among individuals are: (1)
individuals can make themselves better off through specialization and trade; (2) markets
usually do a good job of coordinating decisions among individuals, groups, and nations; and
(3) government can sometimes improve the coordinating function of markets.
Accessibility: Keyboard Navigation
Difficulty: Medium Learning Objective: 01-01 List the ten key concepts to retain for a lifetime.
Topic: 01-03 Scarcity and Choice
Chapter 01 - Limits, Alternatives, and Choices
1-151
278. What are the key economic concepts that pertain to the economy as a whole?
The three key economic concepts are: (1) the standard of living in a country depends on its
production of goods and services; (2) printing of money in excess of the growth of output of
goods and services will eventually lead to inflation; (3) society faces a short-run tradeoff
between inflation and unemployment.
Accessibility: Keyboard Navigation
Difficulty: Medium Learning Objective: 01-01 List the ten key concepts to retain for a lifetime.
Topic: 01-04 Purposeful Behaviour
279. What do economists mean when they say that "there is no free lunch"? Give another
example to which this statement applies.
Anything of any value that is offered for "free" still has a cost. Economists refer to this
sacrifice as an opportunity cost. In this case, the resources that were used to provide the free
lunch could have been put to an alternative use. The opportunity cost is the next best
alternative use for those resources. As another example, consider the case of a bank that offers
you a "free" sports bag to open an account at the bank. The bag may be free to you as a new
bank customer, but there is still a cost paid by the bank in the form of resources that could
have been put to alternative uses.
Accessibility: Keyboard Navigation
Difficulty: Easy
Learning Objective: 01-02 Define economics and the features of the economic way of thinking. Topic: 01-06 Theories, Principles, and Models
Chapter 01 - Limits, Alternatives, and Choices
1-152
280. What are the three interrelated features of the economic perspective?
First, economics recognizes that there is a general condition of scarcity that forces individuals
and society to make choices. Human and property resources are scarce, so choices must be
made about how best to use those limited resources. Second, economics assumes that private
or public decision-making is based on "rational self-interest". People make rational decisions
to achieve the maximum satisfaction of a goal. Consumers try to get the best value for their
expenditures. Workers try to get the best job given their skills and abilities. Businesses try to
maximize their profits. Elected representatives try to enact policies that best promote the
national interest. Third, economics focuses on marginal analysis when making an economic
decision. The marginal or "additional" costs from an economic choice are weighed against the
additional benefit. If the marginal benefit outweighs the marginal costs, then a decision will
be made to take the beneficial action. If the marginal cost is greater than the marginal benefit,
then the action will not be taken.
Accessibility: Keyboard Navigation
Difficulty: Medium Learning Objective: 01-02 Define economics and the features of the economic way of thinking.
Topic: 01-08 Microeconomics
281. What is utility and what is its relevance to rational behaviour?
Utility is the satisfaction that individuals derive from consuming goods and services. The
economic approach assumes that humans engage in rational behaviour, that individuals make
decisions to maximize their utility.
Accessibility: Keyboard Navigation
Difficulty: Easy
Learning Objective: 01-02 Define economics and the features of the economic way of thinking. Topic: 01-08 Microeconomics
Chapter 01 - Limits, Alternatives, and Choices
1-153
282. Use marginal analysis to explain why it is possible to "have too much of a good thing".
Use education as an example.
This explanation is based on an evaluation of the marginal costs and marginal benefit of
providing a good or service. We may want more education for our society, but at some point
the marginal cost of providing additional education is greater than the marginal benefit of the
additional education. We would have to give up too many other things to obtain the additional
education. For example, would it make sense to provide additional education resources for
everyone so that they can earn a Ph.D. degree? The answer is no. In this case, the marginal
cost of these additional educational resources (for example, lost labour time or inefficient use
of people's abilities) would not be worth the marginal benefit to society of having everyone
earn a Ph.D. degree.
Accessibility: Keyboard Navigation
Difficulty: Medium Learning Objective: 01-02 Define economics and the features of the economic way of thinking.
Topic: 01-08 Microeconomics
283. What does it mean to say that theories, principles, and models are "purposeful
simplifications"?
Theories, principles, and models are "purposeful simplifications" means that when we study
economies we find far too much complexity to make any significant gain in understanding.
By assuming away unnecessary details we make it possible to gain a clearer understanding of
basic economic relationships.
Accessibility: Keyboard Navigation
Difficulty: Easy
Learning Objective: 01-03 Describe the role of economic theory in economics. Topic: 01-09 Macroeconomics
Chapter 01 - Limits, Alternatives, and Choices
1-154
284. The distinguished economist Kenneth Boulding stated: "Theories without facts may be
barren, but facts without theories are meaningless". Explain what he meant.
Economic theories are generalizations about the economic behaviour of individuals and
institutions. As generalizations or principles, they are abstractions and may not offer specific
information about a particular issue that can be obtained from facts. Economic theories are
barren in the sense that they offer a framework for thinking about the economic issue without
a lot of the details about it. Having a lot of facts about an economic issue, however, is not
very meaningful. Facts need to be arranged and organized if they are to have meaning and
give insight into the issue. Economic theory offers that framework for organizing the factual
information.
Accessibility: Keyboard Navigation
Difficulty: Medium Learning Objective: 01-03 Describe the role of economic theory in economics.
Topic: 01-09 Macroeconomics
285. Explain the importance of the ceteris paribus or "other-things-equal" assumption.
The real-world is "messy" so economists try to analyze changes in the variables of interest by
finding ways to hold "other things constant or equal". The ceteris paribus assumption is made
to indicate that these other variables are not changing or affecting the variables of interest. For
example, the theory of consumer demand states that price and quantity demanded are
inversely related; people will buy less at higher prices than they will at lower prices. But this
theory assumes that other variables like tastes and income that might affect quantity
demanded are not changing. Increasingly, experimental economists are attempting to test
theories in laboratory environments in which ceteris paribus assumptions hold.
Accessibility: Keyboard Navigation
Difficulty: Medium
Learning Objective: 01-03 Describe the role of economic theory in economics. Topic: 01-09 Macroeconomics
Chapter 01 - Limits, Alternatives, and Choices
1-155
286. "Bad theories are abstract and therefore unrealistic; good theories are fully realistic and
fit all the facts". Evaluate.
While some abstract theories are bad, that certainly does not have to be true. Most good
theories are generalizations or predictions about human economic behaviour and will not be
true in every situation, and thus will not fit all the facts all of the time. A good theory is based
on observable behaviour and will generally explain or predict correctly.
Accessibility: Keyboard Navigation
Difficulty: Medium Learning Objective: 01-03 Describe the role of economic theory in economics.
Topic: 01-09 Macroeconomics
287. "Economic models are somewhat like different types of maps". Evaluate.
Economic models are necessarily a simplification of the real world. The validity of a
particular economic model should be based upon a comparison of the model's predictions to
observable fact. A world atlas is not the best map to use to find out how to get to Vancouver
from Charlottetown, but it will tell you where South Africa is in relation to Luxembourg. If
you wanted to get to Vancouver from Charlottetown, you'd need a road map of Canada. But a
road map would not sufficiently describe the elevations if you were riding your bike and
would not likely tell you how to find Main Street in Golden, B.C. The map you use should be
judged based not on its complete accuracy and detail, but on its ability to get you where you
are going.
Accessibility: Keyboard Navigation
Difficulty: Medium
Learning Objective: 01-03 Describe the role of economic theory in economics. Topic: 01-09 Macroeconomics
Chapter 01 - Limits, Alternatives, and Choices
1-156
288. Distinguish between microeconomics and macroeconomics.
Microeconomics deals with individual economic units such as industries, firms, households,
and with individual markets, particular prices, and specific goods and services.
Macroeconomics, on the other hand, deals with the economy as a whole, including such major
aggregates as the household, business, and governmental sectors and with totals for the
economy.
Accessibility: Keyboard Navigation
Difficulty: Easy Learning Objective: 01-04 Distinguish microeconomics from macroeconomics; and positive economics from normative economics.
Topic: 01-10 Positive and Normative Economics
289. Below are six statements. Indicate whether each one pertains to microeconomics (MIC)
or macroeconomics (MAC).
(a) "The inflation rate in Canada hit its lowest level in the last twenty years".
(b) "The profits of BCE rose 20 percent during the past quarter".
(c) "A drought has occurred in the Prairies. The prices for barley are expected to rise sharply".
(d) "The nation's economy grew at an annual rate of 3.7 percent in the final quarter of the
year".
(e) "The trade surplus in Canada was $4 billion last month".
(f) "General Motors plans to spend $800 million on a new automobile plant".
(a), (d), and (e) are macro; (b), (c), and (f) are micro.
Accessibility: Keyboard Navigation
Difficulty: Easy
Learning Objective: 01-04 Distinguish microeconomics from macroeconomics; and positive economics from normative economics. Topic: 01-10 Positive and Normative Economics
Chapter 01 - Limits, Alternatives, and Choices
1-157
290. Why have the last few years been an exciting time to study macroeconomics?
Since macroeconomics deals with the economy as a whole, the global financial crisis that
spread to Canada in late 2008 resulted in a deep recession, which has been dubbed the Great
Recession which has impacted major aggregates including households, businesses, and
governmental sectors for the Canadian economy.
Accessibility: Keyboard Navigation
Difficulty: Medium Learning Objective: 01-04 Distinguish microeconomics from macroeconomics; and positive economics from normative economics.
Topic: 01-10 Positive and Normative Economics
291. Give one example of a positive economic statement and one example of a normative
economic statement.
A positive economic statement is any factual statement such as: "Last month there were 1.2
million workers unemployed". A normative economic statement is one which contains an
opinion such as: "Many people today are too lazy to look for work and that is why the
unemployment figures are so high".
Accessibility: Keyboard Navigation
Difficulty: Easy
Learning Objective: 01-04 Distinguish microeconomics from macroeconomics; and positive economics from normative economics. Topic: 01-13 Unlimited Wants
292. Below are six statements. Identify whether each is a positive or normative statement.
(a) The minimum wage should be increased so low-income workers can earn a living wage.
(b) The unemployment rate is too high and should be reduced through government actions.
(c) The rate of inflation was about 2 percent last year, an all time low for the past decade.
(d) The government should take action to break up the monopoly power of Air Canada.
(e) Interest rates should be lower in Canada so that people can afford to build a home.
(f) The Federal government achieved a budget surplus for the first time in thirty years.
(a), (b), (d) and (e) are normative; and (c) and (f) are positive.
Accessibility: Keyboard Navigation
Difficulty: Easy Learning Objective: 01-04 Distinguish microeconomics from macroeconomics; and positive economics from normative economics.
Topic: 01-13 Unlimited Wants
Chapter 01 - Limits, Alternatives, and Choices
1-158
293. Identify whether each of the following is a positive or normative statement.
(a) Should tuition fees increase, fewer students would obtain a post-secondary education.
(b) The Prime Minister announced that Canada is the best place in the world to live.
Both statements are positive. Although statement (a) contains the word, "should", it is simply
a cause and effect statement. Another way of expressing the same idea is "If tuition fees are
increased, fewer students would obtain a post-secondary education". Statement (b) is also
positive because it is concerned with facts. Although the statement is made up of a normative
phrase ("best place in the world"), at its core is a factual statement regarding an
announcement by the Prime Minister.
Accessibility: Keyboard Navigation
Difficulty: Medium Learning Objective: 01-04 Distinguish microeconomics from macroeconomics; and positive economics from normative economics.
Topic: 01-13 Unlimited Wants
294. "Economists are scientists and therefore should not become involved in making value
judgments which policy formulation necessarily entails". Do you agree?
It is important to distinguish between positive and normative economics. When conducting
positive economic analysis, economists use objective, scientific methods to collect data and
test hypotheses to arrive at economic theories and principles. However, there is a need to
apply economic theories to real-world problems and this necessarily requires some value
judgments or the use of normative economics. Even scientists who can experiment in
laboratories have to make value judgments when they arrive at the point of applying their
theories. For example, geneticists must make value judgments about the uses of genetic
science.
Economists know their own theories best so they should be involved in the decisions about
how to apply those theories. Of course, in a democratic society those judgments are often
advisory and must be approved by elected representatives before they are enacted.
Accessibility: Keyboard Navigation
Difficulty: Medium
Learning Objective: 01-04 Distinguish microeconomics from macroeconomics; and positive economics from normative economics. Topic: 01-13 Unlimited Wants
Chapter 01 - Limits, Alternatives, and Choices
1-159
295. "Economics cannot be scientific because it is based upon the value judgment that 'more
(output) is better'". Do you agree?
This statement can be subjected to positive economic analysis. If you can show that this
assumption is valid, i.e., that it is correct that most people believe that "more is better", then
this is not a value judgment but a testable principle of economics. Where this assumption is
questioned, it is a rather simple matter to test the hypothesis about whether "more is regarded
as better". In other words, if people behave as if more is better, then this assumption is not a
result of value judgments by economists, but rather the result of observing that this is the way
humans act.
Accessibility: Keyboard Navigation
Difficulty: Medium Learning Objective: 01-04 Distinguish microeconomics from macroeconomics; and positive economics from normative economics.
Topic: 01-13 Unlimited Wants
296. What were the approximate average incomes of Canadians and Pakistanis in 2015?
$47250 and $1440 ($US at market exchange rates).
Accessibility: Keyboard Navigation
Difficulty: Medium
Learning Objective: 01-05 Explain the individual's economic problem and how trade-offs; opportunity costs; and attainable combinations can be illustrated with budget lines.
Topic: 01-15 Attainable and Unattainable Combinations
297. What were the approximate average incomes of Canadians and Pakistanis in 2015?
$47250 and $1440 ($US at market exchange rates).
Accessibility: Keyboard Navigation
Difficulty: Easy
Learning Objective: 01-05 Explain the individual's economic problem and how trade-offs; opportunity costs; and attainable combinations
can be illustrated with budget lines. Topic: 01-14 The Budget Line
Chapter 01 - Limits, Alternatives, and Choices
1-160
298. What is meant by the "the individual's economic problem"?
An individual's income is limited whereas their wants are unlimited. This forces them to make
choices to optimize their well-being.
Accessibility: Keyboard Navigation
Difficulty: Medium Learning Objective: 01-05 Explain the individual's economic problem and how trade-offs; opportunity costs; and attainable combinations
can be illustrated with budget lines.
Topic: 01-16 Trade-offs and Opportunity Costs
299. Describe the Greek Debt Crisis, and explain its relation to the Economic Problem?
In late 2009, it became known that the Greek government had gone on a spending spree, and
had an accumulated debt that was about 120 percent of the country's income (or GDP).
Moreover, in 2010 Greece's annual budget shortfall was more than 10 percent of GDP, one of
the highest in the world and unsustainable given its poor prospects for economic growth, and
so the Greek economy was in a crisis. The Greek government was forced to institute strict
austerity measures that led to the contraction of the economy in both 2010 and 2011. Greece
was able to consume beyond its means by borrowing, but inevitably in a world of scarcity of
resources this practice cannot be sustained indefinitely. Just like an individual's income is
limited whereas their wants are unlimited, similarly on an aggregate level the entire nation of
Greece is forced them to make choices to optimize their well-being.
Accessibility: Keyboard Navigation
Difficulty: Easy Learning Objective: 01-05 Explain the individual's economic problem and how trade-offs; opportunity costs; and attainable combinations
can be illustrated with budget lines.
Topic: 01-17 Choice
300. What variables are used to determine the individual's budget line?
Income and the prices of the two goods will determine the position of the budget line. Income
divided by the price of a good will determine the point where the budget line intersects an
axis.
Accessibility: Keyboard Navigation
Difficulty: Easy
Learning Objective: 01-05 Explain the individual's economic problem and how trade-offs; opportunity costs; and attainable combinations can be illustrated with budget lines.
Topic: 01-17 Choice
Chapter 01 - Limits, Alternatives, and Choices
1-161
301. How do income changes affect the position of the budget line?
Increases in income causes a parallel shift outward of the budget line (without changing its
slope) while decreases in income cause the budget line to shift inward.
Accessibility: Keyboard Navigation
Difficulty: Easy Learning Objective: 01-06 List the categories of scarce resources and delineate the economic problem.
Topic: 01-20 Scarce Resources
302. What do economists mean when they say that economic resources or factors of
production are scarce or limited in supply?
They mean that resources are not so abundant that they may be used freely for everything
everyone wants. There are not enough resources available to meet all of society's unlimited
Learning Objective: 01-06 List the categories of scarce resources and delineate the economic problem. Topic: 01-18 Income Changes
303. What is meant by "society's economic problem"?
The economic problem stems from two related facts. Economic wants are unlimited because
they cannot be completely satisfied with the existing limited supply of resources available for
production. Resources are said to be scarce relative to these unlimited economic wants. For
this reason, people must make choices and economize on resource use.
Accessibility: Keyboard Navigation
Difficulty: Medium
Learning Objective: 01-06 List the categories of scarce resources and delineate the economic problem.
Topic: 01-20 Scarce Resources
Chapter 01 - Limits, Alternatives, and Choices
1-162
304. List the four resource categories and give a brief description of each.
(a) Land: natural resources including land, forests, water and minerals.
(b) Capital: investment goods or those manufactured items used in production of other goods.
Factories, tools, machinery, transportation facilities, and equipment are examples. Money is
not a capital good.
(c) Labour: a broad term used to describe the physical and mental talents of men and women
available to be used in producing goods and services.
(d) Entrepreneurial ability: a type of human resource, but unique from productive labour in
that it refers to the person who is the driving force behind production decisions, innovation,
and the one who is willing to take the risk of time, effort, reputation, and/or funds.
Accessibility: Keyboard Navigation
Difficulty: Medium Learning Objective: 01-06 List the categories of scarce resources and delineate the economic problem.
Topic: 01-20 Scarce Resources
305. What four basic functions does the entrepreneur perform for the economy?
First, the entrepreneur takes the initiative in combining resources to produce a product. In this
way the entrepreneur is a catalyst for production in the economy. Second, the entrepreneur
makes basic business policy decisions that set the course for the business enterprise. Third,
the entrepreneur will introduce new or improved products to the market place or develop new
forms of business organization. In this role, the entrepreneur serves as an innovator for the
economy. Fourth, the entrepreneur bears the risk in terms of time, effort, and invested funds.
Innovation is risky, as nearly all new products and ideas are subject
Accessibility: Keyboard Navigation
Difficulty: Medium
Learning Objective: 01-06 List the categories of scarce resources and delineate the economic problem. Topic: 01-19 Society's Economic Problem
Chapter 01 - Limits, Alternatives, and Choices
1-163
306. Explain and evaluate: "If resources were infinitely abundant in relation to the demand for
them, the economic problem would dissolve in a sea of affluence".
The economic problem refers to the need to make choices because economic wants are
virtually unlimited but the means (income, time, resources) for satisfying those wants are
limited. If resources were infinitely abundant in relation to the demand for them, people
would not have to make choices and there would be no need for economic systems to
distribute the goods and services produced. In a world of abundance, people could simply
help themselves to whatever they wanted.
Accessibility: Keyboard Navigation
Difficulty: Medium Learning Objective: 01-06 List the categories of scarce resources and delineate the economic problem.
Topic: 01-19 Society's Economic Problem
307. "The relative scarcity of resources makes the operation of any economy a matter of
choosing between alternatives". Explain.
The fact that people cannot have as much as they want of everything requires them to make
choices. There has to be some system for making these choices. For example, it may be "first
come, first serve", or a system based on power with the strongest controlling the resources, or
it may be a market-based system where the primary motivation is the profit incentive.
Accessibility: Keyboard Navigation
Difficulty: Medium
Learning Objective: 01-06 List the categories of scarce resources and delineate the economic problem. Topic: 01-18 Income Changes
Chapter 01 - Limits, Alternatives, and Choices
1-164
308. "The two cornerstones of economics are the scarcity of resources and the multiplicity of
wants. True economy consists of deriving maximum want satisfaction from available
resources". Explain.
The first statement refers to the basic economic problem: that society's wants are unlimited
relative to the limited supply of productive resources. The second part of the statement refers
to the concept of efficiency, both allocative and productive. Since resources are scarce, it is
desirable to achieve the most output from those available. Otherwise we waste resources and
will not satisfy as many wants as we could from the resources that we have available, which
would mean not achieving productive efficiency. Allocative efficiency means the maximum
satisfaction of wants with these resources.
Accessibility: Keyboard Navigation
Difficulty: Medium Learning Objective: 01-06 List the categories of scarce resources and delineate the economic problem.
Topic: 01-18 Income Changes
309. Explain the relationship between full employment of resources and full production.
Full employment of resources means that none of the available resources are idle. Full
production goes one step further. It means that not only are resources fully employed, they are
employed efficiently in the sense that they are making their most valued contributions to the
national output. If the economy fails to realize full production, then economists say our
resources are underemployed.
Accessibility: Keyboard Navigation
Difficulty: Medium
Topic: 01-21 Resource Categories
310. The production possibilities table below shows the hypothetical relationship between the
production of food and clothing in an economy.
Combination Food Clothing
A 0 4
B 7 3
C 13 2
D 18 1
E 22 0
Chapter 01 - Limits, Alternatives, and Choices
1-165
(a) What is the marginal opportunity cost of producing the second unit of clothing?
(b) What is the total opportunity cost of producing two units of clothing?
(c) What is the marginal opportunity cost of producing the third unit of clothing?
(d) What is the total opportunity cost of producing three units of clothing?
(a) 5 units of food (18 - 13 = 5); (b) 9 units of food (22 - 13 = 9); (c) 6 units of food (13 - 7 =
6); (d) 15 units of food (22 - 7 = 15).
Accessibility: Keyboard Navigation
Difficulty: Medium Learning Objective: 01-07 Apply the concepts of production possibilities analysis; increasing opportunity costs; and economic growth.
Topic: 01-22 Land
Chapter 01 - Limits, Alternatives, and Choices
1-166
311. A production possibilities table for two products, grain and airplanes, is found below.
Usual assumptions regarding production possibilities are implied. Grain is measured in tons
and airplanes are measured in units of 1,000.
Combination Grain (tons) Airplanes (1,000s)
A 0 7
B 14 6
C 26 5
D 36 4
E 44 3
F 50 2
G 54 1
H 56 0
(a) Using the below graph construct a production possibilities curve from this information
placing grain on the vertical axis and airplanes on the horizontal axis.
Chapter 01 - Limits, Alternatives, and Choices
1-167
(b) What is the opportunity cost of producing the first unit of airplanes? The marginal
opportunity cost of producing the fourth unit of airplanes?
Chapter 01 - Limits, Alternatives, and Choices
1-168
(b) Two units of grain (56-54) are sacrificed if one unit of planes is produced. When the
fourth unit of planes is produced the marginal opportunity cost is eight units of grain (44-36).
Difficulty: Medium
Learning Objective: 01-07 Apply the concepts of production possibilities analysis; increasing opportunity costs; and economic growth. Topic: 01-22 Land
312. A production possibilities table for two products, corn and paper, is found below. Usual
assumptions regarding production possibilities are implied. Corn is measured in tons, and
paper is measured per unit.
Combination Corn Paper
A 0 6
B 18 5
C 33 4
D 45 3
E 54 2
F 60 1
G 63 0
Chapter 01 - Limits, Alternatives, and Choices
1-169
(a) Using the following graph construct a production possibilities curve from this information
placing corn on the vertical axis and paper on the horizontal axis.
(b) What is the marginal opportunity cost of producing the first unit of paper? The marginal
opportunity cost of producing the fourth unit of paper?
(b) Three units of corn (63-60) are sacrificed if 1 unit of paper is produced. When the fourth
unit of paper is produced the opportunity cost is 12 units of corn (45-33).
Difficulty: Medium
Learning Objective: 01-07 Apply the concepts of production possibilities analysis; increasing opportunity costs; and economic growth.
Topic: 01-22 Land
Chapter 01 - Limits, Alternatives, and Choices
1-170
313. What is the economic rationale for the law of increasing costs?
Economic resources are not completely adaptable to alternative uses. In a two-product (A and
B) economy, an increase in the production of product A will cause a reduction in the quantity
of product B that can be produced because resources are being reallocated from the
production of B to A. That reallocation of resources is not constant and becomes increasingly
costly in terms of the lost production of B. As more resources shift from the production of B
to A, these resources are less and less adaptable or suitable for the production of A. The
production of more and more of A entails an increasing opportunity cost in the form of less
and less production of B.
Accessibility: Keyboard Navigation
Difficulty: Medium Learning Objective: 01-07 Apply the concepts of production possibilities analysis; increasing opportunity costs; and economic growth.
Topic: 01-24 Capital
314. Explain how increasing opportunity costs are reflected graphically in the production
possibilities curve. How would the curve appear if opportunity costs were constant?
The production possibilities curve illustrates the concept of increasing opportunity cost with
its changing slope. This causes the curve to be concave toward the origin. It occurs because
when society produces more and more of one product, it must give up increasing amounts of
alternative products due to the fact that resources are specialized. If resources could be used
equally efficiently to produce all things, opportunity costs would be constant and the
production possibilities curve would be a straight line graph showing alternative production
possibilities.
Accessibility: Keyboard Navigation
Difficulty: Medium
Learning Objective: 01-07 Apply the concepts of production possibilities analysis; increasing opportunity costs; and economic growth. Topic: 01-24 Capital
315. An economy consists of five workers, who can produce either fish or fruit. The following
table shows the daily output of each worker.
Worker Fish Fruit
A 10 20
B 6 10
C 8 6
Chapter 01 - Limits, Alternatives, and Choices
1-171
D 8 4
E 10 10
(a) Suppose one worker catches fish and four workers pick fruit. For the economy to achieve
productive efficiency, which of the five workers must fish?
(b) Does the economy achieve full employment and productive efficiency by producing 26
fish and 20 fruit?
(a) Productive efficiency requires that resources be used in the least costly way. To achieve
productive efficiency, worker D must catch fish since this worker incurs the lowest
opportunity cost. For each fish that worker D catches,.5 units of fruit are lost. The other
workers face a higher opportunity cost for each fish caught. As the economy produces more
fish, it must shift the workers from fruit. Initially, the opportunity cost of doing so is relatively
low. However, the opportunity cost increases. This is why the production possibilities curve is
concave to the origin. Although workers A and E can produce more fish than worker D, they
also incur greater opportunity costs.
(b) Although the economy may be achieving full employment, it does not achieve productive
efficiency. The economy can produce 26 fish and 20 fruit when fully employing workers A,
C, and D in fishing and workers B and E in picking fruit. However, this allocation of
resources does not achieve full production. Resources are underemployed. It is possible to
produce more fish without losing any fruit by reallocating the five workers. If workers B, C,
D, and E catch fish and worker A picks fruit, the economy's output is 32 fish and 20 fruit.
Worker A incurs the lowest opportunity cost of all workers when picking fruit. Therefore,
productive efficiency requires that worker A is allocated to picking fruit before any other
worker.
Accessibility: Keyboard Navigation
Difficulty: Medium
Learning Objective: 01-07 Apply the concepts of production possibilities analysis; increasing opportunity costs; and economic growth. Topic: 01-21 Resource Categories
Chapter 01 - Limits, Alternatives, and Choices
1-172
316. An economy consists of five workers, who can produce either fish or fruit. The following
table shows the daily output of each worker.
Worker Fish Fruit
A 4 4
B 6 2
C 2 1
D 8 6
E 4 1
(a) Suppose one worker catches fish and four workers pick fruit. For the economy to achieve
productive efficiency, which of the five workers must fish?
(b) Does the economy achieve full employment and productive efficiency by producing 12
fish and 4 fruit?
(a) Productive efficiency requires that resources be used in the least costly way. To achieve
productive efficiency, worker E must catch fish since this worker incurs the lowest
opportunity cost. For each fish that worker E catches,.25 units of fruit are lost. The other
workers face a higher opportunity cost for each fish caught. As the economy produces more
fish, it must shift the workers from fruit. Initially, the opportunity cost of doing so is relatively
low. However, the opportunity cost increases. This is why the production possibilities curve is
concave to the origin. Although workers B and D can produce more fish than worker E can,
they also incur greater opportunity costs.
(b) Although the economy may be achieving full employment, it does not achieve productive
efficiency. The economy can produce 12 fish and 4 fruit when fully employing workers A and
D in fishing and workers B, C, and E in picking fruit. However, this allocation of resources
does not achieve full production. Resources are underemployed. It is possible to produce more
fish without losing any fruit by reallocating the five workers. If workers B, C, D, and E catch
fish and workers A picks fruit, the economy's output is 20 fish and 4 fruit. Worker A incurs
the lowest opportunity cost of all workers when picking fruit. Therefore, productive efficiency
requires that worker A is allocated to picking fruit before any other worker.
Accessibility: Keyboard Navigation Difficulty: Medium
Learning Objective: 01-07 Apply the concepts of production possibilities analysis; increasing opportunity costs; and economic growth.
Topic: 01-21 Resource Categories
Chapter 01 - Limits, Alternatives, and Choices
1-173
317. What changes must occur for the potential total output of the economy to grow?
Economic growth is the result of (1) increases in supplies of factors of production or
resources, (2) improvements in factor or resource quality, and (3) technological advances so
that more can be produced with the existing level and quality of resources.
Accessibility: Keyboard Navigation
Difficulty: Easy Learning Objective: 01-08 Explain how economic growth and international trade increase consumption possibilities.
Topic: 01-27 Production Possibilities Table
318. Look at the following production possibilities curve illustrating the possibilities in
Sluggerville for producing bats and/or peanuts with the existing level of resources and
technology.
(a) Show a point U that would indicate unemployed resources in Sluggerville.
(b) Draw a new curve B that illustrates the results of improved technology in the production
of bats, but no change in the production efficiency of peanuts.
(c) Show a point G that would indicate a point that is currently unattainable in the production
of peanuts and bats in Sluggerville.
Difficulty: Medium Learning Objective: 01-08 Explain how economic growth and international trade increase consumption possibilities.
Topic: 01-27 Production Possibilities Table
Chapter 01 - Limits, Alternatives, and Choices
1-174
319. Explain how each event affects production possibilities.
(a) The population becomes more educated over time as the number of high school dropouts
falls and the number of college graduates rises.
(b) The unemployment rate declines from 8 to 6 percent of the labour force.
(c) Businesses and government are unable to solve a major computer problem, thus reducing
economic efficiency and national output.
(d) Advances in telecommunications and new technology significantly contribute to economic
growth over time.
(e) The Federal government decides to allocate more resources to national defence.
(a) Improvements in the basic education of the labour force typically contribute to an increase
in productivity. The production possibilities curve should move outward.
(b) Unemployment means that there is inefficient use of existing resources. Production moves
from a point inside the production possibilities curve toward the frontier.
(c) The most likely answer is that the production possibilities curve shifts inward. It would
also be possible that there is movement from the frontier of the production possibilities curve
to an interior point. Both answers indicate that there is less economic inefficiency in the
economy.
(d) Advances in telecommunications and new technology significantly contribute to economic
growth over time.
(e) There will be movement along the existing production possibilities curve toward more
defence goods at one axis from all other goods at the other axis.
Accessibility: Keyboard Navigation
Difficulty: Medium Learning Objective: 01-08 Explain how economic growth and international trade increase consumption possibilities.
Topic: 01-27 Production Possibilities Table
Chapter 01 - Limits, Alternatives, and Choices
1-175
320. Describe the adjustments in the production possibilities curves in each of the following
situations for the Canadian economy.
(a) the economy moves from full employment into a deep recession
(b) the economy makes great strides in eliminating discrimination
(c) the end of the Cold War leads to cuts in military spending
(d) the government significantly increases spending for health and education
(a) The economy begins at a point on the curve but with recession there is unemployment and
the economy now operates at a point in the area inside the curve, indicating that production is
less than that which is possible because some resources are not being used.
(b) Eliminating discrimination would move the economy from a point inside its production
possibilities curve toward a point on the curve.
(c) If the curve is illustrating the tradeoff between private spending and government spending
(or between military and consumer goods), then this should mean a movement along the curve
in the direction of more private or consumer production and less military production.
Government spending in general could decrease, but if that were not the case, then the
government might simply shift some funds from the military to other types of government
spending and the point would not necessarily move at all on a curve depicting the tradeoff
between government and private spending.
(d) Movement depends on where the money is coming from. If the money comes from
increased taxes or borrowing, then there is a movement along the curve away from private
spending and toward public spending. If the money comes from other government programs
and the curve is illustrating government versus private spending, the amount of total
government production would not necessarily change, so the point could remain at the same
spot on the curve.
Accessibility: Keyboard Navigation Difficulty: Medium
Learning Objective: 01-08 Explain how economic growth and international trade increase consumption possibilities.
Topic: 01-27 Production Possibilities Table
Chapter 01 - Limits, Alternatives, and Choices
1-176
321. Evaluate. Since the production possibilities curve can shift outward over time, it is
possible for an economy to get more of a product without incurring an opportunity cost.
Outward shifts of the production possibilities curve occur if factor supplies increase or if
technology advances. Both these changes, however, are not without cost. Increases or
improvements in factor supplies involve tradeoffs. For example, a nation can increase its
stock of capital by forgoing some goods for the present. Likewise, an increase in natural
resources requires the use of resources for exploration and development that could have been
used to produce goods for the present. Similarly, technological advancement is the result of
employing resources with alternative uses in research and development.
Accessibility: Keyboard Navigation
Difficulty: Medium Learning Objective: 01-08 Explain how economic growth and international trade increase consumption possibilities.
Topic: 01-27 Production Possibilities Table
322. One application of the production possibilities concept has been to explain the difference
in growth patterns of a nation with a high level of investment (Alta) and an equivalent nation
with a low level of investment (Zorn). Use the concept to explain why Alta's economic
growth would be greater than that of Zorn over time.
The application suggests the tradeoff illustrated by a production possibilities curve with
consumption spending on one axis and investment spending on the other axis. In Alta the
combination of consumption and investment spending is heavily weighted toward investment.
In Zorn investment spending is a smaller percentage of domestic output. If investment were
measured on the vertical axis and consumption on the horizontal axis, Alta's optimal selection
would be much higher on its production possibilities curve than would be the selection in
Zorn. As a result of this larger proportion of income spent on investment goods, Alta's capital
resource base and its economy grow more rapidly, which means its production possibilities
curve shifts outward at a more rapid pace over time.
Accessibility: Keyboard Navigation
Difficulty: Medium
Learning Objective: 01-08 Explain how economic growth and international trade increase consumption possibilities. Topic: 01-27 Production Possibilities Table
Chapter 01 - Limits, Alternatives, and Choices
1-177
323. The production possibilities curve suggests that a nation cannot live beyond its means or
production potential. Explain why international trade would cause this statement to be
modified.
International trade allows for greater specialization and production. This activity has the effect
of increasing the quantity and quality of resources, using resources more efficiently or
improving output through the use of new production techniques. Thus, the gains from
international specialization and trade are the equivalent of economic growth.
Accessibility: Keyboard Navigation
Difficulty: Medium Learning Objective: 01-08 Explain how economic growth and international trade increase consumption possibilities.
Topic: 01-29 Law of Increasing Opportunity Costs
324. Why do economists use graphs in their work?
Economists use graphs to illustrate the relationship between economic variables in a visual
format which often is more efficient than explaining the relationship in words. By seeing the
relationship in graphical format, the reader (viewer) is able to readily describe the
relationship.
Accessibility: Keyboard Navigation
Difficulty: Easy
Learning Objective: 01-08 Explain how economic growth and international trade increase consumption possibilities. Topic: 01-30 Shape of the Curve
325. In a two-dimensional graph showing the relationship between income and consumption
in the economy, what is shown on the vertical axis and what is shown on the horizontal axis?
In the typical two-dimensional graph, the vertical axis measures the dependent variable,
which in this case would be consumption. The horizontal axis measures the independent
variable, which in this case would be income.
Accessibility: Keyboard Navigation
Difficulty: Easy Learning Objective: 01-08 Explain how economic growth and international trade increase consumption possibilities.
Topic: 01-31 Economic rationale
Chapter 01 - Limits, Alternatives, and Choices
1-178
326. Define what is meant by a positive or direct relationship between two variables and
describe the line graph depicting such a relationship.
A positive or direct relationship between two variables describes a situation where the two
variables change in the same direction. If the first variable increases, the second variable
increases; if the first decreases, the second decreases. An example would be individual
income and spending. Generally, high spending is associated with high incomes and lower
spending is associated with lower incomes. The line graph of a direct, positive relationship is
upward sloping from left to right.
Accessibility: Keyboard Navigation
Difficulty: Medium Learning Objective: 01-08 Explain how economic growth and international trade increase consumption possibilities.
Topic: 01-32 Optimal Allocation
327. Define what is meant by an inverse relationship between two variables and describe the
line graph depicting such a relationship.
An inverse relationship describes a situation where the two variables change in opposite
directions. When the first variable increases, the second variable decreases and vice versa. An
example would be product price and quantity demanded of the product. Other things being
equal, the higher the product price, the less will be purchased. The line graph of an inverse
relationship has a negative slope; that is, it is downward sloping from left to right.
Accessibility: Keyboard Navigation
Difficulty: Medium
Learning Objective: 01-08 Explain how economic growth and international trade increase consumption possibilities. Topic: 01-32 Optimal Allocation
328. Differentiate between the independent and dependent variables in an economic
relationship.
The dependent variable changes as a consequence of the change in the independent variable.
By specifying one variable as the dependent variable, a causal relationship is implied with
changes in the independent variable causing changes in the dependent variable. The
dependent variable is the "effect" or outcome.
Accessibility: Keyboard Navigation
Difficulty: Easy Learning Objective: 01-08 Explain how economic growth and international trade increase consumption possibilities.
Topic: 01-33 Unemployment, Growth, and the Future
Chapter 01 - Limits, Alternatives, and Choices
1-179
329. Describe the slope of a direct and an inverse relationship.
The ratio of the vertical change (the rise or fall) to the horizontal change (the run) in moving
between two points on the line is called the slope of the line. The slope of an upward sloping
line is positive, reflecting a direct relationship between two variables; the slope of a
downward sloping line is negative, reflecting an inverse relationship.
Accessibility: Keyboard Navigation
Difficulty: Medium Learning Objective: 01-08 Explain how economic growth and international trade increase consumption possibilities.
Topic: 01-35 Increases in Factor Supplies
330. Show graphically the relationships that you would expect to find between (a) student IQs
and grade point averages (GPAs); (b) the price of a product and the amount consumers will
purchase; (c) the temperature and the number of people at the swimming pool. Which of these
are direct relationships and which are inverse? What considerations might change the
expected relationships?
The direct relationships expected are (a) IQs and grade point averages, and (c) the temperature
and the number of people at the pool.
These relationships could change if external conditions were changed to affect these
relationships. For example, in (a) if high IQ students were forced to take the most difficult
classes, the direct relationship might disappear; in (b) if high-priced products became very
fashionable and were of far superior quality, people might actually buy more when prices
rose; in (c) if the number of people in the pool was limited to a low number or if air pollution
alerts accompanied high temperatures, the direct relationship between temperature and pool
attendance might change.
Accessibility: Keyboard Navigation
Difficulty: Medium
Learning Objective: 01-08 Explain how economic growth and international trade increase consumption possibilities. Topic: 01-31 Economic rationale
Chapter 01 - Limits, Alternatives, and Choices
1-180
331. Show graphically on the below graph the expected relationship between investment
spending and interest rates. Put investment expenditures on the horizontal axis and the rate of
interest on the vertical axis; connect the points and label the curve "Investment demand".
Describe this relationship between the rate of interest and investment expenditures. Describe
the slope of the investment curve.
The relationship between the interest rate and investment expenditures is inverse. The slope of
the investment curve is downsloping or negative.
Difficulty: Easy
Learning Objective: 01-08 Explain how economic growth and international trade increase consumption possibilities. Topic: 01-31 Economic rationale
Chapter 01 - Limits, Alternatives, and Choices
1-181
332. There are two sets of x, y points on a straight line in a two-variable graph with y on the
vertical axis and x on the horizontal axis. What would be the linear equation for the line if one
set of points was (0, 12) and the other set was (12, 36)?
The linear equation is y = 12 + 2x.
Accessibility: Keyboard Navigation
Difficulty: Medium Learning Objective: 01-08 Explain how economic growth and international trade increase consumption possibilities.
Topic: 01-37 Present Choices and Future Possibilities
333. The value of the vertical intercept is $100 and the slope is 0.8 in a linear equation for
consumption (measured on the vertical axis) and disposable income (measured on the
horizontal axis). If disposable income is $1000, what is consumption? State the linear
equation and show how you found the answer.
The linear equation is consumption = $100 + 0.8(disposable income). When disposable
income is $1000, consumption is $900 = 100 + 0.8($1000).
Accessibility: Keyboard Navigation
Difficulty: Medium
Learning Objective: 01-08 Explain how economic growth and international trade increase consumption possibilities. Topic: 01-37 Present Choices and Future Possibilities
334. How do you determine the slope of a nonlinear curve? Will the slope be the same along
the curve? Explain.
The slope of a curve at any point is determined by calculating the slope of a straight line
tangent to the curve at that point. The slope will change as you move along the curve. The
curve has a different slope at each point.
Accessibility: Keyboard Navigation
Difficulty: Easy Learning Objective: 01-08 Explain how economic growth and international trade increase consumption possibilities.
Topic: 01-38 A Qualification: International Trade
Chapter 01 - Limits, Alternatives, and Choices
1-182
335. Using the below graph give the slopes of the lines tangent to the curve at points A, B,
and C.
To find the slope, choose two points on the tangent line and divide the vertical distance
between the two points by the horizontal distance. The tangent line aa passes through (5, 10)
and (0, 3). Therefore, the slope at point A is 7/5 or 1.4. The slope at point B is zero. The
tangent line cc passes through (35, 10) and (31, 15). Therefore, the slope at point C is -5/4 or -
1.25.
Difficulty: Medium Learning Objective: 01-08 Explain how economic growth and international trade increase consumption possibilities.