Chapter 1 1. A zoologist studying adult bears measures a number of different variables. Which of the following possible variables is categorical? A. the weight in pounds of an adult bear B. the level of aggression (low, moderate, high) displayed by an adult bear C. The number of fish an adult bear eats in a particular day.
Transcript
Chapter 1 1. A zoologist studying adult bears measures a number of different variables. Which of the following possible variables is categorical?
A. the weight in pounds of an adult bear B. the level of aggression (low, moderate, high) displayed by an adult bear C. The number of fish an adult bear eats in a particular day.
2. A zoologist studying adult bears measures a number of different variables. One variable is the body temperature of the bear during hibernation. Which of the following is the best description of the distribution of this variable.
A. All the values that the zoologist records for body temperature and how many individual bears have each value.
B. The difference between the highest temperature recorded for a bear's body temperature and the lowest.
C. The geographical area in which the adult bears can be found.
3. Suppose we classify 315 randomly selected college students according to their general major field and their self-described political viewpoint. The table presents the results. Sciences Business Humanities Social Sciences Liberal 17 12 32 30 Moderate 33 40 23 20 Conservative 35 38 17 18 Which of the following list of numbers is a marginal distribution of the variable political viewpoint?
A. 30, 20, 18 B. 85, 90, 72, 68 C. 91, 116, 108
4. Suppose we classify 315 randomly selected college students according to their general major field and their self-described political viewpoint. The table presents the results. Sciences Business Humanities Social Sciences Liberal 17 12 32 30 Moderate 33 40 23 20 Conservative 35 38 17 18 What percentage of all students surveyed are conservatives majoring in business?
A. 12.1% B. 42.2% C. 28.6%
5. Suppose we classify 315 randomly selected college students according to their general major field and their self-described political viewpoint. The table presents the results. Sciences Business Humanities Social Sciences Liberal 17 12 32 30 Moderate 33 40 23 20 Conservative 35 38 17 18 What percentage of liberals surveyed were humanities majors?
A. 44.4% B. 35.2% C. 28.9%
6. Suppose we classify 315 randomly selected college students according to their general major field and their self-described political viewpoint. The table presents the results. Sciences Business Humanities Social Sciences Liberal 17 12 32 30 Moderate 33 40 23 20 Conservative 35 38 17 18 Which of the following characteristics of these data supports the conclusion that there is an association between political viewpoint and general major field?
A. The sample does not contain equal number of individuals in each cell. B. A higher proportion of students with a liberal political viewpoint major in the
humanities, and a higher proportion of moderates and conservatives major in business.
C. The marginal distributions of the two variables are not proportional.
7. Below is a graphical presentation of information from the World Bank about the percentage of land in four East African countries that is forest.
What's wrong with this method of presenting information?
A. The vertical scale underrepresents differences between countries. B. "Percentage of land area" does not take into account differences on total
area among these countries. C. Using proportionally-sized trees exaggerates differences between countries.
8. Below is a dotplot of voter turnout (as a percentage of voting-age population) for the 50 states—plus the District of Columbia—in a recent presidential election.
Which of the following best describes this distribution?
A. Skewed slightly left, centered at about 62%, with a range of 24 percentage points.
B. Roughly symmetric, centered at about 60%, with a range of 30 percentage points.
C. Skewed slightly right, centered at about 62%, with a range of 24 percentage points.
9. Below is a dotplot of voter turnout (as a percentage of voting-age population) for the 50 states—plus the District of Columbia—in a recent presidential election.
Approximately what percentage of the states had a turnout above 65%?
A. 27.5% B. 17.6% C. 18%
10. Below is a dotplot of voter turnout (as a percentage of voting-age population) for the 50 states—plus the District of Columbia—in a recent presidential election.
What is the interquartile range?
A. 57 to 65 B. 61 C. 8
11. The stem-and-leaf diagram below gives the distribution of the ages in years of 20 participants at a family reunion. 0 7888 1 23689 2 45799 3 9 4 5 8 6 5 7 89 8 9 1 Which of the following statements about the distribution is correct?
A. The mean is larger than the median. B. The distribution is strongly skewed to the left. C. It makes the most sense to use the mean and standard deviation as a
numerical summary of the center and spread of this distribution.
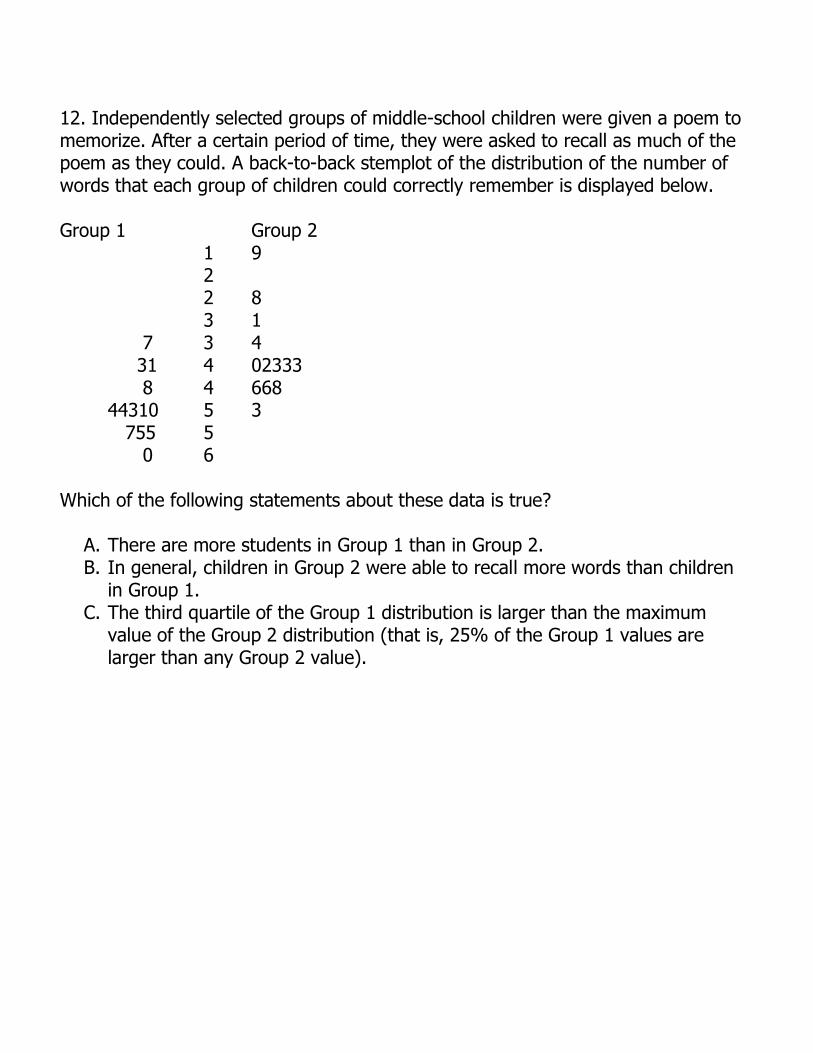
12. Independently selected groups of middle-school children were given a poem to memorize. After a certain period of time, they were asked to recall as much of the poem as they could. A back-to-back stemplot of the distribution of the number of words that each group of children could correctly remember is displayed below. Group 1 Group 2 1 9 2 2 8 3 1 7 3 4 31 4 02333 8 4 668 44310 5 3 755 5 0 6 Which of the following statements about these data is true?
A. There are more students in Group 1 than in Group 2. B. In general, children in Group 2 were able to recall more words than children
in Group 1. C. The third quartile of the Group 1 distribution is larger than the maximum
value of the Group 2 distribution (that is, 25% of the Group 1 values are larger than any Group 2 value).
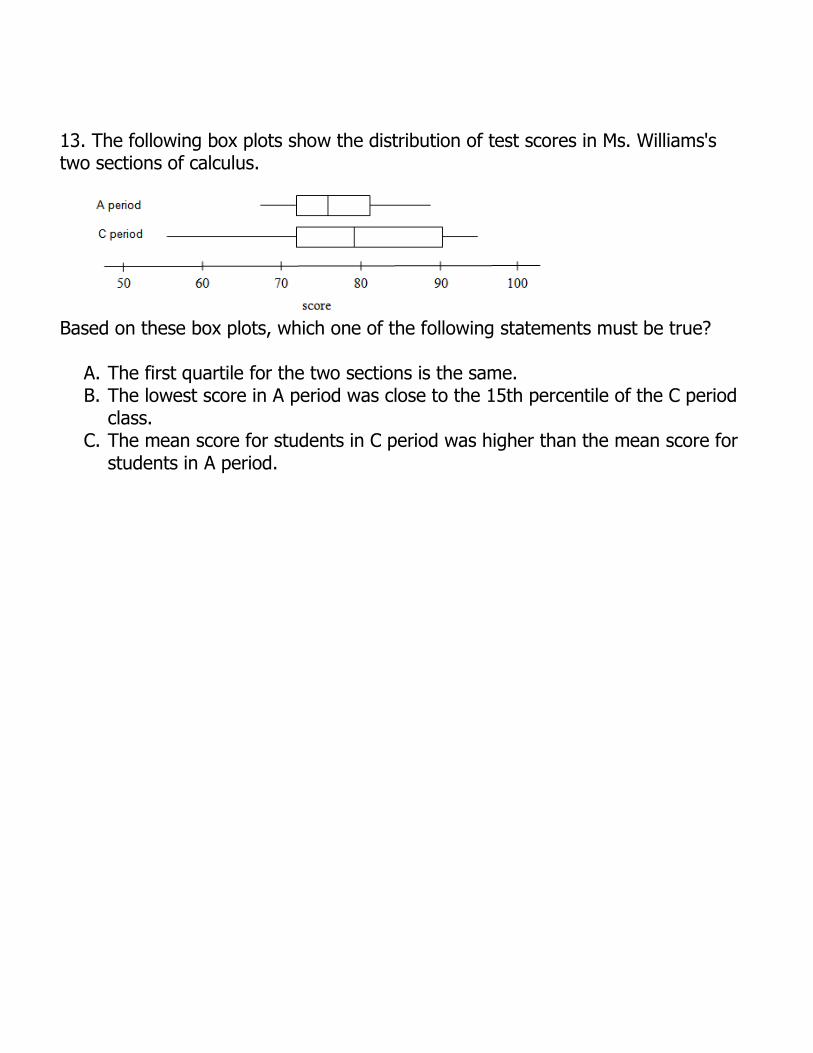
13. The following box plots show the distribution of test scores in Ms. Williams's two sections of calculus.
Based on these box plots, which one of the following statements must be true?
A. The first quartile for the two sections is the same. B. The lowest score in A period was close to the 15th percentile of the C period
class. C. The mean score for students in C period was higher than the mean score for
students in A period.
14. In which of the following situations would a pie chart be an appropriate graph to use to summarize your data?
A. You want to display the distribution of favorite color for the students in your statistics class.
B. You want to compare the percentages of students in each grade at your school who favor a certain candidate for school president.
C. You want to compare the life expectancies of different professions by displaying and comparing graphs of ages at death for random samples of famous scientists, authors, actors, and politicians.
15. The owner of a convenience store keeps track of how many customer buy lunch food during the "noon rush" each day for four days and calculates that the mean number of customers for those four days is 52. How many customers must come in on the fifth day to make the five-day mean 54?
A. 54 B. 60 C. 62
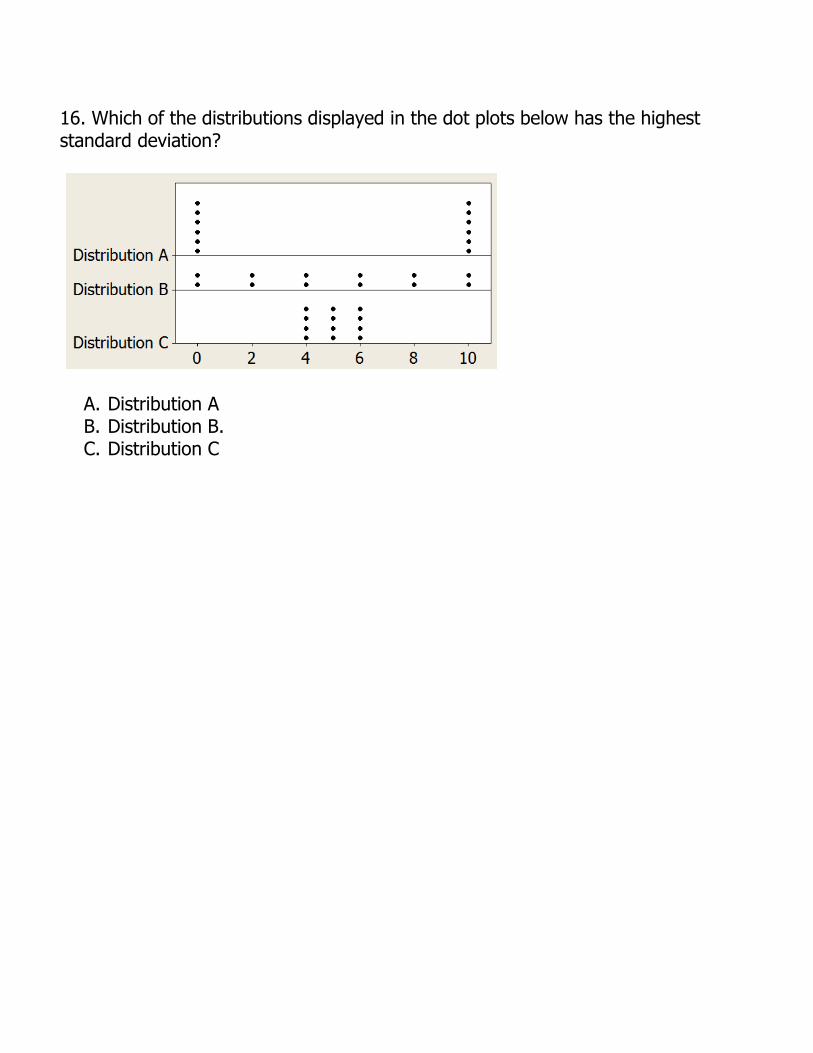
16. Which of the distributions displayed in the dot plots below has the highest standard deviation?
A. Distribution A B. Distribution B. C. Distribution C
17. According to the 1.5 × IQR rule, how many outliers are there in the data set 72, 110, 114, 115, 118, 123, 144, 156?
A. None. B. One. C. Two.
18. The histogram below shows the typical travel time to school (self-reported) for 50 high school students.
Which of the following statements is true about the mean and median of this distribution?
A. Mean > Median B. Mean < Median C. Mean = Median
19. Jerome's summer reading list has 8 books, and he is examining the number of pages in each book. After calculating the mean, median, standard deviation, and interquartile range, he realized that the longest book is actually 100 pages longer than he thought it was. Which of his measurements does he need to recalculate?
A. The mean, standard deviation, and interquartile range. B. The mean and standard deviation. C. Only the mean.
Chapter 2 Starnes, The Practice of Statistics, 5e Ch. 2 1. The cumulative relative frequency graph below describe the distribution of weights (in grams) of tomatoes grown in a laboratory experiment.
Which of the following weights is closest to the median of the distribution?
A. 120 grams. B. 140 grams. C. 170 grams.
2. For the density curve shown, which of the following statements is true?
A. The mean is larger than the median. B. The proportion of outcomes between 0.2 and 0.5 is equal to 0.3. C. The proportion of outcomes greater than 1.5 is equal to 0.25.
3. An office uses two brands of fluorescent light bulbs in its overhead light fixtures. From past experience, it is known that Brand A bulbs have a mean life length of 3000 hours and a standard deviation of 200 hours, while Brand B bulbs have a mean life length of 2700 hours and a standard deviation of 250 hours. Which bulb has a longer life relative to all bulbs of its brand, a Brand A bulb that lasts 3150 hours or a Brand B bulb that lasts 2850 hours?
A. The Brand A bulb has a longer life relative to its brand. B. The Brand B bulb has a longer life relative to its brand. C. The two bulbs have equally long lives.
4. Javier's school bus is always late. Below are data on how many minutes late the bus was for 15 days in February. 1 2 2 2 3 3 4 4 4 5 6 7 8 10 12 What is the 60th percentile of this distribution?
A. 9 B. 5 C. 3
5. The weights of cockroaches living in a university dormitory follow a Normal distribution with mean 80 grams and standard deviation 5 grams. The percentage of cockroaches having weights between 72 grams and 88 grams must be
A. less than 68%. B. between 68% and 95%. C. between 95% and 99.7%.
6. Scores on the American College Testing (ACT) college entrance exam follow a Normal distribution with mean 18 and standard deviation 6. Lisa's standardized score on the ACT was z = –0.7. What was her actual ACT score?
A. 4.2. B. 13.8. C. 22.2.
7. What is the 25th percentile of the standard Normal distribution?
A. 1.00 B. 0.5987 C. –0.67
8. The lifetime of a 2-volt battery in constant use has a Normal distribution with a mean of 516 hours and a standard deviation of 20 hours. The proportion of batteries with lifetimes that exceed 520 hours is approximately
A. 0.2000. B. 0.5793. C. 0.4207.
9. The lifetime of a 9-volt battery in constant use has an approximately Normal distribution with a mean of 516 hours and a standard deviation of 20 hours. Which of the following is the approximate lifetime of a battery that lasts longer than 90% of all batteries?
A. 541.6 hours B. 517.28 hours C. 490.4 hours
10. The lifetime of 9-volt battery in constant use has an approximately Normal distribution with a mean of 516 hours and a standard deviation of 20 hours. Which of the following best describes the distribution of standard scores for the lifetimes of such batteries?
A. Exactly Normal, with mean 0 and standard deviation 1. B. Approximately Normal, with mean 0 and standard deviation 1. C. Approximately Normal, with mean 1 and standard deviation 1.
11. Fuji apples grown at a certain orchard have a mean weight of 5.2 ounces with a standard deviation of 0.8 ounces. Suppose the scale the orchard owner uses systematically underweighs apples by 0.2 ounces and also weighs the apples in grams, rather than ounces. What would the mean and standard deviation of these apples' weights be as determined by this scale? (Note: 1 ounce 28 grams).
A. Mean 145.6 grams, standard deviation 0.8 grams. B. Mean 140 grams, standard deviation 22.4 grams. C. Mean 140 grams, standard deviation 16.8.
12. The graph below is a Normal probability plot of test scores for students in Mr. Olivier's precalculus classes. Based on this plot, which of the following is the best description of the shape of the distribution of test scores?
A. approximately Normal B. skewed to the left C. skewed to the right
Chapter 3 1. The following scatterplot describe the relationship between height (in cm) and foot length (also in cm) for 12 randomly selected students from the British Census @ Schools database. Which of the following is the best description of this relationship?
A. There is some random variation, but otherwise height is directly proportional to foot length.
B. There is a roughly linear relationship between height and foot length. C. There is a moderately weak, positive linear relationship between height and
foot length.
2. A sociologist is studying the relationship between early childhood nutrition and academic achievement in middle school among children in a certain city. Which of the following statements about the variable "early childhood nutrition" is correct?
A. Early childhood nutrition is a response variable. B. Early childhood nutrition is an explanatory variable. C. Since there is not a clear explanatory-response relationship in this scenario,
we cannot classify early childhood nutrition as either explanatory or response.
3. A sociologist studying the relationship between early childhood nutrition and academic achievement in middle school among children in a certain city finds that the correlation between these two variables is 0.86. Which of the following conclusions can he draw from this study?
A. Ensuring good nutrition in early childhood will increase academic achievement for middle school students.
B. Children in this city who have a healthy diet in early childhood tend to do better in middle school.
C. Since the correlation is so low, no conclusions can be drawn.
4. Which of the following quantities is minimized by the least-squares regression line?
A. The sum of the squared differences between observed values of the response variable and values of the response variable predicted by the model.
B. The sum of the squares of perpendicular distances between all data points and the regression line.
C. The sum of the squared differences between observed values of the explanatory variable and values of the explanatory variable predicted by the model.
5. Which of the following statements about the slope of the least-squares regression line is true?
A. It has the same sign as the correlation coefficient r. B. The square of the slope equals the proportion of the variation in the
response variable that is explained by the explanatory variable. C. It is unitless.
6. The points in the scatterplot represent paired observations (x, y) where x is an individual's weight and y is the time (in seconds) it takes for walking on a treadmill to raise the individual's pulse rate to 140 beats per minute. The open circles correspond to females and the dark squares to males.
From the scatterplot, which conclusion we can make?
A. There is a positive correlation r between gender and weight, since men tend to weigh more than women.
B. There is a negative correlation r between weight and time for both males and females.
C. In general, males tend to take less time to have their pulse rate raised to 140 bpm while walking on the treadmill.
7. One of the following is a correct statement involving correlation. The other two contain blunders. Which one is correct?
A. There is a correlation of r = 0.54 between the position a football player plays and his or her weight.
B. The correlation between amount of fertilizer and yield of tomatoes was found to ber = 0.33.
C. The correlation between the gas mileage of a car and its weight is r = -0.71 gallon-pounds.
8. A study showed that students who spend more time studying for statistics tests tend to achieve better scores on their tests. In fact, the number of hours studied turned out to explain 81% of the observed variation in test scores among the students who participated in the study. What is the value of the correlation between number of hours studied and test score?
A. r = 0.81 B. r = 0.656 C. r = 0.9
9. The following computer output describes the relationship between y = height (in cm) and x = foot length (also in cm) for 12 randomly selected students from the British Census @ Schools database. The scatterplot for this relationship show a roughly linear shape.
Which of the following is an equation of least-squares regression line for these data?
A. Height = 117.99 + 1.878 (Foot length) B. Foot length = 117.99 + 1.878 (Height) C. Height = 1.878 + 117.99 (Foot length)
10. The following computer output describes the relationship between y = height (in cm) and x = foot length (also in cm) for 12 randomly selected students from the British Census @ Schools database. The scatterplot for this relationship show a roughly linear shape.
Which of the following is the correct interpretation of the number s = 7.39858?
A. For each one-centimeter increase in foot length the model predicts an increase in height of 7.39858 centimeters.
B. If we use the regression equation to predict height from foot length, our predictions will be, on average, off by 7.39858 centimeters.
C. The typical difference between the height of a student and the mean student height is 7.39858.
11. Below is a residual plot for the regression of the number of employees of Microsoft Inc. on year for the years from 1976 to 1989. (Note that this is a residual plot, not a scatterplot!)
There is no observed value for the year 1983. If we were to use this regression to predicted the number of employees in 1983, which of the following is most likely to describe the accuracy of our prediction?
A. Too high B. Too low C. About right
12. Ms. Kreppel is interested in the relationship between her students' final exam scores and their scores on a pre-test they took at the beginning of the year. Below is a scatterplot showing this relationship for the 18 students in her class.
How would the slope of the least-squares regression line change if the individual whose point is circled were removed from the data set?
A. The slope would increase. B. The slope would decrease. C. The slope would be unchanged
13. Ms. Kreppel is interested in the relationship between her students' final exam scores and their scores on a pre-test they took at the beginning of the year. A scatterplot of the data for the 18 students in her class shows linear relationship for these variables. The equation of the least-squares regression line is Final Exam = 34.2 + 0.60 (Pre-test) Which of the following is a correct interpretation of the slope of this regression model?
A. For each one-unit increase in final exam score, the model predicts, on average, a 0.60 unit increase in pre-test score.
B. For each one-unit increase in pre-test score, the model predicts, on average, a 0.60 unit increase in exam score.
C. About 60% of the variation in exam score that is accounted for by the regression of exam score on pre-test score.
14. Ms. Kreppel is interested in the relationship between her students' final exam scores and their scores on a pre-test they took at the beginning of the year. A scatterplot of the data for the 18 students in her class shows linear relationship for these variables. The equation of the least-squares regression line is Final Exam = 34.2 + 0.60 (Pre-test). One student scored a 76 on the pre-test and an 82 on the final exam. Which of the following is that student's residual?
A. 2.2 B. –7.4 C. –2.2
15. A residual plot displays a "reverse fan" arrangement, with the spread of points about the line (residual = 0) gradually decreasing from left to right (that is, as x increases). Which statement would be a correct interpretation of this plot?
A. The original data display a nonlinear relationship (curved pattern of association).
B. Predictions using the regression line will be more reliable for small x than for large x.
C. Predictions using the regression line will be more reliable for large x than for small x.
Chapter 4 1. A high-school principal discovers a web site that invites students to "Rate Your Teacher" on a 5-point scale in several categories. He thinks this might help him decide who his best teachers are, but the school's statistics teacher tells him to ignore any information from the site. Why?
A. The principal really should conduct an experiment to gather information on his teachers.
B. Only students with particularly strong opinions—and most likely, negative opinions—are likely to take the trouble to evaluate teachers on the site.
C. Using a 5-point scale does not provide accurate enough information.
2. Researchers in Britain randomly divided a large number of premature babies into three groups. One received donated breast milk, one received infant formula made for premature babies, and the third received regular infant formula. Each diet was used for one month as a sole food or as a supplement to mother's milk. Sixteen years later, the children returned and had their blood pressure measured. It was found that diastolic and systolic blood pressure both tended to be lower in the children who were fed breast milk than in the children who were fed formula. This study is an example of
A. an experiment. B. an observational study. C. a census.
3. A researcher in early childhood education believes that kindergarten-age children are more receptive to help from a female teacher than from a male teacher. From a list of kindergarten teachers in the state, the researcher randomly samples four classes with male teachers and four classes with female teachers. The students in the classes are interviewed, and a measure of how receptive the students in each class are to help from the teacher is determined. This study is an example of
A. an experiment. B. an observational study. C. a census.
4. A study involving women aged 50 to 75 randomly assigned equal numbers of women to an exercise program (at least 45 minutes of moderate walking or riding an exercise bike five times a week) and to a stretching program (15 to 30 minutes of stretching three times a week, under the supervision of an exercise physiologist). It was found that a higher percentage of women in the exercise group reported improved sleep than did women in the stretching group. This study is an example of
A. an experiment, but not a double-blind experiment. B. a double-blind experiment. C. a matched-pairs experiment.
5. An agricultural scientist wants to compare the effect on yield of three different methods of growing blueberries. To control for variables such as soil condition and location, he plants 30 plots on each of six different farms. On each farm, 10 of the 30 plots are assigned to each of the three treatments (growing methods). She measures and compares the marketable yield of blueberries produced by each plot. Which of the following best describes the design of this experiment?
A. a completely randomized design with three treatments B. a randomized block design with six blocks and three treatments C. a randomized block design with three blocks and six treatments
6. Which of the following best describes the purpose of replication in an experimental design?
A. Reducing the impact of variables other than the treatment variable. B. Repeating an experiment several times to see if results are similar. C. Using many subjects to reduce the impact of variation arising from random
assignment.
7. A biologist is studying the effect of different nutrients and different levels of salinity (salt) in water on the growth of a certain species of fish. Ten fish are to be assigned at random to each of 12 similar tanks in a controlled environment. The biologist wants to use combinations of 2 different nutrients and 3 different salinity levels as treatments. In this experimental design, how many factors and treatments are there?
A. Two factors and 12 treatments B. Two factors and 6 treatments C. Six factors and 2 treatments
8. You want to know the opinions of American high-school teachers on the issue of establishing a national proficiency test as a prerequisite for graduation from high school. You obtain a list of all high-school teachers belonging to the National Education Association (the country's largest teachers' union) and mail a survey to a random sample of 2500 teachers. In all, 1347 of the teachers return the survey. Which of the following statements about this situation is true?
A. Since you took a simple random sample, it is appropriate to draw conclusions on the basis of the teachers who responded.
B. To compensate for the teachers who didn't respond to the first survey, you can take an additional random sample of 2500 different teachers and combine the results of the two surveys.
C. To reduce bias, you should make an effort to contact and survey the 1153 teachers who did not respond to the first mailing.
9. A sociologist wants to study the attitudes of American male college students toward marriage. She gives a questionnaire to 25 of the men enrolled in Sociology 101 at her college. All 25 men complete and return the questionnaire. Which of the following is the sample in this situation?
A. American male college students. B. The 25 men who received and returned the questionnaire. C. All male students enrolled in Sociology 101 at this college.
10. A researcher is interested in the cholesterol levels of adults in the city she lives in. A cholesterol-screening program is set up in the downtown area during the lunch hour. Individuals can walk in and have their cholesterol measured for no charge. In one lunch hour, 173 people use the service, and their average cholesterol level is 217.8. The sample obtained here is an example of
A. a simple random sample, since the experimenter did not know beforehand which individuals would come to the screening.
B. a stratified random sample of high- and low-cholesterol individuals. C. a convenience sample.
11. You would like to compare the level of mathematical knowledge among 15-year-olds in the United States and Japan. To do this, you plan to give a mathematics achievement test to random samples of 1000 15-year-olds in each of the two countries. To ensure that the samples will include individuals from all different socioeconomic groups and educational backgrounds, you will randomly select 200 students from low-income families, 400 students from middle-income families, and 400 students from high-income families in each country. The sampling procedure being used here is
A. simple random sampling. B. voluntary response sampling. C. stratified sampling.
12. A poll of American adults' opinions about efforts to reform Social Security was conducted in 2004–2005 by the AARP, the nation's largest organization for retired people. The poll results were criticized in some quarters because they included no respondents under the age of 30, even though voters aged 18 to 29 made up 17% of the 2004 electorate. By contrast, respondents aged 60 and above made up 34% of the sample but were only 24% of the electorate. This poll is most likely subject to which of the following types of bias?
A. undercoverage B. nonresponse C. response bias
13. Many people believe that taking zinc lozenges reduces the severity and duration of the common cold. Sebastien decides to conduct a study at his school to explore this claim. He sends a survey to a simple random sample of 100 students, asking them to if they took zinc lozenges or not during their last cold, and how long they experienced cold symptoms. He found that students who took zinc had a mean cold duration that was 1.2 days lower than those who did not take zinc. Which of the following statements about his study is true?
A. Because he took a random sample, Sebastien can conclude that zinc lozenges caused the reduction in cold symptoms.
B. Because he only surveyed 100 students at his school, he can only draw conclusions about those 100 students.
C. Sebastien's study is subject to confounding.
14. Which of the following is a legitimate method for taking a simple random sample of size 50 from a population of 1000 people?
A. List the people alphabetically by last name. Starting with the first person on the list, flip a coin. If the coin comes up "heads," that person is in the sample. Repeat this process with each person on the list until you have sampled 50 people.
B. Write the names of the 1000 people on slips of paper. Put the slips of paper in a (large!) hat and draw out 50 slips.
C. List the people alphabetically by last name. Choose a single random number between 1 and 50 using randInt(1,20) on a calculator. If, for example, that number is 16, choose the 50 people on the list in the following positions: 16, 36, 56, 76, . . .976, 996.
15. To examine how people respond emotionally to social media, a social scientist asks for volunteers at a local high school to fill out a survey. The survey asks how much time the subjects spent on Facebook, Twitter, and Tumblr in the last 48 hours, and then asks a series of questions that assess the subjects' levels of satisfaction with their lives at the present time. The scientist divides the subjects up into "high social media use" and "low social media" use and then compares the satisfaction ratings of the two groups. Which of the following statements is true about this study?
A. We can established whether there is a relationship between social media use and satisfaction among students at this school, but we can't establish cause and effect.
B. We can determine whether social media influences satisfaction, but we can't generalize beyond the subjects of this study.
C. We cannot determine whether social media influences satisfaction, nor can we generalize our findings to the entire school.
Chapter 5 Questions 1 and 2 refer to the following situation. The class of 1968 and 1998 held a joint reunion in 2008 at the local high school. Attendees were asked to complete a survey to determine what they did after graduation. Here is the information obtained.
1. What is the probability that a randomly selected attendee graduated in 1998 and went into the military?
a. 0.072 b. 0.127 c. 0.303 d. 0.596 e. 0.669
Questions 1 and 2 refer to the following situation. The class of 1968 and 1998 held a joint reunion in 2008 at the local high school. Attendees were asked to complete a survey to determine what they did after graduation. Here is the information obtained.
2. What is the probability that a randomly selected 1968 graduate went to college after graduation?
a. 0.245 b. 0.253 c. 0.560 d. 0.592 e. 0.755
3. A fair die is rolled 3 times. The first 2 rolls resulted in 2 fives. What is the probability of not rolling 5 on the next roll?
4. In a game, a spinner with five equal-sized spaces is labeled from A to E. If a player spins an A they win 15 points. If any other letter is spun the player loses 4 points. What is the expected gain or loss from playing 40 games?
a. Gain of 360 points b. Gain of 55 points c. Gain of 8 points d. Loss of 1 point e. Loss of 8 points
5. Let X be a random variable whose distribution is normal with mean 30 and standard deviation 4. Which of the following is equivalent to P(X ≥ 26)?
6. The distribution of heights of male high school students has a mean of 68 inches and variance of 1.52 square inches. The distribution of female high school students has a mean of 66 inches and a variance of 1.64 square inches. If the heights of the male and female students are independent, what is the standard deviation of the difference in their heights?
7. If and P(A) = 0.34 and P(A or B) = 0.71, which of the following is false?
8. In a litter of eight puppies, 5 are female. 2 of the puppies are picked at random. Which of the following is true?
9. Homes built in the suburbs typically have none to three-car garages. Let X be the number of garage stalls per home found in a sample of 200 homes in a local suburban area. From the data obtained, P(X = 0) = 0.06, P(X = 1) = 0.45 and P(X = 2) = 0.32. Find the mean number of garage stalls per home for the sample of homes.
10. The probability that a randomly chosen American is a Republican is 0.35. What is the probability that in a sample of 10 Americans, that at least 1 will be a Republican?
11. Anna and Paulina are playing video games. Anna has a 60% chance of winning the first game that they play, but this grows to 70% for winning the second game in a row. If Anna loses the first game, she only has a 30% chance of winning the second game.
What is the probability that they each win one of two games played?
12. Anna and Paulina are playing video games. Anna has a 60% chance of winning the first game that they play, but this grows to 70% for winning the second game in a row. If Anna loses the first game, she only has a 30% chance of winning the second game. What is the mean and standard deviation of the number of games Anna wins?
13. A survey at a local college asked a random sample of faculty and a random sample of students the color of the car that they would like to drive. The results are given in the table.
If a person is chosen at random from all those surveyed, what is the probability that they would like a black car?
14. A survey at a local college asked a random sample of faculty and a random sample of students the color of the car that they would like to drive. The results are given in the table.
If the person chosen at random is a faculty member, what is the probability that they would prefer a black car? Show your work.
15. A survey at a local college asked a random sample of faculty and a random sample of students the color of the car that they would like to drive. The results are given in the table.
Based on your answers in the last two questions, is car color choice independent of college role (faculty, student) for those in this sample?