61
Chapter 1 1
| Date post: | 24-Dec-2015 |
| Category: |
Documents |
| Upload: | kelley-stevenson |
| View: | 220 times |
| Download: | 2 times |
Chapter 1
1
Definition of Economics
It is the study of wealth (Adam smith) Or
It is the study of welfare (Pegout)Or it isA study of exchange and production
2

The standard definition
"Economics is the social science which examines how people choose to use its limited or scarce resources in attempting to satisfy their unlimited wants
3
Branches of Economics
Economics is usually divided into two main branches
1. Microeconomics2. Macroeconomics
4

Microeconomics
which examines the economic behaviour of individual actors such as businesses, households, and individuals, with a view to understand decision making in the face of scarcity and the allocation consequences of these decisions.
5

Macroeconomics
which examines an economy as a whole with a view to understanding the interaction between economic aggregates such as national income, employment and inflation.
6

Other topics includes international economics, labour economics,
welfare economics, information economics, resource economics, environmental economics, managerial economics, financial economics, urban economics, development economics, and economic geography.
7
Why we study economics Hope to make money. Understand the laws of demand and supply. To be fully informed about the international trade. To study the tradeoff between inflation and unemployment. To help you invest your saving. To know how to make economic decision.
8

Scarcity and Choice
Scarcity means that people want more than is available. Scarcity limits us both as individuals and as a society.
As individuals, limited income (and time and ability) prevent us from doing and having all that we might like.
9

Scarcity for society
As a society, limited resources (such as manpower, machinery, and natural resources) fix a maximum on the amount of goods and services that can be produced
10

Scarcity requires choicePeople must choose which of their desires they will
satisfy and which they will leave unsatisfied.
When we, either as individuals or as a society, choose more of something, scarcity forces us to take less of something else.
11

The logic of economicsHow do economic go about the complex
understanding of the economic activities.
The following are the some of the
common fallacies “ أخطاء encountered in economic reasoning ”شائعة“logic”:

The post hoc fallacy This involves the inference of causality “ استنتاج
The post hoc fallacy occurs when we .“السببيةassume the previous event cause the later one, which is not necessary correct assumption.

The failure of holding other things constant
Remember to hold other things constant when you are analyzing the impact of one variable on the economic system.
e.g. the effect of tax rate on tax revenue.

The fallacy of composition Some times we assume that what holds true for part of a system also
holds true for a whole.
When you assume that what is true for the part is also true for a whole, you are committing the fallacy of composition.
e.g. Since Becky plays basketball well, therefore the other members of her team must also play basketball well. This statement is an example of the fallacy of composition

The three problems of economics
What commodities are produced and what quantities?
How are goods produced?For whom are goods produced?
What commodities are produced and what quantities?
The society have to decide and determine how much of each goods will make and when they will be produced ?
Will we produce pizzas or shirts today ?
Or will we produce fewer consumer goods and more investment goods ?

How are goods produced?The society have to determine who will produce with what
resources and what techniques they will use.
Who farms and who teaches?
Is electricity generated from oil, or from the sun?
Will factories be run by people or robots?
Will we use the labor intensive or capital intensive technique?
For whom are goods produced?Who gets to eat the fruits of economic activates?
Is the distribution of income and wealth is fair and equitable?
How is the national product divided among different household?
Are many people poor and few rich?
Do high wages go to teachers or farmers?

The distribution systemWe have different distribution systems.
We have market, command, mixed and Islamic economy.
2121
Positive and Normative Economics
This is to study
what is for positive economics or what ought to be for normative

Positive economics
Positive economics studies economic behavior without making judgments “ إصدار It describes what exists and how it .”أحكامworks.

Positive economics includes:Descriptive economics, which involves the collection of data that describe phenomena and facts.
Economic theory, which involves building models of behavior.An economic theory is a general
statement of cause and effect, action and reaction.

Normative economicsNormative economics, also called policy
economics, analyzes outcomes of economic behavior, evaluates them as good or bad, and may prescribe courses of action.

Each economy has a stock of limited resources (labor, technological knowledge, factories and tools, capital, materials, land, energy)
Each economy has to decide how to allocate his resources among the different possible commodities.
Land for producing wheat or housing the population.
Society’s technological possibilities

Inputs and outputsInputs are the resources available for the society.
Another terms for inputs are factors of productions.
Factors of Production are land, labor, capital and management.

landOr more generally natural resources that
represents the gift of nature to our productive process.
It includes the land it self, the energy resources that fuel our cars & heat our homes, non-energy resources like copper, iron and sand, the environmental resources, such as clean air and drinkable water.

laborIncludes the human time spend in production at
all skill levels.Includes also human time spend in management.
capital
Capital resources from the durable goods of an economy.
Capital goods include machines, roads, trucks.

ManagementWe might consider it as a part of the labor
or as a fourth factor of production.

The Production Possibility Frontier (PPF)
The production possibility frontier (ppf) is a graph that shows all of the combinations of goods and services that can be produced if all of society’s resources are used efficiently.

Alternative Production possibilities
PossibilitiesComputers
(Thousands)
Tomatoes
(Tons)
Opportunity Cost
A015-
B1141
C2122
D393
E454
F505

The Production Possibility Frontier
The production possibility frontier curve has a negative slope, which indicates a trade-off between producing one good or another.
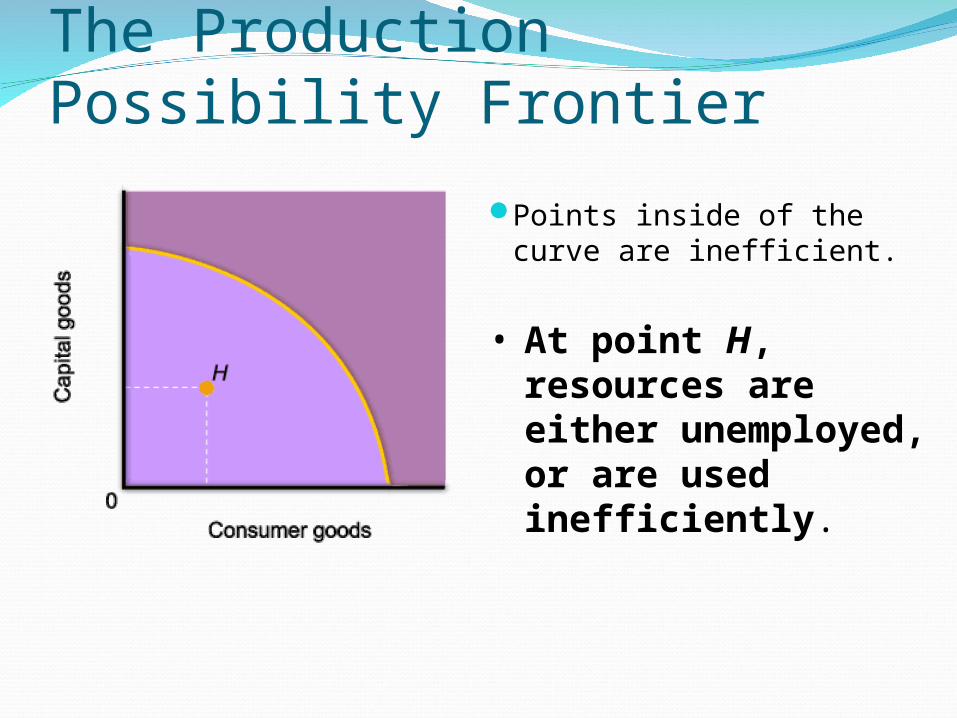
The Production Possibility Frontier
Points inside of the curve are inefficient.
• At point H, resources are either unemployed, or are used inefficiently.

The Production Possibility Frontier
Point F is desirable because it yields more of both goods, but it is not attainable
given the amount of resources available in the economy.

The Production Possibility Frontier
Point C is one of the possible combinations of goods produced when resources are fully and efficiently employed.

The Production Possibility Frontier
A move along the curve illustrates the concept of opportunity cost.
From point D, an increase the production of capital goods requires a decrease in the amount of consumer goods.
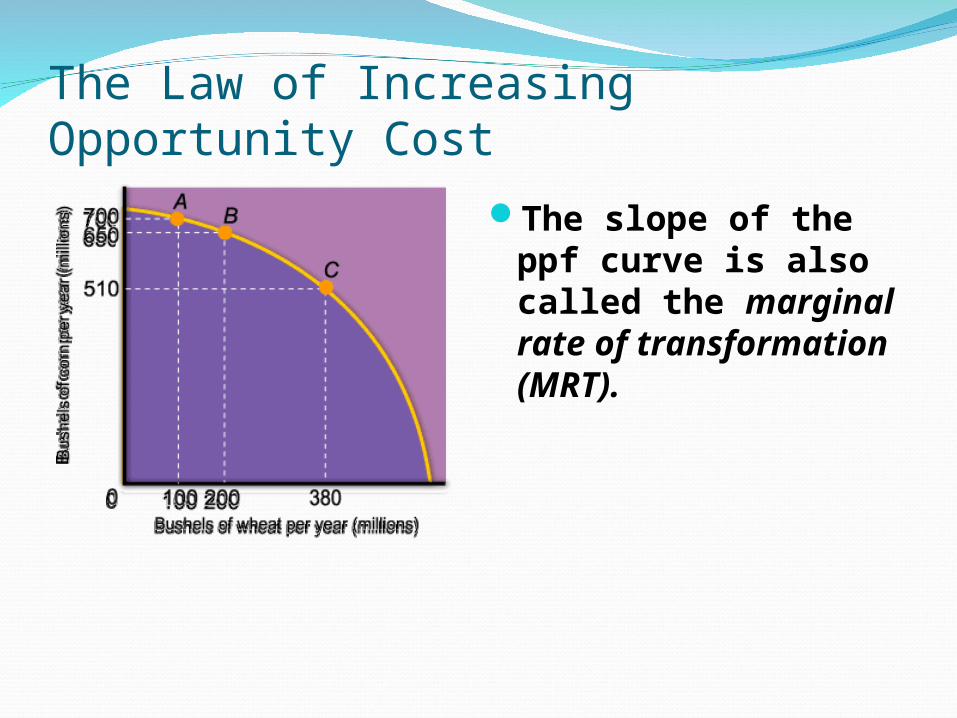
The Law of Increasing Opportunity CostThe slope of the ppf
curve is also called the marginal rate of transformation (MRT).
the law of increasing opportunity costThe negative slope of the ppf curve reflects
the law of increasing opportunity cost. As we As we increase the production of one good, we increase the production of one good, we sacrifice progressively more of the other.sacrifice progressively more of the other.

Scarcity, Choice, and Opportunity CostHuman wants are unlimited, but resources are not.
Three basic questions must be answered in order to understand an economic system:
What gets produced?How is it produced?Who gets what is produced?

Scarcity, Choice, and Opport. Cost

Every society has some system or mechanism that transforms that society’s scarce resources into useful goods and services.

Scarcity, Choice, and Opportunity Cost
Capital refers to the things that are themselves produced and then used to produce other goods and services.
The basic resources that are available to a society are factors of production:
LandLaborCapital

Scarcity, Choice, and Opportunity CostProduction is the process that transforms
scarce resources into useful goods and services.
Resources or factors of production are the inputs into the process of production; goods and services of value to households are the outputs of the process of production.

Scarcity and Choice in a One-Person Economy
Nearly all the basic decisions that characterize complex economies must also be made in a single-person economy.
Constrained choice and scarcity are the basic concepts that apply to every society.

Opportunity cost is that which we give up or forgo, when we make a decision or a choice.
Scarcity and Choice in a One-Person Economy

EfficiencyEfficiency means that the economy’s
resources are being used as efficiently as possible to satisfy people’s needs and desires.
Productive efficiencyProductive efficiency occurs when an
economy cannot produce more of one good without producing less of another good.
This implies that the economy is on its production possibility frontier.

Collection of economic data
Economic data includes quantitative and qualitative data.
Quantitative data includes the numeric or measurable data.
i.e. prices, quantities, profit, product, cost, and so on.
Qualitative data, includes descriptive data such as, quality.
49

Primary and secondary dataWe collect primary economic data through
questionnaires, meetings, focus group, and so on.
And we collect the secondary data through books, magazines, the net, and the Palestinian bureau of statistics.
Models
Formulation of models of economic relationships, for example, the relationship between the general level of prices and the general level of employment
51

Statistics
Taking economic statistics of production and applying the data collected, and applying the model being used to produce a representation of economic activity
52

53 of 33
How to Read and Understand Graphs
A graph is a two-dimensional representation of a set of numbers or data.

54 of 33
A time series graph shows how a single variable changes over time.
Total Disposable Personal Income in the United States: 1975-2002 (in billions of dollars)
100015002000250030003500400045005000550060006500700075008000
1975 1980 1985 1990 1995 2000
Year
To
tal d
isp
osa
ble
per
son
al in
com
e
How to Read and Understand Graphs
55 of 33
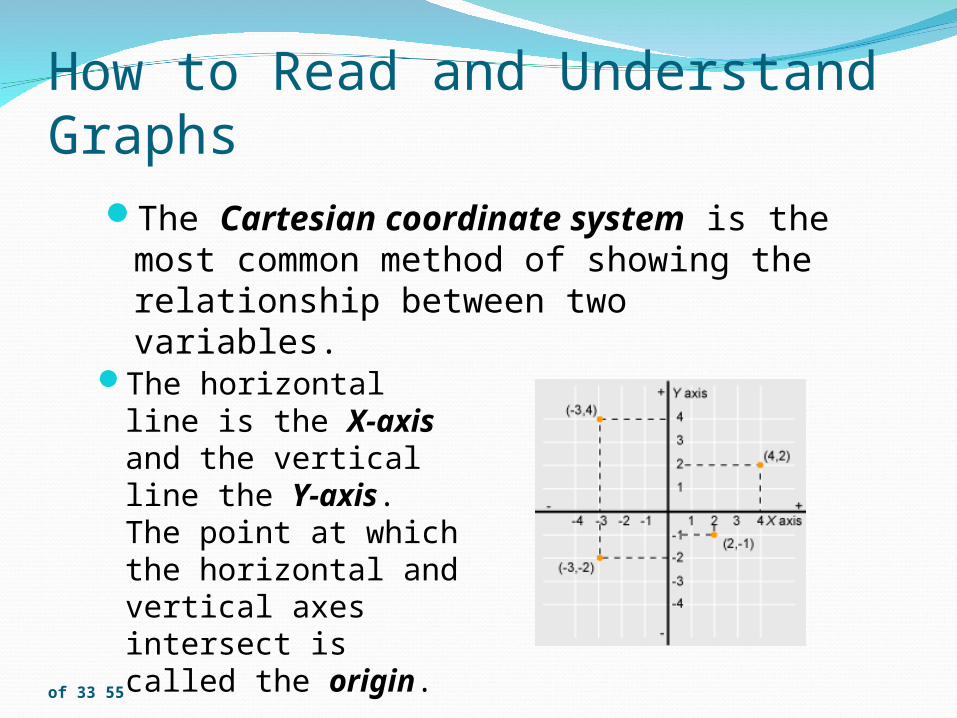
How to Read and Understand GraphsThe Cartesian coordinate system is
the most common method of showing the relationship between two variables.
The horizontal line is the X-axis and the vertical line the Y-axis. The point at which the horizontal and vertical axes intersect is called the origin.

56 of 33
•The point at which the line The point at which the line intersects the Y-axis (point intersects the Y-axis (point aa) ) is called the is called the Y-interceptY-intercept..
• TheThe Y-intercept Y-intercept, is the value of , is the value of YY when when XX = 0. = 0.

57 of 33
• The The slopeslope of the line of the line indicates whether the indicates whether the relationship between the relationship between the variables is positive or variables is positive or negative.negative.
• The slope of the line is The slope of the line is computed as follows:computed as follows:
b =Y
X
Y Y
X X
1 0
1 0
58 of 33
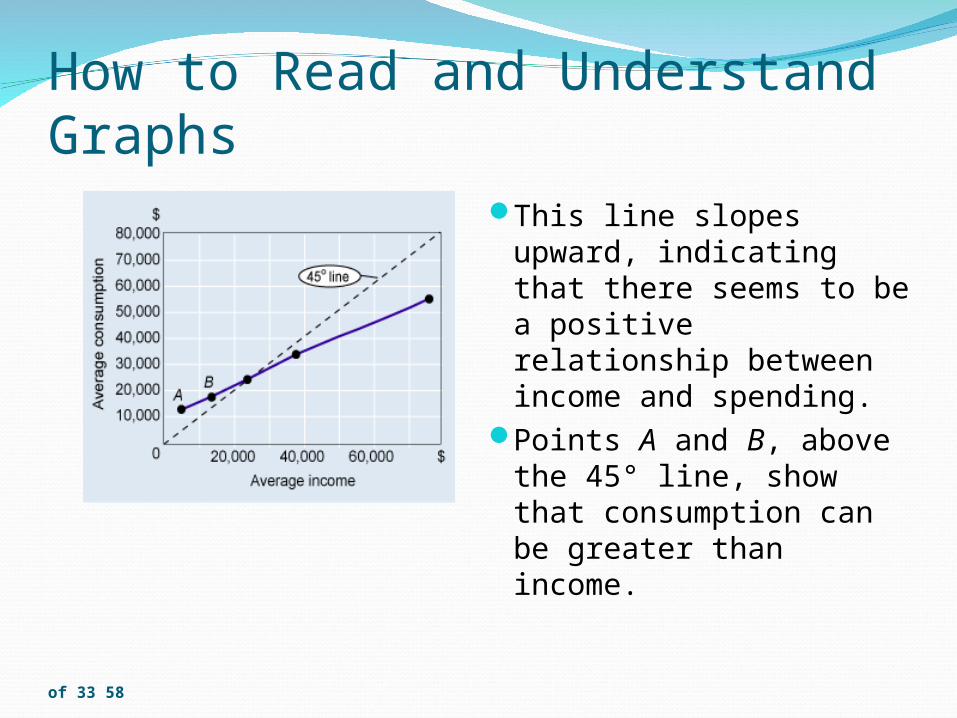
This line slopes upward, indicating that there seems to be a positive relationship between income and spending.
Points A and B, above the 45° line, show that consumption can be greater than income.
How to Read and Understand Graphs
59 of 33
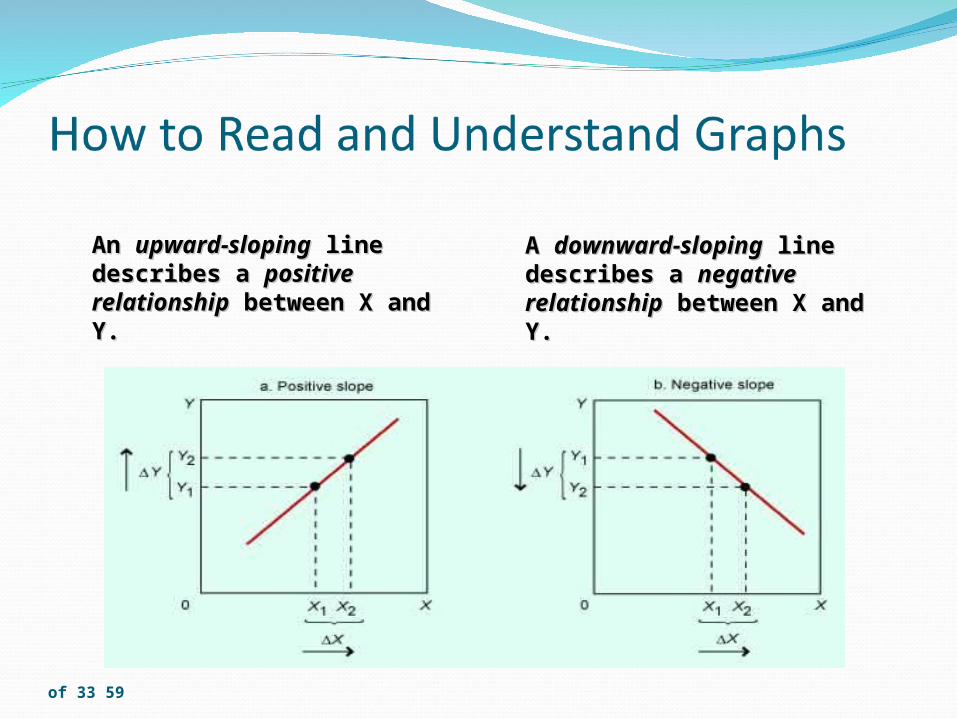
A A downward-slopingdownward-sloping line line describes a describes a negative negative relationshiprelationship between X and Y. between X and Y.
An An upward-slopingupward-sloping line line describes a describes a positive positive relationshiprelationship between X and between X and Y.Y.
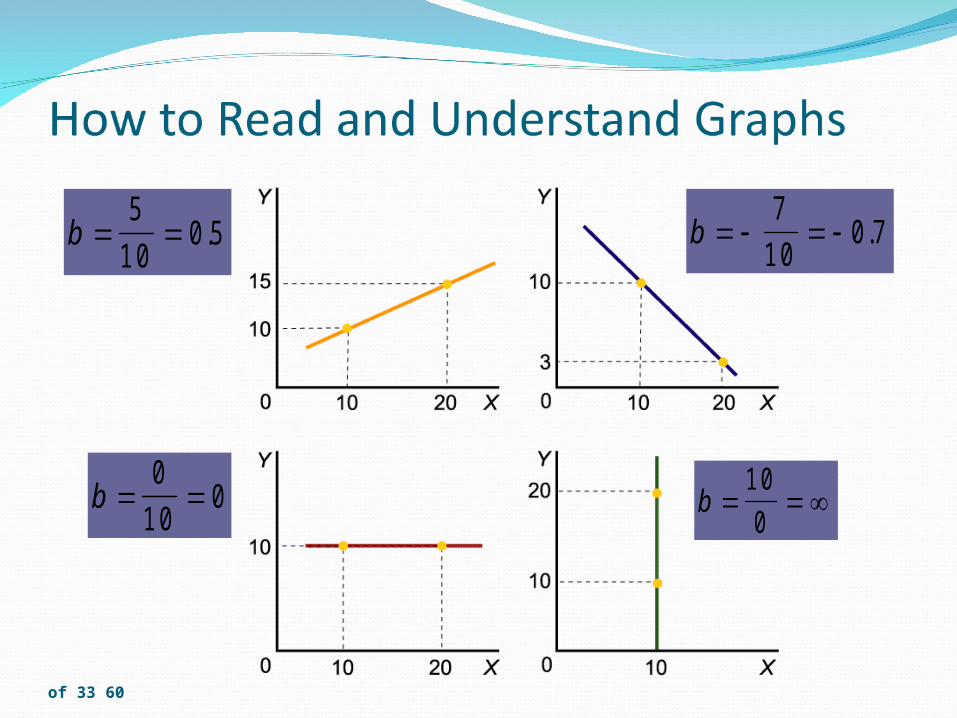
60 of 33
b 5
1 00 5. b
7
1 00 7.
b 0
1 00 b
1 0
0

61 of 33


