Page 1
1
CHAPTER 1
1.0 INTRODUCTION
1.1 Banana
Banana is a monocotyledonous, perennial herb within the order Zingiberales, and
the family Musaceae. The Musaceae is divided into two genera: Musa and Ensete.
Musa consist of about 40 species and is distributed through India, New Guinea,
Australia and Southeast Asia (Simmonds, 1962). The Musa genus is grouped into four
sections: Eumusa, Callimusa, Rhodochlamys and Australimusa. Eumusa is the most
widespread and contains the greatest number of species and forms, for it includes all the
edible seedless bananas. Almost all cultivars of the edible banana are now classified
under two species M. acuminata (AA) and M. balbisiana (BB), both belonging to
Eumusa section. According to Simmonds (1962) most cultivated bananas were derived
from natural hybridization between two diploid species M. acuminata and M.
balbisiana. Musa acuminata surpasses Musa balbisiana in variability and in diversity of
species, and at least nine sub species have been described (ssp.malaccensis, ssp.
microcarpa, ssp.burmannica, ssp. burmannicoide, ssp. siamea, ssp. banksii, ssp. errans,
ssp. zebrine and ssp. truncate (De Langhe, 1969), whereas Musa balbisiana is less
diverse with no subspecies recognized. Most of edible types that are derived from these
species are triploid, although diploid (AB) and Tetraploid (ABBB) cultivars are also
known.
Page 2
2
Essentially hybridization between various subspecies of polymorphic species
M. acuminata led to a range of diploid cultivars. Diploid AAs then gave rise to tripliod
AAA types. Hybridization between M.acuminata (AA) and M.balbisiana (BB) gave rise
to the various AAB and ABB types presently found. The majority of cultivated types
are triploid with AAAs providing many sweeter dessert cultivars whereas AABs and
ABBs often provide a starchier cooking type.
Musa acuminata is the most important species and wild seeded diploid forms
have their center of diversity in the Malaysian region where six of the nine subspecies
overlap namely, malaccensis, siamea, truncata, microcarpa, burmannica, and
burmannicoides. Four of these subspecies are reported from Malaysia only,
malaccensis, siamea, and truncate from peninsular Malaysia and microcarpa mainly
from East Malaysia (Borneo) (Simmonds, 1962). Therefore Malaysia is the most
important center of diversity for wild Musa acuminata forms. Among the four specific
forms, malaccensis is the most diverse and is the progenitor of the local AA cultivated
bananas (Simmonds, 1962).
1.2 Importance of Banana
Banana (Musa spp.) is one the world’s major food crops and widely grown in
developing countries (Roux et al., 2001; Madhulatha et al., 2004). Banana is a staple
food crop for millions of people, vital to food security and ranks in the world’s top four
food products (Roux et al., 2001). It also provides a valuable source of income through
local and international trade and contributes to the livelihood of maney people through
crop production, processing and marketing (Resmi and Nair, 2007). According to an
FAO report (2006), the total world banana export was 16.8 million tonnes with a value
of 5.8 billion US $ (Table 1.1). Banana is cultivated in more than 130 countries in the
Page 3
3
tropics and subtropics (Resmi and Nair, 2007), with a total production of 81.2 million
metric tones (Table1.2).
Table 1.1: Export quantity and value of banana (FAO, 2006).
Country Export quantity(tonnes) Export value(1000 US $)
World 167,890,32 5799147
Asia 25,846,23 478105
Africa 603,098 204945
Americas 11,461,948 3076245
Oceana 151,000 74
Europe 2,139,212 2039778
Table 1.2 : Harvested area, yield and production of banana (FAO, 2007).
Country Area
(ha)
Yield
(Hg/ha)
Production
(MT)
Word 4410509 184249 81,263,358
Asia 2096690 223445 46,849,643
Africa 1028270 77882 8,008,400
Americas 1190214 208273 24,788,970
Occeana 83595 144834 1,210,745
Europe 11470 345485 406,500
Page 4
4
Major banana cultivation is centered in three continents, Asia, Americas (mostly
south and Central America), and Africa. India, the largest producer of banana,
contributes 26% of world production (Martin et al., 2007). Banana is the second most
widely cultivated fruit after durian in Malaysia. According to an FAO report (2007),
the total production of banana in Malaysia was 530,000 metric tonnes. Most of the
cultivated areas in Malaysia grow Pisang Berangan and the Cavandish type, both for
local consumption and export. In 2006, banana export brought country 6.8 million USD
into the country (FAO, 2006).
1.3 Salinity and Effects on Plant
Salinity is considered a major environmental factor which has a limitative effect
on plant growth and productivity (Allakhverdiev et al., 2000; Liu et al., 2000;
Veeranagamallaiah et al., 2007) and is known to influence many physiological and
metabolic processes (Läuchli 1984; Olmos et al., 1994; Liu et al., 2000), such as
diminution in rate of leaf surface expansion, photosynthesis, protein synthesis, and
energy and lipid metabolism (Parida and Das, 2004) . It also affects crop production by
interfering with nitrogen uptake, reducing growth and stopping plant reproduction.
High salinity conditions result in hyperosmotic damage to most plants, and increased
Na+ concentrations disrupt cellular processes by interfering with vital Na
+ sensitive
enzymes and by affecting essential ion transport (Yoshida, 2002).
1.3.1 Salinity Management
Plants not only are important as the main source of food for humans and animals,
but also for a large number of non food products (Yoshida, 2002). Biotic stresses such
as pathogens and insects and abiotic stresses such as salinity, drought, heat and cold,
Page 5
5
chemical and oxidative stress threaten plant life and have potential devastating effects
on plant growth and productivity (Mahaja and Tuteja, 2005).
Global warming and climate change, quality and quantity of crop and fruit
production, progressive increasing of world population and destruction of arable land as
a result of development of cities reduces crop yield through the world. The real and
potential shortage of food against the specter of the growing population of the world
draws world-wide attention towards the necessity of development of stress tolerant
crops. According to a report by Flowers et al. (1997), about one-third of irrigated land is
considered to be affected by salinity and highlighted the critical situation and
importance of salinity management.
Salinity management strategies include several methods such as drainage,
replacement of plants that cannot tolerate saline conditions by tolerant species, using
plant breeding to generate more salt-tolerant crops and more recently a focus on the
potential of applying plant biotechnology and genetic engineering including using
technologies such as gene silencing via small RNAs to increase plant salt tolerance.
Drainage is one approach to reduce the movement of salt to the root zone and
control salinity but is not always practiced due to its cost and efficiency (Makin and
Goldsmith, 1988). Plant breeding is another strategy that can be useful tool for
generating more salt-tolerant crops but until now attempts of breeders have been largely
without success. More recently, biotechnology approaches have been used successfully
to create transgenic salt-tolerant plants. The possibility of gene manipulation in plants to
improve its tolerance to salt has opened up opportunities to use other novel genes in
Page 6
6
future studies. One such family of genes is microRNAs which are associated with gene
silencing.
1.4 MicroRNA
MicroRNAs belong to a family of non coding RNAs and were discovered by
two different research groups (Lee et al., 1993; Wightman et al., 1993) but they were
not recognized until 2001(Lau et al., 2001; Lee and Ambros, 2001). MicroRNAs are
small endogenous single stranded RNA of about 22 nucleotides with structural,
enzymatic and regulatory functions (Hannon, 2002; Ambros et al., 2003; Ambros, 2004;
Bartel, 2004) responsible for post-transcriptional gene silencing by the degradation or
translational inhibition of their target messenger RNAs (Ikeda et al., 2006). The
majority of miRNA genes exists as independent transcriptional units and is transcribed
by RNA polymerase II into long primary transcripts, called pri-miRNAs (Kim, 2005).
The pri-miRNAs can be quite long, more than one 1 kb and often have internal runs of
uridine residues, which would be expected to prematurely terminate pol III transcription
(Bartel, 2004), Then nuclear cleavage of the pri-miRNA is performed by Drosha RNase
III endonuclease in animals or Dicer in plants to release a 60-70 nt stem loop
intermediate, known as an miRNA precursor, or pre-miRNA (Lee et al., 2002; Bartel,
2004). Drosha cleaves both strands of the stem at sites near the base of the primary stem
loop and generates pre- miRNA stem loop with 5´phosphate and about 2-nt-3´ overhang
(Lee et al., 2003). Drosha does not exist in plants, but DCL1 (Dicer) has a nuclear
localization signal, suggesting it processes the pri-miRNA as well as the pre-miRNA
(Reinhart et al., 2002; Bartel, 2004; Kidner and Martienssen, 2005). The nuclear cut by
Drosha defines one end of the mature miRNA whereas the other end processed from
cytoplasmic cut by RNase III endonuclease Dicer (Lee et al., 2003). DICER or DICER-
like (in plants) enzymes cleave the double-stranded stem and releases miRNA/miRNA*
Page 7
7
duplex with 2-nt-3´overhang (Bartel and Bartel, 2003). One strand of the mature
miRNA, the guide strand (miRNA), subsequently becomes incorporated as single-
stranded RNAs into an RNA induced silencing complex (RISC), where it guides the
cleavage or translational repression of its target mRNA by base-pairing with the target
(Bartel, 2004; Berkhout and Haasnoot, 2006).
1.5 Goals and Objective of the Research
The main goal of this study was to identify microRNAs related to salt stress in the
banana plant (Musa acuminata ssp. malaccensis). The specific objectives of this project
were:
1. To determine the minimal inhibitory sodium chloride (NaCl) concentration for
survival of banana plantslets (Musa acuminata ssp. malaccensis).
2. To construct a small RNA cDNA library from salt-stressed banana plants at this
concentration.
3. To characterize miRNA potentially related to salt tolerance in banana.
Page 8
8
CHAPTER 2
2.0 LITERATURE REVIEW
2.1 Taxonomy of the Genus Musa
Simmonds (1962) classified the family Musaceae in the order Zingiberales.
Musaceae is divided to two genera Musa and Ensete.
2.1.1 Ensete
The genus Ensete geographical distribution is mostly in Africa but a few species
are also found in Asia from northeast India to the Philippines and New Guinea
(Purseglove, 1972). Plants of this genus are monocarpic, non-suckering with a distinctly
swollen base and they produce large-sized seeds (Samson, 1992).
2.1.2 Musa
The Genus Musa are perennial herbs which comprises 40 species and are
distributed mostly in southern Asia and the pacific (Simmonds, 1962). Generally leaves
in this genus are large, long and spirally arranged. The genus Musa is divided into
Eumusa, Rhodochlamys, Callimusa and Australimusa (Cheesman, 1974).
2.1.2.1. Eumusa
Eumusa is the largest section among other sections and has the widest
geographical distribution. The basic chromosome number is 2n = 22 and is
characterized by horizontal or drooping bunches, male axes and milky or watery juice
Page 9
9
(Stover and Simmonds, 1987). Musa acuminata is now classified in this section. Musa
acuminata Colla is a variable species with a wide geographical distribution from Burma
through Malaysia to New Guinea, Queensland, Samoa and Philippines (Simmonds,
1954). In addition the edible banana Musa AAA group were derived from Musa
acuminata Colla (Simmonds and Shepherd, 1955).
2.1.2.2 Rhodochlamys
The basic chromosome number is 2n = 22 in this section and characterized by
having an erect inflorescences, at least at the base, with fruit pointing towards the bunch
apex. Rhodochlamys mostly distributed in Northeast India, Bangladesh, Myanmar and
Thailand (Hakkinen and Sharrock, 2002).
2.1.2.3. Callimusa
The basic chromosome number is 2n = 20 in this section and mostly are
distributed in Indochina, Malaya and Borneo.
2.1.2.4. Australimusa
The basic chromosome number is 2n=20 in this section and they are distributed
from Queensland to Philippines. Australimusa cultivars differ from other cultivated
banana by the erect fruit bunches and the generally red juice (Stover and Simmonds,
1987).
2.1.3 General Morphology
The banana plant consists of stem or corm and inflorescence. The subterranean
stem or corm bears developing suckers, the root system, the pseudostem, the leaves
Page 10
10
whereas the inflorescence bears the flowers and subsequently the fruit. Suckers are tool
of vegetative propagation. The size of the corm is dependent on the size of the plant
and internally divides into two regions, a central cylinder and an apical protein (Skutch,
1932). The root system is confined mostly to the upper 40 cm soil because of good
correlations bunch weight and quantity of roots produced (Stover and Simmonds, 1987).
The adventitious root system which arises from the rhizome is replaced with the
primary seedling root, but in plants established from suckers the root system is
adventitious from first growth (Stover and Simmonds, 1987). The rhizome system is
sympodial like most rhizomatous monocotyledons (Holttum 1955). The leaf area is
large and consists of a sheath, a petiol and a blade. The inflorescence is a complex spike
with stout peduncles on which flowers are arranged in a nodal cluster in two rows on a
transverse cushion (crown), subtended by large spathe-like bracts that are nearly ovate
and usually purple-red in color.
2.1.4 Banana Tissue culture
The term ―plant tissue culture‖ is commonly used to describe the in vitro and
aseptic cultivation of any plant part on a nutrient medium. Most of the procedures used
currently are derived from an original technique that was demonstrated by White (1943,
1963). Cox et al. (1960) reported the successful embryo zygotic culture, which was the
earliest successful application of in vitro culture of Musa.
Page 11
11
The in vitro production of plants generally consists of three stages as described by
Murashige (1974)
(I) Establishment of the aseptic culture
(II) Multiplication of propagules
(III) Regeneration of plant for re-establishment in soil
Recently, tissue culture techniques are becoming increasingly popular as an
alternative means of plant propagation (Shah et al., 2009). The use of embryo rescue,
shoot-tip culture, protoplast culture, cell suspension culture and related cell culture
techniques have been used to overcome limitations in banana production and
multiplication.
2.1.5 Shoot–tip Meristem Culture and Multiplication
Among the tissue culture techniques introduced for banana improvement, only
shoot-tip meristem culture has been developed and applied widely (Novak, 1992).
Successful application of in-vitro shoot-tip culture of banana was reported in early 1970
from Taiwan (Ma and Shii, 1972, 1974). Hormones such as cytokinins have a vast
effect on banana micro propagation and multiplication so that many scientists in the
world have dedicated their research to this area.
In 1983, Cronauer and Krikorian reported the establishment of rapidly multiplying
culture from excised shoot tips of bananas. Philippine Lactan and Grande Naine were
two banana clones used for their experiments. They demonstrated that apices cultured
on semi-solid media formed a single shoot whilst apices placed in liquid media
produced clusters. Furthermore, to form multiple shoot clusters, individual shoots were
Page 12
12
longitudinally split through the apex. The results showed that 5 mg/L BAP significantly
stimulated shoot multiplication.
Arinaitwe et al. (2000) applied shoot-tips of banana (Musa spp.) for
micropropagation. The modified MS medium and three cultivars of banana, Bwara
(AAA-EA), Kibuzi (AAA-EA) and Ndiziwemiti were used. Different concentrations of
cytokinins including 6-benzylaminopurine (BAP), thidiazuron (TDZ), zeatin ZN,
isopentenyladenine (2iP) and kinetin (KN) were employed to determine the appropriate
cytokinin concentration range for banana cultivars micropropagation. They
demonstrated how cytokinin type, its concentration and also the banana cultivar
significantly influenced shoot proliferation, so that shoot proliferation was extensively
dependent on these factors. Cultivars had a better response to BAP compared to other
adenine-based cytokinins (ZN, KN and 2-iP). Also the TDZ has showed high cytokinin
activity, as low concentrations of TDZ (0.045, 0.23, 1, 14, 5.68, 6.81 and 9.1)
considerably increased proliferation rate of Ndiziwemiti (Arinaitwe et al,. 2000).
Proliferation rate of Ndiziwemiti was improved to 9.5 shoots per explant by
applying 9.1 mM of TDZ. The results showed an economical privilege of TDZ rather
than other adenine-based cytokinins due to greater shoot proliferation response of
cultivars to different TDZ concentrations(Arinaitwe et al,. 2000).
Gubbuk and Pekmezcu (2004) reported the use of three newly selected banana
types (Alanya 5, Anamur 10 and Bozyaz 14) to study the effects of different cytokinins
on shoot multiplication. Cytokinins such as BAP (5, 10, 20 and 30 µM) and TDZ (0.4,
1, 2 and 3 µM) were applied for the propagation stage. Similarly to determine the best
combination of cytokinin/auxin for propagation, BAP and TDZ were supplemented by 1
Page 13
13
µM IAA. The results revealed that there was better effect of TDZ on shoot proliferation
and elongation, compared to BAP in all the three banana types. In addition,
combinations of cytokinin with IAA increased shoot proliferation and elongation more
than when BAP was used alone. The concentrations of BAP below 20 µM or TDZ
below 1 µM did not show any increase in shoot proliferation, and concentrations of
BAP over 20 µM and TDZ over 2 µM suppressed shoot elongation.
Shoot meristems were used by Kalimuthu et al. (2007) for micropropagation of
Musa sapientum. MS medium supplemented with different concentrations of BAP and
0.2 mg/L NAA (Table 2.1).
Table 2.1 : Concentrations of BAP and NAA used by Kalimuthu et al. (2007) for
micropropagation.
BAP concentration 0.5
mg/L
1.0
mg/L
2.0
mg/L
3.0
mg/L
4.0
mg/L
5.0
mg/L
NAA concentration 0.2
mg/L
0.2
mg/L
0.2
mg/L
0.2
mg/L
0.2
mg/L
0.2
mg/L
Their results showed that the combination of 3.0 mg/L BAP and 0.2 mg/L NAA
the most suitable combination. Three sub-culturing (21 days each) carried out by
Kalimuthu et al. (2007) for further multiplication of shoots after establishment of
culture and initiation of shoot buds. They recorded an increasing multiplicationup to
rate to 3-fold during every sub-culture.
Page 14
14
In 2007, Sipen et al. conducted research to study the influence of different
concentrations of BAP and IAA combinations on banana shoot generation. Pisang
Nangka (AAA) which is one of the economically important Malaysian bananas was
used for the macropropagation. The maximum mean number (5.46±0.22) of shoots
produced per explant was achieved when 20 mg /L BAP was followed by 0.175 mg/L
IAA.
2.2 Salinity Effects on Agricultural Products
Salinity is a major abiotic stress affecting plant productivity worldwide and costs
million of dollars in lost yield and damaged infrastructure (Behdani et al., 2008; Meloni
et al., 2008). The effect of NaCl salinity on nitrogen and amino acid metabolism will
damage the value of foods in two different ways. In the first way, protein synthesis
might be influenced by NaCl salinity, thus amino acid metabolism will be enhanced in
general. Secondly, the nutritional value of the plant product might be reduced as a result
of NaCl salinity (Keutgen and Pawelzi, 2008). Due to the destructive effect of salinity
on crop plants in all aspects, many research groups in the world put an effort to find
effective way against salinity. So far lots of salinity related studies, as deccribed in the
following paraghraphs, have been done on plants such as Hordeum vulgare, Medicago,
rice, strawberry and tomato.
To study the effect of NaCl on banana cv. Nanicao (AAA), Ulisses et al. (2000)
treated buds grown in MS medium with different NaCl concentrations (0, 20,40, 60, 80,
100 and 120 mM). According to their study plant regeneration was greatly inhibited by
increasing of NaCl concentrations and 120 mM of NaCl was determined to be a lethal
concentration.
Page 15
15
The influence of salinity and sodicity on stigma receptivity and grain filling of
rice (Oryza sativa) under field conditions was studied by Khan and Abdullah (2003).
Their result, showed a significant reduction of pollen viabilities in all cultivars under
salinity and sodicity stress conditions. Also the starch synthase activity inhibition was
more significant in sensitive cultivars compared to tolerant cultivars.
Demural et al. (2005) studied the effects of salinity on malting barley (Hordeum
vulgare L). Two cultivars of Kaya and Scarlet and four parameters; growth, chemical
composition, superoxide dismutase and peroxidase activities were studied. The result
showed reduction in growth of both cultivars as a result of salinity. Compared to Kaya,
Scarlet was more efficient, in restricting access of Na+ and Cl
- into roots and conduction
to leaves. The peroxidase activities of cultivars decreased in saline condition, whereas
superoxide dismutase activity of leaves increased as a result of salinity.
In 2008 Behdani et al. conducted research to investigate the sensitivity of
morphological and physiological responses of Medicago polymorpha L. cv. Scimitar
and Trifolium michelianum L.cv. frontier to low levels of salinity. The results showed
an increment of sodium (Na+) and potassium (K
+) in both leaves and stems tissues when
the salt level was raised. The sodium content in leaves, less than 80 mM, was reported
to be threefold higher for Medicago polymorpha. However it was twofold higher for
Trifolium michelianum when compared with the control.
Vegetative and chemical changes of strawberries (Fragaria x ananssa L.) under
NaCl stress condition were studied by Yilmaz and Kina (2008) .Two cultivars of
strawberry (Kabarla and Gloria) and three different concentrations of NaCl (500, 1000
and 1500 mg/L) were used. The results showed, increment in salt concentrations
Page 16
16
restricted the vegetative growth of the plants and also influenced chlorophyll and
malondialdehyde levels. Moreover accumulation of Na+ in roots, crown and leaves of
the plant and ratios of K+/Na
+ and Ca
2+/Na
+ significantly affected salt tolerance ability
of the plants to saline conditions. The Kabarla cultivar which had a higher ratio of
K+/Na
+ and Ca
2+/Na
+ , showed more resistance to saline condition and better growth.
2.3 RNA
RNA or ribonucleic acid is a class of nucleic acids comprising a long chain of
nucleotides and characterized by the presence of the sugar ribose (deoxyribose in DNA)
and the organic base uracil (thymine in DNA). All types of RNA are transcribed from
DNA and are divided into two groups, coding and non-coding RNAs. RNAs are
generally involved in vital processes such as protein synthesis (e.g. mRNA, tRNA,
rRNA ), post-transcriptional modification or DNA replication (e.g. snRNA, snoRNA)
and gene regulation (e.g. miRNA, siRNA).
2.3.1 RNA Isolation
Isolation of intact, good-quality RNA is vital for further applications such as
RT-PCR, cDNA library construction, and gene expression studies. Generally extracting
high-quality RNA is tricky due to high levels of phenolics, polysaccharides, endogenous
RNases and other compounds that bind and/or co-percipitate with RNA (Azevedo et al.,
2003; Kansal et al., 2008). So far several conventional methods for RNA isolation have
been established and used.
Saghai-Maroof et al. 1984 used the CTAB method to extract DNA from
lyophilized tissue of barley. Later the CTAB method was modified and used for RNA
extraction (Kiefer et al., 2000). Chomczynski and Sacchi (1987) developed a single step
method for RNA isolation by acid guanidinium thiocyanate-phenol-chloroform
Page 17
17
extraction from animal tissue. Venugoplan and Kapoo (1997) modified the original
Chomczynski and Sacchi (1987) method and used this for total RNA extraction from
plant. Phenol/lithium chloride and guanidinium based methods are efficient methods for
herbaceous plants such as Arabidopsis, tomato, tobacco, potato and maize (Kansal et
al., 2008).
2.3.2 Non-coding RNAs
The term non-coding RNA (ncRNA) is commonly used for RNA that is not
translated into a protein. Cells contain various types of noncoding RNAs, comprising
components of the machinery of gene expression, such as tRNAs and rRNAs, and
regulatory RNAs that affect the expression of other genes (Ambros, 2001). Small
nucleolar RNAs (snoRNAs), microRNAs (miRNAs), small interfering RNAs (siRNAs)
and small double-stranded RNAs are classified as under regulatory RNAs and may be
processed from the introns and exons of longer primary transcripts including protein-
coding transcripts (Mattick and Makunin, 2005). RNAs with regulatory functions are
able to regulate gene expression at many levels of physiology and development
including chromatin architecture, RNA editing, RNA stability, transcription, RNA
splicing translation and turnover (Mattick and Makunin, 2005). Pol IV and Pol V, two
Pol II-related, plant-specific RNA polymerases collaborate with proteins of the RNA
interference machinery to generate long and short noncoding RNAs involved in
epigenetic regulation (Matzke et al., 2009).
RNA regulatory networks may determine most complex characteristics which
play a significant role in disease and constitute an unexplored world of genetic variation
both within and between species (Mattick and Makunin, 2006). Eukaryotic cells are rich
in non-coding RNAs, but only a limited number of trans-acting small ncRNAs were
Page 18
18
identified and described to regulate mRNA translation (Mattick and Makunin, 2006;
Wang et al., 2007).
According to Gottesman (2004) over 50 small RNAs, have been identified in
E. coli, that equals to 1%-2% of the number of protein-coding genes. Non-coding RNA
are responsible for roughly 98% of all transcriptional output in humans and other
mammals (Mattick, 2001). In recent years, the number of identified functional ncRNA
genes have considerably increased and over 800 ncRNAs including microRNAs and
snoRNAs, were described and listed in mammals (Pang et al., 2005). More than 1100
putative antisense ncRNAs and approximately 20,000 putative ncRNAs were identified
from murine and human cDNA libraries (Pang et al., 2005).
2.3.3 Small Nucleolar RNAs (snoRNAs)
Small nucleolar RNAs are a class of small RNA molecules which are transcribed
from introns of pre-mRNAs by RNA polymerase II (Kim et al., 2006), and guide the
site-specific modification of nucleotides in target RNAs (Mehler and Mattick, 2006).
They are known as the most abundant group of noncoding RNAs with 60-300
nucleotide in length, that combine with a set of proteins and form small nucleolar
ribonucleoprotein particles (snoRNPs) (Ganot et al., 1997).
Two major classes are defined for small nucleolar RNAs. One group holds the
box C (RUGAUGA) and D (CUGA) motifs, whilst the other group carry the box H
(ANANNA) and ACA elements (Kiss, 2002). Some small nucleolar RNAs are involved
in the nucleolytic processing of rRNAs but most of them function in 2´-O-ribose
methylation and pseudouridylation of rRNAs, small nuclear RNAs (snRNAs) and
perhaps other cellular RNAs, like mRNAs (Bachellerie et al., 2002; Kiss, 2002). Small
Page 19
19
nucleolar RNAs not only play an important role in modification of different RNAs, but
some also (snoRNAs U3, U8, U14, E1, E2 and E3) function in the cleavage of pre-
rRNAs (Grandi et al., 2002; Xie et al., 2007).
According to Mattick and Makunin (2005) there are more than 300 different
snoRNAs in humans and nearly 200 in mouse have been identified
(http://noncode.bioinfo.org.cn and http://www.sanger.ac.uk/Software/Rfam) (Mattick
and Makunin, 2005).
Chen et al. (2003), reported to have identified 120 different box C/D snoRNA
genes with a total of 346 gene variants in rice, using computer-assisted analysis. In
addition they revealed the discovery of 270 snoRNA in rice. Although many of the
identified snoRNA genes were conserved between rice and Arabidopsis, almost half of
them were rice specific.
2.3.4 RNA Interference (RNAi)
RNA interference (RNAi) is a sequence-specific gene-regulatory mechanism
including post-transcriptional gene silencing (PTGS) virus-induced gene silencing
(VIGS) , transgene induced gene silencing (TIGS) and transcriptional gene silencing
(TGS) (Mello and Conte, 2004; Dorokhov et al., 2006)
In plants, double-stranded RNA precursors of various kinds are processed by a
Dicer protein into short (20-30 nt) fragments. One strand of the processed duplex is
loaded into an Argonaute protein, enabling target RNA recognition through Watson-
Crick base pairing. Once the target is recognized, its expression is modulated by one of
Page 20
20
several distinct mechanisms, depending on the biological context (Figure 2.1) (Carthew
and Sontheimer, 2009).
Fire et al. in 1998 was the first research group who discovered and explained the
mechanism of RNA silencing induced by double-stranded RNA (RNA interference ) in
the nematode worm Caenorhabditis elegans. The sequence-specific posttranscriptional
gene silencing by double-stranded RNA is conserved in plants, fungi (Neurospora),
flies (Drosophila), nematode (Caenorhabditis elegans), and mammals (Leung and
Whittaker, 2005).
2.3.5 Small Interfering RNAs (siRNAs)
Small interfering RNAs are short double stranded RNA of about 23 nt (21–25 nt )
with 2 nt, 3´ overhanging ends(Wadhwa et al., 2004). They are derived from continuous
cleavage of long double-stranded RNA by the dsRNA-specific endonuclease, Dicer
(Reinhart and Bartel, 2002).
siRNAs direct the destruction of corresponding mRNA targets during RNA
interference (RNAi), in animal and perhaps during other RNA-silencing phenomenon ,
as well as posttranscriptional gene silencing of plant and quelling of Neurospora
(Reinhart and Bartel, 2002). The siRNA duplex are integrated into the RNA-induced
silencing complex (RISC) and the siRNA guide strand pilots RISC to perfectly
complementary RNA targets. Consequently target mRNA are degraded (Richard and
Erik, 2009) and the level of encoded protein via mRNA is considerably reduced.
Page 21
21
In plants, endogenous siRNA can also lead the transcriptional gene silencing
(TGS) which was first observerd during transgene and virus-indueed silencing (Mello
and Conte, 2004) Later centromeres, transposons, and other repetitive sequences were
revealed as another source of siRNAs (Lippman and Martienssen, 2004)
Figure 2.1 Mechanisms of silencing via Double-stranded RNA (Carthew and
Sontheimer, 2009).
Page 22
22
Guide strand: Red.
Passenger strand: Blue
Figure 2.2 Biogenesis and activity of siRNA (Carthew and Sontheimer, 2009).
Page 23
23
Golden et al. (2008) have uncovered multitudinous endogenous siRNAs
processed from structured transcripts, and also long dsRNAs derived from convergent
transcripts and apparent transposon sense-antisense pairs. Plant-specific DNA
dependent RNA polymerases are found in plant siRNA pathways and are not found in
animals and humans. Pol IV and Pol V are plant-specific DNA dependent RNA
polymerases first discovered in Arabidopsis (Pikaard et al., 2008; Mosher et al., 2010).
Pol IV and Pol V are specialized for siRNA production and transcriptional gene
silencing (Ream et al., 2009). siRNAs not only are restricted to posttranscriptional
modes of repression but they are involved in induction of heterochromatin formation
and siRNA-mediated DNA methylation (Carthew and Sontheimer, 2009).
The siRNA-mediated DNA methylation pathway in plants and involvement of
two plant-specific DNAdependent RNA polymerases (Pol IV and Pol V), the RNA-
dependent RNA polymerase (RDR2), DICER-LIKE3 and Argonaute proteins (AGO4
and AGO6) were described by Pikaard and Tucker (2009) and Matzke et al. (2009). Pol
IV most likely generates transcripts that are used as templates by RDR2, thus producing
double stranded RNAs that are cut into ~24 nt double stranded siRNAs by DCL3
(Pikaard and Tucker, 2009).
A set of endogenous siRNAs in Arabidopsis, which guide the endogenous
mRNAs cleavage have been described by Vazquez et al. (2004). They have claimed,
these siRNAs are different from earlier described regulatory small RNAs. Two
differences have described. First, they need cosuppression pathway factors (RDR6 and
SGS3) and also miRNA pathway components (AGO1, DCL1, HEN1, and HYL1).
Second, these siRNAs function in repressing of the genes expression that have little
Page 24
24
overall similarity to the genes from which they originate, a characteristic previously
reported only for miRNAs.
Ho et al. (2007) characterized siRNAs by cloning and sequencing them from
Brassica juncea leaves infected with Turnip mosaic virus (TuMV). It has been
described that, the siRNAs with 21-22 nt long were the most abundant species in TuMV
siRNA population. They believed they are derived from the same siRNA hotspots and
this may demonstrate the similarity between the plant Dicer-like (DCL) enzymes. The
vigorous GC bias which was detected for TuMV siRNAs against the virus genome has
shown the tendency of DCL to target GC-rich regions. Dicot micro-(mi) RNAs
displayed higher GCcontent than their DCL1 substrate RNAs, indicating that the GC
bias may be ancient, and therefore may be important for the RNAi technology (Ho et
al., 2007).
2.3.6 MicroRNAs in Plants
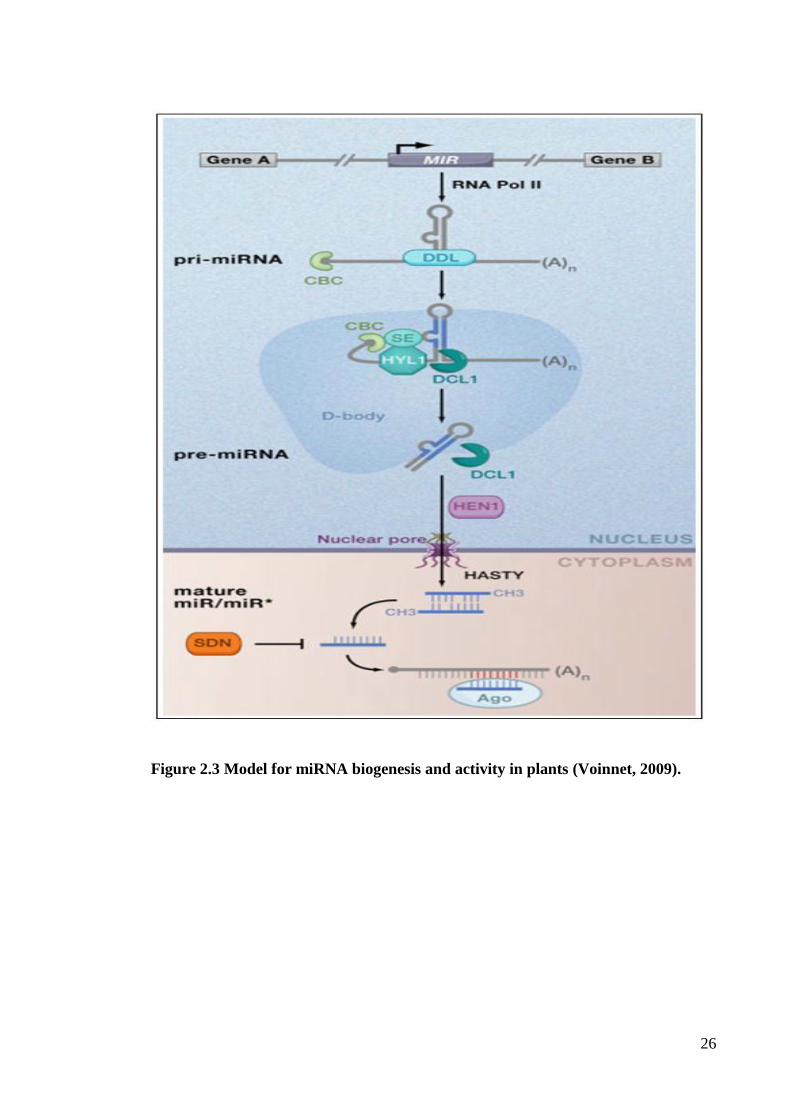
A miRNA gene is transcribed as a long sequence of more than 1 kb, which is
called primary miRNA (pri-miRNA) (Figure 2.3), by RNA polymerase II enzymes
(Bartel, 2004; Lee et al., 2004). Afterward pri-miRNA is cleaved by Dicer-like 1
enzyme (DCL1) to a stem loop intermediate known as miRNA precursor or pre-
miRNA (Zhang et al., 2006b). In plants dicer-like 1enzyme (DCL1) cleave miRNAs
into miRNA:miRNA* duplex in the nucleus instead of cytoplasm (Bartel, 2004). Then
HASTY, the plant orthologue of exportin 5, transfer the duplex into the cytoplasm.
(Zhang et al., 2006b) miRNAs are unwound into single strand mature miRNAs by
helicase in the cytoplasm, (Bartel, 2004). Lastly mature miRNAs are incorporated into
the RNA-induced silencing complex (RISC) and direct the translational repression or
cleavage of its target mRNA by base-pairing with the target mRNA (Bartel, 2004;
Page 25
25
Dugas and Bartel, 2004). Other than DCL1, HUA ENHANCER1 (HEN1) is also
required for miRNA biogenesis in plants and post-transcriptional gene silencing
(PTGS), which has two dsRNA-binding domains and a nuclear localization signal (Park
et al., 2002; Boutet et al., 2003). Despite the close similarity of miRNAs biogenesis and
functional mechanism in both animals and plants, plant miRNAs display some
differences. The stem-loop structures of plant pre-miRNAs are larger and more variable
in compared to animal pre-miRNAs (Yang et al., 2007). Moreover the mature plant
miRNAs pair to their target sites with near-perfect and unlike animals miRNAs they
normally identify a single target site in the coding region and direct the mRNA to cut
(Yang et al., 2007).
miRNAs were first discovered in Caenorhabditis elegans (Lee et al., 1993) , and
so far many of them have been discovered in diverse species of living organisms, as
well as plants. Over 700 miRNAs have been reported to identified in plants (Yang et al.,
2007), since the first discovery of miRNAs in Arabidopsis in 2002 (Reinhart and Bartel,
2002). Bartel and Bartel in 2003 listed some miRNAs which were identified in
Arabidopsis. The functions of some of them were recognized and confirmed, such as
miR156 which is responsible for floral organ identity and flowering time (Schwab et al.,
2005), miR160 which is responsible for auxin signaling and root development (Wang et
al., 2005) and miR164 which controls the boundary in meristem, organ formation,
separation and petal number (Schwab et al., 2005). Also miR172, 173 and 399 were
confirmed to be responsible respectively for specification of flower organ identity and
flowering time (Schwab et al., 2005), directing ta-siRNA biogenesis (Allen et al., 2005)
, and phosphate-starvation response (Fujii et al., 2005).
Page 26
26
Figure 2.3 Model for miRNA biogenesis and activity in plants (Voinnet, 2009).
Page 27
27
Palatnik et al. (2003) reportedthe JAW locus in Arabidopsis. JAW locus generates
a microRNA that is able to direct mRNA cleavage of a number of TCP genes
controlling leaf development. Overexpression of wild-type and microRNA-resistant
TCP variants revealed the point that mRNA cleavage was adequate to minimize the
TCP function. It was concluded that the existence of TCP genes with microRNA target
sequences in a broad range of species demonstrate control of leaf morphogenesis via
miRNA-mediated and is preserved in foliage with different leaf shapes.
Through an activation-tagging approach Aukerman and Sakai (2003), illustrated
how that over expression of miRNA 172 (miR172) in Arabidopsis will cause early
flowering and disorders the floral organ identity specification.
APETALA2 (AP2) and AGAMOUS (AG) are two floral homeotic genes which
specify the identities of perianth and reproductive organs, respectively, for flower
development in Arabidopsis (Zhao et al., 2007b). miR172 is normally expressed in a
temporal manner, consistent with its proposed role in flowering time control (Aukerman
and Sakai (2003). The distinct functions AG and miR172 in flower development and
their independent role in the negative regulation of AP2 were demonstrated by Zhao et
al.(2007b). It was exposed that APETALA2 (AP2) which is target gene of miR172
downregulated by miR172 via translational mechanism rather than by RNA cleavage.
Moreover gain-of-function and loss-of-function analysis depicted that two of the AP2-
like target genes function as floral repressors, and this strongly support the idea that
flowering time regulates by miR172 via downregulating AP2-like target genes.
Sunkar and Zhu (2004) reported the identification of new miRNAs related to
abiotic stresses in Arabidopsis. It was explained how stresses such as cold, NaCl,
Page 28
28
dehydration and ABA regulate miRNAs. According to their results miR393 was
strongly upregulated by all four (NaCl, dehydration, ABA and cold) treatments.
MiR397b and miR402 were slightly upregulated by all the stress treatments whereas
miR319c was upregulated only by cold stress. Among miRNA which were regulated by
stresses only miR389a was downregulated by all of the stress treatments.
Low-phosphate stress has a considerable influence on the target ubiquitin
conjugating enzyme (UBC *) mRNA (Fujii et al., 2005). Fujii et al. (2005) reported,
reduction of (UBC *) mRNA as a result of low-phosphate stress greatly induced the
miR399. They observed uppression of UBC mRNA accumulation under low-phosphate
stress in transgenic plants with constitutive expression of miR399.
In 2005 Xie et al. reported the constructing of small RNA libraries from wild-type
Arabidopsis (Arabidopsis thaliana) and mutant plants (rdr2 and dcl3). Their library
consisted of thirty-eight distinct miRNAs corresponding to 22 families.
Zhao et al. (2007), studied microRNA expression under drought stress conditions
in rice by using oligonucleotide microarray. They identified two miRNA, associated
with drought stress. In addition, miR-169g was the only member of miR-169 family
induced by drought stress. Also the induction of miR-169g was higher in roots than in
shoots.
Zhang et al. (2006a) reported 188 maize miRNAs from 29 miRNA families.
Homologs and secondary structures were used by Zhang and his colleagues for
identification of miRNAs from EST (http://www.ncbi.nlm.nih.gov/nucest). Twenty
eight miRNAs out of the 188 maize miRNAs were identified in at least one EST. In
Page 29
29
addition they claimed to identify a total of 115 potential targets for 26 miRNA families.
Most of the targets were transcription factors which were responsible for organ
development in maize, such as leaf, shoot and root development. Moreover, these maize
miRNAs were found to be engaged in other cellular processes, such as signal
transduction, stress response, sucrose and cellulose synthesis, and ubiquitin protein
degradation pathway.
A small RNA library consisting of roughly 40,000 small RNA sequences was
made for Brassica napus by Wanga et al. (2007). Eleven conserved miRNA families
were identified by analyzing, 3025 sequences from the small RNA library. They have
found in a F1 hybrid B.napus line and its four double haploid progeny that showed
marked variations in phenotypes majority of the conserved miRNAs were expressed at
the same levels. Also it has been reported that several of them were differentially
expressed between Arabidopsis and B.napus. In addition, it was detected the expression
level of miR169 was high and prominent in young leaves and stems, whilst in roots and
mature leaves they were untraceable.
To create computational prediction of potential miRNAs and their targets in
Brassica napus, Xie et al. (2007a) studied potential miRNAs in Brassica napus. They
sought for potential miRNAs in B. napus by using identified miRNAs in Arabidopsis,
rice and other plant species. EST (http://www.ncbi.nlm.nih.gov/nucest) and GSS
(http://www.ncbi.nlm.nih.gov/nucgss) databases were used. Identification of 21
potential miRNAs and 67 potential targets in B. napus were reported.
Yin et al. (2008) identified 21 conserved miRNAs in the EST
(http://www.ncbi.nlm.nih.gov/nucest) and GSS (http://www.ncbi.nlm.nih.gov/nucgss)
Page 30
30
databases by using a computational homology search in tomato. Their results
demonstrated that the well-conserved tomato miRNAs have preserved homologous
target interactions among different plant species.
Lu et al. (2008) reported identification of 68 putative miRNA sequences,
classified into 27 families as a result of cloning of small RNAs from abiotic stressed
tissues of Populus trichocarpa. Amongst the 68, nine families were novel, increasing
the number of the known Populus trichocarpa miRNA families from 33 to 42.
Page 31
31
CHAPTER 3
3.0 MATERIALS AND METHODS
3.1 Sample Collection
Seeds were collected from the fruit of wild species of Musa acuminata ssp.
malaccensis gathered from Rimba Ilmu which is a botanical garden located in
University Malaya, Kuala Lumpur, Malaysia.
3.2 Tissue Culture Medium Preparation
Murashige and Skoog medium (MS) (Murashige and Skoog, 1962) was used as a
tissue culture medium for samples. For preparation 1 litter of MS medium, first stock
solutions were prepared. Based on stocks, macroelements, microelements, iron and
organic supplement (vitamins) were added to approximately 700 ml dH2O. Then 30g
sucrose was added and the solution was adjusted to final volume of 1 liter with dH2O.
Gel-rite, (2g/L) as gelling reagent was used for solidification. The pH was adjusted to
5.8 using NaOH or HCl. Sterilization by autoclaving was carried out at 15 psi and
121ºC for 15-30 min.
3.3 Embryo Culture
Banana fruit skins were peeled off and the seeds were removed. Surface
sterilization was carried out by dipping, successively in 70% ethanol for 3 min, 20 %
(v/v) commercial bleach (NaOCl), solution containing 0.2% tween-20 for 20 min and
rinsing three times with sterile distilled water under a laminar flow (Ssbuliba et al.,
2006). Then seeds were air dried to dry the slippery mucus layer on the seed coat under
Page 32
32
laminar flow. Mushroom shaped embryos were exposed by cracking seed coats and
removed carefully using forceps and needle.
Ten Separated embryos were cultured on 9 cm diameter Petri dishes containing
40 ml MS medium and the longitudinal axis of the embryo was laid flat on the medium,
halfway embedded. Cultured embryos were placed in darkness until germination. After
germination cultures were transferred to lighted conditions (white fluorescent light,
2000 lux) of 16 h photo period at 26±2ºC.
3.4 Shoot Multiplication
3.4.1 Plant Material
Plantlets which were generated from embryo culture after 3 sub-cultures (every one
month) were used for shoot multiplication. Each shoot apex had a length of
approximately 1.5 cm after roots and leaves were removed.
3.4.2 Shoot Induction
Shoot apices (approximately 1.5 cm length) were placed onto MS medium (pH 5.8)
supplemented with 30g/L sucrose, 2 g/L gel-rite and BAP. Three different
concentrations of BAP, 3mg/L, 5mg/L and 7mg/L, were used to study effect of BAP on
shoot induction. Prepared shoot apices were placed sequential in 3, 5 and 7 mg/L of
BAP. Cap jars (150 ml) with roughly 30 ml of MS media were used. The cultures
maintained at 26±2º C on 16 hour photo period (white fluorescent light, 2000 lux) cycle.
Page 33
33
3.4.3 Multiplication
Multiplication was carried out by subdividing shoot clusters and sub culturing these
individual pieces on fresh media every 4 weeks. After 12 weeks and two subcultures,
single colonies which had been placed in 5mg/L BAP were ready for multiplication. A
single shoot cluster was cut longitudinally through the apex into four pieces. Each piece
was placed in regeneration medium (MS with 5 mg/L BAP).
3.4.4 Rooting
Explants were transferred to hormone-free MS media (Basal MS media) for root
initiation. They were maintained in hormone-free MS media for 3 weeks. The individual
shoots were used in salinity experiment after producing expanded leaves and roots.
3.5 Salinity Experiment
Clonal plantlets of the same physiological age and most similarity in shape, size
and in number of leaves were chosen. Different concentrations of NaCl were used
(Table 3.1). After 3 weeks, the plantlets were transferred to MS medium with 10
different NaCl concentrations containing 30 g/L sucrose and 2 g/L gel-rite. The pH was
adjusted to 5.8 and 50 ml of medium were dispensed in to 300 ml jars.
Samples were maintained in a growth chamber at 26±2ºC on 16 hour photo
period for a duration of one month. This experiment was carried out three different
times with a total of 150 plantlets. After four weeks, plant samples (root and shoots)
from surviving plantlets were collected. Samples were divided to two equal parts. One
part of samples was dried in oven for cation analysis and the other parts were kept in
-20°C for proline analysis. After the determination 120 mM NaCl as the lethal
concentration, fresh plantlets were put in 0 mM of NaCl as a control and 100 mM NaCl
Page 34
34
as a concentration lower than lethal for 24 hour. Roots were subsequently frozen in
liquid nitrogen and stored at -80°C until used for RNA extraction.
Table 3.1 : Different concentrations of NaCl which were used for salinity
experiment.
NaCl Concentration Number of plantlets
0 mM (control ) 5 plantlets
60 mM 5 plantlets
80 mM 5 plantlets
100 mM 5 plantlets
120 mM 5 plantlets
140 mM 5 plantlets
160 mM 5 plantlets
180 mM 5 plantlets
200 mM 5 plantlets
220 mM 5 plantlets
Page 35
35
3.5.1 Proline Extraction
Proline extraction was carried out as described by Bates et al. (1973). The
following steps were involved in the extraction of proline.
One hundred mg of frozen plant material (root and shoots) were excised from
plantlets after treatment at 0, 60, 80 and 100 mM of NaCl for one month with 3
replicates used for each concentration. Samples were homogenized in 1.5 ml of 3%
sulphosalicylic acid and the residue was removed by centrifugation. One hundred µl of
the extract was treated with 2 ml glacial acetic acid and 2 ml acid ninhydrin (1.25 g
ninhydrin warmed in 30 ml glacial acetic acid and 20 ml 6 M phosphoric acid until
dissolved) for 1 h at 100 °C and the reaction was then terminated in
an ice bath. The
reaction mixture was extracted with 1 ml toluene.
The chromophore-containing toluene was warmed to room temperature and its
optical density was measured at 520 nm with a spectrophotometer (ST-SP1104,
SASTEC). The amount of proline was determined from a standard curve in the range of
0–100 µgml-1.
3.5.2 Cation (Na, Mg, K, Ca), Measurement
Four elements (Na, Mg, K, and Ca) were extracted based on Moraghan (1993).
Elements were measured via atomic absorption. Three replicates were used for each
element in this experiment. Plantlets which were treated in 0, 60, 80 and 100 Mm NaCl
for one month were dried in oven at 104 ºC for 24 h.
Page 36
36
One hundred mg of dried sample (mixture of root and shoots) were mixed with 9
ml HNO3 and 1ml HCl and heated in a water bath at 95ºC for 1h. After cooling down to
room temperature samples were filtered with Whatman paper and diluted by dH2O to 25
ml. Then the concentrations of Na, Mg, K and Ca were determined by Atomic
Absorption Spectrometer (AAnalyst 400, Perkin Elmer, USA).
3.6 Data Analysis
Data analysis were carried out using Microsoft office excel 2007 and Minitab.
ANOVA was performed on the data.
3.7 RNA Extraction
RNA was extracted using a modified CTAB method based on the Kiefer et al.
(2000) protocol. Roots which were obtained from salt treatment stage were frozen and
kept in -80 ºC were used for RNA extraction.
3.7.1 CTAB Method
A liquid N2 frozen banana root (300 mg), was ground with a pre-chilled mortar
and pestle under liquid nitrogen and the powdered tissue was put into a 2 ml Eppendorf
tube containing 1 ml pre-warmed extraction buffer (temperature of the extraction buffer
must be ~65ºC), plus 20 µl B-mercaptoethanol and mixed with vortex. Subsequently
500 µl C/I was added into the tube and vortexed (1,800 rpm) at room temperature for 10
min. Samples were then centrifuged for 5 min at 4 ºC and 18,000 g. The supernatant
was transferred to a 2.0 mL Eppendorf tube, and after adding 250 µl C/I, vortexed at
room temperature for 2 min, it was then centrifuged for 2 min at 4ºC and 18,000 g. The
supernatant was transferred to a 2.0 mL Eppendorf tube and after addition of 2 volumes
ice cold isopropanol, incubated for 5 min on ice, and then centrifuged for 5 min at 4 ºC
Page 37
37
and 18,000 g. The supernatant was discarded and the pellet washed with 1 ml 70% cold
ethanol (v/v) (-20°C) and centrifuged for 5 min at 4ºC and 18,000 g. The supernatant
was aspirated and the pellet air-dried for 10-20 min. The dried pellet was dissolved in
15-50 µl DEPC treated H2O (depending upon the size of pellet).
3.7.2 Modified CTAB Method
Liquid N2 frozen banana root (300 mg), was ground to a fine powder with a pre–
chilled mortar and pestle under liquid nitrogen and the powdered tissue was put into a 2
ml Eppendorf tube containing 1 ml pre-warmed extraction buffer (~65 ºC), 20 µl β-
mercaptoethanol plus 10 µl proteinase K and mixed with vortex and kept at 42 ºC for 15
min. Subsequently 500 µl phenol and 500 µl C/I were added into the tube and vortexed
(1,800 rpm) at room temperature for 10 min, and then centrifuged for 5 min at 4ºC and
18,000 g. The supernatant was transferred to a 2 ml Eppendorf tube, after adding 500 µl
C/I and vortexed at room temperature for 2 min, was centrifuged for 2 min at 4ºC and
18,000g. The supernatant was transferred to a 2.0 ml Eppendorf tube, 2 volumes of ice
cold isopropanol was added and incubated for 5 min on ice. Subsequently it was
centrifuged for 5 min at 4 ºC and 18,000 g. The upernatant was discarded and the pellet
washed with 1 ml 70% cold ethanol (v/v) (-20°C) and centrifuged for 5 min at 4 ºC and
18,000 g. The supernatant was aspirated and the pellet air-dried for 10-20 min. the dried
pellet was dissolved in 15-50 µl DEPC treated H2O (Depending on the size of pellet).
3.7.3 DNase Treatment
To degrade DNA contamination from total RNA, DNase treatment was carried
out. Total RNA obtained from RNA extraction was then treated with DNase using
Deoxyribonuclease I (Invitrogen, USA). RNA sample (1 µg), was treated with 1µl 10x
Page 38
38
DNase I reaction buffer and 1µl DNase I, amplification grade (1 U/ µl), and was
adjusted to final volume of 10 µl with DEPC-treated water. The reaction mixture was
incubated for 15 min at room temperature. Then DNaseI was inactivated by the addition
of 1µl of 25 mM EDTA solution to the reaction and subsequently heated for 1 min at
65°C.
3.7.4 Optical Density (OD) 260/280 Assay
This assay was carried out in order to determine the concentration and purity of
the samples in solution. The assay is based on the fact that double strand DNA or RNA
respectively at concentrations of 50µg/ml and 40µg/ml have an optical density reading
of 1.0 when measured at 260 nm in cuvett with 1 cm light path. The amount of UV
radiation absorbed by solution of DNA/RNA is directly proportional to amount of
DNA/RNA in the sample. A 50 µl diluted sample (1µl sample+49 µl dH2O or DEPC
treated H2O) was measured in an ultraviolet spectrophotometer (Bio photometer,
Eppendorf, Germany).
To determine the purity of the DNA/RNA samples the ratio of their absorbance at
260 nm and 280 nm (260/280) was measured, where the 260 nm reading is indicative of
DNA/RNA concentration and the 280 nm reading indicates the protein contamination.
The best purities are indicated in the range of 1.8 to 2.0.
3.7.5 TBE Buffer Preparation
TBE buffer (1X) was used in both Agarose gel preparation and loading of
Samples. To make 100 ml 1x TBE 10.8g Tris base, 5.5g Boric acid and 4ml of 0.5M
EDTA were dissolved with stirring in 85 ml nuclease-free water. The final volume was
adjusted to 1 liter with nuclease-free water.
Page 39
39
3.7.6 Agarose Gel Preparation
Three different percentages 1, 2 and 3% of molecular biology and LE Analytical
Grade agarose were used for the electrophoretic separation of nucleic acids.
For preparation of 1% agarose gel with diameter of 3 mm, 0.15g agarose was
mixed with 15 ml TBE which was prepared with nuclease-free water in a conical flask
and weighed. Then the solution was microwaved until it dissolved and weighed again
followed by replacement of evaporated water with nuclease free water. After cooling
the solution to about 60ºC, the solution was stained with Ethidium bromide (0.5 µl) and
poured into a casting tray containing a sample comb and allowed to solidify at room
temperature.
3.7.7 Loading of Samples
3.7.7.1 RNA Samples
Based on optical density, 1µg of RNA was mixed with equal amount of 2X
loading dye (Fermentas, Canada), heated for 10 min at 70ºC and placed on ice for 2 min
to prevent the reformation of secondary structures before loading onto a gel. Running
voltage ranging between 80-100 V was used for duration of 40-60 min. One % LE
analytical grade Agarose (Promega), was used for preparing the gel and 1% TBE was
used for running of the gels.
3.6.7.2 DNA samples
Based on optical density 1µg of DNA was mixed 1/5 with 6X loading dye
(Fermentas, Canada) and loaded onto the gel. Running voltages ranging between100-
120 V were used for a duration of 20 min to 1 h. Different percentages (1, 2.5 and 3%)
Page 40
40
of LE analytical grade Agarose ( Promega), were used for gel preparation and 1% TBE
was used for running of the gels.
3.8 miRNA cDNA Library Construction
To construct the cDNAlibrary, miRNAs of salt stressed plantlets were isolated
from total RNA and converted to cDNA and PCR products via MicroRNA Discovery™
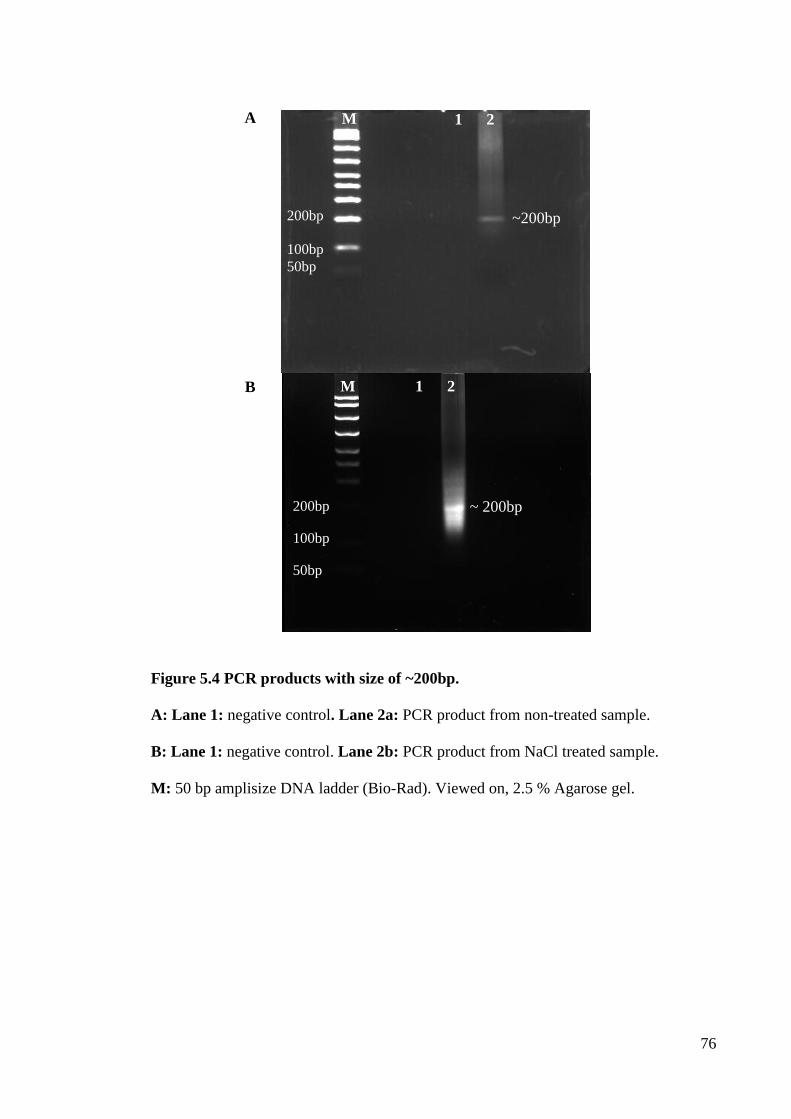
Kit (System Bio Sciences, USA). Subsequently PCR products with size of
approximately 400bp (including primer size) were ligated into the vector (pCR4-TOPO,
39.56 bp) and transformed to the host cells (TOP10 Chemically competent E. coli,
Invitrogen, USA). The cloned bacteria are then selected, commonly through the use of
antibiotic selection. Ampicillin was used as a selective antibiotic and white colonies
were picked for PCR confirmation and construction of the library. Sequencing and
BLAST analysis (section 3.9) were subsequently carried out in order to analyzing the
colonies.
3.8.1 Adaptor Ligation, Reverse Transcription PCR (RT PCR) and PCR
MicroRNA Discovery™ Kit (System Bio Sciences, USA) was used for isolation
of microRNAs. Total RNA was used for this stage. This small RNA amplification
system includes 3 steps:
1. A degenerate adaptor mixture is ligated to both the 5´- end and 3´- ends of total
RNA.
2. Reverse transcription of the RNA using a primer complementary to the attached
adaptor.
3. PCR amplification of the cDNA.
Page 41
41
Table 3.2 : Sequences of adaptors and primers used in adaptor ligation, RT and
PCR step.
Upper Strand
Primer squence
5’ - P ACTCTGCGTTGATACCACCTGCTT - 3’
Lower Strand
Primer sequence
3’ - r N r T r G r AGACGCAACTATGGTGACGAA NH2 - 5’
3’ - r N r N r T r G r AGACGCAACTATGGTGACGAA NH2 - 5’
3’ - r N r N r N r T r G r AGACGCAACTATGGTGACGAA NH2 - 5’
3’ - r N r N r N r N r T r G r AGACGCAACTATGGTGACGAA NH2 - 5’
RT and PCR
Primer sequence
5’ - AAGCAGTGGTATCAACGCAGAGT – 3’
N = G/C/U/A
Page 42
42
3.8.2 Gel Extraction
Amplified cDNAs from the PCR step were run on 3% LE analytical grade
Agarose gel and desired fragments which were between 200-300bp cut under UV light.
The cut fragments were purified by gel extraction using a kit (Qiagen, Germany).
3.8.3 Cloning
A PCR 4-TOPO cloning kit (Invitrogen, USA) was used to clone the amplified
cDNA after gel extraction. Ligations followed the kit instructions. One Shot TOP10
chemically competent E.coli (Invitrogen, USA) was used for transformation.
Consequently 100 μl transformed cells were diluted in 1ml LB broth and 100 μl of
dilution dispensed on onto LB agar with 50µg/ml Ampicillin plus 50µg/ml X-gal and
incubated at 37°C overnight (16 h). Colonies collections were performed by sub
culturing the white colonies onto the selective plates containing 50µg/ml Ampicillin
plus 50µg/ml X-gal. All white colonies (200 colonies) were selected to construct small
RNA library. After overnight incubation at 37°C, 10 clones were chosen for screening
by PCR.
3.8.4 Colony PCR
PCR was carried out in total volume of 12.5 µl as below:
1. Control DNA Template (100 ng) 1 μl
2. 10x PCR Buffer 1.25 μl
3. 50 mM dNTPs 0.125 μl
4. Forward and Reverse PCR Primers (0.1 μg/μl each) 0.25 μl
Water 9.375 μl
5. Taq Polymerase (1 unit/μl) 0.25 μl
Page 43
43
Sequence of the M13 Forward and Reverse primers:
M13 Forward 5´-GTAAAACGACGGCCAG-3´
M13 Reverse 5´-CAGGAAACAGCTATGAC-3
Table 3. 3 : Amplification cycling parameters.
Step Time Temperature Cycles
Initial Denaturation 10 minute 94°C 1x
Denaturation 1 minute 94°C
25x Annealing 1 minute 55°C
Extension 1 minute 72°C
Final Extension 7 minutes 72°C 1x
Page 44
44
3.9 Plasmid Isolation
One of the quickest and cleanest ways to isolate plasmid DNA from bacteria is to
use the Qiagen plasmid purification kit. Plasmid kit was used in this study is based on
modified lyses procedure, followed by binding of plasmid DNA to Qiagen Anion-
Exchange Resin under appropriate low-salt and pH conditions. Plasmid DNA was
isolated by using plasmid purification mini kit (Qiagen, Germany) followed kit
instruction. The DNA pellets were dried via the DNA plus (Heto, Denmark) for 5 min.
Pellets were dissolved in sterile dH20 and kept overnight at 4°C in order to better
digestion.
3.10 Sequencing and Analysis
Isolated plasmids, after reading OD, were diluted to 200 ng and sent to First Base
Laboratories for sequencing. Fragment sequences (~ 200 bp), were separated from Topo
vector and aligned with mature stress related micro RNAs from miRBase
(www.mirbase.org).Clustal W (www.ebi.ac.uk/Tools/clustalw2/index.html) and BioEdit
(BioEdit Sequence Alignment Editor Versions 7.0.5.3 and 7.0.9.0) were programs
which were used for alignment. MiRBase search (http://www.mirbase.org/search.shtml)
BLAST analysis were use data analysis. BLAST analysis included non-human non
mouse EST (http://www.ncbi.nlm.nih.gov/sites/nucest), Oryza sativa EST (indica
cultivar group and japonica cultivar group) and nucleotide collection (nr/nt)
(http://blast.ncbi.nlm.nih.gov/Blast.cgi).
PsRNA Target (http://bioinfo3.noble.org/psRNATarget/) was used to identify
putative miRNA targets. The banana EST data which were used for target identification
in this study are from a UM project led by Prof. Rofina Yasmin Othman and contains
Page 45
45
different data including banana virus sequences and are part of the data available to the
Global Musa Genomics Consortium (http://www.musagenomics.org/).
Page 46
46
CHAPTER 4
4.0 RESULTS AND DISCUSSION I
4.1 In-vitro Zygotic Embryo Culture
Contamination of embryo extracted from seeds were greatly reduced when the
seeds were treated with a combination of 70% ethanol for 3 min and 20 % (v/v)
commercial bleach (NaOCl) compared to treatment of seeds with 70% ethanol or
commercial bleach (NaOCl) alone (Table 4.1).
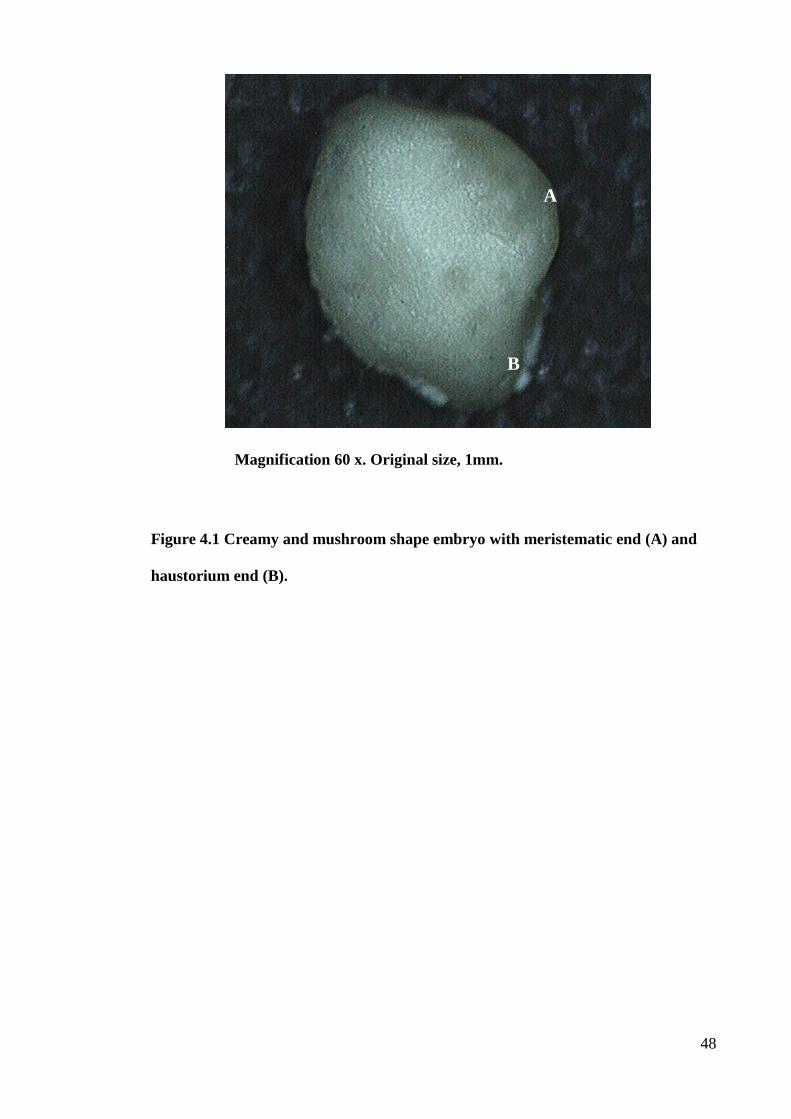
The embryos were observed to have a mushroom shape, creamy color and were
divided into two parts, a meristematic portion and a haustorium (Figure 4.1). The
meristematic portion is a stalk-like structure on the top of the embryo and the
haustorium is a flat rounded portion at the bottom (Figure 4.1). Germination of embryos
took place a few days (3-5) after initial culture. Embryos were yellow and swollen as an
early sign of germination. These changes were similarly observed by Afele and De
Langhe (1991) and according to their report those embryos which remained creamy
never germinated. Shoot primordia and root primordia first appeared respectively from
the lateral tissues of the meristematic end and the apical tissue of the meristematic end.
After about three weeks, the plant-like structure appeared, consisting of the prominent
shoot, which bore at its base an adventitious root system. The swelling of the whole
embryo followed by the appearance of shoot and root primordia defined the process of
seed germination.
Page 47
47
Table 4.1 : Comparison of different sterilizing reagents was used for seeds
Sterilization.
Sample
Treatment
Contamination %
1 Rep.1 Combination of 70% and 20 %
(v/v) commercial bleach (NaOCl)
10
Rep.2 0
Rep.3 10
Rep.4 0
Rep.5 10
2 Rep.1 70% Ethanol 50
Rep.2 50
Rep.3 40
Rep.4 60
Rep.5 50
3 Rep.1 20 % Commercial bleach
(NaOCl)
60
Rep.2 50
Rep.3 60
Rep.4 60
Rep.5 50
Each sample was included 10 embryos.
Rep = replicate
Page 48
48
Magnification 60 x. Original size, 1mm.
Figure 4.1 Creamy and mushroom shape embryo with meristematic end (A) and
haustorium end (B).
A
B
Page 49
49
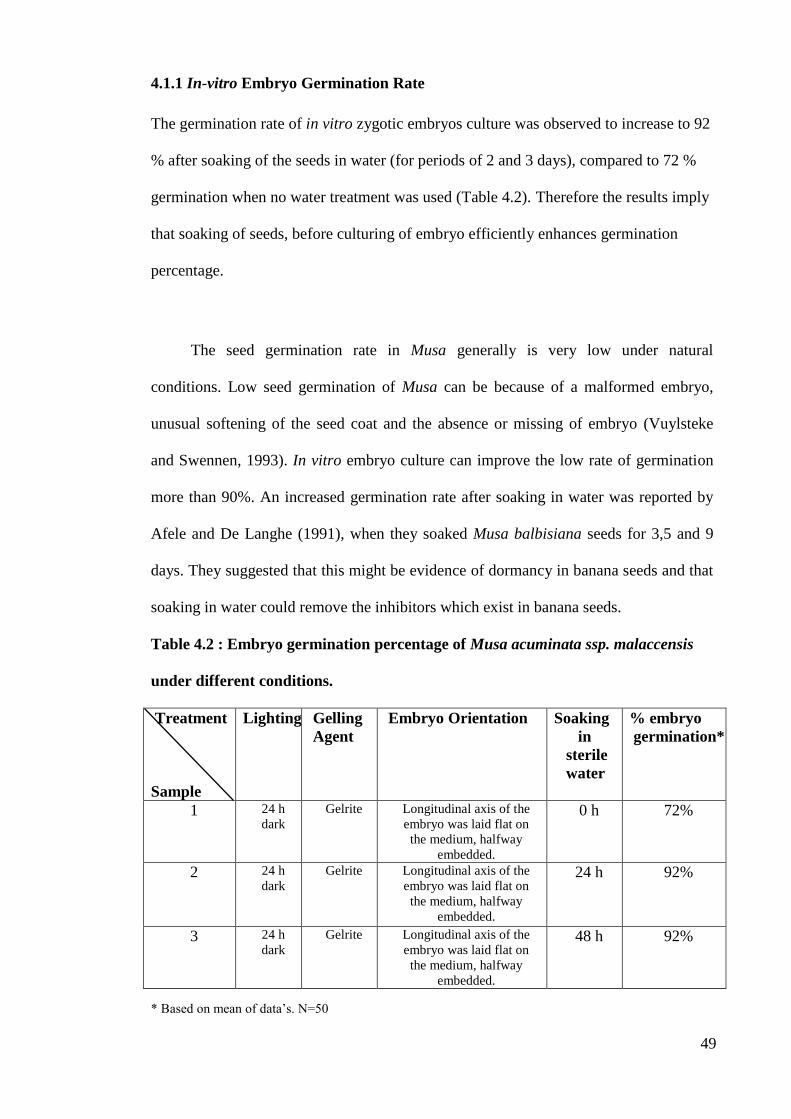
4.1.1 In-vitro Embryo Germination Rate
The germination rate of in vitro zygotic embryos culture was observed to increase to 92
% after soaking of the seeds in water (for periods of 2 and 3 days), compared to 72 %
germination when no water treatment was used (Table 4.2). Therefore the results imply
that soaking of seeds, before culturing of embryo efficiently enhances germination
percentage.
The seed germination rate in Musa generally is very low under natural
conditions. Low seed germination of Musa can be because of a malformed embryo,
unusual softening of the seed coat and the absence or missing of embryo (Vuylsteke
and Swennen, 1993). In vitro embryo culture can improve the low rate of germination
more than 90%. An increased germination rate after soaking in water was reported by
Afele and De Langhe (1991), when they soaked Musa balbisiana seeds for 3,5 and 9
days. They suggested that this might be evidence of dormancy in banana seeds and that
soaking in water could remove the inhibitors which exist in banana seeds.
Table 4.2 : Embryo germination percentage of Musa acuminata ssp. malaccensis
under different conditions.
Treatment
Sample
Lighting Gelling
Agent
Embryo Orientation Soaking
in
sterile
water
% embryo
germination*
1 24 h
dark
Gelrite Longitudinal axis of the
embryo was laid flat on
the medium, halfway
embedded.
0 h 72%
2 24 h
dark
Gelrite Longitudinal axis of the
embryo was laid flat on
the medium, halfway
embedded.
24 h 92%
3 24 h
dark
Gelrite Longitudinal axis of the
embryo was laid flat on
the medium, halfway
embedded.
48 h 92%
* Based on mean of data’s. N=50
Page 50
50
4.2 Shoot Induction and Multiplication
The shoot induction experiment included a total of 30 plantlets which were
divided to three groups of 10 and placed respectively in 3, 5, 7 mg/L BAP.
No shoots were observed for all replicates (10 replicates ) for concentration of 3
mg/L BAP after four weeks (Figure 4.2A), whereas at 5mg/L BAP (8 out of 10 plantlets
produced one shoot) and 7 mg/L BAP (9 out of 10 plantlets produced one shoot) new
shoots appeared after four weeks (Figure 4.2 B, C) (Appendix J). The results observed for
5mg/L BAP are consistent with Mante and Tepper’s (1983) finding of one shoot initial
per explant in 28 days.
Although there was no considerable difference between the use of 5 and 7 mg/L
BAP for initiation ofshoot induction (Figure 4.3), it was shown that using 7 mg/L BAP
for longer periods could induce abnormalities of the shoots and stems. The results show
that plantlets which were placed in 5 mg/L BAP after 4 months and three subcultures
(every one month) produced clusters of distinct and normal shoots and stems (Figure
4.4). But abnormality was observed in plantlets which were grown in 7mg/L BAP within
the same period and number of sub-culturing (Figures 4.5). Abnormality of colonies
manifested in different shapes. As can clearly be seen in Figure 4.5A stems were very
thick and thicknesses were not the same for each clone. Stems were not separated and
produced a mass (Figure 4.5B) and were also thin and twisted (Figure 4.5C).
The results suggested that using 5mg/L BAP had the best effect on shoot
induction compared to other concentrations tested. Due to the abnormalities which were
induced by 7 mg/L BAP and the null effect of 3 mg/L BAP on shooting, 5mg/L BAP
was chosen as the best concentration for multiplication.
Page 51
51
Figure 4.2 New shoot induction in 3, 5 and 7 mg/L of BAP.
A. No shoot appeared in 3 mg/L BAP after four weeks. B. One shoot appeared in 5
mg/L BAP after four weeks. C. One shoot appeared in 7 mg/L BAP after one month.
Page 52
52
Error bar shows SD.
Figure 4.3 New shoots appearance at three different BAP concentration (3, 5 and
7mg/L) after four weeks. The values are the average of 10 replicates for each
concentration of BAP.
A
Concentration of BAP mg/l
No
of sh
oo
t
Page 53
53
Figure 4.4 Shoot induction after four month in 5 mg/L BAP. All plantlets are almost
similar and distinct from each other and stems have approximately same size.
1 cm
Page 54
54
s
Figure 4.5 Shoot induction abnormality in 7mg/L BAP.
a
A. Plantlets are not
similar in size and
shape and stems
are very thick.
B. Cluster is a
bulk. Stems are
not separated
and plantlets
are not distinct.
C. Stems are thin
and twisted.
b
C
c
A
B
1 cm
1 cm
1 cm
B
1 cm
Page 55
55
Shoot apices were prepared with a length of approximately 1.5cm from plantlets
generated from embryo culture (Figure 4.6A). Shoot apices were placed in 5 mg/L BAP
for shooting purposes (Figure 4.6B). Slightly before shoot initial development explants
were swollen and the first visible shoot appeared from the meristem after 4 weeks
(Figure 4.6C). Similar swelling in the explants before shoot initial development was
observed by Mante and Tepper (1983) in Musa textilis Nee. After 12 weeks, shoot
clusters (Figure 6.1E) were cut longitudinally through the apex to individual pieces
(single shoot) (Figure 6.1F). Each single shoot was separately placed in 5mg/L BAP. In
this stage 12 single shoots were used and after four weeks each piece produced a clone
with average of 10.2 shoots per clone (Table 4.3).
Cronauer and Krikorian (1984) produced multiple shoot cultures from the dessert
banana (Philippine lacatan and Grande naine) and plantain by cutting small shoot
longitudinally through the apex. By using 5mg/L BAP they achieved an average of 9.1
new shoots per single shoot. This result is almost similar to the results achieved in this
study which showed an average of 10.2 per shoot. The slight difference can be
interpreted as a difference between species.
Table 4.3 : Number of new shoots was produced per single shoot after four weeks.
SampleNo 1 2 3 4 5 6 7 8 9 10 11 12 Mean of
samples
No of shoots
after 4 weeks
10 10 11 9 10 10 12 9 10 10 10 11 10.2
Page 56
56
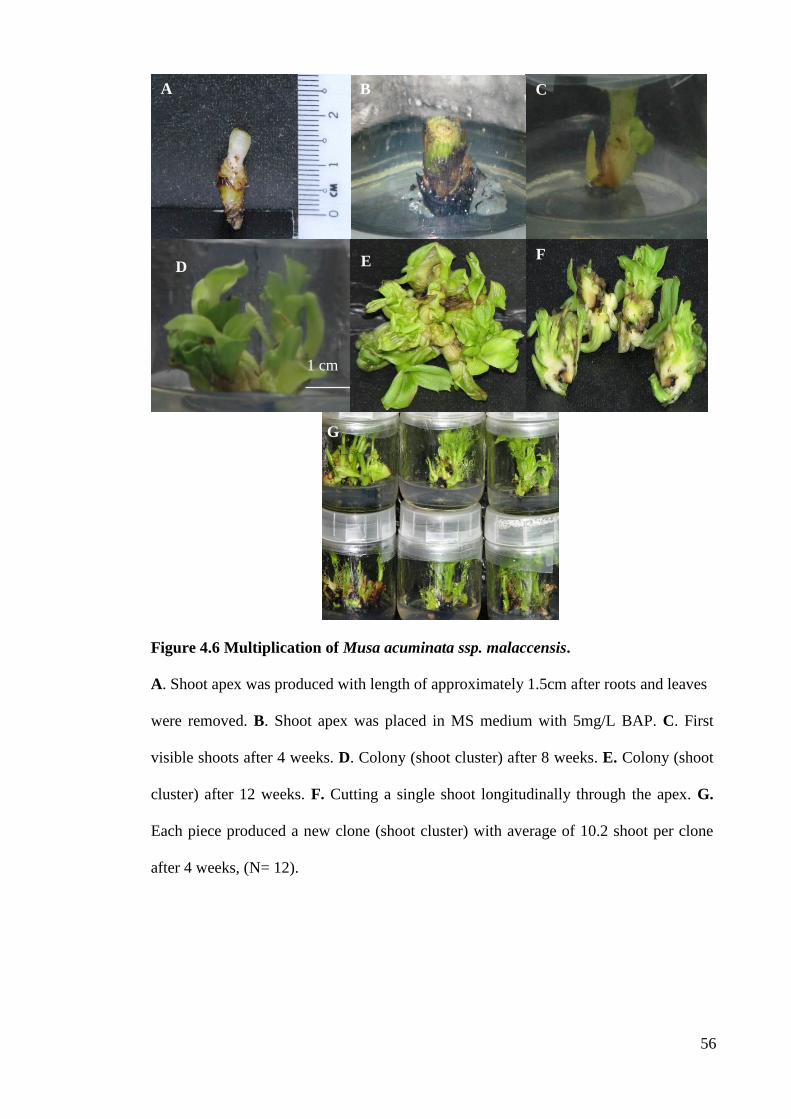
Figure 4.6 Multiplication of Musa acuminata ssp. malaccensis.
A. Shoot apex was produced with length of approximately 1.5cm after roots and leaves
were removed. B. Shoot apex was placed in MS medium with 5mg/L BAP. C. First
visible shoots after 4 weeks. D. Colony (shoot cluster) after 8 weeks. E. Colony (shoot
cluster) after 12 weeks. F. Cutting a single shoot longitudinally through the apex. G.
Each piece produced a new clone (shoot cluster) with average of 10.2 shoot per clone
after 4 weeks, (N= 12).
A C
D
1 cm
-------
B
Edd F E F
G
Page 57
57
4.3 Salt Stress Assessment
4.3.1 General Effect of Salinity on Musa acuminata ssp. malaccensis
The initial effect of salinity on the plants appeared as a general wilting and
twisting of leaves, 3-5 days after exposure of plantlets to saline conditions. Differences
in the time of appearance of salinity associated symptoms were dependent on NaCl
concentrations. Chlorosis and necrosis appeared on leaf surfaces 5-8 days after exposure
to saline conditions. General growth of plants was considerably inhibited by increasing
NaCl concentrations. Production of new leaves was considered as a positive indicator of
plant growth. The study showed that the number of new leaf production was greatly
reduced by elevation of NaCl concentration (Appendix K). The results were derived
from observation of 50 plantlets over a period of one month. The analysis of variance
(ANOVA) showed a significant difference (at p<0.05) in number of plant new leaf
production with increasing NaCl concentrations (Appendix L). Figure 4.7 shows that
there was a significant difference in the number of new leaves appearing in the control
group compared to those at 60 mM of NaCl. The difference between 60 and 80 mM
NaCl was also significant. The number of new leaf production at 100 mM NaCl was
lower than 80 mM NaCl but the difference was not significant. Growth ceased at
concentrations higher than 100 mM NaCl and all plantlets died at concentrations of 120
mM of NaCl. Expansion of roots was observed at lower concentrations (60 and 80 mM
NaCl). At 60 and 80 mM NaCl plants produced aerial roots which had upward
expansion (Figure 4.8). These roots contained secondary root and they were hairy
compared to the roots observed in control samples. Root elongation, aerial and hairy
root production via plants under saline condition are considered as the plants adaptive
response to salinity (Balibrea et al., 2000). With further increasing of NaCl
concentrations decreases were observed in root expansion and development. Roots
Page 58
58
growth at 60 and 80 mM NaCl suggests the plants attempted to adapt and bear the saline
conditions. Salinity has diverse negative effects on plants. It has limitative influence on
plant growth and productivity (Allakhverdiev et al., 2000; Veeranagamallaiah et al.,
2007), and affects many physiological and metabolic processes (Läuchli 1984; Olmos et
al., 1994). Inhibition and stunting of growth under saline conditions were reported as
common effects of salinity on plants (Cherian et al., 1999; Takemura et al., 2000).
Similarly in this study the growth of Musa acuminata ssp. malaccensis plantlets was
significantly affected as a result of increasing of the salt concentration in the growth
media. Developing of root system and rising aerial and hairy root is understood as a
plant effort for adaptation for survival.
Error bar shows SD.
Error bar shows SD.
Figure 4.7 New leaf production with increasing in salt concentration after one
month.
Concentration of NaCl (mM)
0
1
2
3
4
5
6
7
8
9
0 60 80 100
concentration
no
mb
er
of
leaves
(mM)
Page 59
59
Figure 4.8 Expansion of root system at 60 and 80 mM of NaCl.
A. Root expansion on the control medium. B. Root expansion at 60 mM. Roots formed
secondary hairy roots. C. Root expansion at 80 mM. Roots formed secondary hairy
roots.
A
B C
1 cm
1 cm 1 cm
Page 60
60
4.3.2 Determination of Lethal Concentration of NaCl for Musa acuminata ssp.
malaccensis
The results of this experiment were collected from a total of 150 plantlets after
one month. The experiment was conducted in triplicates (each time 50 plantlets) at 10
different concentrations, 0 mM as a control concentration and 60, 80, 100, 120, 140,
160,180, 200 and 220 mM NaCl. In spite of the intensive damage of salinity on exterior
parts of plantlet such as general wilting, chlorosis, necrosis, all plantlets survived at 60,
80 and 100 mM of NaCl after one month. All plantlets died at concentrations of
120mM of NaCl. Destructive influence of high concentrations (General wilting and
twisting of leaves followed chlorosis, necrosis and burning of leave margin) could
clearly be seen, 15 days after exposing of plantlets to 120 mM of NaCl concentration
(Figure 4.9B). Plantlets died after 30 days after exposure to 120 mM of NaCl (Figure
4.9C). The same results were obtained in the higher concentrations from 140 to 220
mM where all plantlets were observed to have died.
Ulisses et al. (2000) used different concentrations of NaCl (0, 20, 40, 60, 80,100
and 120 mM) to select salt tolerant banana buds (spp. Nanicao). They also reported that
all buds died at 120 mM of NaCl. The results of this study reaffirmed their finding that
120 mM was determined to be a lethal concentration of NaCl for Musa acuminata spp.
malaccensis. Accordingly 100 mM of NaCl was determined as the minimal inhibitory
sodium chloride (NaCl) concentration for survival of banana plantslets (Musa
acuminata ssp. malaccensis) and used for RNA extraction and construction of salt
stress small RNA library.
Page 61
61
Figure 4.9 Plantlets in MS medium with 120 mM NaCl.
A. Plantlet immediately after bing placed in salty 120 mM of NaCl. B. Plantlet after 15
days in 120 mM of NaCl. C. Plantlet after 1 month in 120 mM of NaCl (died).
A B C
1 cm 1 cm 1 cm
A C B
Page 62
62
4.3.3 Proline Assay
The concentration of proline increased significantly in both root and leaves at 60
and 80 mM of NaCl concentration compared to the control (Figure 4.10). Analysis of
variance (ANOVA) showed a significant difference (at p<0.05) in proline
concentrations with increasing NaCl concentrations (Appendix M). The highest amount
of proline accumulation in both root and leaves was recorded at 80 mM of NaCl. An
Increase of proline in the roots was observed in 60 mM NaCl and it reached a peak of
15 mg/g at 80 mM. With further increment of NaCl to 100 mM, the concentration of
proline was significantly lowered in roots. The Concentrations of proline in leaves also
showed significant increases at 60 and 80 mM NaCl compare to the control. Similar to
roots, the highest concentration of proline in leaves was obtained at 80 mM NaCl.
Further increase in NaCl reduced concentration of proline.
The study observed that in the banana samples tested increases in the
concentration of NaCl influenced the concentration of proline in the roots and leaves.
Similar increment of proline concentration in response to NaCl increase was reported
by Van Diggelen et al. (1987), Ewing et a.l (1995), Parida and Das (2005), Naidoo and
Kift (2006) and Keutgen and Pawelzik (2008) in different plants. Accumulation of
proline is a defence strategy for many plants against salinity and reflects a plant’s vital
ability for salt tolerance and adaptation to salt conditions (Molinaria et al., 2004;
Meloni et al., 2008). Proline accumulation is a general response of plants to many kinds
of stresses such as, salinity, drought, heavy metal toxicity and high temperature
(Siripornadulsil et al., 2002). Organic metabolites such as proline are known to play an
important role in osmoregulation and osmotolerance (Sharma et al., 1998) and serve as
good indicators for studying the effects of abiotic stresses on plants as shown in this
study.
Page 63
63
Increasing proline concentrations at 60 and 80 mM NaCl clearly shows the
attempt of the plants to adapt itself to saline conditions. The plants in this study could
tolerate the elevation of salt concentrations until 80 mM NaCl but with further increase
to 100 mM NaCl the plants ability to resist the higher concentration of NaCl reduced
and eventually plants died at 120 mM of NaCl. This result supports the observation of
the previous experiment (Determination of lethal concentration of NaCl for Musa
acuminata ssp. malaccensis).
Error bar shows SD.
Figure 4.10 Proline concentrations in the roots and leaves of Musa acuminata ssp.
malaccensis with increasing of NaCl concentration.
0
2
4
6
8
10
12
14
16
0 60 80 100
Salt concentration (mM)
Pro
lin
co
ncn
tra
tio
n (
mg
/g)
Leaves Roots
NaCl concentration (mM)
Page 64
64
4.3.4 Elements measurement (Na+, K
+, Ca
++, Mg
++)
Elevating NaCl concentrations in the medium resulted in increasing Na+
and
decreasing K+, Ca
++ and Mg
++ concentrations in the plants. The Na
+ content was
increased in 60, 80 and 100 mM NaCl treatment (Figure 4.11). Gadallah (1999), Khan
et al. (1999), Khan (2001), reported an increment in Na+
levels by increasing NaCl
treatment in a variety of plants. An increment was reported in barley (Hordeum vulgare
L.) (Demural et al., 2005), strawberries (Fragaria x ananssa L.) (Yilmaz and Kina,
2008) and legumes (Medicago polymorpha L. cv. Scimitar and Trifolium michelianum
L. cv. Frontier) (Behdani et al., 2008).
With increasing of NaCl levels decreasing K+, Ca
++ and Mg
++ contents observed
in all concentrations (60, 80 and 100 mM of NaCl). Ruiz et al. (1999) reported to
falling concentration of K+, Ca
++ content in citrus as a result of salinity. Decreasing K
+,
Ca++
and Mg++
levels in a number of plants in relation to increase in NaCl levels were
reported by Khan et al (1999, 2000). Ashraf (2002) reported decreasing K+
Ca++
and
Mg++
levels in cotton by increasing NaCl. Figure 4.12 shows decrease in Ca
++ in
relation to increasing salt levels in this study. At 60 mM an increase in Ca++
was
observed in comparison with the control but, with further increase of NaCl to 80 and
100 mM, a decline was observed in the Ca++
concentration. A similar result was seen
with K+. Figure 4.13 shows decreasing K
+ concentration in relation to NaCl elevation.
At 60 mM
an increase in K+
was observed compared to the control but, K+
concentration decreased with further increment of NaCl. Figure 4.14 shows decreasing
Mg ++
in relation to increase on NaCl concentrations.
Page 65
65
Error bar shows SD.
Figure 4.11 Na+
levels in banana plants grown on media containing increasing
concentrations of NaCl.
Na
0
1
2
3
4
5
6
7
8
9
0 60 80 100
NaCl concentration (mM)
Na c
on
cen
trati
on
(m
g/g
)
Page 66
66
Error bar shows SD.
Figure 4.12 Ca++
levels in banana plants grown on media containing increasing
concentrations of NaCl.
0
0.5
1
1.5
2
2.5
3
3.5
4
0 60 80 100
Ca
Co
nc
en
tra
tio
n (
mg
/g)
NaCl concentration (mM)
Ca
Page 67
67
Error bar shows SD.
Figure 4.13 K+ levels in banana plants grown on media containing increasing
concentrations of NaCl.
Page 68
68
Error bar shows SD.
Figure 4.14 Mg ++
levels in banana plants grown on media containing increasing
concentrations of NaCl.
Mg
0
0.5
1
1.5
2
2.5
3
3.5
4
4.5
0 60 80 100
NaCl concentration(mM)
Mg
Co
ncen
trati
on
(mg
/g)
Page 69
69
The increase in Ca++
, K+
and Mg++
concentrations at 60 mM NaCl compared to
the control and the decrease between the 60 and 80 mM NaCltreatment suggests it to be a
result of the plants adaptive response to increasing salt concentrations in the media.
Plantlets which were suddenly exposed to high concentrations of NaCl try to absorb these
ions at a higher rate because ratios of K+/Na
+ and Ca
++ /Na
+ affect salt tolerance of plant.
But with further increases in NaCl concentration, the plants could not withstand high
concentration of ions and probably discharged them. The capability to keep a high K+
cytosolic concentration in the face of increasing competition from Na+ is a key
determinant in salinity tolerance (Naidoo and Kift, 2006). Effect of Ca++
/Na+
and K+/Na
+
on plant salt tolerance has been explained by Yasser (2007) and Yildiz et al. (2008).
Yildiz et al. (2008) reported a higher ratio of Ca++
/Na+
and K+/Na
+ in tolerant cultivar of
strawberry. Yasser (2007) also reported that these ratios were higher in salt tolerant
genotypes of green pea.These ratios are again a useful indicator of a plants ability to
respond to salinity.
Page 70
70
CHAPTER 5
5.0 RESULTS AND DISCUSSION II
5.1 RNA Extraction
5.1.1 Comparison of RNA Quality from CTAB and Modified CTAB Methods
RNA extraction from the roots of Musa acuminata ssp. malaccensis was
conducted with CTAB (adapted from Kiefer et al., 2000) and CTAB modified methods.
Isolating good-quality and intact RNA is crucial for further applications such as RT-
PCR. High levels of phenolic compounds, carbohydrates, or other compounds that bind
and/or coprecipitate with RNA are strong barriers to high quality RNA achievement
(Salzman et al., 1999; Kansal et al., 2008). Figure 5.1, lane one shows RNA extracted
from roots with CTAB (Kiefer et al., 2000) protocol. Both 28s and 18s are detectable
and intact. The A260/280 ratio was 1.70 and A260/230 was 1.60. The low ratio of
A260/230 is because of high level of polyphenol and polysaccharide. Generally the rate
of phenolic compounds in banana is high (Titov et al., 2006). To solve this problem and
also to achieve higher purity (higher A260/280 ratio) the CTAB method was modified.
Phenol followed by Chloroform/Isoamylalcohol (C/I) plus proteinase K were used to
precipitate protein and gain higher purity. Also 4% polyvinylpyrrolidone (PVP) was
used to reduce the concentration of phenolic compounds. Figure 5.1 lane-2 shows RNA
extracted from a root sample with the CTAB modified method. The modified CTAB
method considerably enhanced the purity of RNA. The A260/280 for RNA extracted
with CTAB modified method was 1.95 and 260/230 was 2.0. Gasic et al. (2004)
reported all RNA samples with A260/280 ratio range from 1.91-2.02are considered as
pure from protein contamination. They also mentioned that RNAs with A260/230 ratio
Page 71
71
of 2.0 and higher are very pure and clean from polysaccharide and polyphenol
contamination.
Figure 5.1 Comparison of RNA extraction with modified CTAB method and
CTAB (Kiefer et al., 2000), method.
Lane 1: RNA from roots of Musa acuminata ssp. malaccensis with CTAB method
using Chloroform/Isoamylalcohol (C/I).
Lane 2: RNA from roots of Musa acuminata ssp. malaccensis with CTAB modified
method using Phenol/Chloroform/Isoamylalcohol (P/C/I). M: 1 kb ladder (Fermentas).
Viewed on, 1% Agarose gel.
Ladder 1 2
28s
1 2 M
28s
18s
18s
Page 72
72
Salzman et al. (1999) reported that using 1% of soluble PVP is sufficient for
removing phenolic compounds from plant tissues. The plant tissues used in their
experiments was from Vitis vinifera, Griffonia simplicifolia, Albizia procera, Raphanus
sativus andof Abies procera. But in this study with Musa acuminata ssp. malaccensis,
even with utilizing 2% of PVP the ratio of A260/230 was low and around 1.60 whereas
employing 4% PVP could improve the ratio of 260/230 to 2.0. The difference can be
interpreted as arising from the different type of plants.
On the other hand RNAs isolated via the CTAB modified method were enriched
in RNA smaller than 18s rRNA. As it can clearly be seen in Figure 5.1 lane-2, the bands
below 18s rRNA is distinct and visible. Even small RNAs are detectable at the lower
part of the gel.
5.1.2 RNA Extraction from Root Samples
RNA extractions from roots of plantlets from control medium (MS medium
without salt treatment) and from MS medium which was supplemented with 100 mM of
NaCl after 24 h are shown in Figure 5.2. The A260/280 for RNA from control medium
(Figure 5.2, lane-1), was 1.96 and 260/230 was 2.1 whilst For the RNA from 100 mM
concentration of NaCl (Figure 5.2, lane-2), A260/280 was 1.93 and A260/230 was 2.0.
1
Page 73
73
Figure 5.2 RNA extractions from roots of Musa acuminata ssp. malaccensis grown
in 0 mM and 100 mM NaCl.
Lane 1: RNA from roots of Musa acuminata ssp. malaccensis after 24 h on MS
medium containing 0 mM of NaCl. Lane 2: extracted RNA from roots of Musa
acuminata ssp. malaccensis after 24 h on MS medium containing 100 mM of NaCl. M:
1 kb ladder (Fermentas). Viewed on, 1% Agarose gel.
28s
18s
2
18s
28s
M 1
Page 74
74
5.2 DNase Treatment
Figure 5.3 shows banana root RNA samples before and after DNase treatment.
Lane-1 shows RNA with DNA contamination before DNase treatment. After DNase
treatment there is no visible band of DNA (Figure 5.3, lane-2).
Figure 5.3 RNAs before and after DNase treatment.
Lane 1: RNA before DNase treatment. Lane 2: RNA after DNase treatment
M: 1 kb ladder (Fermentas). Viewed on, 1% Agarose gel.
M 1 2
Page 75
75
5.3 MicroRNA Library Cloning
First-strand cDNA synthesis and PCR amplification were carried out following
the MicroRNA discovery kit (System Biosciences) instructions with adaptor ligation.
The PCR products had a size of approximatly 200bp (Figure 5.4). Figure 5.4a shows the
PCR product from non-treated root sample with size of ~200bp while Figure 5.4b shows
the PCR product from treated root sample by 100 mM of NaCl with size of ~200bp.
This result is comparable with results which were highlighted in the kit manual.
The size of amplified cDNA reported in the kit manual was around 1.80 bp. The slight
difference in the product size is normal and because of using a different type of
organism. Different animal tissues were used in the kit whereas roots of Musa
acuminata ssp. malaccensis were used in this experiment.
Mosher et al. (2009) employed mirVana miRNA isolation kit (Ambion) to
purify small RNAs. This kit was designed just for small RNAs isolation and for further
cDNA amplification it is necessary to use a different kit or conventional method. But
MicroRNA discovery kit (System Biosciences) provides all steps including adaptor
ligations, cDNA synthesis and PCR amplifications in one kit.
Page 76
76
Figure 5.4 PCR products with size of ~200bp.
A: Lane 1: negative control. Lane 2a: PCR product from non-treated sample.
B: Lane 1: negative control. Lane 2b: PCR product from NaCl treated sample.
M: 50 bp amplisize DNA ladder (Bio-Rad). Viewed on, 2.5 % Agarose gel.
200bp
100bp
50bp
200bp
100bp
50bp
M
~200bp
~ 200bp
B
1 2
M 1 2
A
M 1 2 3
Page 77
77
5.3.1Gel Extraction
Figure 5.5 shows non-specific bands of PCR products before purification. Non
specific bands were detected (~250bp and 700bp, Figure 5.5A and ~ 300bp, Figure
5.5B) while samples were run on 3% LE analytical grade Agarose with gel extraction
specific wide well. Figure 5.5A shows the PCR product from non-treated sample with
size of ~200bp. Figure 5.5B shows the PCR product from treated sample by 100 mM of
NaCl with size of ~200bp. Specific bands with size of ~200 bp were excised under UV
light and purified. After purification exact product sizes were achieved and no non-
specific bands were detected (Figure5.5.C).
5.3.2 Colony Screening
Purified PCR products with size of ~200 bp were cloned into pCR4-TOPO
vector. From the 100 μl plated, a total of 200 white colonies were produced. The titre of
The 1 ml library stock was therefor calculated to be 2000. White colonies which were
expected to carry inserted small RNA clones were screened using M13 forward and
M13 reverse primer to confirm the insert size. PCR showed the size of ~400 bp for
samples which includes the expected insert size (~200 bp) plus vector size (170 bp)
(Figure 5.6).
Page 78
78
Figure 5.4 PCR products before and after purification.
A: Lane 1: PCR product from non-treated plant RNA. Viewed on, 3% Agarose gel.
B: Lane 1: PCR product from NaCl treated sample. Viewed on, 3% Agarose gel.
C: Lane 1: PCR product from non-treated sample with size of ~200bp after purification
C: Lane 2: PCR product from treated sample by 100 mM of NaCl with size of ~200bp.
C: Viewed on, 2.5 % Agarose gel.
M: 50 bp amplisize DNA ladder (Bio-Rad).
200bp
100bp
50bp
M 1
M 1
~200bp
~200bp
700bp
300bp
200bp
100bp
50bp
300bp
200bp
100bp
50bp
A B
M 1 2 C
Page 79
79
Figure 5.5 Colony PCR screening of library.
A: Lane 1: Negative control. Lane 2-10: Non-treated samples.
B: Lane 1: Negative control. Lane 2-10: NaCl-treated samples.
M: 50 bp amplisize DNA ladder (Bio-Rad).Viewed on 1% Agarose gel.
B M 1 2 3 4 5 6 7 8 9 10
A M 1 2 3 4 5 6 7 8 9 10
500bp
400bp
400bp
Page 80
80
5.3.3 Plasmid Extraction
Plasmid of white colonies which were expected to carry the PCR products (~400
bp) was extracted using a purification kit (Qiagen). Figure 5.7 shows plasmid DNA
isolated from white colonies derived from NaCl treated banana plantlet cDNA library.
Figure 5.6 Isolated plasmids of white colonies derived from NaCl treated banana
Plantlet cDNA library.
Lane 1-10: plasmids isolated from white colonies.
M: 1 kb DNA ladder (Fermentas). Viewed on, 1% Agarose gel.
1 kb 1 2 3 4 5 6 7 8 9 10
1kb M 1 2 3 4 5 6 7 8 9 10
10000bp
6000bp
5000bp
3000bp
Page 81
81
5.4 Sequence Data Analysis
Two miRNA libraries from salt-stressed and non-salt stressed banana root
samples were constructed. A total of 50 white colonies, 5 from none stressed sample as
a control and 45 from salt-stressed samples which had been confirmed to have inserted
sequences via PCR were selected for plasmid extraction and sequencing. Nucleotide
BLAST was used in this study for data analysis. Nucleotide collection (nr/nt) was used
to search for all potential stress related miRNA precursors and gene sequences.
Nucleotide collection (nr/nt) is a non redundant data base and contains all Gene Bank
and PDB sequences except Expressed Sequence Tags, Sequence Tagged Sites, Genomic
Survey Sequences and unfinished High Throughput Genomic Sequences (Gustave and
Janet, 2009). EST is a short sub-sequence of a transcribed cDNA sequence and Plant
EST was used to search for all potential stress related gene sequences in plants.
5.4.1 Results of Data Analysis against Nucleotide Collection (nr/nt)
DNA sequences from the selected library clones (45, salt stressed samples and 5
controls) with length range 180-250 were analyzed using BLAST against the non-
redundant nucleotide database (http://blast.ncbi.nlm.nih.gov/Blast.cgi). One sequence
(clone-12 sequence of miRNA library clones), showed high similarity (91%) with the
identity score of 108/119 to the precursor of microRNA 393 from Oryza sativa
Japonica (Figure 5.8) (Appendix N). No significant matches were found for miRNA
precursor or stress related gene sequences for the other sequences.
Page 82
82
Figure 5.7 Nucleotide collection (nr/nt) blast alignments for clone-12
Page 83
83
5.4.2 Results of Data Analysis against Plant EST
(http://www.ncbi.nlm.nih.gov/genomes/PLANTS/PlantESTBLAST.shtml)
DNA sequences from the selected library clones (45, salt stressed samples and 5
controls) with length range 180-250 were analyzed using BLAST against the NCBI
plant EST database. From the EST database results three different types of gene
sequences were found, salt stress, drought stress and BAP treated related gene
sequences. Salt stress associated genes found in this study were included AJ853689.1,
EX452105.1, EX451719.1, EX451695.1, EX451687.1, EX451718.1, EX451698.1,
EX451678.1, EX451675.1, EX451663.1, EX451650.1, AJ853684.1and AJ853637.1
from Oryza sativa indica, CF332208.1, CF332014.1, CF331927.1, CF331207.1,
CF331108.1, CF330429.1, CF330199.1, CF330169.1, CF329645.1, CF328946.1,
CF328814.1, CF328813.1, CF328430.1, CF328176.1, CF327316.1 and CF326953.1
from Oryza sativa Japonica and AU312469.1from Hordeum vulgare.
Salt stress related gene sequences from the small RNA library included clone-1,
clone-16 ,clone-25 , clone-32, clone-33, and clone-39 (Appendix O) and drought stress
related gene sequences were included clone-16, clone-25, clone-28, clone-32 and clone-
39 (Appendix O). Clone-1 showed 86% similarity (identity score of 181/212) to
AJ853689.1 from Oryza sativa (Indica cultivar-group) salt stress associated EST
(Figure 5.9) and EST AU312469.1 with identity score of 165/193 from a salt stressed
cDNA library from root of Hordeum vulgare (Figure 5.10). No matches to any salt
stress related EST (AJ853689.1 and AU312469.1) were observed for sequences from
control samples. Figure 5.11 shows the conserved regions of the sequence from clone-1
with AJ853689.1 and AU312469.1. High similarity between the salt stress related gene
from Oryza sativa and Hordeum vulgare to Musa acuminata ssp. malaccensis (clone-1
Page 84
84
sequence of miRNA library clones) would support that it is a homologue of this
sequence however, there is no function assigned to this sequence at this time. Clone-16
showed 99% similarity (identity score of 119/121) to EST EX452105.1, EX451719.1,
EX451695.1 and EX451687.1 (Figure 5.12A) and 98% similarity (identity score of
118/121) to EST EX451718.1, EX451698.1, EX451678.1, EX451675.1, EX451663.1
and EX451650.1 from Oryza sativa (Indica cultivar group) salt stress library (Figure
5.12B). Clone-25, clone-33 and clone-39 showed high similarity, respectively 99%
(identity score of 88/89), 91 % (identity score of 80/88) and 99% (identity score of
109/110) to AJ853684.1 from Oryza sativa (Indica cultivar-group) salt stress associated
EST (Figure 5.13). Clone-39 also showed 89 % (identity score of 103/115) similarity to
AJ853637.1 from Oryza sativa (Indica cultivar-group) salt stress associated EST gene
(Figure 5.14). Clone-32 showed high (99%) similarity to EST CF330848.1 and
CF330239.1 (Figure 5.15A) and 98% similarity to EST CF332208.1, CF332014.1,
CF331927.1, CF331207.1, CF331108.1, CF330429.1, CF330199.1, CF330169.1,
CF329645.1, CF328946.1, CF328814.1, CF328813.1, CF328430.1, CF328176.1,
CF327316.1 and CF326953.1 (Figure 5.15B) from Oryza sativa Japonica Rice callus
plasmid cDNA library. High similarity of the salt stress related gene from Oryza sativa
to Musa acuminata ssp. malaccensis (clone-16, clone-25, clone-32, clone-33 and clone-
39) would support that it is a homologue of this sequence however, there is no function
assigned to these sequences at this time. Presence of drought stress related genes in a
salt stress derived library is not unexpected as salt stress has an effect on plant water
uptake. Inhibition of root water uptake capacity is one of the primary responses of plants
to salt stress (Boursiac et al., 2005). The ability of plants to take up water is reduced
under high salinity conditions and this rapidly causes reductions in growth rate, along
with a suite of metabolic changes identical to those caused by water stress (Munns
2002).
Page 85
85
Sequence entry CI308356 from Oryza sativa (Japonica cultivar-group) BAP
treated callus was annotated as a BAP treated related gene sequence. Amongst the other
sequences from the miRNA library, clone-3 sequence of miRNA library clones showed
the highest similarity to EST CI308356 (Japonica cultivar-group) from BAP treated
callus (98%: Figure 5.16) (Appendix O). Appearance of BAP related gene sequences in
the library can be justified as the plantlets were grown in the presences of BAP in MS
medium before they were placed under stress conditions. BAP related gene sequences
also were detected from the control sequenced clones.
Page 86
86
Figure 5.8 EST alignment results for clone- 1.
Figure 5.9 ESTalignment results for clone-1.
Page 87
87
Figure 5.10 Clustal W multiple alignments: Clone-1, AJ853689 and AU312469.
Page 88
88
A
B
Figure 5.11 EST alignment results for clone-16.
Page 89
89
A
B
C
Figure 5.12 EST alignment results for clone-25(A), clone-33 (B) and clone-39(C).
Page 90
90
Figure 5.13 EST alignment results for clone-39.
Page 91
91
A
B
Figure 5.14 EST alignment results for clone-32.
Page 92
92
Figure 5.15 EST alignment results for clone-3.
Page 93
93
5.4.3 Results of Analysis Based on Known microRNA Genes Related to Salt Stress
A total of 50 white colonies from salt-stressed (45 clones) and non salt-stressed
(5 control clones) banana root miRNA libraries were sequenced. A list of mature
miRNA sequences related to salt stress were obtained from miRBase. An alignment
strategy was engaged to find candidate mature miRNA from Musa acuminata ssp.
malaccensis among the sequenced library clones as used by Zhang et al. (2009).
Sequences were aligned with three miRNA families, miR393, miR397, miR402 which
were reported to be related to abiotic stresses including salt stress (Sunkar and Zhu,
2004; Liu et al., 2008; Sunkar, 2010). Table 5.1 shows members of miR393, miR397,
miR 402 families (http://www.mirbase.org).
Plant miRNAs are conserved in their mature miRNA sequences, rather than the
complete precursor sequences (Zhang et al., 2006c). According to Qiu et al., (2007) and
Wang et al., (2007) miRNA sequences with 85% (3 mismatches) similarity to registered
miRNA from database can be considered as new miRNAs. Wang et al. (2007) reported
identification of miRNA by allowing a maximum three mismatches with their
homologues in Arabidopsis or rice. Also some other reports (Cheng Xiang Qiu et al.,
2007; Wang et al., 2007; Xie et al., 2007a), have emphasized a maximum three
mismatches are allowed (85 % similarity to registered database) for prediction of mature
miRNA from previously known plant mature miRNAs.
Page 94
94
Table 5.1 : MicroRNA family (miR393, miR397, mi402) sequences from miRBase
(http://www.mirbase.org).
No MicroRNA Family Sequence Size 1 >ath-miR393aMIMAT0000934 UCCAAAGGGAUCGCAUUGAUCC 22n 2 >ath-miR393bMIMAT0000935 UCCAAAGGGAUCGCAUUGAUCC 22n
3 >bna-miR393MIMAT0004447 UCCAAAGGGAUCGCAUUGAUC 21n
4 >ghr-miR393MIMAT0014334 UCCAAAGGGAUCGCAUUGAUCU 22n
5 >gma-miR393MIMAT0007362 UCCAAAGGGAUCGCAUUGAUC 21n
6 >mtr-miR393MIMAT0001647 UCCAAAGGGAUCGCAUUGAUC 21n
7 >mtr-miR393bMIMAT0011087 UCCAAAGGGAUCGCAUUGAUC 21n
8 >osa-miR393MIMAT0000957 UCCAAAGGGAUCGCAUUGAUC 21n
9 >osa-miR393bMIMAT0001078 UCCAAAGGGAUCGCAUUGAUCU 22n
10 >ptc-miR393aMIMAT0002015 UCCAAAGGGAUCGCAUUGAUC 21n
11 >ptc-miR393bMIMAT0002016 UCCAAAGGGAUCGCAUUGAUC 21n 12 >ptc-miR393cMIMAT0002017 UCCAAAGGGAUCGCAUUGAUC 21n
13 >ptc-miR393dMIMAT0002018 UCCAAAGGGAUCGCAUUGAUC 21n
14 >rco-miR393MIMAT0014186 UCCAAAGGGAUCGCAUUGAUC 21n
15 >sbi-miR393MIMAT0001426 UCCAAAGGGAUCGCAUUGAUC 21n
16 >sbi-miR393bMIMAT0011348 UCCAAAGGGAUCGCAUUGAUC 21n
17 >vvi-miR393aMIMAT0006557 UCCAAAGGGAUCGCAUUGAUC 21n
18 >vvi-miR393bMIMAT0005708 UCCAAAGGGAUCGCAUUGAUC 21n
19 >zma-miR393aMIMAT0001747 UCCAAAGGGAUCGCAUUGAUCU 22n
20 >zma-miR393bMIMAT0013999 UCCAAAGGGAUCGCAUUGAUCC 22n
21 >zma-miR393cMIMAT0014000 UCCAAAGGGAUCGCAUUGAUCU 22n
No Micro RNA family Sequence Size 1 >ath-miR397aMIMAT0000946 UCAUUGAGUGCAGCGUUGAUG 21n 2 >ath-miR397bMIMAT0000947 UCAUUGAGUGCAUCGUUGAUG 21n 3 >bdi-miR397MIMAT0012180 UCAUUGAGUGCAGCGUUGAUG 21n 4 >bna-miR397aMIMAT0005600 UCAUUGAGUGCAGCGUUGAUGU 22n 5 >bna-miR397bMIMAT0005601 UCAUUGAGUGCAGCGUUGAUGU 22n 6 >osa-miR397aMIMAT0000980 UCAUUGAGUGCAGCGUUGAUG 21n 7 >ptc-miR397aMIMAT0002038 UCAUUGAGUGCAGCGUUGAUG 21n 8 >ptc-miR397cMIMAT0002040 UCAUUGAGUGGAGCUUUGAUG 21n 9 >sbi-miR397MIMAT0011359 UCAUUGAGUGCAGCGUUGAUG 21n 10 >vvi-miR397aMIMAT0006561 UCAUUGAGUGCAGCGUUGAUG 21n 11 >vvi-miR397bMIMAT0006562 UCAUUGAGUGCAGCGUUGAUG 21n 12 >zma-miR397aMIMAT0014018 UCAUUGAGCGCAGCGUUGAUG 21n 13 >zma-miR397bMIMAT0014019 UCAUUGAGCGCAGCGUUGAUG 21n 14 >rco-miR397MIMAT0014193 UCAUUGAGUGCAGCGUUGAUG 21n
No Micro RNA family Sequence Size 1 >ath-miR402MIMAT0001003
UUCGAGGCCUAUUAAACCUCUG
22n
Page 95
95
From the Clustal W alignment and miRBase search results only one clone
(Clone-12 sequence of miRNA library clones) out of 45 sequenced library clones
showed more than 85% similarity to a known stress related miRNA. Clone-12 included
the 22 nt fragment (5’ UCCAAAAGAAUCGCAUUGAUCC 3’) with 90.9 % similarity
(two mismatches) to ath-miR393 and ath-miR393a (from Arabidopsis thaliana) and
zma-miR393b (from Zea mays), as shown in Table 5.2.
Within this potential mature miRNA sequence (clone-12) is a shorter 21nt
sequence (5’ UCCAAAAGAAUCGCAUUGAUC 3’) also reported for some miRNA
from the same family (Table 5.1). Both 22 nt and 21 nt sequences are possible
candidates for the miR393 in Musa acuminata ssp. malaccensis (Figure 5.17). The 21 nt
sequence from clone-12 also showed two mismatches) with bna-miR393.(from Brassica
napus), gma-miR393 (from Glycine max), mtr-miR393, mtr-miR393b (from Medicago
truncatula), osa-miR393 and (from Oryza sativa), ptc-miR393a, ptc-miR393b, ptc-
miR393c, ptc-miR393d (from Populus trichocarpa), rco-miR393 (from Ricinus
communis) sbi-miR393, sbi-miR393b (from Sorghum bicolor), vvi-miR393 and vvi-
miR393b (from Vitis vinifera) (Table 5.2). Also clone-12 showed 86.4 % similarity (3
mismatches) to ghr-miR393 (from Gossypium hirsutum), osa-miR393b (from Oryza
sativa), zma-miR393a and zma-miR393c (from Zea mays). Figure 5.18, 5.19 and 5.20
show Clustal W alignments of clone-12 with miRNA from miRBase. From the Clustal
W alignment and miRBase search results, no significant matches were seen (less than
three mismatches) also for miRNA related to 397 and 402 families and also other kind
of stresses such as cold, drought and dehydration.
Page 96
96
Clone-12 sequence of miRNA library clones.
AAGCAGTGGTTATCAACGCAGAGTCGTGTGGATTCGATGGGGAAGCATCCA
AAAGAATCGCATTGATCCTTCAAAGCTCTCGCTCGCTTCCATGGCGGTCGTC
GCCTTTCTACAAGCAGTCTTGACGGATCATGCGATCCTTTTGGATTGCTTCCT
TATCTGGGCGTCACGCACTCTGCGTTGATACCACTGCTT
Clone-12 sequence of miRNA library clones.
AAGCAGTGGTTATCAACGCAGAGTCGTGTGGATTCGATGGGGAAGCATCCA
AAAGAATCGCATTGATCCTTCAAAGCTCTCGCTCGCTTCCATGGCGGTCGTC
GCCTTTCTACAAGCAGTCTTGACGGATCATGCGATCCTTTTGGATTGCTTCCT
TATCTGGGCGTCACGCACTCTGCGTTGATACCACTGCTT
Figure 5.16 Shows two possible miR393 sequences of clone-12. Possible candidate
mature miRNA sequences are highlighted.
Page 97
97
Table 5.2 : Similarity of clone-12 sequence of miRNA library clones to miR393
family from miRBase.
NO Micro RNA Similarity To
Original MicroRNA
From miRBase
Micro RNA sequence
Size
12 ath-miR393a 20/22 UCCAAAAGAAUCGCAUUGAUCC 22n ath-miR393b 20/22 UCCAAAAGAAUCGCAUUGAUCC 22n bna-miR393 19/21 UCCAAAAGAAUCGCAUUGAUC 21n ghr-miR393 19/22 UCCAAAAGAAUCGCAUUGAUCC 22n gma-miR393 19/21 UCCAAAAGAAUCGCAUUGAUC 21n mtr-miR393 19/21 UCCAAAAGAAUCGCAUUGAUC 21n mtr-miR393b 19/21 UCCAAAAGAAUCGCAUUGAUC 21n osa-miR393 19/21 UCCAAAAGAAUCGCAUUGAUC 21n osa-miR393b 19/22 UCCAAAAGAAUCGCAUUGAUCC 22n ptc-miR393a 19/21 UCCAAAAGAAUCGCAUUGAUC 21n ptc-miR393b 19/21 UCCAAAAGAAUCGCAUUGAUC 21n ptc-miR393c 19/21 UCCAAAAGAAUCGCAUUGAUC 21n ptc-miR393d 19/21 UCCAAAAGAAUCGCAUUGAUC 21n rco-miR393 19/21 UCCAAAAGAAUCGCAUUGAUC 21n sbi-miR393 19/21 UCCAAAAGAAUCGCAUUGAUC 21n sbi-miR393b 19/21 UCCAAAAGAAUCGCAUUGAUC 21n vvi-miR393a 19/21 UCCAAAAGAAUCGCAUUGAUC 21n vvi-miR393b 19/21 UCCAAAAGAAUCGCAUUGAUC 21n zma-miR393a 19/22 UCCAAAAGAAUCGCAUUGAUCC 22n zma-miR393b 20/22 UCCAAAAGAAUCGCAUUGAUCC 22n zma-miR393c 19/22 UCCAAAAGAAUCGCAUUGAUCC 22n
Page 98
98
Figure 5.17 Alignment results via Clustal W for microRNA 393 family: ath-
miR393a, ath-miR393b and zma-miR393b. Clone-12.
Page 99
99
Figure 5.18 Alignment results via Clustal W for microRNA 393 family: bna-miR393,
gma-miR393, mtr-miR393, mtr-miR393b, osa-miR393, ptc-miR393a, ptc-miR393b, ptc-
miR393c, ptc-miR393d, rco-miR393, sbi-miR393, sbi-miR393b, vvi-miR393a, and vvi-
miR393b. Clone-12.
Page 100
100
Figure 5.19 Alignment results via Clustal W for microRNA 393 family: ghr-
miR393, osa-miR393b, zma-miR393a and zma-miR393c.Clone-12.
Page 101
101
The Secondary structures with minimal folding free energies (MFEs) of sample-
12 were predicted and generated using MFold (Zuker, 2003). Figure 5.21shows the
predicted stem-loop structures of miRNA 393 precursor. Any candidate sequence for
mature miRNA should be able to fold into a hairpin structure and also should contain
the ~22 nt mature miRNA sequence in one arm of the hairpin (Ambros et al., 2003).
The result of this part of study showed clone-12 sequence was able to perform hairpin
structure contained 22 mature miRNA sequence in one arm. Ambros et al. (2003)
mentioned that the fold back structure should not contain large internal loops or bulges,
which have not seen from hairpin structure of precursor of miR393 which was reported
in current study. Also calculated A+U content for miR 393 with 22 nt was 59 % and for
miR 393 with 21 nt was 62% which were higher than G+C contents. According to
Zhang et al (2006c) mature miRNAs contain more A+U nucleotides than G+C.
Table 5.3 : Specifications of two possible candidates of mac-miR393.
MicroRNA
Gene
miRNA Sequence
(5´→3´)
Fold back Length
mac-miR393 UCCAAAAGAAUCGCAUUGAUCC Yes 22n
mac-miR393 UCCAAAAGAAUCGCAUUGAUC Yes 21n
Page 102
102
Figure 5.20 Predicted stem-loop structures of Musa 393 miRNAs precursor. The
mature miRNAs are indicated by red color.
Page 103
103
5.4.4 Target prediction for miR393 Musa acuminata ssp. malaccensis
The sequence of mature mac-miR393 (for both 21 nt and 22 nt sequences) was
input into psRNA Target (http://bioinfo3.noble.org/psRNATarget/) (Dai et al., 2010)
and searched against a banana ESTdatabase. One putative target sequence with a score
of ≤ 3 for miR393 was predicted (Table 5.4). Xie and Zhang (2010) considered the
following special characteristics in alignments and filtering results, ≤ 4 mismatches
between the miRNA and its targets, ≤ 2 consecutive mismatches in the alignment
region, no mismatches between bases 10-11, and ≤ 1 mismatch from bases 1-9. The
psRNATarget result showed no mismatches between bases 10-11 and also no bases
from 1-9. This target is specific for banana and has not reported for miR393 from other
plant before.
Table 5.4 : Target prediction for mac-miR 393
Note: The banana EST data are from a UM project led by Prof. Rofina Yasmin Othman and contains
different data including banana virus sequences and are part of the data available to the Global Musa
Genomics Consortium (http://www.musagenomics.org/).
Micro RNA Banana EST ID Target description Expectati
on
Plant
mac-miR393 600103026T13 Not annotated 3 Banana
Alignment result :
Page 104
104
CHAPTER 6
6.0 CONCLUSION
In the present study two main objectives were followed. Firstly, the minimal
inhibitory sodium chloride (NaCl) concentration for survival of banana (Musa.
acuminata ssp. mallancencis) was determined. Secondly, a small RNAs library was
established from salt-stressed banana plants. This library was used for identification of
potential, salt stress associated genes from Musa acuminata ssp. mallancencis. These
included homologues of Oryza sativa and Hordeum vulgare salt stress related gene
sequences (ESTs) and a candidate miR393 (mac-miR393) which is a salt stress related
microRNA, reported from other plants species.
A total of 10 different NaCl concentrations were used (60, 80, 100, 120, 140,
160,180, 200 and 220 mM) and 120 mM was determined as the lethal concentrations.
All examined plantlets were died at 120 mM of NaCl. Although saline conditions of up
to100 mM imposed severe damage to plantlets but, plants survived and 100 mM of
NaCl was determined to be a minimal inhibitory sodium chloride (NaCl) concentration
for survival of (Musa acuminata ssp. malaccensis).
Total RNA was extracted from salt-stressed banana plants with a modified CTAB
method. Subsequently small RNA was isolated and converted to cDNA using
MicroRNA discovery kit (System Biosciences). PCR products with size of
approximately 200 bp were cloned to PCR 4-TOPO cloning kit (Invitrogen) and white
colonies were selected. Plasmids of white colonies which were confirmed to have an
insert were extracted and 50 were sent for sequencing. A total of 50 sequences (45
Page 105
105
samples plus 5 controls) were compared against EST databases using BLAST. Three
different types of gene sequences (Salt stress, drought stress and BAP treated related)
were found, with high similarity to salt stress related gene from Oryza sativa and
Hordeum vulgare, drought stress and BAP treated related from Oryza sativa. Therefore
it is suggested these small RNA library clones may be homologues from Musa
acuminata ssp. malaccensis. Also mac-miR393 was found as a potential salt stress
related miRNA homologue in Musa acuminata ssp. malaccensis.
There are some suggestions for improving the data. Performing high throughput
sequencing of small RNA was used and suggested by Barakat et al. (2007), Fahlgren et
al. (2007), Yao et al. (2007), Sunkar et al. (2008) and Liang et al. (2010), for miRNA
identification in plants. In the current study high throughput sequencing was not
performed because of high cost and limited budget. The whole constructed salt stress
small RNA contained an estimated 2000 recombinant clones however; only 45 colonies
were sequenced and studied in this work. There are possibilities to find new miRNA
candidate if more library clones are sequenced, Furthermore newly identified miRNA
can be studied to identify targets and gene expression.