Chapter 1 Economic Geography: An Introduction • Geographic Perspectives • Economic Geography of the World Economy • Globalization • World Development Problems • Four Major Questions of the World Economy • Political Economies • Geographical Information Systems
Transcript
Chapter 1 Economic Geography:An Introduction
• Geographic Perspectives
• Economic Geography of the World Economy
• Globalization
• World Development Problems
• Four Major Questions of the World Economy
• Political Economies
• Geographical Information Systems
Geographic Perspectives
• Barney Warf’s Style: anything goes
• The geographic perspective
• Key Point: Why are activities located where they are? Space and time are interdependent
• Geographic Perspectives: Fig 1.1, Fig 1.2
Economic space is highly unequal
Economic Geography as a field
Figure 1.1 Cartogram of GNPAreas are NOT proportional to population Area looks
too large
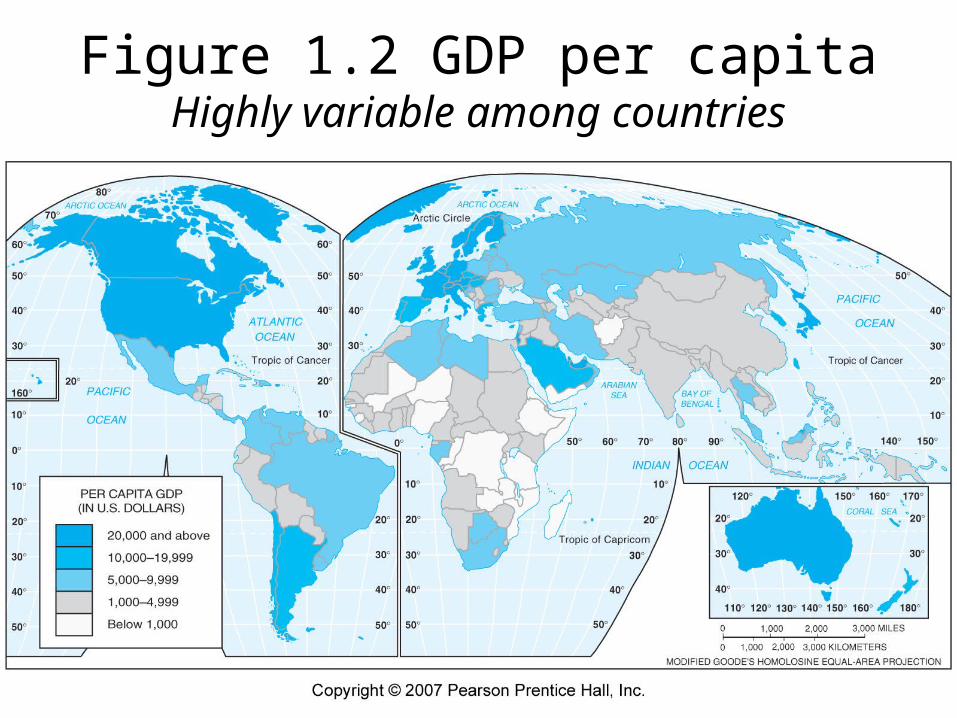
Figure 1.2 GDP per capitaHighly variable among countries
Geographic Perspectives – Economic Geography
• Different paradigms abound in economic geography– Logical positivism, use of scientific method
(development of hypotheses, data collection, and development of predictive models
– Predominant approach to location theory and models of spatial interaction, representation of spatial structures, based on “homo economicus” –
– Other approaches: behavioral, humanist, structuralist, post-structuralist & the “cultural turn”
Economic Geography of the World Economy
• The global perspective – an interdependent network of people and industries linked in a dynamic system of resource distribution, wealth creation, and power structures
• Shifting technologies, geopolitical forces, transportation and IT, culture, environment
• Transport & communication cost reductions• Fall of centrally planned economies• Rise of global capital markets• Rise of institutions such as World Bank, IMF,
WTO, OPEC, OECD….
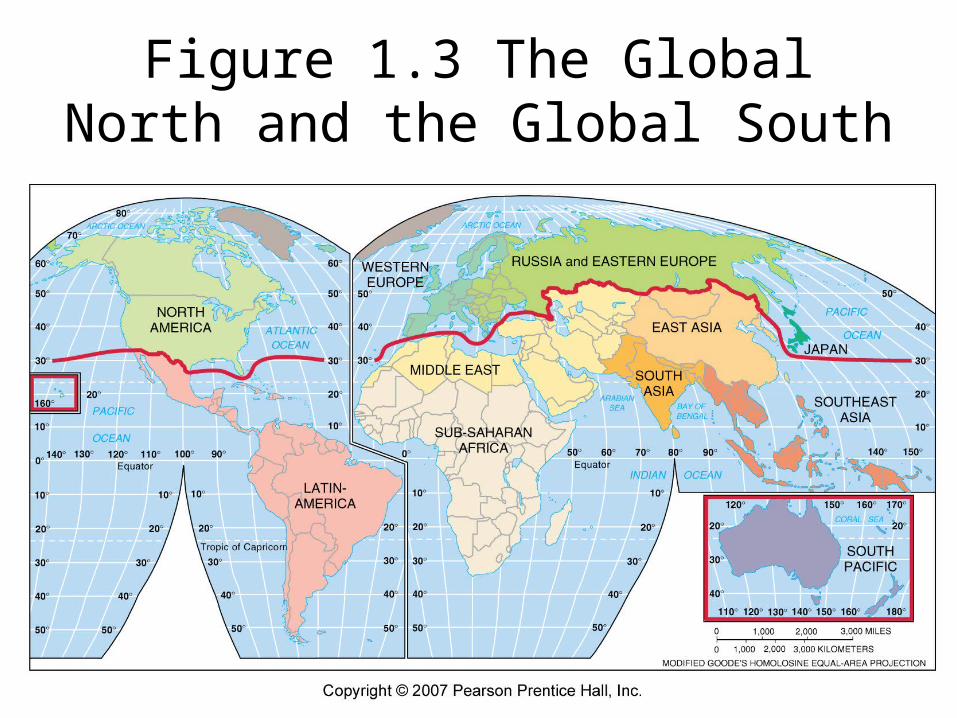
Figure 1.3 The Global North and the Global South
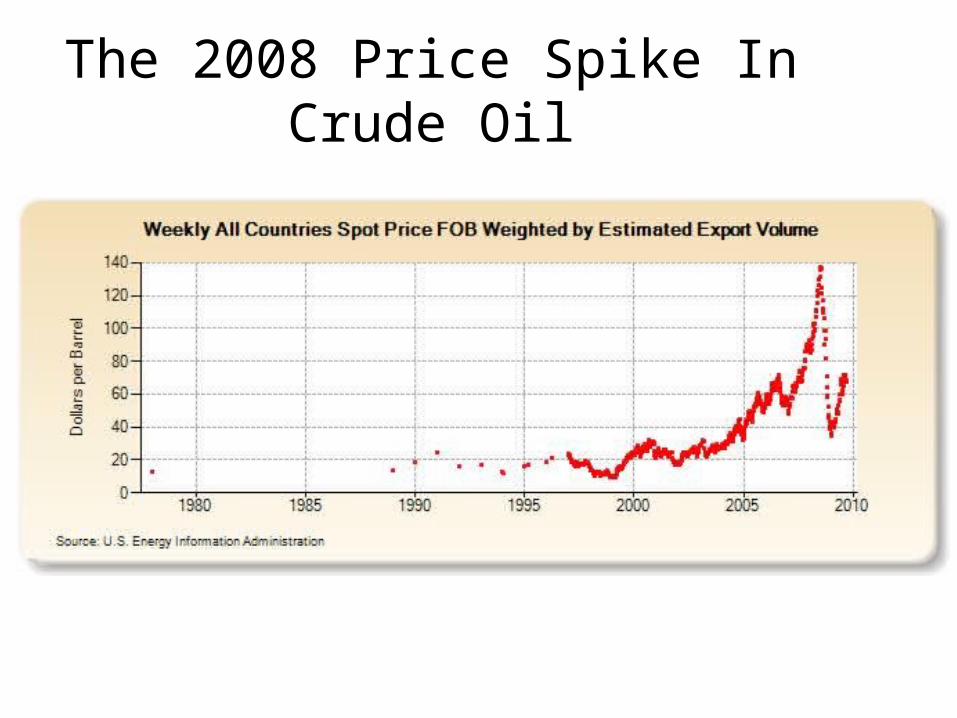
Crude Oil – OPEC & Recent TrendsPrice Spike
2008 2010 now
$140 Peak
$769/15/10
Recent Oil Prices from WTRG.com
The 2008 Price Spike In Crude Oil
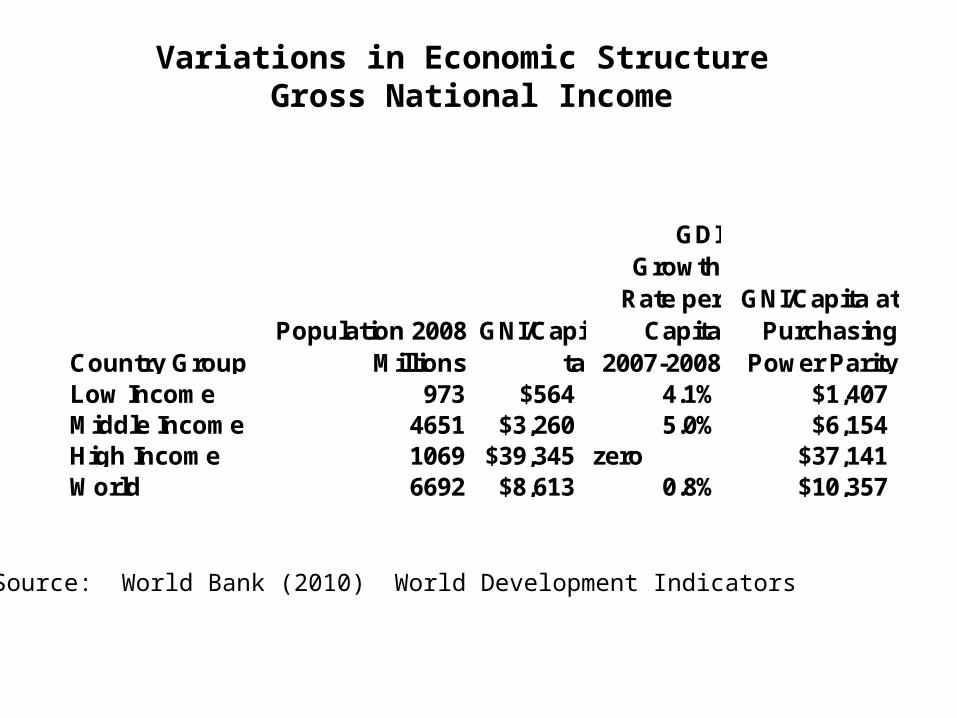
Variations in Economic Structure Gross National Income
Source: World Bank (2010) World Development Indicators
Country GroupPopulation 2008
MillionsGNI/Capi
ta
GDI Growth
Rate per Capita
2007-2008
GNI/Capita at Purchasing
Power ParityLow Income 973 $564 4.1% $1,407Middle Income 4651 $3,260 5.0% $6,154High Income 1069 $39,345 zero $37,141World 6692 $8,613 0.8% $10,357
Global Shares of Population and Gross National Income (2008)
16%
70%
15%
73%
26%
1%
0% 10% 20% 30% 40% 50% 60% 70% 80%
High Income
Middle Income
Low Income
GNI
Population
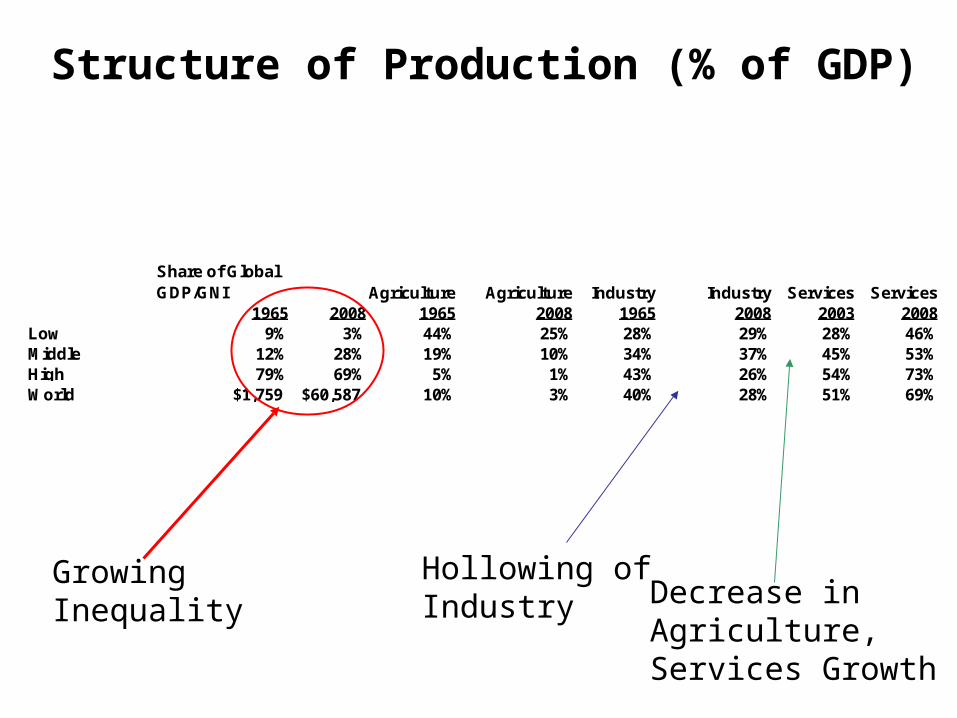
Structure of Production (% of GDP)
Growing Inequality
Hollowing ofIndustry Decrease in
Agriculture, Services Growth
Share of Global GDP/GNI Agriculture Agriculture Industry Industry Services Services
• P.9 “processes that make the world, its economic system, and its society more uniform, more integrated, and more interdependent.” Some dispute uniform
• Elements: culture, consumption, telecommunications, economy, transnational corporations, investment, labor, services, tourism. Role of IT.
• Globalization & Local Diversity
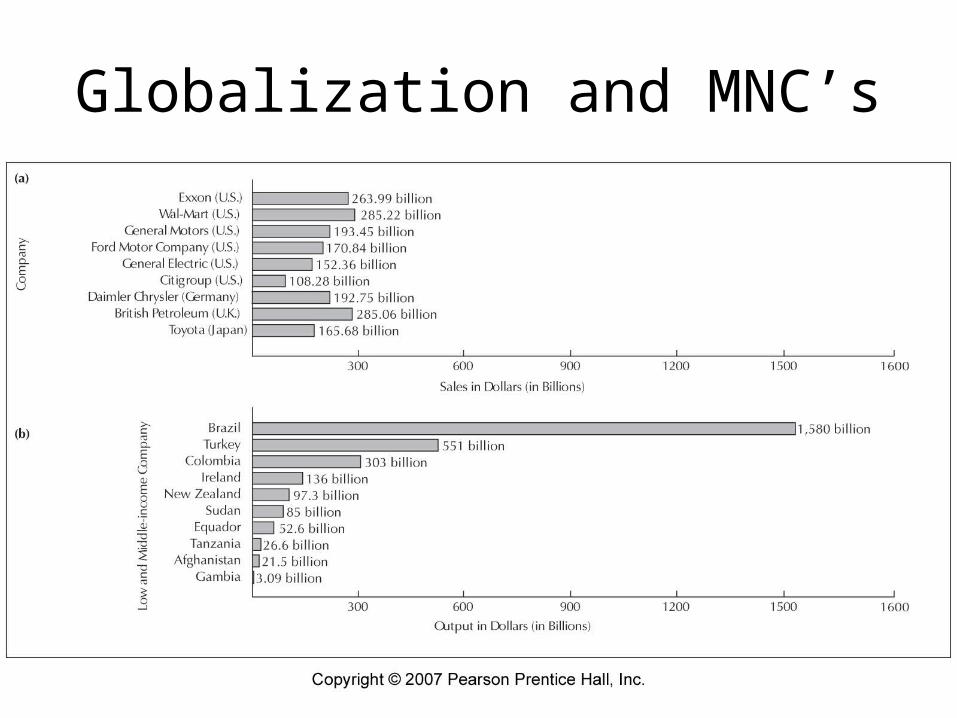
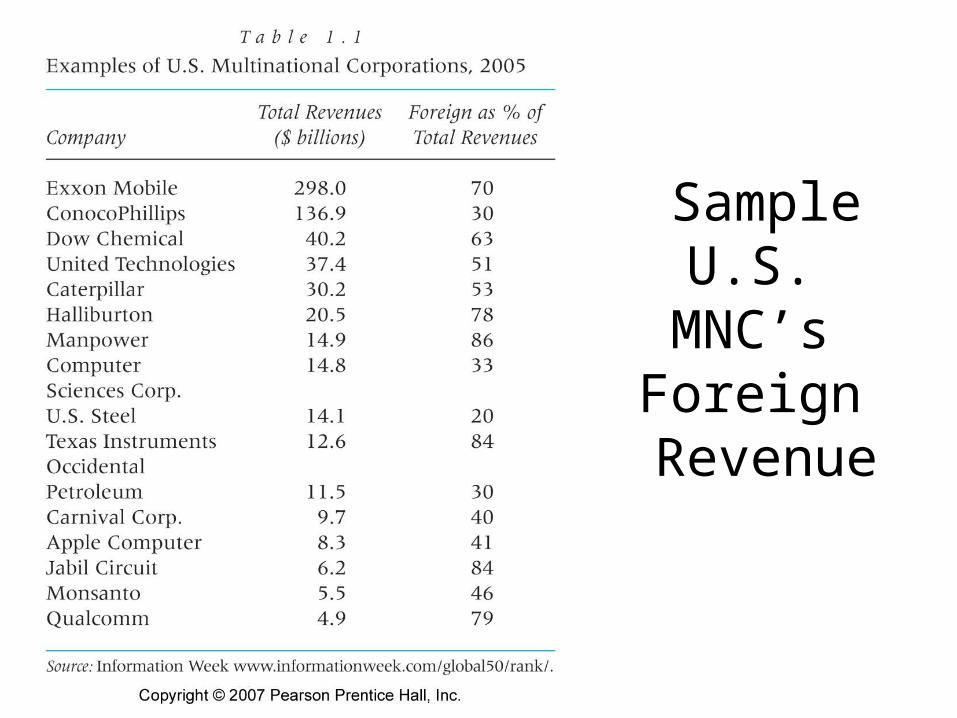
Globalization and MNC’s
SampleU.S.
MNC’s Foreign Revenue
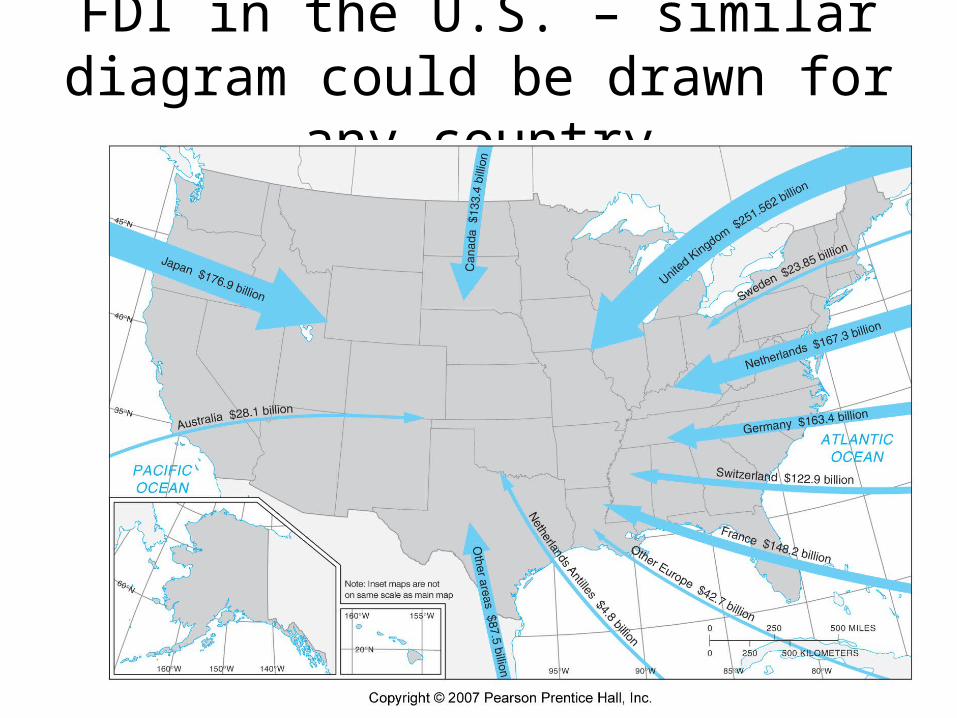
FDI in the U.S. – similar diagram could be drawn for any country
Another view of FDI
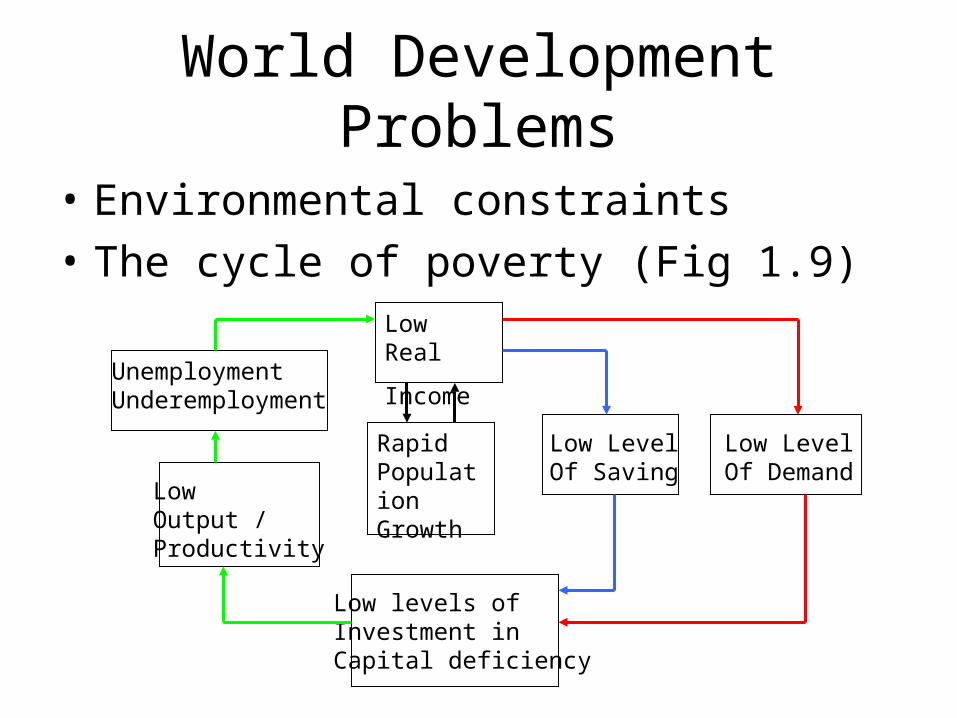
World Development Problems
• Environmental constraints
• The cycle of poverty (Fig 1.9)Low Real
IncomeUnemploymentUnderemployment
LowOutput /Productivity
RapidPopulationGrowth
Low LevelOf Saving
Low LevelOf Demand
Low levels ofInvestment inCapital deficiency
Four Major Questions of the World Economy
• What should be produced, at what scale of output, and with what mix of inputs?
• How should factors be combined? Labor, capital, resource factors, etc.
• Where should production occur?
• Who should get output? How should it be divided?
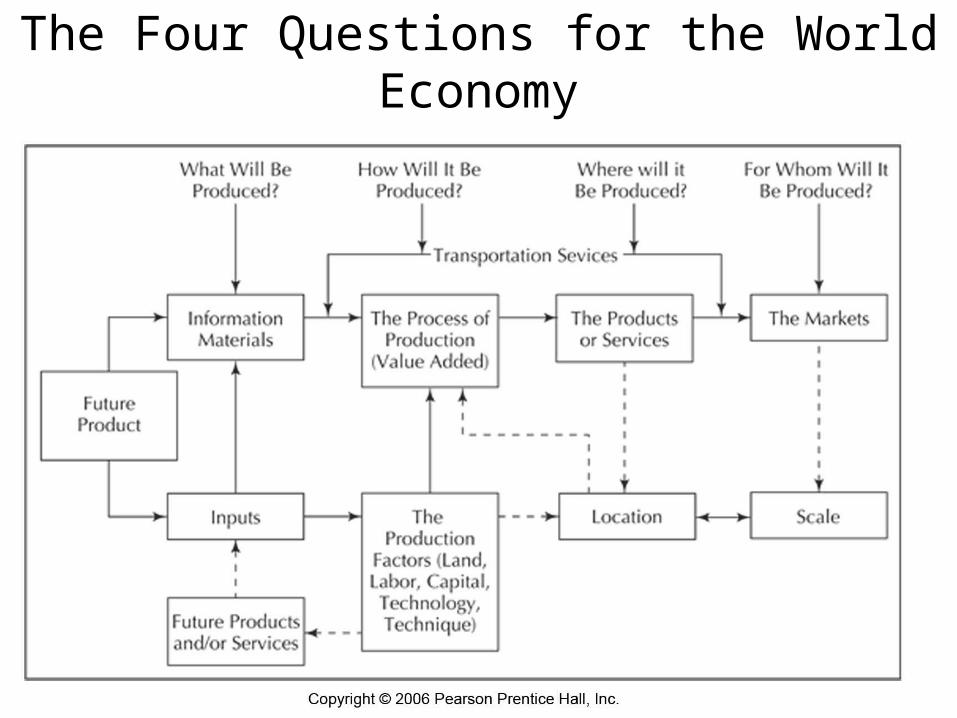
The Four Questions for the World Economy
Economics – Key Topics• Allocation of Scarce Resources• Markets for Production, Distribution, and
Consumption• The Division of Labor• Solving What, How, What Price, What
Quantity, and Where Production Takes Place
• Types of Economic Systems• Neoclassical versus Behavioral and
Structural Approaches
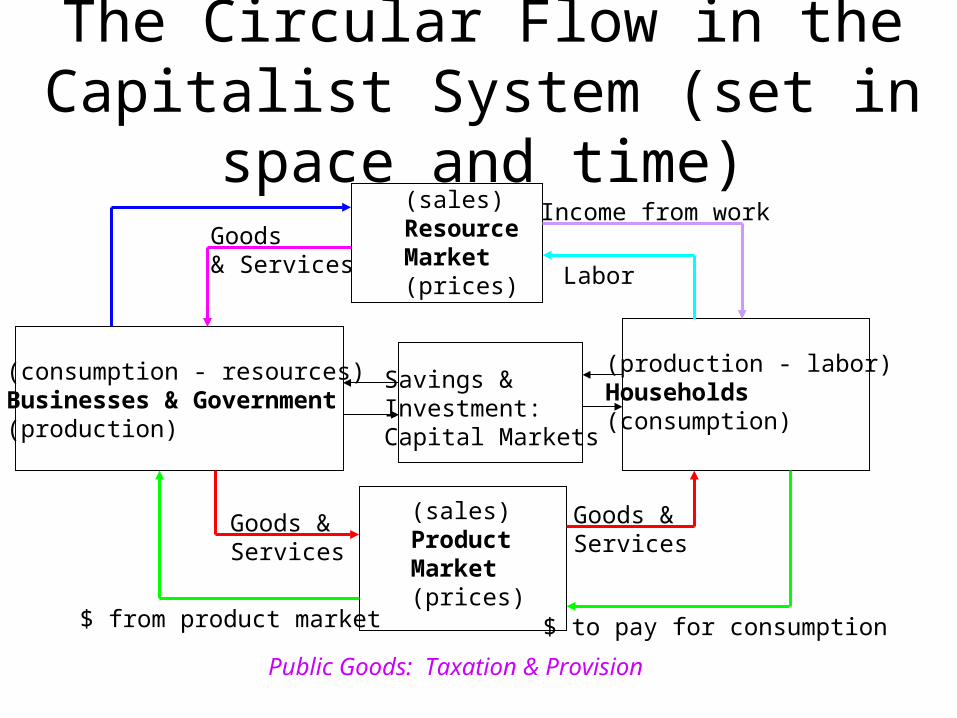
Political Economies
• Alternative Systems: capitalism, command, and traditional – with systems of power & class that shape output
• Capitalist System (Fig 1.11)• Command Economies• Traditional economies• The general demise of command and
traditional economies in the face of globalization
The Circular Flow in the Capitalist System (set in space and time)
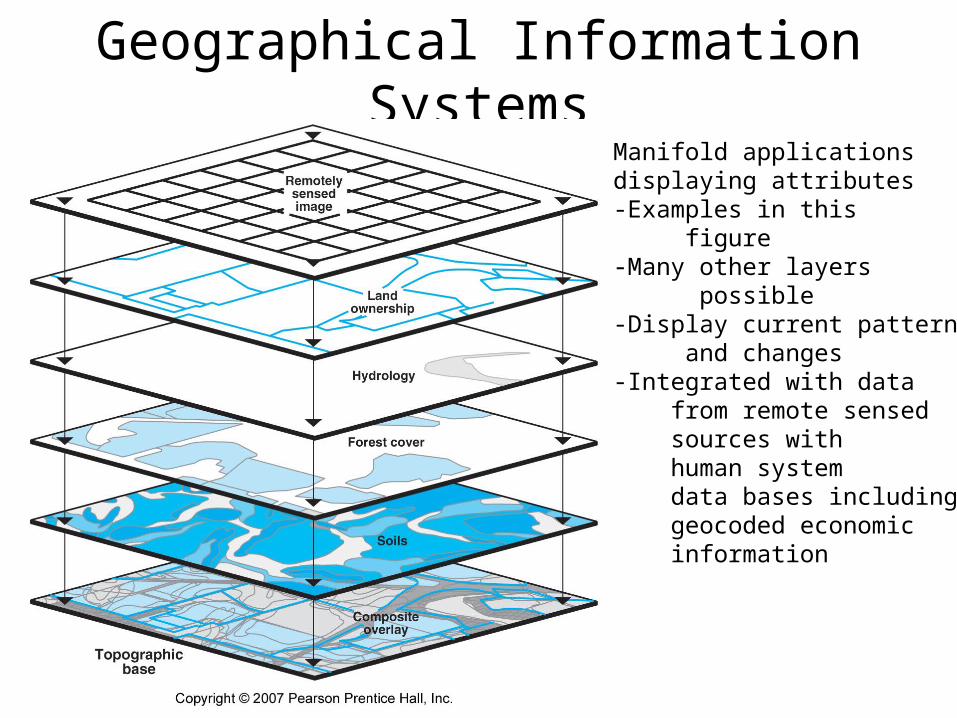
Geographical Information SystemsManifold applicationsdisplaying attributes-Examples in this figure-Many other layers possible-Display current patterns and changes-Integrated with data from remote sensed sources with human system data bases including geocoded economic information
Summary and Plan
• The chapter plan
• Learning objectives at beginning of each chapter