Page 1
Chapter 1 Functions and Graphs
224 Copyright © 2014 Pearson Education, Inc.
100. 2 2 2 22 1 2 1
2 2
( ) ( ) (1 7) ( 1 2)
( 6) ( 3)
36 9
45
3 5
x x y y
101.
102. 2
2
2
2
6 4 0
6 4
6 9 4 9
( 3) 13
3 13
3 13
y y
y y
y y
y
y
y
Solution set: 3 13
Section 1.9
Check Point Exercises
1. 2 22 1 2 1d x x y y
2 2
2 2
2 ( 1) 3 ( 3)
3 6
9 36
45
3 5
6.71
d
2. 1 7 2 ( 3) 8 1 1
, , 4,2 2 2 2 2
3. 2 2 2
2 2
0, 0, 4;
( 0) ( 0) 4
16
h k r
x y
x y
4. 2 2 2
2 2
2 2
0, 6, 10;
( 0) [ ( 6)] 10
( 0) ( 6) 100
( 6) 100
h k r
x y
x y
x y
5. a. 2 2
2 2 2
( 3) ( 1) 4
[ ( 3)] ( 1) 2
x y
x y
So in the standard form of the circle’s equation 2 2 2( ) ( )x h y k r ,
we have 3, 1, 2.h k r
center: ( , ) ( 3, 1)h k
radius: r = 2
b.
c. domain: 5, 1
range: 1,3
6. 2 2 4 4 1 0x y x y
2 2
2 2
2 2
2 2
2 2 2
4 4 1 0
4 4 0
4 4 4 4 1 4 4
( 2) ( 2) 9
[ ( )] ( 2) 3
x y x y
x x y y
x x y y
x y
x x y
So in the standard form of the circle’s equation 2 2 2( ) ( )x h y k r , we have
2, 2, 3h k r .
Page 2
Section 1.9 Distance and Midpoint Formulas; Circles
Copyright © 2014 Pearson Education, Inc. 225
Concept and Vocabulary Check 1.9
1. 2 22 1 2 1( ) ( )x x y y
2. 1 2
2
x x; 1 2
2
y y
3. circle; center; radius
4. 2 2 2( ) ( )x h y k r
5. general
6. 4; 16
Exercise Set 1.9
1. 2 2(14 2) (8 3)d
2 212 5
144 25
169
13
2. 2 2(8 5) (5 1)d
2 23 4
9 16
25
5
3. 2 26 4 3 ( 1)d
2 210 4
100 16
116
2 29
10.77
4. 2 21 2 5 ( 3)d
2 23 8
9 64
73
8.54
5. 2 2( 3 0) (4 0)d
2 23 4
9 16
25
5
6. 22(3 0) 4 0d
223 4
9 16
25
5
7. 2 2[3 ( 2)] [ 4 ( 6)]d
2 25 2
25 4
29
5.39
8. 2 2[2 ( 4)] [ 3 ( 1)]d
226 2
36 4
40
2 10
6.32
9. 2 2(4 0) [1 ( 3)]d
2 24 4
16 16
32
4 2
5.66
Page 3
Chapter 1 Functions and Graphs
226 Copyright © 2014 Pearson Education, Inc.
10. 2 2
2 2
2
4 0 [3 2 ]
4 [3 2]
16 5
16 25
41
6.40
d
11. 2 2
2 2
( .5 3.5) (6.2 8.2)
( 4) ( 2)
16 4
20
2 5
4.47
d
12.
22
2 2
(1.6 2.6) 5.7 1.3
1 7
1 49
50
5 2
7.07
d
13. 2 2
2 2
( 5 0) [0 ( 3)]
( 5) ( 3)
5 3
8
2 2
2.83
d
14.
22
22
7 0 0 2
7 2
7 2
9
3
d
15. 2 2
2 2
( 3 3 3) (4 5 5)
( 4 3) (3 5)
16(3) 9(5)
48 45
93
9.64
d
16.
2 2
2 2
3 2 3 5 6 6
3 3 4 6
9 3 16 6
27 96
123
11.09
d
17. 2 2
2 2
1 7 6 1
3 3 5 5
( 2) 1
4 1
5
2.24
d
18. 2 2
2 2
2 2
3 1 6 1
4 4 7 7
3 1 6 1
4 4 7 7
1 1
2
1.41
d
19. 6 2 8 4 8 12
, , (4,6)2 2 2 2
20. 10 2 4 6 12 10
, , (6,5)2 2 2 2
21. 2 ( 6) 8 ( 2)
,2 2
8 10, ( 4, 5)
2 2
Page 4
Section 1.9 Distance and Midpoint Formulas; Circles
Copyright © 2014 Pearson Education, Inc. 227
22. 4 1 7 3 5 10
, ,2 2 2 2
5, 5
2
23. 3 6 4 ( 8)
,2 2
3 12 3, , 6
2 2 2
24. 2 8 1 6 10 5 5
, 5,2 2 2 2 2
25.
7 5 3 11
2 2 2 2,
2 2
12 86 42 2, , 3, 2
2 2 2 2
26. 2 2 7 4 4 35 5 15 15 5 15, ,
2 2 2 2
4 1 3 1 2 1, ,
5 2 15 2 5 10
27.
8 ( 6) 3 5 7 5,
2 2
2 10 5, 1,5 5
2 2
28.
7 3 3 3 6 ( 2) 10 3 8, ,
2 2 2 2
5 3, 4
29. 18 2 4 4,
2 2
3 2 2 0 4 2, ,0 (2 2,0)
2 2 2
30.
50 2 6 6 5 2 2 0, ,
2 2 2 2
6 2,0 3 2,0
2
31. 2 2 2
2 2
( 0) ( 0) 7
49
x y
x y
32. 2 2 2( 0) ( 0) 8x y 2 2 64x y
33.
2 2 2
2 2
3 2 5
3 2 25
x y
x y
34. 22 22 ( 1) 4x y
2 22 1 16x y
35.
2 2 2
2 2
( 1) 4 2
1 4 4
x y
x y
36. 2 2 2( 3) 5 3x y
2 23 5 9x y
37.
22 2
2 2
( 3) ( 1) 3
3 1 3
x y
x y
38. 22 2( 5) ( 3) 5x y
2 25 3 5x y
39.
2 2 2
2 2
( 4) 0 10
4 0 100
x y
x y
40. 2 2 2( 2) 0 6x y
2 22 36x y
Page 5
Chapter 1 Functions and Graphs
228 Copyright © 2014 Pearson Education, Inc.
41. 2 2
2 2 2
16
( 0) ( 0)
0, 0, 4;
x y
x y y
h k r
center = (0, 0); radius = 4
domain: 4,4
range: 4,4
42. 2 2 49x y 2 2 2( 0) ( 0) 7
0, 0, 7;
x y
h k r
center = (0, 0); radius = 7
domain: 7,7
range: 7,7
43.
2 2
2 2 2
3 1 36
3 1 6
3, 1, 6;
x y
x y
h k r
center = (3, 1); radius = 6
domain: 3,9
range: 5,7
44. 2 22 3 16x y
2 2 2( 2) ( 3) 4
2, 3, 4;
x y
h k r
center = (2, 3); radius = 4
domain: 2,6
range: 1,7
45. 2 2
2 2 2
( 3) ( 2) 4
[ ( 3)] ( 2) 2
3, 2, 2
x y
x y
h k r
center = (–3, 2); radius = 2
domain: 5, 1
range: 0,4
46. 2 21 4 25x y
2 2 2( 1) ( 4) 5
1, 4, 5;
x y
h k r
center = (–1, 4); radius = 5
domain: 6,4
range: 1,9
Page 6
Section 1.9 Distance and Midpoint Formulas; Circles
Copyright © 2014 Pearson Education, Inc. 229
47. 2 2
2 2 2
( 2) ( 2) 4
[ ( 2)] [ ( 2)] 2
2, 2, 2
x y
x y
h k r
center = (–2, –2); radius = 2
domain: 4,0
range: 4,0
48. 2 24 5 36x y
2 2 2( 4) ( 5) 6
4, 5, 6;
x y
h k r
center = (–4, –5); radius = 6
domain: 10,2
range: 11,1
49. 22 1 1x y
0, 1, 1;h k r
center = (0, 1); radius = 1
domain: 1,1
range: 0,2
50. 22 2 4x y
0, 2, 2;h k r
center = (0,2); radius = 2
domain: 2,2
range: 0,4
51. 2 21 25x y
1, 0, 5;h k r
center = (–1,0); radius = 5
domain: 6,4
range: 5,5
52. 2 22 16x y
2, 0, 4;h k r
center = (–2,0); radius = 4
domain: 6,2
range: 4,4
Page 7
Chapter 1 Functions and Graphs
230 Copyright © 2014 Pearson Education, Inc.
53.
2 2
2 2
2 2
2 2
2 2 2
6 2 6 0
6 2 6
6 9 2 1 9 1 6
3 1 4
( 3) 9 ( 1) 2
x y x y
x x y y
x x y y
x y
x
center = (–3, –1); radius = 2
54. 2 2 8 4 16 0x y x y
2 28 4 16x x y y
2 28 16 4 4 20 16x x y y
2 24 2 4x y
2 2 2( 4) ( 2) 2x y
center = (–4, –2); radius = 2
55.
2 2
2 2
2 2
2 2
2 2 2
10 6 30 0
10 6 30
10 25 6 9 25 9 30
5 3 64
( 5) ( 3) 8
x y x y
x x y y
x x y y
x y
x y
center = (5, 3); radius = 8
56. 2 2 4 12 9 0x y x y
2 24 12 9x x y y
2 24 4 12 36 4 36 9x x y y
2 22 6 49x y
2 2 2( 2) ( 6) 7x y
center = (2, 6); radius = 7
57.
2 2
2 2
2 2
2 2
2 2 2
8 2 8 0
8 2 8
8 16 2 1 16 1 8
4 1 25
( 4) ( 1) 5
x y x y
x x y y
x x y y
x y
x y
center = (–4, 1); radius = 5
58. 2 2 12 6 4 0x y x y
2 212 6 4x x y y
2 212 36 6 9 36 9 4x x y y
2 2 2( 6) 3 7x y
center = (–6, 3); radius = 7
Page 8
Section 1.9 Distance and Midpoint Formulas; Circles
Copyright © 2014 Pearson Education, Inc. 231
59.
2 2
2 2
22
2 2
2 2 2
2 15 0
2 15
2 1 0 1 0 15
1 0 16
1 0 4
x x y
x x y
x x y
x y
x y
center = (1, 0); radius = 4
60. 2 2 6 7 0x y y
2 2 6 7x y y
2 20 6 9 0 9 7x y y
2 20 3 16x y
2 2 2( 0) ( 3) 4x y
center = (0, 3); radius = 4
61. 2 2 2 1 0x y x y
2 2
2 2
22
2 1
1 12 1 1 1
4 4
1 11
2 4
x x y y
x x y y
x y
center = 1
, 12
; radius =
1
2
62. 2 2 10
2x y x y
2 2
2 2
2 2
1
21 1 1 1 1
4 4 2 4 4
1 11
2 2
x x y y
x x y y
x y
center = 1 1
,2 2
; radius = 1
63. 2 2 3 2 1 0x y x y
2 2
2 2
22
3 2 1
9 93 2 1 1 1
4 4
3 171
2 4
x x y y
x x y y
x y
center = 3
,12
; radius =
17
2
Page 9
Chapter 1 Functions and Graphs
232 Copyright © 2014 Pearson Education, Inc.
64. 2 2 93 5 0
4x y x y
2 2
2 2
2 2
93 5
49 25 9 9 25
3 54 4 4 4 4
3 5 25
2 2 4
x x y y
x x y y
x y
center = 3 5
,2 2
; radius =
5
2
65. a. Since the line segment passes through the center, the center is the midpoint of the segment.
1 2 1 2,2 2
3 7 9 11 10 20, ,
2 2 2 2
5,10
x x y yM
The center is 5,10 .
b. The radius is the distance from the center to one of the points on the circle. Using the point 3,9 , we get:
2 2
2 2
5 3 10 9
2 1 4 1
5
d
The radius is 5 units.
c.
22 2
2 2
5 10 5
5 10 5
x y
x y
66. a. Since the line segment passes through the center, the center is the midpoint of the segment.
1 2 1 2,2 2
3 5 6 4 8 10, ,
2 2 2 2
4,5
x x y yM
The center is 4,5 .
b. The radius is the distance from the center to
one of the points on the circle. Using the point 3,6 , we get:
2 2
22
4 3 5 6
1 1 1 1
2
d
The radius is 2 units.
c.
22 2
2 2
4 5 2
4 5 2
x y
x y
67.
Intersection points: 0, 4 and 4,0
Check 0, 4 :
220 4 16
16 16 true
0 4 4
4 4 true
Check 4,0 :
2 24 0 16
16 16 true
4 0 4
4 4 true
The solution set is 0, 4 , 4,0 .
Page 10
Section 1.9 Distance and Midpoint Formulas; Circles
Copyright © 2014 Pearson Education, Inc. 233
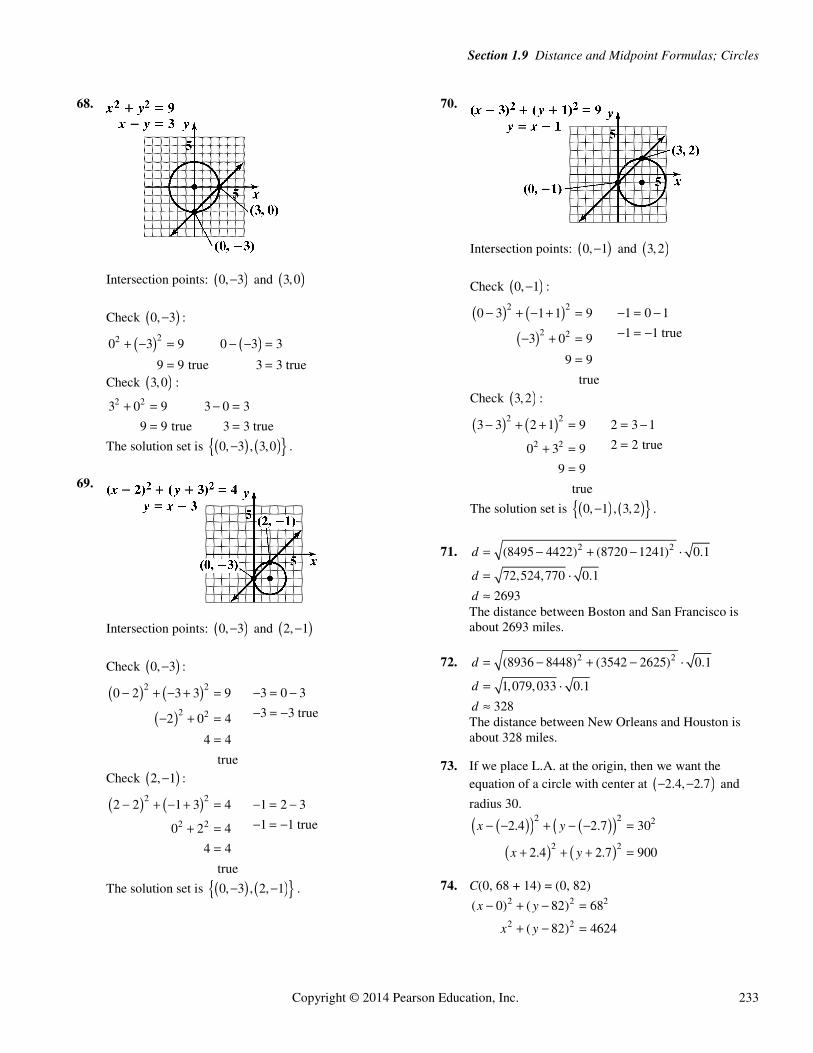
68.
Intersection points: 0, 3 and 3,0
Check 0, 3 :
220 3 9
9 9 true
0 3 3
3 3 true
Check 3,0 : 2 23 0 9
9 9 true
3 0 3
3 3 true
The solution set is 0, 3 , 3,0 .
69.
Intersection points: 0, 3 and 2, 1
Check 0, 3 :
2 2
2 2
0 2 3 3 9
2 0 4
4 4
true
3 0 3
3 3 true
Check 2, 1 :
2 2
2 2
2 2 1 3 4
0 2 4
4 4
true
1 2 3
1 1 true
The solution set is 0, 3 , 2, 1 .
70.
Intersection points: 0, 1 and 3,2
Check 0, 1 :
2 2
2 2
0 3 1 1 9
3 0 9
9 9
true
1 0 1
1 1 true
Check 3,2 :
2 2
2 2
3 3 2 1 9
0 3 9
9 9
true
2 3 1
2 2 true
The solution set is 0, 1 , 3,2 .
71. 2 2(8495 4422) (8720 1241) 0.1
72,524,770 0.1
2693
d
d
d
The distance between Boston and San Francisco is about 2693 miles.
72. 2 2(8936 8448) (3542 2625) 0.1
1,079,033 0.1
328
d
d
d
The distance between New Orleans and Houston is about 328 miles.
73. If we place L.A. at the origin, then we want the equation of a circle with center at 2.4, 2.7 and
radius 30.
2 2 2
2 2
2.4 2.7 30
2.4 2.7 900
x y
x y
74. C(0, 68 + 14) = (0, 82) 2 2 2
2 2
( 0) ( 82) 68
( 82) 4624
x y
x y
Page 11
Chapter 1 Functions and Graphs
234 Copyright © 2014 Pearson Education, Inc.
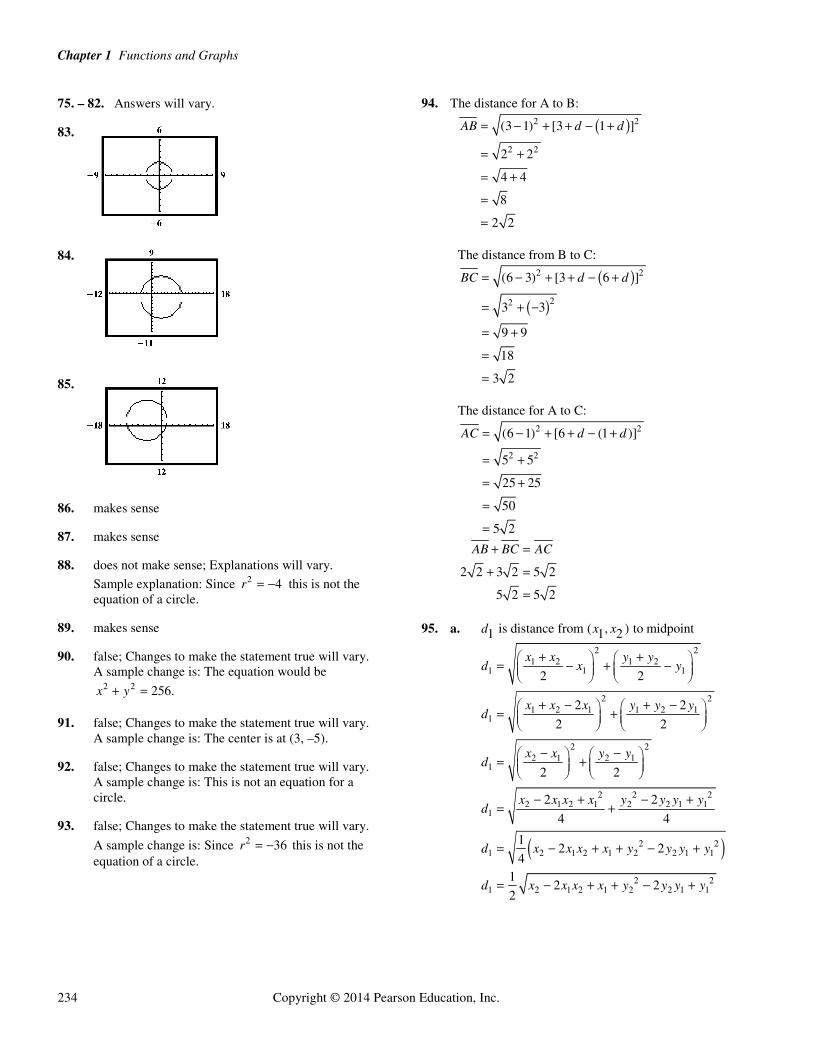
75. – 82. Answers will vary.
83.
84.
85.
86. makes sense
87. makes sense
88. does not make sense; Explanations will vary.
Sample explanation: Since 2 4r this is not the equation of a circle.
89. makes sense
90. false; Changes to make the statement true will vary. A sample change is: The equation would be
2 2 256.x y
91. false; Changes to make the statement true will vary. A sample change is: The center is at (3, –5).
92. false; Changes to make the statement true will vary. A sample change is: This is not an equation for a circle.
93. false; Changes to make the statement true will vary.
A sample change is: Since 2 36r this is not the equation of a circle.
94. The distance for A to B:
2 2
2 2
(3 1) [3 1 ]
2 2
4 4
8
2 2
AB d d
The distance from B to C:
2 2
22
(6 3) [3 6 ]
3 3
9 9
18
3 2
BC d d
The distance for A to C:
2 2
2 2
(6 1) [6 (1 )]
5 5
25 25
50
5 2
AC d d
2 2 3 2 5 2
5 2 5 2
AB BC AC
95. a. is distance from ( , ) to midpoint1 1 2d x x
2 21 2 1 2
1 1 1
2 21 2 1 1 2 1
1
2 22 1 2 1
1
2 2 22 1 2 1 2 2 1 1
1
2 21 2 1 2 1 2 2 1 1
2 21 2 1 2 1 2 2 1 1
2 2
2 2
2 2
2 2
2 2
4 4
12 2
41
2 22
x x y yd x y
x x x y y yd
x x y yd
x x x x y y y yd
d x x x x y y y y
d x x x x y y y y
Page 12
Section 1.10 Modeling with Functions
Copyright © 2014 Pearson Education, Inc. 235
1
2 2 2
2 22 1 2
2 2 2
2 21 2 2 1 2 2
2
2 21 2 1 2
2
2 2 2 21 1 2 2 1 2 1 2
2
2 2 22 1 1 2 2 1 2
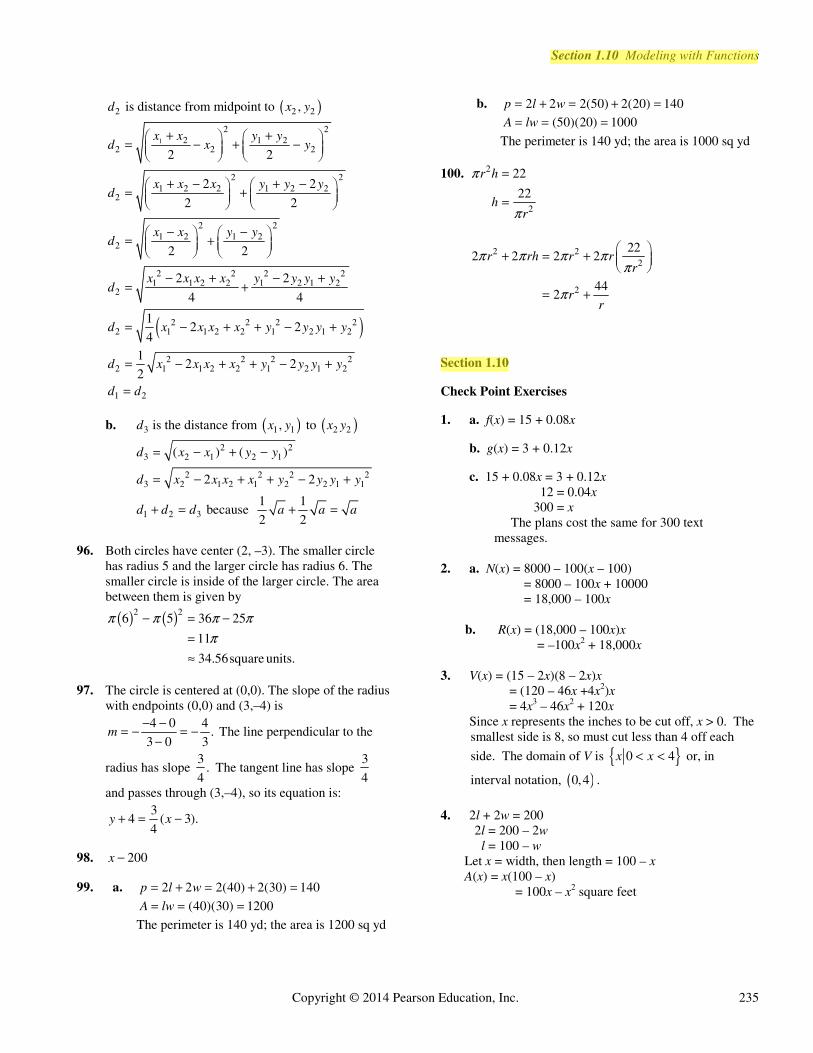
is distance from midpoint to ,
2 2
2 2
2 2
2 2
2 2
4 4
12 2
4
d x y
x x y yd x y
x x x y y yd
x x y yd
x x x x y y y yd
d x x x x y y y
21 2
2 2 2 22 1 1 2 2 1 2 1 2
1 2
12 2
2
y
d x x x x y y y y
d d
b. 3 1 1 2 2is the distance from , to d x y x y
2 23 2 1 2 1
2 2 2 23 2 1 2 1 2 2 1 1
1 2 3
( ) ( )
2 2
1 1 because
2 2
d x x y y
d x x x x y y y y
d d d a a a
96. Both circles have center (2, –3). The smaller circle
has radius 5 and the larger circle has radius 6. The smaller circle is inside of the larger circle. The area between them is given by
2 26 5π π 36 25π π
11
34.56square units.
π
97. The circle is centered at (0,0). The slope of the radius with endpoints (0,0) and (3,–4) is
4 0 4.
3 0 3m
The line perpendicular to the
radius has slope 3
.4
The tangent line has slope 3
4
and passes through (3,–4), so its equation is: 3
4 ( 3).4
y x
98. 200x
99. a. 2 2 2(40) 2(30) 140p l w
(40)(30) 1200A lw
The perimeter is 140 yd; the area is 1200 sq yd
b. 2 2 2(50) 2(20) 140p l w
(50)(20) 1000A lw
The perimeter is 140 yd; the area is 1000 sq yd
100. 2
2
22
22
r h
hr
π
π
2 22
2
222 2 2 2
442
r rh r rr
rr
π π π ππ
π
Section 1.10
Check Point Exercises
1. a. f(x) = 15 + 0.08x
b. g(x) = 3 + 0.12x
c. 15 + 0.08x = 3 + 0.12x 12 = 0.04x 300 = x The plans cost the same for 300 text
messages.
2. a. N(x) = 8000 – 100(x – 100) = 8000 – 100x + 10000 = 18,000 – 100x
b. R(x) = (18,000 – 100x)x = –100x2 + 18,000x
3. V(x) = (15 – 2x)(8 – 2x)x
= (120 – 46x +4x2)x = 4x3 – 46x2 + 120x
Since x represents the inches to be cut off, x > 0. The smallest side is 8, so must cut less than 4 off each
side. The domain of V is 0 4x x or, in
interval notation, 0,4 .
4. 2l + 2w = 200
2l = 200 – 2w l = 100 – w Let x = width, then length = 100 – x A(x) = x(100 – x)
= 100x – x2 square feet
Page 13
Chapter 1 Functions and Graphs
236 Copyright © 2014 Pearson Education, Inc.
5. 2V r hπ 21000
10002
r h
hr
π
π
2( ) 2 2
100022 22
200022
A r r rh
r rr
rr
π π
π ππ
π
6. ( ) 0.07 0.09(25,000 )I x x x
7. 22( 0) 0d x y
2 2x y
3
22
2 6
3
y x
d x x
x x
Concept and Vocabulary Check 1.10
1. 4 0.15x
2. 300;x 50( 300);x 5000; 50( 300)x
3. 10 2 ;x 10 2 ;x ;x 10 2 ;x 10 2 ;x x
4. ;xy 2 2 ;x y 90 ;x (90 )x x
5. 0.12 0.09 ;x y 30,000 ;x
0.12 0.09(30,000 )x x
6. 2 2x y ; 2 6x x
Exercise Set 1.10 1. a. ( ) 200 0.15f x x
b. 320 200 0.15
120 01.5
800
x
x
x
800 miles
2. a. ( ) 180 0.25f x x
b. 395 180 0.25x
215 0.25
860
x
x
You drove 860 miles for $395. 3. a. 239.4 0.3M x x
b. 180 239.4 0.3
0.3 59.4
198
x
x
x
198 years after 1954, in 2152, someone will run a 3 minute mile.
4. a. ( ) 28 0.6P x x b. 40 28 06x
12 0.6
20
x
x
20 years after 1990, in 2010, 40% of babies born will be out of wedlock.
5. a. ( ) 1.25f x x
b. ( ) 21 0.5g x x
c. 1.25 21 0.5
0.75 21
28
(28) 1.25(28) 35
(28) 21 0.5(28) 35
x x
x
x
f
g
If a person crosses the bridge 28 times the cost will be $35 for both options
6. a. ( ) 2.5f x x
b. ( ) 21g x x
c. 2.5 21x x
1.5 21
14
(14) 2.5(14) 35
(14) 21 14 35
x
x
f
g
To cross the bridge 14 times costs the same, $35, for either method.
Page 14
Section 1.10 Modeling with Functions
Copyright © 2014 Pearson Education, Inc. 237
7. a. ( ) 100 0.8f x x
b. ( ) 40 0.9g x x
c. 100 0.8 40 0.9
60 0.1
600
x x
x
x
For $600 worth of merchandise, your cost is $580 for both plans
8. a. ( ) 300 0.7f x x
b. ( ) 40 0.9g x x
c. 300 0.7 40 0.9
260 0.2
1300
x x
x
x
(1300) 300 0.7(1300) 1210
(1300) 40 0.9(1300) 1210
f
g
You would have to purchase $1300 in merchandise at a total cost of $1210.
9. a. ( ) 30,000 500( 20)
30,000 500 10000
40,000 500
N x x
x
x
b. ( ) (40,000 500 )
2500 40,000
R x x x
x x
10. a. ( ) 20,000 400( 15)
20,000 400 6000
26,000 400
N x x
x
x
b. ( ) (26,000 400 )
2400 26,000
R x x x
x x
11. a. ( ) 9000 50(150 )
9000 50 7500
16500 50
N x x
x
x
b. ( ) (16500 50 )
250 16500
R x x x
x x
12. a. ( ) 7,000 60(90 )
7000 60 5400
12400 60
N x x
x
x
b. ( ) (12400 60 )
260 12400
R x x x
x x
13. a. ( ) 320 4( 50)
320 4 200
520 4
Y x x
x
x
b. ( ) (520 4 )
24 520
T x x x
x x
14. a. ( ) 270 3( 30)
270 3 90
360 3
Y x x
x
x
b. ( ) (360 3 )
23 360
T x x x
x x
15. a. ( ) (24 2 )(24 2 )
2(576 96 4 )
3 24 96 576
V x x x x
x x x
x x x
b. 3 2(2) 4(2) 96(2) 576(2) 800V If
2-inch squares are cut off each corner, the volume will be 800 square inches.
3 2(3) 4(3) 96(3) 576(3) 972V If
3-inch squares are cut off each corner, the volume will be 972 square inches.
3 2(4) 4(4) 96(4) 576(4) 1024V If
4-inch squares are cut off each corner, the volume will be 1024 square inches.
3 2(5) 4(5) 96(5) 576(5) 980V If
5-inch squares are cut off each corner, the volume will be 980 square inches.
3 2(6) 4(6) 96(6) 576(6) 864V If
6-inch squares are cut off each corner, the volume will be 864 square inches.
c. If x is the inches to be cut off, x > 0. Since each side is 24, you must cut less than 12 inches off each end. 0 < x < 12
Page 15
Chapter 1 Functions and Graphs
238 Copyright © 2014 Pearson Education, Inc.
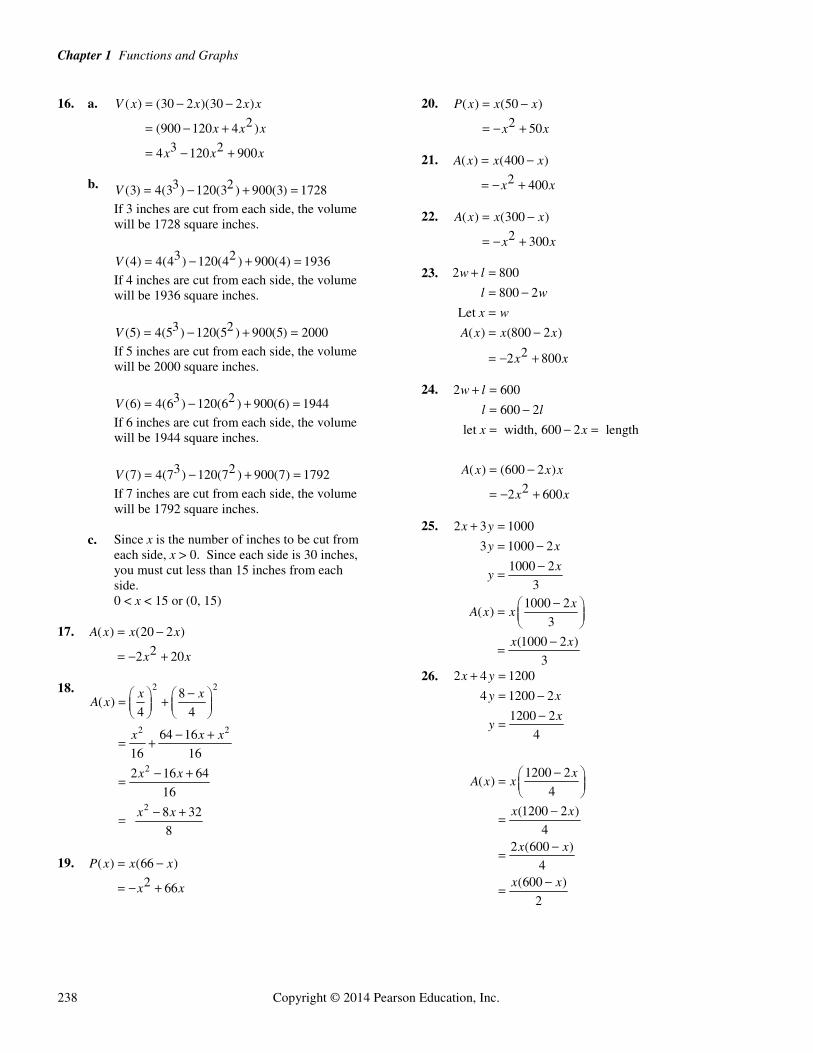
16. a. ( ) (30 2 )(30 2 )
2(900 120 4 )
3 24 120 900
V x x x x
x x x
x x x
b. 3 2(3) 4(3 ) 120(3 ) 900(3) 1728V
If 3 inches are cut from each side, the volume will be 1728 square inches.
3 2(4) 4(4 ) 120(4 ) 900(4) 1936V
If 4 inches are cut from each side, the volume will be 1936 square inches.
3 2(5) 4(5 ) 120(5 ) 900(5) 2000V
If 5 inches are cut from each side, the volume will be 2000 square inches.
3 2(6) 4(6 ) 120(6 ) 900(6) 1944V
If 6 inches are cut from each side, the volume will be 1944 square inches.
3 2(7) 4(7 ) 120(7 ) 900(7) 1792V
If 7 inches are cut from each side, the volume will be 1792 square inches.
c. Since x is the number of inches to be cut from each side, x > 0. Since each side is 30 inches, you must cut less than 15 inches from each side. 0 < x < 15 or (0, 15)
17. ( ) (20 2 )
22 20
A x x x
x x
18. 2 2
2 2
2
2
8( )
4 4
64 16
16 16
2 16 64
16
8 32
8
x xA x
x x x
x x
x x
19. ( ) (66 )
2 66
P x x x
x x
20. ( ) (50 )
2 50
P x x x
x x
21. ( ) (400 )
2 400
A x x x
x x
22. ( ) (300 )
2 300
A x x x
x x
23. 2 800
800 2
Let
( ) (800 2 )
22 800
w l
l w
x w
A x x x
x x
24. 2 600
600 2
let width, 600 2 length
( ) (600 2 )
22 600
w l
l l
x x
A x x x
x x
25. 2 3 1000
3 1000 2
1000 2
31000 2
( )3
(1000 2 )
3
x y
y x
xy
xA x x
x x
26. 2 4 1200
4 1200 2
1200 2
4
1200 2( )
4
(1200 2 )
42 (600 )
4(600 )
2
x y
y x
xy
xA x x
x x
x x
x x
Page 16
Section 1.10 Modeling with Functions
Copyright © 2014 Pearson Education, Inc. 239
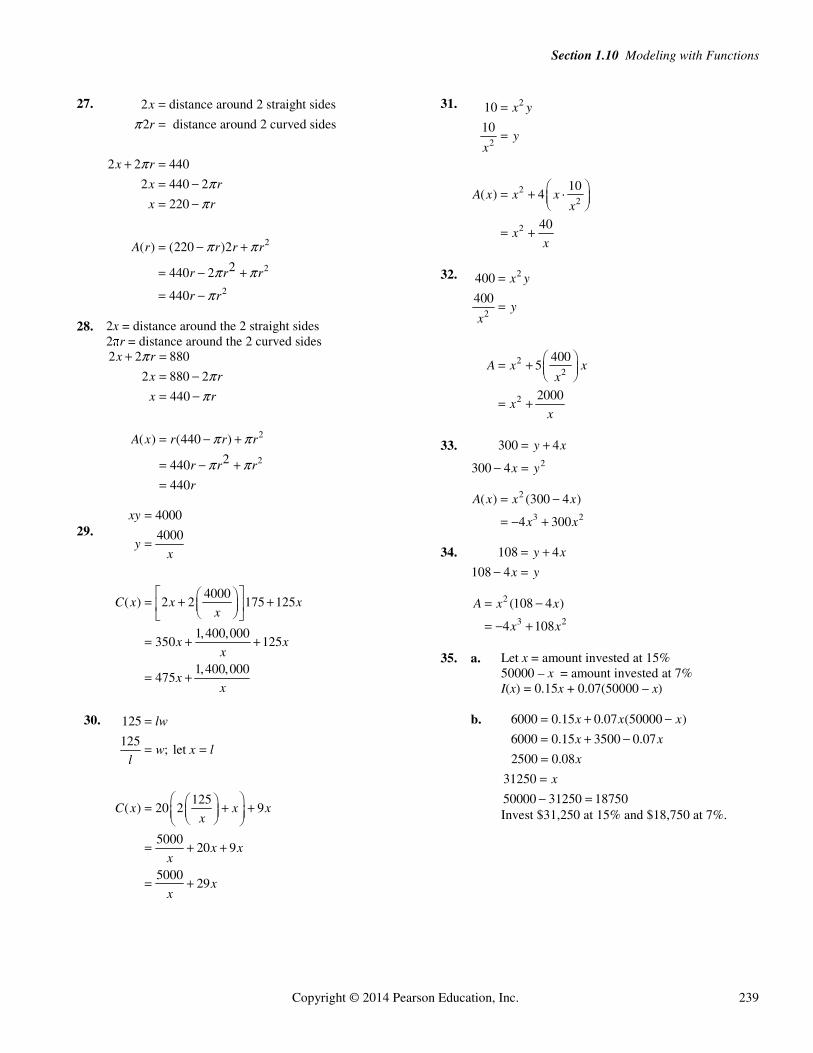
27.
2
2
2
2 distance around 2 straight sides
2 distance around 2 curved sides
2 2 440
2 440 2
220
( ) (220 )2
2 440 2
440
x
r
x r
x r
x r
A r r r r
r r r
r r
π
ππ
π
π π
π ππ
28. 2x = distance around the 2 straight sides
2πr = distance around the 2 curved sides
2
2
2 2 880
2 880 2
440
( ) (440 )
2440
440
x r
x r
x r
A x r r r
r r r
r
ππ
π
π π
π π
29.
4000
4000
4000( ) 2 2 175 125
1,400,000350 125
1,400,000475
xy
yx
C x x xx
x xx
xx
30. 125
125; let
125( ) 20 2 9
500020 9
500029
lw
w x ll
C x x xx
x xx
xx
31. 2
2
22
2
10
10
10( ) 4
40
x y
yx
A x x xx
xx
32. 2
2
22
2
400
400
4005
2000
x y
yx
A x xx
xx
33.
2
300 4
300 4
y x
x y
2
3 2
( ) (300 4 )
4 300
A x x x
x x
34. 108 4
108 4
y x
x y
2
3 2
(108 4 )
4 108
A x x
x x
35. a. Let x = amount invested at 15%
50000 – x = amount invested at 7% I(x) = 0.15x + 0.07(50000 – x)
b. 6000 0.15 0.07 (50000 )
6000 0.15 3500 0.07
2500 0.08
31250
50000 31250 18750
x x x
x x
x
x
Invest $31,250 at 15% and $18,750 at 7%.
Page 17
Chapter 1 Functions and Graphs
240 Copyright © 2014 Pearson Education, Inc.
36. a. Let x = amount at 10% 18,750 – x = amount at 12% ( ) 0.10 0.12(18750 )I x x x
b. 0.10 0.12(18750 ) 2117
0.1 2250 0.12 2117
0.02 133
6650
x x
x x
x
x
The amount of money to be invested should be $6650 at 10% and $12100 at 12%.
37. Let x = amount invested at 12%
8000 – x = amount invested at 5% loss I(x) = 0.12x – 0.05(8000 – x)
38. Let x = amount at 14%
12000 – x = amount at 6% ( ) 0.14 0.06(12000 )
0.14 720 0.06
0.08 720
I x x x
x x
x
39.
2 2
2 2
22 2
2 4 2
4 2
( 0) ( 0)
4
8 16
7 16
d x y
x y
x x
x x x
x x
40.
2 2
2 2
22 2
2 4 2
4 2
( 0) ( 0)
8
16 64
15 64
d x y
x y
x x
x x x
x x
41.
2 2
22
2
2
( 1)
2 1
2 1
1
d x y
x x x
x x x
x x
42.
2 2
22
2
( 2)
4 4
3 4
d x y
x x x
x x
43. a.
2
( ) 2
2 4
A x xy
x x
b.
2
2(2 ) 2
4 2 4
P x x y
x x
44. a.
2
( ) 2
2 9
A x xy
x x
b.
2
( ) 2(2 ) 2
4 2 9
P x x y
x x
45. 6-foot pole
2 2 2
2
6
36
c x
x x
8-foot pole 2 2 2
2
2
8 (10 )
64 100 20
20 164
c x
c x x
c x x
total length 2 2( ) 36 20 164f x x x x
46. Road from Town A:
2 2 2
2
6
36
c x
c x
Road from Town B:
2 2 2
2
2
3 (12 )
9 144 24
24 153
2 236 24 153
c x
c x x
c x x
f x x x x
Page 18
Section 1.10 Modeling with Functions
Copyright © 2014 Pearson Education, Inc. 241
47.
1 12 2
2 25 31 12 2 2 2
2 2
2
( ) ( 5) ( 3)
( 2) ( 5) ( 3)
( ) ( 2) 2 2
( ) 2 2 4
( ) 3 4
A x x x x x
x x x
A x x x x x x x
A x x x x x
A x x x
48. 1 12 2
2 2
2 2 2
2
( ) (2 ) (6 4 )( 2)
(4 )( 2) 2 (8)
( ) ( 2) 4 8 16
( ) 2 4 8 16
( ) 6 26
A x x x x x x
x x x
A x x x x x x x
A x x x x x x x
A x x
49. 2
3 2 2
3 2
( ) ( 5)(2 1)( 2) ( 5)(3)( )
( ) ( 5)(2 5 2) 3 ( 5)
( ) 2 15 27 10 3 15
( ) 2 12 12 10
V x x x x x x
V x x x x x x
V x x x x x x
V x x x x
50.
2 2
3 2 3 2
3 2
( ) ( )(2 1)( 3)
( )( ) (2 1) ( 1)
( ) ( )(2 5 3) ( 2)
( ) 2 5 3 2
( ) 7 3
V x x x x
x x x x
V x x x x x x
V x x x x x x
V x x x x
51. – 62. Answers may vary.
63. does not make sense; Explanations will vary. Sample explanation: This model is not reasonable, as it suggests a per minute charge of $30.
64. does not make sense; Explanations will vary. Sample explanation: The decrease in passengers is modeled by 60( 300).x
65. does not make sense; Explanations will vary. Sample explanation: The area of a rectangle is not solely determined by its perimeter. For example: A 4 by 6 rectangle and a 3 by 7 rectangle both have perimeters of 20 units, yet their areas are different from each other.
66. makes sense
67.
Distance and time rowed: 2 2 2
2
2
2
2
4
2 4
4
2
d x
d x
rt d
t x
xt
Distance and time walked: 6
5 6
6
5
d x
rt d
t x
xt
Total time: 24 6
( )2 5
x xT x
68. ( ) (20 2 )(10 2 ) 10(20)
24 60 200 200
24 60
A x x x
x x
x x
69.
2
2 2 2
2 2
12 2 ( 2 )
212 2 2
12 2 2
12 2
2
12 2 12
2 2
112 2
21
12 22
P h r r
h r r
r r h
r rh
r rA r r
r r r r
r r r
π
πππ
π π
π π
π
Page 19
Chapter 1 Functions and Graphs
242 Copyright © 2014 Pearson Education, Inc.
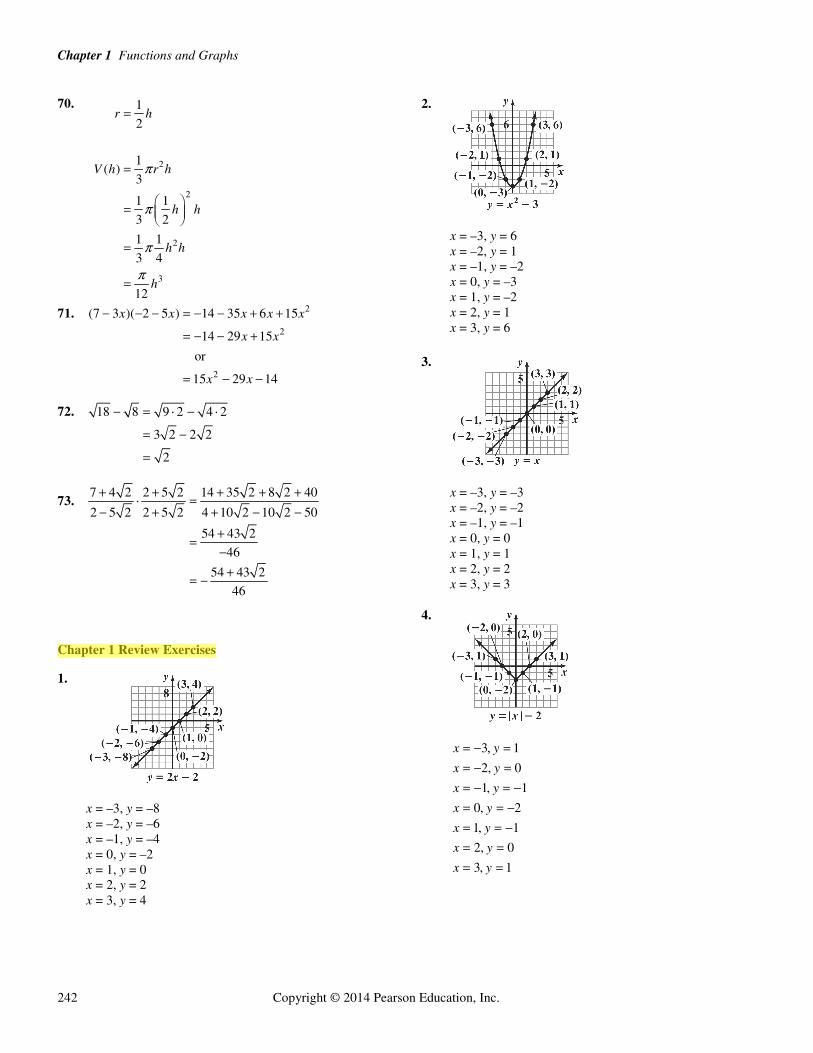
70.
2
2
2
3
1
2
1( )
3
1 1
3 2
1 1
3 4
12
r h
V h r h
h h
h h
h
π
π
π
π
71. 2
2
2
(7 3 )( 2 5 ) 14 35 6 15
14 29 15
or
15 29 14
x x x x x
x x
x x
72. 18 8 9 2 4 2
3 2 2 2
2
73. 7 4 2 2 5 2 14 35 2 8 2 40
2 5 2 2 5 2 4 10 2 10 2 50
54 43 2
46
54 43 2
46
Chapter 1 Review Exercises
1.
x = –3, y = –8 x = –2, y = –6 x = –1, y = –4 x = 0, y = –2 x = 1, y = 0 x = 2, y = 2 x = 3, y = 4
2.
x = –3, y = 6 x = –2, y = 1 x = –1, y = –2 x = 0, y = –3 x = 1, y = –2 x = 2, y = 1 x = 3, y = 6
3.
x = –3, y = –3 x = –2, y = –2 x = –1, y = –1 x = 0, y = 0 x = 1, y = 1 x = 2, y = 2 x = 3, y = 3
4.
3, 1
2, 0
1, 1
0, 2
1, 1
2, 0
3, 1
x y
x y
x y
x y
x y
x y
x y
Page 20
Chapter 1 Review Exercises
Copyright © 2014 Pearson Education, Inc. 243
5. A portion of Cartesian coordinate plane with minimum x-value equal to –20, maximum x-value equal to 40, x-scale equal to 10 and with minimum y-value equal to –5, maximum y-value equal to 5, and y-scale equal to 1.
6. x-intercept: –2; The graph intersects the x-axis at
–2, 0 .
y-intercept: 2; The graph intersects the y-axis at
0, 2 .
7. x-intercepts: 2, –2; The graph intersects the x-axis at –2, 0 and 2, 0 .
y-intercept: –4; The graph intercepts the y-axis at
0, – 4 .
8. x-intercept: 5; The graph intersects the x-axis at
5, 0 .
y-intercept: None; The graph does not intersect the y-axis.
9. The coordinates are (20, 8). This means that 8% of college students anticipated a starting salary of $20 thousand.
10. The starting salary that was anticipated by the greatest percentage of college students was $30 thousand. 22% of students anticipated this salary.
11. The starting salary that was anticipated by the least percentage of college students was $70 thousand. 2% of students anticipated this salary.
12. Starting salaries of $25 thousand and $30 thousand were anticipated by more than 20% of college students
13. 14% of students anticipated a starting salary of $40 thousand.
14. 2
2
0.01 0.8 3.7
0.01(40) 0.8(40) 3.7
19.7
p s s
p
p
This is greater than the estimate of the previous question.
15. function domain: {2, 3, 5} range: {7}
16. function domain: {1, 2, 13} range: {10, 500, π}
17. not a function domain: {12, 14} range: {13, 15, 19}
18. 2 8
2 8
x y
y x
Since only one value of y can be obtained for each value of x, y is a function of x.
19. 2
2
3 14
3 14
x y
y x
Since only one value of y can be obtained for each value of x, y is a function of x.
20. 2
2
2 6
2 6
2 6
x y
y x
y x
Since more than one value of y can be obtained from some values of x, y is not a function of x.
21. f(x) = 5 – 7x
a. f(4) = 5 – 7(4) = –23
b. ( 3) 5 7( 3)
5 7 21
7 16
f x x
x
x
c. f(–x) = 5 – 7(–x) = 5 + 7x
22. 2( ) 3 5 2g x x x
a. 2(0) 3(0) 5(0) 2 2g
b. 2( 2) 3( 2) 5( 2) 2
12 10 2
24
g
Page 21
Chapter 1 Functions and Graphs
244 Copyright © 2014 Pearson Education, Inc.
c. 2
2
2
( 1) 3( 1) 5( 1) 2
3( 2 1) 5 5 2
3 11 10
g x x x
x x x
x x
d. 2
2
( ) 3( ) 5( ) 2
3 5 2
g x x x
x x
23. a. (13) 13 4 9 3g
b. g(0) = 4 – 0 = 4
c. g(–3) = 4 – (–3) = 7
24. a. 2( 2) 1 3
( 2) 12 1 3
f
b. f(1) = 12
c. 22 1 3
(2) 32 1 1
f
25. The vertical line test shows that this is not the graph of a function.
26. The vertical line test shows that this is the graph of a function.
27. The vertical line test shows that this is the graph of a function.
28. The vertical line test shows that this is not the graph of a function.
29. The vertical line test shows that this is not the graph of a function.
30. The vertical line test shows that this is the graph of a function.
31. a. domain: [–3, 5)
b. range: [–5, 0]
c. x-intercept: –3
d. y-intercept: –2
e. increasing: ( 2, 0) or (3, 5)
decreasing: ( 3, 2) or (0, 3)
f. f(–2) = –3 and f(3) = –5
32. a. domain: ( , )
b. range: , 3
c. x-intercepts: –2 and 3
d. y-intercept: 3
e. increasing: (–, 0) decreasing: (0, )
f. f(–2) = 0 and f(6) = –3
33. a. domain: ( , )
b. range: [–2, 2]
c. x-intercept: 0
d. y-intercept: 0
e. increasing: (–2, 2) constant: ( , 2) or (2, )
f. f(–9) = –2 and f(14) = 2
34. a. 0, relative maximum −2
b. −2, 3, relative minimum −3, –5
35. a. 0, relative maximum 3
b. none
36. 3
3
3
( ) 5
( ) ( ) 5( )
5
( )
f x x x
f x x x
x x
f x
The function is odd. The function is symmetric with respect to the origin.
Page 22
Chapter 1 Review Exercises
Copyright © 2014 Pearson Education, Inc. 245
37. 4 2
4 2
4 2
( ) 2 1
( ) ( ) 2( ) 1
2 1
( )
f x x x
f x x x
x x
f x
The function is even. The function is symmetric with respect to the y-axis.
38. 2
2
2
( ) 2 1
( ) 2( ) 1 ( )
2 1
( )
f x x x
f x x x
x x
f x
The function is odd. The function is symmetric with respect to the origin.
39. a.
b. range: {–3, 5}
40. a.
b. range: 0y y
41. 8( ) 11 (8 11)
8 8 11 8 11
8
88
x h x
hx h x
hh
42. 2 22( ) ( ) 10 2 10x h x h x x
h
2 2 2
2 2 2
2
2 2 10 2 10
2 4 2 10 2 10
4 2
4 2 1
4 2 1
x xh h x h x x
h
x xh h x h x x
h
xh h h
hh x h
hx h
43. a. Yes, the eagle’s height is a function of time since the graph passes the vertical line test.
b. Decreasing: (3, 12) The eagle descended.
c. Constant: (0, 3) or (12, 17) The eagle’s height held steady during the first 3 seconds and the eagle was on the ground for 5 seconds.
d. Increasing: (17, 30) The eagle was ascending.
44.
45. 1 2 1 1
;5 3 2 2
m
falls
46. 4 ( 2) 2
1;3 ( 1) 2
m
rises
Page 23
Chapter 1 Functions and Graphs
246 Copyright © 2014 Pearson Education, Inc.
47. 1 14 4 0
0;6 ( 3) 9
m
horizontal
48. 10 5 5
2 ( 2) 0m
undefined; vertical
49. point-slope form: y – 2 = –6(x + 3) slope-intercept form: y = –6x – 16
50. 2 6 4
21 1 2
m
point-slope form: y – 6 = 2(x – 1) or y – 2 = 2(x + 1) slope-intercept form: y = 2x + 4
51. 3x + y – 9 = 0 y = –3x + 9 m = –3 point-slope form: y + 7 = –3(x – 4) slope-intercept form: y = –3x + 12 – 7 y = –3x + 5
52. perpendicular to 1
43
y x
m = –3 point-slope form: y – 6 = –3(x + 3) slope-intercept form: y = –3x – 9 + 6 y = –3x – 3
53. Write 6 4 0x y in slope intercept form.
6 4 0
6 4
6 4
x y
y x
y x
The slope of the perpendicular line is 6, thus the
slope of the desired line is1
.6
m
1 1
16
16
16
( )
( 1) ( 12)
1 ( 12)
1 2
6 6 12
6 18 0
y y m x x
y x
y x
y x
y x
x y
54. slope: 2
;5
y-intercept: –1
55. slope: –4; y-intercept: 5
56. 2 3 6 0
3 2 6
22
3
x y
y x
y x
slope: 2
;3
y-intercept: –2
57. 2 8 0
2 8
4
y
y
y
slope: 0; y-intercept: 4
Page 24
Chapter 1 Review Exercises
Copyright © 2014 Pearson Education, Inc. 247
58. 2 5 10 0x y
Find x-intercept: 2 5(0) 10 0
2 10 0
2 10
5
x
x
x
x
Find y-intercept: 2(0) 5 10 0
5 10 0
5 10
2
y
y
y
y
59. 2 10 0x
2 10
5
x
x
60. a. 11 2.3 8.7
0.11690 15 75
m
1 1( )
11 0.116 90
or
2.3 0.116 15
y y m x x
y x
y x
b. 11 0.116 90
11 0.116 10.44
0.116 0.56
( ) 0.116 0.56
y x
y x
y x
f x x
c. According to the graph, France has about 5 deaths per 100,000 persons.
d. ( ) 0.116 0.56
(32) 0.116(32) 0.56
4.272
4.3
f x x
f
According to the function, France has about 4.3 deaths per 100,000 persons. This underestimates the value in the graph by 0.7 deaths per 100,000 persons. The line passes below the point for France.
61. a. 52 64 12
0.482010 1985 25
m
b. For each year from 1985 through 2010, the percentage of U.S. college freshmen rating their emotional health high or above average decreased by 0.48. The rate of change was –0.48% per year.
62. 2 2
2 1
2 1
[9 4 9 ] [4 4 5]( ) ( )10
9 5
f x f x
x x
63. a. 2
2
(0) 16(0) 64(0) 80 80
(2) 16(2) 64(2) 80 144
144 8032
2 0
S
S
b. 2(4) 16(4) 64(4) 80 80
80 14432
4 2
S
c. The ball is traveling up until 2 seconds, then it starts to come down.
64.
Page 25
Chapter 1 Functions and Graphs
248 Copyright © 2014 Pearson Education, Inc.
65.
66.
67.
68.
69.
70.
71.
72.
73.
74.
75.
76.
Page 26
Chapter 1 Review Exercises
Copyright © 2014 Pearson Education, Inc. 249
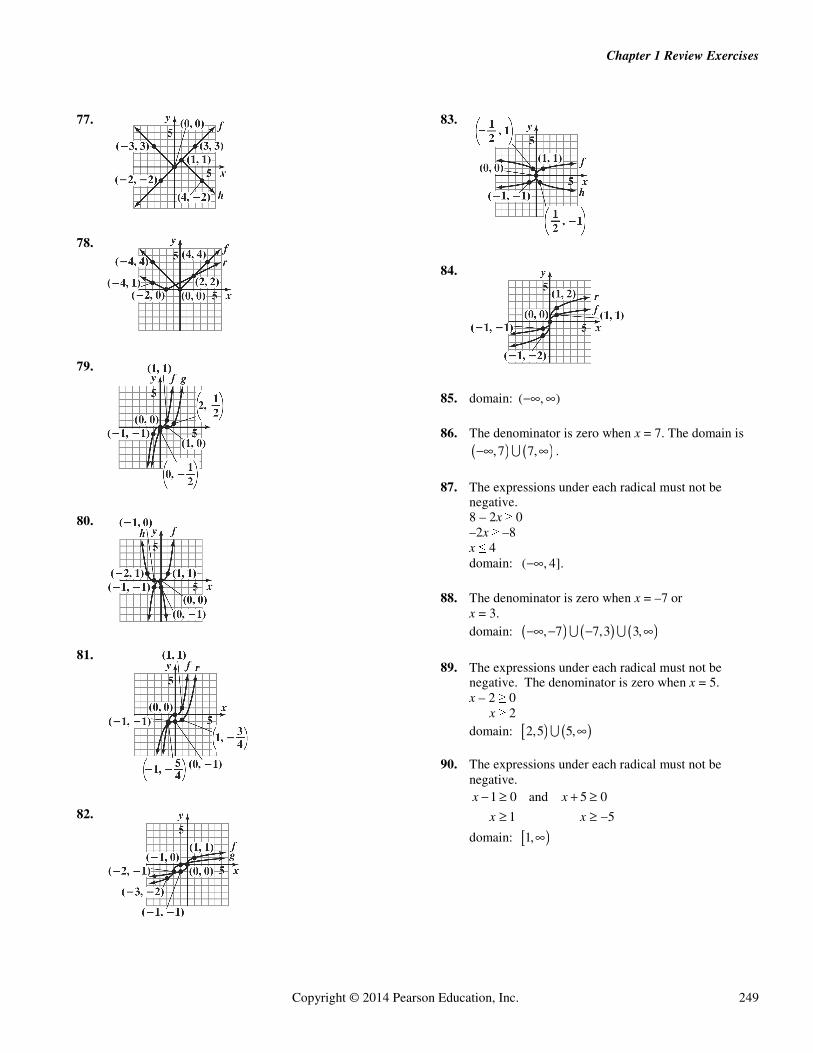
77.
78.
79.
80.
81.
82.
83.
84.
85. domain: ( , )
86. The denominator is zero when x = 7. The domain is
,7 7, .
87. The expressions under each radical must not be negative. 8 – 2x ≥ 0 –2x ≥ –8 x ≤ 4 domain: ( , 4].
88. The denominator is zero when x = –7 or x = 3. domain: , 7 7,3 3,
89. The expressions under each radical must not be negative. The denominator is zero when x = 5. x – 2 ≥ 0 x ≥ 2 domain: 2,5 5,
90. The expressions under each radical must not be negative.
1 0 and 5 0
1 5
x x
x x
domain: 1,
Page 27
Chapter 1 Functions and Graphs
250 Copyright © 2014 Pearson Education, Inc.
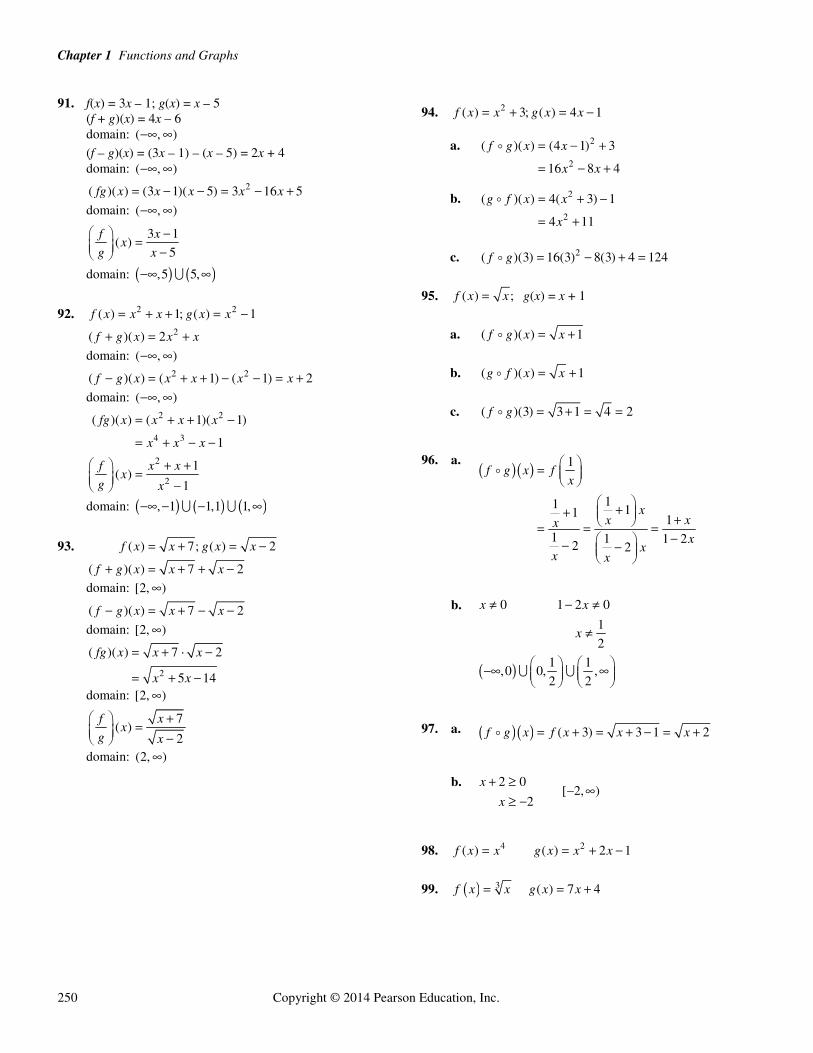
91. f(x) = 3x – 1; g(x) = x – 5 (f + g)(x) = 4x – 6 domain: ( , )
(f – g)(x) = (3x – 1) – (x – 5) = 2x + 4 domain: ( , )
2( )( ) (3 1)( 5) 3 16 5fg x x x x x
domain: ( , )
3 1( )
5
f xx
g x
domain: ,5 5,
92. 2 2( ) 1; ( ) 1f x x x g x x 2( )( ) 2f g x x x
domain: ( , ) 2 2( )( ) ( 1) ( 1) 2f g x x x x x
domain: ( , ) 2 2
4 3
2
2
( )( ) ( 1)( 1)
1
1( )
1
fg x x x x
x x x
f x xx
g x
domain: , 1 1,1 1,
93. ( ) 7; ( ) 2
( )( ) 7 2
f x x g x x
f g x x x
domain: [2, )
( )( ) 7 2f g x x x
domain: [2, )
2
( )( ) 7 2
5 14
fg x x x
x x
domain: [2, )
7( )
2
f xx
g x
domain: (2, )
94. 2( ) 3; ( ) 4 1f x x g x x
a. 2
2
( )( ) (4 1) 3
16 8 4
f g x x
x x
b. 2
2
( )( ) 4( 3) 1
4 11
g f x x
x
c. 2( )(3) 16(3) 8(3) 4 124f g
95. ( ) ;f x x g(x) = x + 1
a. ( )( ) 1f g x x
b. ( )( ) 1g f x x
c. ( )(3) 3 1 4 2f g
96. a. 1
11 11 11 1 1 22 2
f g x fx
xxxxx
xx x
b. 0 1 2 0
1
2
x x
x
1 1,0 0, ,
2 2
97. a. ( 3) 3 1 2f g x f x x x
b. 2 0
2
x
x
[ 2, )
98. 4 2( ) ( ) 2 1f x x g x x x
99. 3 ( ) 7 4f x x g x x
Page 28
Chapter 1 Review Exercises
Copyright © 2014 Pearson Education, Inc. 251
100. 3 1 5
( ) ; ( ) 25 2 3
f x x g x x
3 5 1( ( )) 2
5 3 2
6 1
5 27
10
f g x x
x
x
5 3 1( ( )) 2
3 5 2
52
67
6
g f x x
x
x
f and g are not inverses of each other.
101. 2
( ) 2 5 ; ( )5
xf x x g x
2( ( )) 2 5
5
2 (2 )
2 (2 5 ) 5( ( ))
5 5
xf g x
x
x
x xg f x x
f and g are inverses of each other.
102. a. ( ) 4 3f x x
1
4 3
4 3
3
43
( )4
y x
x y
xy
xf x
b. 1 3( ( )) 4 3
4
xf f x
3 3x
x
1 (4 3) 3 4( ( ))
4 4
x xf f x x
103. a. 3( ) 8 1f x x 3
3
3
3
3
3
31
8 1
8 1
1 8
1
8
1
8
1
2
1( )
2
y x
x y
x y
xy
xy
xy
xf x
b. 3
31 1( ) 8 1
2
xf f x
18 1
8
1 1
x
x
x
33
1
3 3
8 1 1( )
2
8
22
2
xf f x
x
x
x
104. a. 2
( ) 5f xx
1
25
25
2 5
5 2
( 5) 2
2
52
( )5
yx
xy
xy y
xy y
y x
yx
f xx
Page 29
Chapter 1 Functions and Graphs
252 Copyright © 2014 Pearson Education, Inc.
b. 1 2( ) 5
2
5
f f x
x
2( 5)5
25 5
x
x
x
1 2( )
25 5
22
2
2
f f x
x
xx
x
105. The inverse function exists.
106. The inverse function does not exist since it does not pass the horizontal line test.
107. The inverse function exists.
108. The inverse function does not exist since it does not pass the horizontal line test.
109.
110. 2( ) 1f x x 2
2
2
1
1
1
1
1
( ) 1
y x
x y
y x
y x
f x x
111. ( ) 1f x x
2
1 2
1
1
1
( 1)
( ) ( 1) , 1
y x
x y
x y
x y
f x x x
112. 2 2
2 2
[3 ( 2)] [9 ( 3)]
5 12
25 144
169
13
d
113. 22
2 2
[ 2 ( 4)] 5 3
2 2
4 4
8
2 2
2.83
d
114. 2 12 6 4 10 10
, , 5,52 2 2 2
115. 4 ( 15) 6 2 11 4 11
, , , 22 2 2 2 2
116. 2 2 2
2 2
3
9
x y
x y
117. 2 2 2
2 2
( ( 2)) ( 4) 6
( 2) ( 4) 36
x y
x y
Page 30
Chapter 1 Review Exercises
Copyright © 2014 Pearson Education, Inc. 253
118. center: (0, 0); radius: 1
domain: 1,1
range: 1,1
119. center: (–2, 3); radius: 3
domain: 5,1
range: 0,6
120. 2 2
2 2
2 2
2 2
4 2 4 0
4 2 4
4 4 2 1 4 4 1
( 2) ( 1) 9
x y x y
x x y y
x x y y
x y
center: (2, –1); radius: 3
domain: 1,5
range: 4,2
121. a. ( ) 567 15W x x
b. 702 567 15
135 15
9
x
x
x
9 years after 2000, in 2009, the average weekly sales will be $702.
122. a. ( ) 15 0.05f x x
b. ( ) 5 0.07g x x
c. 15 0.05 5 0.07
10 0.02
500
x x
x
x
For 500 minutes, the two plans cost the same. 123. a. ( ) 400 2( 120)
400 2 240
640 2
N x x
x
x
b. ( ) (640 2 )
22 640
R x x x
x x
124. a. 16 2 24 2
( ) (16 2 )(24 2 )
w x l x
V x x x x
b. 0 < x < 8
125. 2 3 400
2 400 3
400 3
2Let width
400 3( )
2
(400 3 )
2
l w
l w
wl
x
wA x x
x w
126.
8
82
( ) 2 4
822 42
3222
V lwh
x x h
hx
A x x x hx
x xx
xx
127. I = 0.08x + 0.12(10,000 – x)
Page 31
Chapter 1 Functions and Graphs
254 Copyright © 2014 Pearson Education, Inc.
Chapter 1 Test
1. (b), (c), and (d) are not functions.
2. a. f(4) – f(–3) = 3 – (–2) = 5
b. domain: (–5, 6]
c. range: [–4, 5]
d. increasing: (–1, 2)
e. decreasing: ( 5, 1) or (2, 6)
f. 2, f(2) = 5
g. (–1, –4)
h. x-intercepts: –4, 1, and 5.
i. y-intercept: –3
3. a. –2, 2
b. –1, 1
c. 0
d. even; ( ) ( )f x f x
e. no; f fails the horizontal line test
f. (0)f is a relative minimum.
g.
h.
i.
j. 2 1
2 1
( ) ( ) 1 0 1
1 ( 2) 3
f x f x
x x
4.
domain: ,
range: ,
5.
domain: 2,2
range: 2,2
6.
domain: ,
range: {4}
Page 32
Chapter 1 Test
Copyright © 2014 Pearson Education, Inc. 255
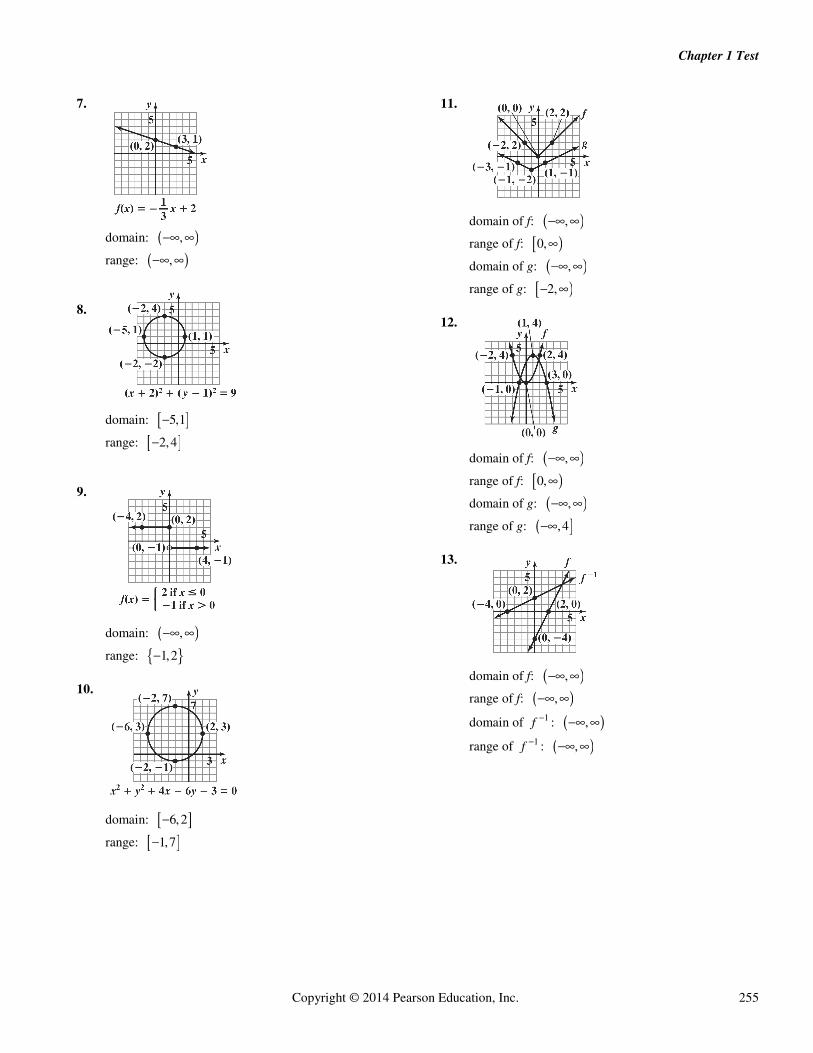
7.
domain: ,
range: ,
8.
domain: 5,1
range: 2,4
9.
domain: ,
range: 1,2
10.
domain: 6,2
range: 1,7
11.
domain of f: ,
range of f: 0,
domain of g: ,
range of g: 2,
12.
domain of f: ,
range of f: 0,
domain of g: ,
range of g: ,4
13.
domain of f: ,
range of f: ,
domain of 1f : ,
range of 1f : ,
Page 33
Chapter 1 Functions and Graphs
256 Copyright © 2014 Pearson Education, Inc.
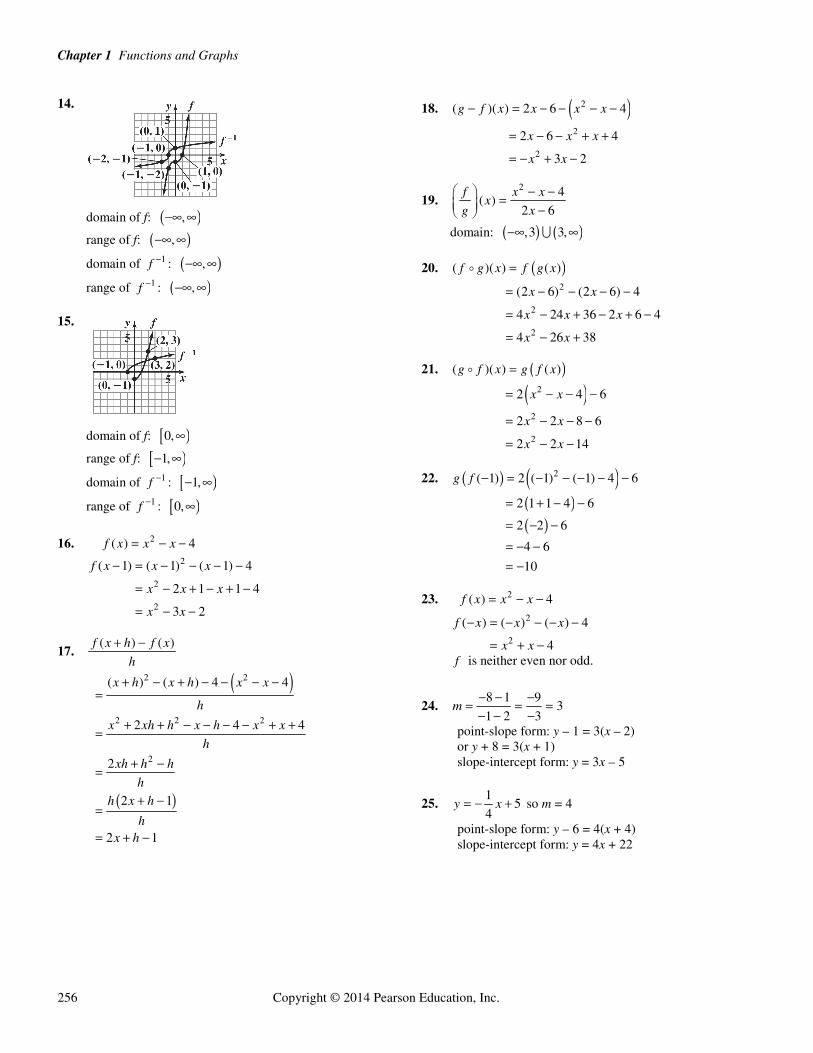
14.
domain of f: ,
range of f: ,
domain of 1f : ,
range of 1f : ,
15.
domain of f: 0,
range of f: 1,
domain of 1f : 1,
range of 1f : 0,
16. 2( ) 4f x x x 2
2
2
( 1) ( 1) ( 1) 4
2 1 1 4
3 2
f x x x
x x x
x x
17. ( ) ( )f x h f x
h
2 2
2 2 2
2
( ) ( ) 4 4
2 4 4
2
2 1
2 1
x h x h x x
h
x xh h x h x x
h
xh h h
hh x h
hx h
18. 2( )( ) 2 6 4g f x x x x
2
2
2 6 4
3 2
x x x
x x
19. 2 4
( )2 6
f x xx
g x
domain: ,3 3,
20. ( )( ) ( )f g x f g x
2
2
2
(2 6) (2 6) 4
4 24 36 2 6 4
4 26 38
x x
x x x
x x
21. ( )( ) ( )g f x g f x
2
2
2
2 4 6
2 2 8 6
2 2 14
x x
x x
x x
22. 2( 1) 2 ( 1) ( 1) 4 6g f
2 1 1 4 6
2 2 6
4 6
10
23. 2( ) 4f x x x 2
2
( ) ( ) ( ) 4
4
f x x x
x x
f is neither even nor odd.
24. 8 1 9
31 2 3
m
point-slope form: y – 1 = 3(x – 2) or y + 8 = 3(x + 1) slope-intercept form: y = 3x – 5
25. 1
54
y x so m = 4
point-slope form: y – 6 = 4(x + 4) slope-intercept form: y = 4x + 22
Page 34
Chapter 1 Test
Copyright © 2014 Pearson Education, Inc. 257
26. Write 4 2 5 0x y in slope intercept form.
4 2 5 0
2 4 5
522
x y
y x
y x
The slope of the parallel line is –2, thus the slope of the desired line is 2.m
1 1( )
( 10) 2 ( 7)
10 2( 7)
10 2 14
2 24 0
y y m x x
y x
y x
y x
x y
27. a. Find slope: 5870 4571 1299
4334 1 3
m
point-slope form:
1 1
4571 433 1
y y m x x
y x
b. slope-intercept form:
4571 433 1
4571 433 433
433 4138
( ) 433 4138
y x
y x
y x
f x x
c. ( ) 433 4138
433(10) 4138
8468
f x x
According to the model, 8468 fatalities will involve distracted driving in 2014.
28. 2 23(10) 5 [3(6) 5]
10 6205 103
4192
448
29. g(–1) = 3 – (–1) = 4
(7) 7 3 4 2g
30. The denominator is zero when x = 1 or x = –5. domain: , 5 5,1 1,
31. The expressions under each radical must not be negative.
5 0 and 1 0
5 1
x x
x x
domain: 1,
32. 7 7
( )( )2 2 44
xf g x
xx
0, 2 4 0
1
2
x x
x
domain: 1 1,0 0, ,
2 2
33. 7 2 3f x x g x x
34. 2 22 1 2 1( ) ( )d x x y y
222 1 2 1
22
2 2
( )
(5 2) 2 ( 2)
3 4
9 16
25
5
d x x y y
1 2 1 2 2 5 2 2, ,
2 2 2 2
7,0
2
x x y y
The length is 5 and the midpoint is
7,0 or 3.5,0
2
.
35. a. ( ) 41.78 0.19T x x
b. 35.7 41.78 0.19
6.08 0.19
32
x
x
x
32 years after 1980, in 2012, the winning time will be 35.7 seconds.
Page 35
Chapter 1 Functions and Graphs
258 Copyright © 2014 Pearson Education, Inc.
36. a. ( ) 50 1.5( 30)
50 1.5 45
95 1.5
Y x x
x
x
b. ( ) (95 1.5 )
21.5 95
T x x x
x x
37. 2 2 600
2 600 2
300
Let
( ) (300 )
2 300
l w
l w
l w
x w
A x x x
x x
38.
8000
80002
80002( ) 2 42
32,00022
V lwh
x x h
hx
A x x xx
xx