Chapter 1 Growth strategy and structural reform initiatives in major countries In this chapter, we look at various structural reforms being carried out in countries and regions. First, regarding Europe, we compare and analyze the characteristics and effects of labor market reforms that vary from country to country and from region to region. In Section 2, we focus on the United States and analyze the backgrounds and the current status of the U.S. manufacturing industry’s reshoring movement, a key point on which the Obama Administration focuses, that brings manufacturing operations back to the United States from abroad and also examine the effects of increasing production of shale gas and oil on the U.S. economy and U.S. companies’ overseas business operations. In Section 3, we analyze economic challenges for China and describe structural reforms that the government of China is trying to carry out. Finally, in Section 4, we look at structural reforms being carried out in ASEAN4 (Thailand, Malaysia, Indonesia and the Philippines) to achieve sustainable growth. Section 1 Labor market reforms in Europe 1. Economic conditions in Europe In the second quarter of 2013, the euro area recorded the first positive GDP growth in real terms in seven quarters. Industrial production has also been recovering moderately. Government bond yields have remained stable since falling in the autumn of 2012, and securities investments in the euro area are increasing, indicating that the region’s financial markets are becoming stable. While there are signs of moderate economic recovery, there remain downside risks for the economy. The growth rate of consumer prices has remained low, and bank loans to private companies also remain stagnant due to the need for the banking sector to maintain financial soundness as well as weak demand. Since the autumn of 2012, the unemployment rate has stayed above 12% in the entire euro area, with the youth unemployment rate exceeding 23% 1 . Even though there are signs of improvement in some countries, the unemployment rate still remains at a high level. On the other hand, while growth in capital investment and personal consumption remains weak, exports have expanded and inward foreign direct investment has increased in some countries. It has been pointed out that the expanded exports and increased foreign direct investment reflect the positive effects of labor market reforms. Amid the stagnant economic conditions due to the European debt crisis, European countries are carrying out various structural reforms in order to achieve fiscal consolidation and strengthen competitiveness. Of the reforms, labor market reforms are drawing particular attention. Labor market reforms, which are being carried out through the combination of such measures as deregulation and enhancement of support for unemployed people to find jobs, have distinct national characteristics in terms of specifics and balance. Below, we will look at labor market reforms in European countries. 1 Eurostat, as of April 2014 (data for the period until February). 95
Transcript
Chapter 1 Growth strategy and structural reform initiatives in major countries
In this chapter, we look at various structural reforms being carried out in countries and regions. First, regarding Europe, we compare and analyze the characteristics and effects of labor market reforms that vary from country to country and from region to region. In Section 2, we focus on the United States and analyze the backgrounds and the current status of the U.S. manufacturing industry’s reshoring movement, a key point on which the Obama Administration focuses, that brings manufacturing operations back to the United States from abroad and also examine the effects of increasing production of shale gas and oil on the U.S. economy and U.S. companies’ overseas business operations. In Section 3, we analyze economic challenges for China and describe structural reforms that the government of China is trying to carry out. Finally, in Section 4, we look at structural reforms being carried out in ASEAN4 (Thailand, Malaysia, Indonesia and the Philippines) to achieve sustainable growth.
Section 1 Labor market reforms in Europe 1. Economic conditions in Europe
In the second quarter of 2013, the euro area recorded the first positive GDP growth in real terms in seven quarters. Industrial production has also been recovering moderately. Government bond yields have remained stable since falling in the autumn of 2012, and securities investments in the euro area are increasing, indicating that the region’s financial markets are becoming stable.
While there are signs of moderate economic recovery, there remain downside risks for the economy. The growth rate of consumer prices has remained low, and bank loans to private companies also
remain stagnant due to the need for the banking sector to maintain financial soundness as well as weak demand.
Since the autumn of 2012, the unemployment rate has stayed above 12% in the entire euro area, with the youth unemployment rate exceeding 23%1. Even though there are signs of improvement in some countries, the unemployment rate still remains at a high level.
On the other hand, while growth in capital investment and personal consumption remains weak, exports have expanded and inward foreign direct investment has increased in some countries. It has been pointed out that the expanded exports and increased foreign direct investment reflect the positive effects of labor market reforms.
Amid the stagnant economic conditions due to the European debt crisis, European countries are carrying out various structural reforms in order to achieve fiscal consolidation and strengthen competitiveness. Of the reforms, labor market reforms are drawing particular attention.
Labor market reforms, which are being carried out through the combination of such measures as deregulation and enhancement of support for unemployed people to find jobs, have distinct national characteristics in terms of specifics and balance. Below, we will look at labor market reforms in European countries.
1 Eurostat, as of April 2014 (data for the period until February).
95
2. Direction of labor policy in Europe in recent years Since the 1990s, non-regular employment has increased in European countries due to the need to
reduce costs amid global competition. In this situation, in order to improve the terms of employment for non-regular workers, European framework directives concerning part-time work and fixed-term work were issued in 1997 and 1999, and many countries implemented deregulation with regard to non-regular employment contracts while seeking to ensure a certain level of treatment regarding workers’ wages and holidays2.
The problem of the rigidity of the labor market has been pointed out with regard to Europe: mainly southern Europe. Namely, while flexibility has been introduced with regard to non-regular employment as mentioned above, it is difficult to make adjustments concerning wages, working hours and dismissal with regard to regular workers. This not only puts heavy downward pressure on corporate profits when business conditions deteriorate but also generates such effects as discouraging new employment. Therefore, in the labor market reforms carried out by southern European counties in recent years, efforts have been made to increase labor market flexibility through such measures as reducing the binding power of sectoral agreements, relaxing wage adjustment procedures and easing regulations regarding dismissal.
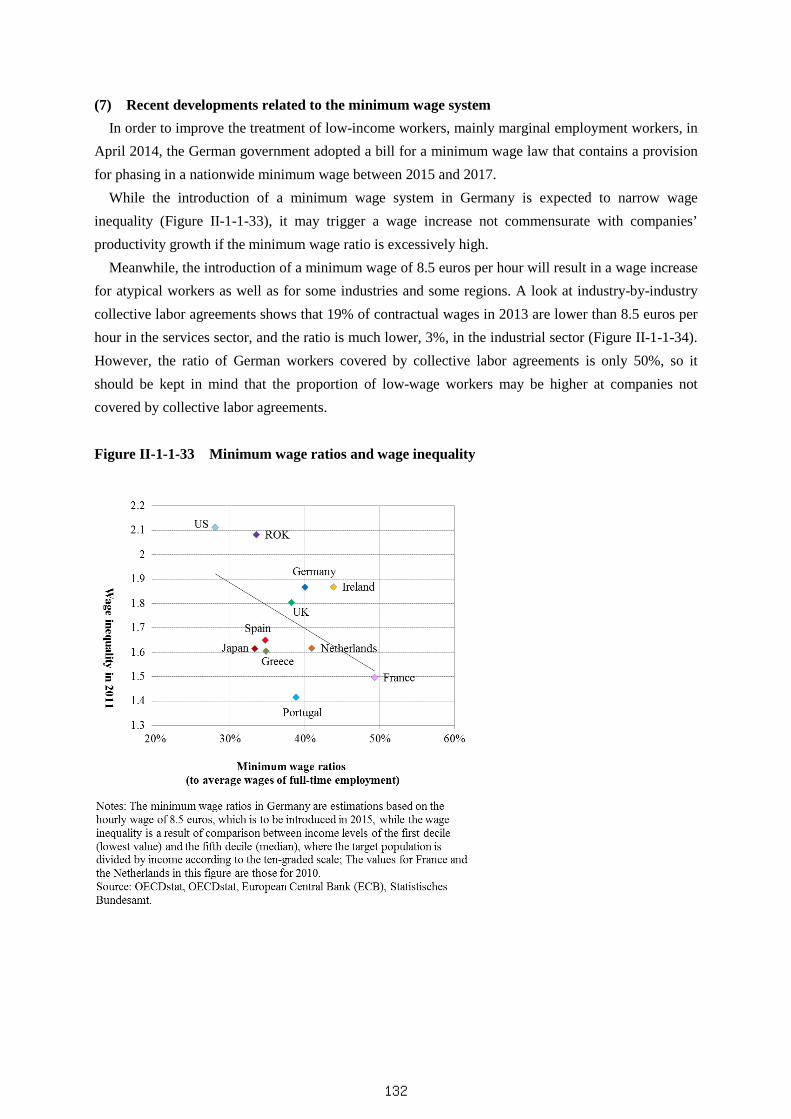
At the same time, based on the recognition that the large proportion of non-regular workers is one of the factors that aggravated the unemployment rate at the time of the European debt crisis, the treatment of non-regular workers has been further improved in order to resolve the gap with regular workers. Specific measures to do so include avoiding prolonging of the duration of fixed-term employment contracts 3 and automatically converting fixed-term employment into permanent employment after a certain period of time. In Germany, where low-wage workers account for a large proportion of total workers, an agreement was reached in April 2014 on introducing a nationwide universal minimum wage in order to raise such workers’ standards of living.
Meanwhile, Denmark and the Netherlands have adopted a labor policy called “flexicurity” since the mid-1990s. Flexicurity refers to the policy of seeking to stabilize employment by (i) enhancing flexibility with regard to working hours and the labor market, (ii) protecting incomes during the period of unemployment through generous social security and (iii) increasing employability through an active labor market policy. Since 2000, flexicurity has spread to other countries, and in particular, active 2 For example, Italy legalized temporary agency work in 1997 and prescribed the authorization obligation,
restrictions on reasons for usage, and the principle of equal treatment, etc. In 2003, the scope of usage was
expanded (Hamaguchi (2012)).
In 2001, Germany stipulated that no restriction be placed on the duration of the term in the case of
fixed-term employment contracts for prescribed purposes or on the purpose in the case of fixed-term
employment contracts with a term of up to two years. At the same time, Germany set the principle of equal
treatment (Tabata (2012)). 3This is intended to prevent the same person from repeatedly renewing fixed-term employment contracts
and continuing to engage in a similar job in the same workplace. In the EU, the basic idea is that permanent
employment is common and fixed-term employment is exceptional.
96
labor market policies, one of the pillars of flexicurity, has been introduced in many countries, including Germany and Spain4.
Table II-1-1-1 Recent major labor policies in Europe
3. Comparison of the labor market and labor policies between countries
While labor policy varies from country to country, it has become apparent that both the long-term unemployment rate and inequality tend to be relatively low in northern European countries and the Netherlands while both tend to be relatively high in southern Europe when the long-term unemployment rate5 and the GINI index before income transfer6 are compared in order to check how the effects of labor policies are reflected in the labor market and national income inequality. In Germany, long-term unemployment, which was at a high level compared with in other European countries, has declined in recent years, falling close to the level in northern Europe and the Netherlands in 2012. It should be noted that in the United Kingdom and the United States, the long-term unemployment rate is not very high but inequality is large (there is a significant deviation
4 Suzuki (2009). 5 People who have been unemployed for one year or longer (OECD stat). 6 Figures for people aged from 18 to 65 before transfer of public income, such as old-age cash benefit public pension and unemployment benefits, and before tax (OECD stat).
Objects Details Countries
Avoiding prolonging of the duration of fixed-term employmentcontracts (setting upper limits & converting fixed-termemployment into permanent employment) (*2); improving thetreatment of non-regular workers (*3); increasing the cost fornon-regular workers (*4), etc.
France in 2013 (fixed-term); Netherlands in 2012 (temporary) &2014 (fixed-term); Italy in 2012 (fixed-term); Germany in 2011(temporary); UK in 2011 (temporary); Spain in 2010 (fixed-term)
Protecting the rights of the employee posted to work in anotherMember State (*5)
EU in 2014
Introducing a nationwide universal minimum wage
Germany agreed in April 2014 (to introduce the policy step-by-step from 2015 to 2017) (Major countries, excluding Italy andSweden, and Denmark have introduced legal minimum wagesystems.)
Wage adjustment flexibility (*6) France in 2013; Spain in 2012
Relaxing dismissal regulations of regular workers Spain in 2012; Italy in 2012
Tightening of the provision of unemployment benefits (duration,amount and entitlements); raising the retirement age
Netherlands in 2015; Italy in 2012; Denmark in 2006 &2010;Sweden in 2008, Germany in 2003 & 2007
Enhancing vocational training; strengthening active labor marketpolicy
Spain in 2012; Sweden in 2011; UK in 2010; France in 2010;Germany in 2004, etc.
Stable employment ofworkers; Enhancedregulations on non-regular employment
Labor market flexibility
Promotingemployment
(*1): (fixed-term): Measures for fixed-term employment; (temporary): Measures for temporary-agency employment(*2): Spain set the upper limit of fixed-term employment to three years and converted the employment to permanent employment two years later in 2010;Italy set the upper limit of fixed-term employment to three years in 2012; The Netherlands’ Diet will approve a law for shortening the upper limit of a fixed-employment period (as of March 2014).(*3): The UK introduced the equal treatment of temporary agency workers in 2011; Germany introduced the minimum wage for temporary agency workersin 2011; The Netherlands introduced the requirements for all companies involved in the supply of workers to be registered in 2012.(*4): Spain raised the dismissal compensation of fixed-term employment workers in 2010; France raised the unemployment insurance premiums of fixed-term employment workers in 2013 for encouraging permanent employment in 2013.(*5): In May 2014, the European Council of Ministers adopted the Posting of Workers Enforcement directive for appropriate implementation of the rulesfor securing working conditions for the employees posted to work in another EU Member State.(*6) Spain relaxed wage agreements by industry to ease the wage adjustment by companies and streamlined the procedures for wage adjustment; Franceallowed labor-management negotiations to determine the wage when companies’ achievement deteriorates.Source: Dutch Association of Temporary Work Agencies (ABU), Global Work Place Insider, the International Employment Lawyer, the Institute for theStudy of Labor (IZA) of Germany, the Department for Business, Innovation & Skills (BIS) of the UK, Ministry of Health, Labour and Welfare of Japan,the Japan Institute for Labour Policy and Training, and JETRO.
97
from the trend line of the distribution of OECD countries along the horizontal axis (the GINI index)) (Figure II-1-1-2). In Japan, the long-term unemployment rate is low and inequality rates are between the levels in northern Europe and the Netherlands and the levels in the United Kingdom and the United States and have been closer to the former levels of northern Europe and the Netherlands in recent years.
Figure II-1-1-2 Long-term unemployment rates and gap with regular workers (before income transfer)
(1) Northern Europe and the Netherlands Regarding indicators concerning individual countries’ labor policies, expenditures on active labor
market policy measures such as vocational training and support for unemployed people to find jobs are larger in northern Europe and the Netherlands than in other countries. Regarding non-regular employment, northern Europe and the Netherlands are at a middle level in terms of the strictness of their regulation of employment contracts and are at a relatively high level in terms of equal treatment.
Denmark
France
Germany
Italy
Japan
Netherlands
SpainSweden UK
the U.S0%
4%
8%
12%
0.3 0.35 0.4 0.45 0.5
Long-term
unemploym
ent rates
GINI indices
Long-term unemployment rates and GINI indices in 2008 (before income transfer)
Notes: Long-term unemployment rates refer to the ratios of people who have been unemployed for one year or longer to the labor force in the private sector; the GINI indices (before income transfer) refer to people aged 18 to 65 (for Japan, as of 2009); the trendline shows the values for the OECD member countries.Source: OECDstat.
Denmark
FranceGermanyItaly
Japan
Netherlands
Spain
Sweden
UKthe U.S.
0%
4%
8%
12%
0.3 0.35 0.4 0.45 0.5
Lon
g-term u
nem
ploym
ent rates
GINI indices
Long-term unemployment rates and GINI indices in 2010 (before income transfer)
Notes: Long-term unemployment rates refer to the ratios of people who have been unemployed for one year or longer to the labor force in the private sector; the GINI indices (before income transfer) refer to people aged 18 to 65 (for Japan, as of 2009); the trendline shows the values for the OECD member countries.Source: OECDstat.
Denmark
France
Germany
Italy
JapanNetherlands
Spain
Sweden
UK
the U.S.
0%
4%
8%
12%
0.3 0.35 0.4 0.45 0.5
Long-term
unemploym
ent rates
GINI indices
Long-term unemployment rates in 2012 and GINI indices in 2010 (before income transfer)
Notes: Long-term unemployment rates refer to the ratios of people who have been unemployed for one year or longer to the labor force in the private sector; the GINI indices (before income transfer) refer to those in 2010, targeting people aged 18 to 65 (for Japan, as of 2009); the trendline shows the values for the OECD member countries.Source: OECDstat.
98
Regarding the strictness of regulations regarding dismissal, Sweden and the Netherlands exceed the OECD average somewhat, but Denmark is below the European average (Figure II-1-1-3).
Figure II-1-1-3 Labor policy indicators in Northern Europe and the Netherlands
Notes 1: Regarding expenditures for passive labor market policy (unemployment benefits, early retirement benefits) and expenditures for active labor market policy (support for finding jobs for unemployed people, vocational training, job creation, etc.), the values are calculated per person with the age of 18 to 65 in U.S. dollars. Blue lines show the values for 2011 while red shows those for 2008. Also, the larger the scores the larger the value. Notes 2: Out of the three categories concerning the OECD individual dismissal regulations, the dismissal regulations (individual bases) are defined based on the category covering the dismissal notice period (from sending the notice to the actual dismissal of workers), and severance pay, difficulty of dismissal including the definition of justified, length of trial period, and maximum time to make a claim of unfair dismissal (using the OECD EPRC report version 3), excluding the category of the inconvenience concerning the procedures for sending dismissal notices (necessity of a written statement and a notice to the administrative agencies, and delay, involved before notice can start), with the larger the scores, the stricter the regulation. Notes 3: Non-regular employment (regulation on employment contracts) refers to the sum of the seven indicators concerning: valid cases for use; types of work for which temporary work agency employment is legal; authorization or reporting obligations; the number of successive fixed-term contracts; and limitation of the cumulated duration of TWA assignments, about the OECD fixed-term employment contracts and temporary-agency employment contracts, with the larger the scores, the stricter the regulation. Notes 4: Blue lines show the values in 2013 while red show in 2008, not otherwise provided for. Notes 5: Standard deviations are calculated targeting all the OECD member countries, and the distribution of the member countries to the standard deviations is marked according to the 10 scales. Notes 6: Concerning how to read the OECD dismissal regulation indicators, METI referred to the booklet titled “KEIZAI KYOURYOKU KAIHATSU KIKO (OECD) NO KOYO HOGO SHIHYO (2013) NI TSUITE (Details of the OECD Employment Protection Indicators in 2013),” publicized by the Japan Institute for Labour Policy and Training. Source: OECDstat.
(2) Germany
In Germany, expenditures on active labor market policy measures are lower than the above three countries but are higher than the OECD average. Germany is at a middle level in terms of the strictness of regulation on non-regular employment and is above the OECD average in terms of the strictness of regulation on dismissal (Figure II-1-1-4).
Figure II-1-1-4 Labor policy indicators in Germany
0
5
10
Dismissal regulation
Non-regular employment (regulation on employment
contracts)
Non-regular employment (equal
treatment)
Expenditures for active labor market
policy
Expenditures for passive labor market policy
Denmark
0
5
10
Dismissal regulation
Non-regular employment (regulation on employment
contracts)
Non-regular employment (equal
treatment)
Expenditures for active labor market
policy
Expenditures for passive labor market policy
Sweden
0
5
10
Dismissal regulation
Non-regular employment (regulation on employment
contracts)
Non-regular employment (equal
treatment)
Expenditures for active labor market
policy
Expenditures for passive labor market policy
Netherlands
99
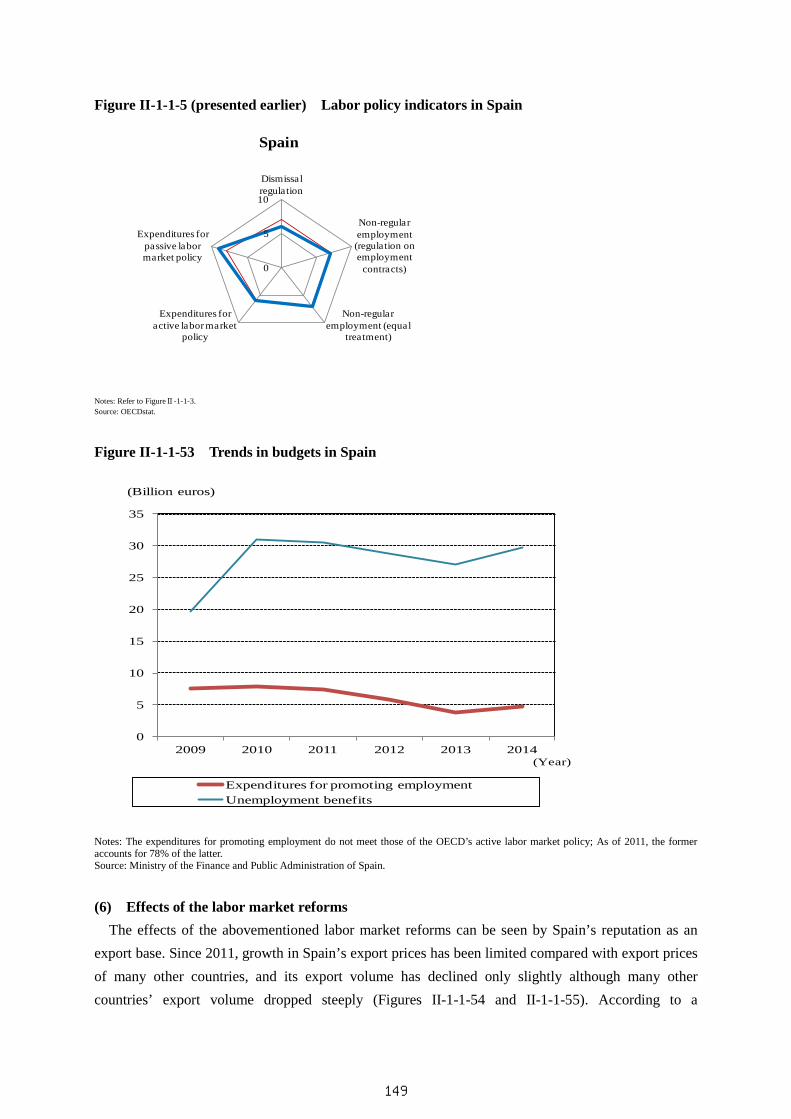
(3) Southern Europe In southern Europe, both regulation related to non-regular employment and regulations regarding
dismissal are strict. Expenditures on active labor market policy measures in southern Europe are below the European average (Figure II-1-1-5).
Figure II-1-1-5 Labor policy indicators in Southern Europe
(4) The United Kingdom and the United States
In the United Kingdom and the United States, expenditures on both active and passive labor market policy measures are low and regulation on dismissal and market regulation related to non-regular employment is loose (Figure II-1-1-6).
Figure II-1-1-6 Labor policy indicators in UK and US
4. Labor policy of Denmark (1) Keeping the long-term unemployment rate low
The growth of the Danish economy has remained stagnant since 2010 against the backdrop of
0
5
10
Dismissalregulation
Non-regularemployment
(regulation onemployment
contracts)
Non-regularemployment (equal
treatment)
Expenditures foractive labor market
policy
Expenditures forpassive labormarket policy
Spain
0
5
10
Dismissal regulation
Non-regular employment (regulation on employment
contracts)
Non-regular employment (equal
treatment)
Expenditures for active labor market
policy
Expenditures for passive labor market policy
the U.S.
100
sluggish demand in the EU region, which is Denmark’s main export destination. The unemployment rate rose significantly in 2009 and reached 7.8% in 2012. However, the unemployment rate in Denmark has been kept low compared with that in other countries (Figure II-1-1-7), and the long-term unemployment rate has stayed particularly low, peaking at 2.2% in the first quarter of 20127 (Figure II-1-1-8). Figure II-1-1-7 Trends in unemployment rates
Figure II-1-1-8 Trends in long-term unemployment rates
7 Until the fourth quarter of 2013.
0
3
6
9
12
15
18
21
24
27
1995
1996
1997
1998
1999
2000
2001
2002
2003
2004
2005
2006
2007
2008
2009
2010
2011
2012
Denmark France Germany Italy JapanNetherlands Spain Sweden UK the U.S.
(%)
Source: Eurostat.
(Year)
0
3
6
9
12
1995
1996
1997
1998
1999
2000
2001
2002
2003
2004
2005
2006
2007
2008
2009
2010
2011
2012
Denmark France Germany Italy Japan
Netherlands Spain Sweden UK the U.S.
(%)
Notes: Long-term unemployment workers refer to people who have been unemployed for one year or longer.Source: Eurostat.
(Year)
101
(2) Securing a flexible labor market and appropriate treatment for workers While the long-term unemployment rate has been kept low in Denmark as mentioned above, the
country has been implementing a labor policy known as “flexicurity,” which centers on a flexible labor market, a generous unemployment insurance program and an active labor market policy, since the labor market reform in 1994.
First, let us look at labor market flexibility, one of the pillars of flexicurity. As for regulation on dismissal of workers, dismissal on economic grounds is permitted, and
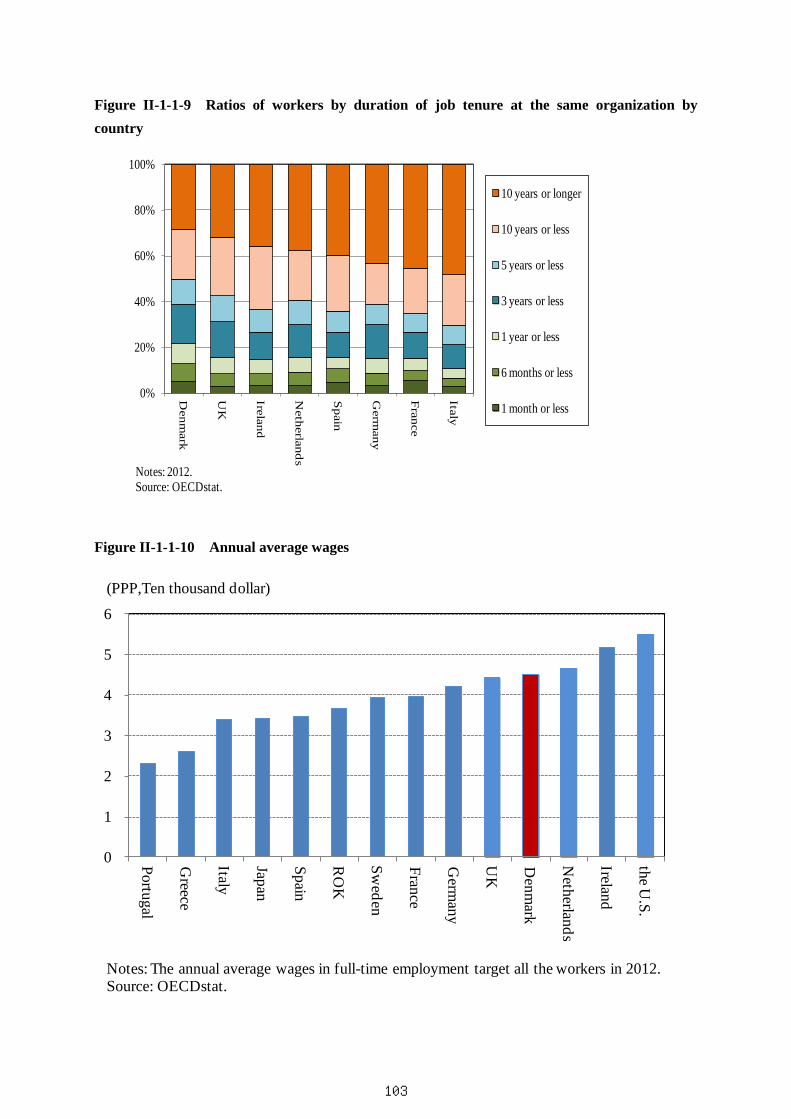
severance pay is low in comparison with many other European countries. While the prescribed dismissal notice period is relatively long, companies are permitted to dismiss workers if they follow relevant procedures8. The duration of job tenure at the same organization in Denmark is relatively short (Figure II-1-1-9).
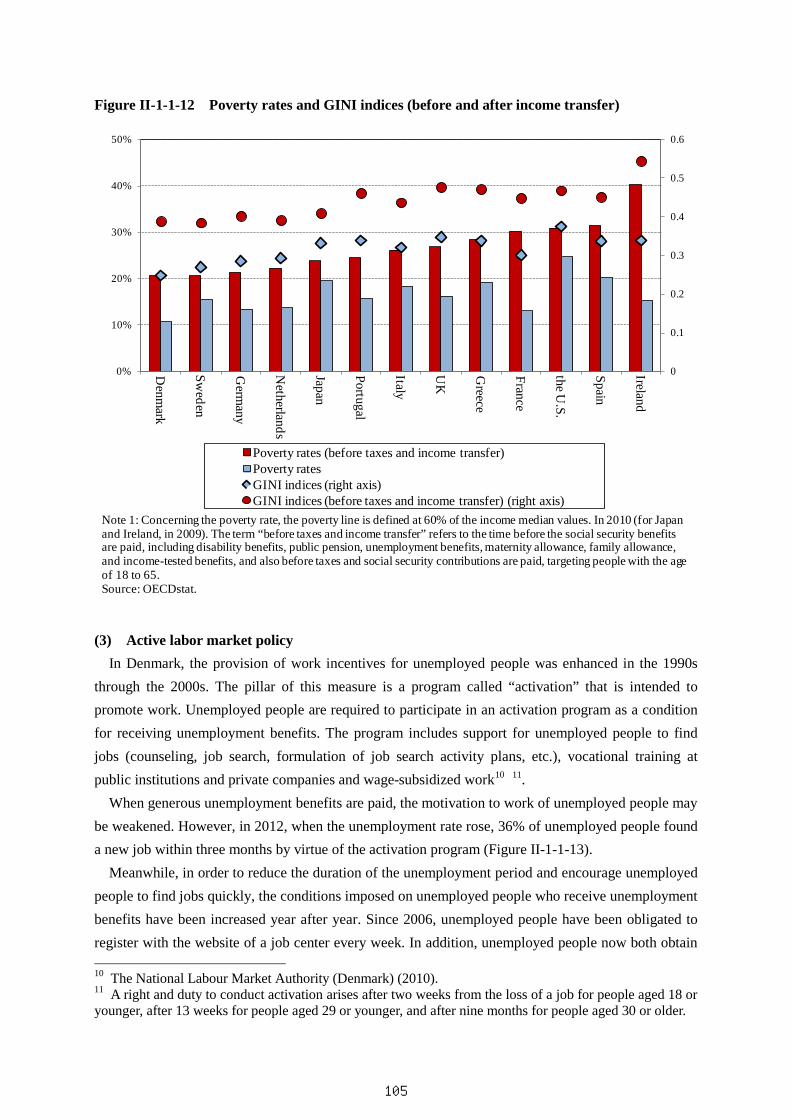
These points of flexibility regarding dismissal reduce the burden on companies, but it is not that workers are unilaterally neglected. Under a labor-management agreement reached as far back as the beginning of the 20th century, labor unions won the right to negotiate wages and working conditions, and today, labor-management negotiations still broadly contribute to securing appropriate treatment for workers. The ratio of the minimum wage determined through labor-management negotiations to the average wage9 is at a high level by international standards (Figure II-1-1-11), and the average wage is also at a high level (Figure II-1-1-10). Moreover, fixed-term employment contracts and temporary agency employment contracts are covered by collective labor agreements, and non-regular workers are in principle entitled to treatment equal to that of regular workers.
Consequently, Denmark’s GINI index, which is an indicator of the poverty rate and income inequality, is among the lowest in major countries; not only after income transfer but also before (Figure II-1-1-12).
Figure II-1-1-3 (presented earlier) Labor policy indicators in Denmark
Notes: Refer to FigureⅡ-1-1-3. Source: OECDstat.
8 According to the OECD indicators of the strictness of regulations on dismissals, although the definition of unfair dismissal is loose in Denmark, the prescribed dismissal notice period is long at a maximum of six months (JETRO (2009)). The regulations on dismissal notification procedures in Denmark are less strict than those in Germany and the Netherlands but stricter than those in many other European countries. 9 The minimum wage under the Industry Agreement, which is the main collective labor agreement, is high at 52% of average earnings for all workers (estimated based on Eurofound and Eurostat; 2010).
0
5
10
Dismissalregulation
Non-regularemployment
(regulation onemployment
contracts)
Non-regularemployment (equal
treatment)
Expenditures foractive labor market
policy
Expenditures forpassive labormarket policy
Denmark
102
Figure II-1-1-9 Ratios of workers by duration of job tenure at the same organization by country
Figure II-1-1-10 Annual average wages
0%
20%
40%
60%
80%
100%
Denm
ark
UK
Ireland
Netherland
s
Spain
Germ
any
France
Italy
10 years or longer
10 years or less
5 years or less
3 years or less
1 year or less
6 months or less
1 month or less
Notes: 2012.Source: OECDstat.
0
1
2
3
4
5
6
Portugal
Greece
Italy
Japan
Spain
RO
K
Sweden
France
Germ
any
UK
Denm
ark
Netherlands
Ireland
the U.S.
(PPP,Ten thousand dollar)
Notes: The annual average wages in full-time employment target all the workers in 2012.Source: OECDstat.
103
Figure II-1-1-11 Minimum wage rates by country
0%
10%
20%
30%
40%
50%
60%
70%
France
Ireland
Netherlands
Germ
any
Portugal
UK
Greece
Spain
ROK
Japan
the U.S.
Denm
ark
Median values subject to full-time employment (2012) Average wages of all workers (2010)
Note 1: Median values subject to full-time employment show the ratios of the annual minimum wages to the wages of full-time workers in 2012.Note 2: The average wages of all workers show the ratios of the annual minimum wages to the average wages of all workers, excluding those for the public sector and defense organizations. (Regarding Germany, it shows the ratios of the annual minimum wages in the hairdressing industry in the eastern area of Germany, the wage level of which is the lowest in the minimum wages per hour, specified by the government of Germany, to the average wages of all workers; Regarding Denmark, it shows the ratios of the annual minimum wages per hour, specified by the Industry Agreement, a major labor agreement in the country, to the average wages of all workers.)Note 3: In this figure, the ratios of the minimum wages in Japan is relatively lower than those of other countries. This is because that the low- and middle-class income in Japan is higher than those of other countries, leading to the higher middle-class income. This tendency, which has been pointed out by experts, brings about the fact that the ratio of the minimum wages to the middle-class income in Japan is likely to become lower.Sources: OECDstat, Eurostat, European Central Bank (ECB), Statistisches Bundesamt, Eurofound.
104
Figure II-1-1-12 Poverty rates and GINI indices (before and after income transfer)
(3) Active labor market policy In Denmark, the provision of work incentives for unemployed people was enhanced in the 1990s
through the 2000s. The pillar of this measure is a program called “activation” that is intended to promote work. Unemployed people are required to participate in an activation program as a condition for receiving unemployment benefits. The program includes support for unemployed people to find jobs (counseling, job search, formulation of job search activity plans, etc.), vocational training at public institutions and private companies and wage-subsidized work10 11.
When generous unemployment benefits are paid, the motivation to work of unemployed people may be weakened. However, in 2012, when the unemployment rate rose, 36% of unemployed people found a new job within three months by virtue of the activation program (Figure II-1-1-13).
Meanwhile, in order to reduce the duration of the unemployment period and encourage unemployed people to find jobs quickly, the conditions imposed on unemployed people who receive unemployment benefits have been increased year after year. Since 2006, unemployed people have been obligated to register with the website of a job center every week. In addition, unemployed people now both obtain 10 The National Labour Market Authority (Denmark) (2010). 11 A right and duty to conduct activation arises after two weeks from the loss of a job for people aged 18 or younger, after 13 weeks for people aged 29 or younger, and after nine months for people aged 30 or older.
0
0.1
0.2
0.3
0.4
0.5
0.6
0%
10%
20%
30%
40%
50%
Denm
ark
Sweden
Germ
any
Netherlands
Japan
Portugal
Italy
UK
Greece
France
the U.S.
Spain
Ireland
Poverty rates (before taxes and income transfer)Poverty ratesGINI indices (right axis)GINI indices (before taxes and income transfer) (right axis)
Note 1: Concerning the poverty rate, the poverty line is defined at 60% of the income median values. In 2010 (for Japan and Ireland, in 2009). The term “before taxes and income transfer” refers to the time before the social security benefits are paid, including disability benefits, public pension, unemployment benefits, maternity allowance, family allowance, and income-tested benefits, and also before taxes and social security contributions are paid, targeting people with the age of 18 to 65.Source: OECDstat.
105
a right and assume a duty to conduct activation earlier than before. Moreover, since 2007, in order to enhance operational efficiency, government job security offices that support reemployment of recipients of unemployment benefits and municipal facilities that support reemployment of people receiving welfare benefits have been integrated into job centers, and municipalities have been put in charge of operating job centers and paying unemployment benefits12. Under the new scheme, municipalities receive refunds from the national government for the unemployment benefits paid by them based on certain conditions13. Municipalities thus place priority on providing support that enables unemployed people to find jobs quickly14.
Industry provides some funds for general vocational training programs in order to foster personnel required by the labor market and is deeply involved in the formulation of training programs and implementation of in-house training conducted by companies.
Figure II-1-1-13 Ratios of unemployed people by the period of unemployment
(4) Unemployment benefits
In Denmark, the generous unemployment insurance program is regarded as a pillar of flexicurity, so
12 JETRO (2011). 13 The longer the unemployment benefits period lasts, the smaller the refund amounts become. Refunds are not provided if an interview with the unemployed person is not held or if the activation program is not implemented according to the prescribed schedule. 14 While strongly calling on unemployed people to find jobs produces some positive effects in terms of reducing the duration of the unemployment period, it raises concerns about the possibility that the freedom of choice of jobs may be restricted as priority is placed on early reemployment of unemployed people (OECD (2012)).
0
5
10
15
20
25
Sweden
Japan
Netherlands
Denmark
the U.S.
Germany
UK France
Italy
Portugal
Ireland
Spain
Greece
Less than 1 month Less than 3 months
Less than 6 months Less than 1 year
One year and over
Notes: The ratios were calculated by multiplying the unemployment ratios by the ratios by period of unemployment in 2012.Source: OECDstat.
(%)
106
the replacement rate of unemployment benefits is high, a maximum of 90% of the previous work income15 (Table II-1-1-14). As there is an upper limit on the benefits amount, the 90% replacement rate is applied only to people in a low-wage group. Nevertheless, according to the OECD indicators of the average replacement rate for full-time workers, Denmark’s replacement rate was the highest among the OECD member countries until 2009 (Figure II-1-1-15).
Until the early 1990s, the benefits duration was unlimited, but because of the perception that the generosity of the unemployment benefits was weakening unemployed people’s work motivation, the benefits duration was reduced several times since the latter half of the 1990s and the eligibility criteria for the benefits were tightened in 2006.
Since 2006, expenditures on unemployment benefits policy measures per unemployed person have declined steeply (Figure II-1-1-17), so we may say that Denmark’s flexicurity policy is shifting emphasis from unemployment benefits to an active labor market policy. However, if social assistance and housing benefits as well as unemployment benefits are included, the replacement rates in both Denmark and the Netherlands are higher than 65%, and are relatively high compared with the rates in other major OECD countries (Figure II-1-1-16).
Table II-1-1-14 Replacement rates of unemployment benefits to previous work income in major countries
Source: Report on Labor and Social Security Conditions Overseas (France and Spain (2010-2011); UK (2009-2010)); Eurofound website (Jul. 2013) (Italy); the Arbeitsförmedlingen, an employment service agency, of Sweden (Sep. 2013); Work in Denmark website (Ministry of Foreign Affairs of Denmark) (2012); HelloWork website of Japan (Apr. 2014); documents disclosed by the Ministry of Social Affairs and Employment of the Netherlands; and Social Security at a Glance (Jan. 2013) (Federal Ministry of Labour and Social Affairs of Germany).
15 It is prescribed that the replacement ratio should be a maximum of 90% of the previous work income but
should not exceed 3,940 kroners (equivalent to approximately ¥54,000 as of 2012) per week (Danish Ministry of Foreign Affairs’ website called “Work In Denmark”)
France 57.40% Higher ratio of either of 57.40%, or 40.4%+11.34 euros (as of 2011)
Italy 60%60% for the first 6 months; 50% for the 7-8 months (for people younger than 50), 40%for 9 months or longer (for people with the age of 50 or older); the upper limit of thecompensation is about 1,000 euros as of 2012
Germany 67% 60% for people who do not have dependent child or children
Spain 70% 60% after 180 days (upper limit: 1,087.20 euro/month) as of 2011
Netherlands 75% 70% from the 3 months and onward (upper limit: 197 euros/month) as of 2014
Japan 50-80% Higher rations for people with lower wages; the upper limits depend on ages (between6,405-7,830 yen/day)
Sweden 80% 80% for the first 200 days; 70% for the 100 days after the first 200 days; the upper limitis 680 SEK per day subject to unemployment insurance subscribers
Denmark 90% Upper limit: 3,940 crone/week as of 2012
UK - Depending on age when unemployed people start receiving the benefits
the U.S. - Depending on states
107
Figure II-1-1-15 Replacement rates of unemployment benefits excluding social assistance, etc.
Germany Spain France UKGreece Ireland Italy JapanNetherlands Portugal Sweden the U.S.Denmark
(%)
Notes: This figure shows the rates of the unemployment benefits to the previous work income after exemption of tax and social security payments and after receipt of cash benefits, excluding social assistance and housing benefits. It also shows the average rates targeting the full-time workers.Source: Benefit and Wages (OECD).
(Year)
108
Figure II-1-1-16 Replacement rates of unemployment benefits including social assistance, etc.
Figure II-1-1-17 Expenditure for labor market policy by unemployed person in Denmark
Germany Spain France UKGreece Ireland Italy JapanNetherlands Portugal Sweden the U.S.Denmark
(%)
Notes: This figure shows the rates of the unemployment benefits to the previous work income after exemption of tax and social security payments and after receipt of cash benefits, including social assistance and housing benefits. It also shows the average rates targeting the full-time workers.Source: Benefit and Wages (OECD).
(Year)
0
5
10
15
20
25
30
2002 2003 2004 2005 2006 2007 2008 2009 2010 2011Labor market servicesEmployment incentivesVocational trainingSupported employment and rehabilitation of people with disabilityUnemployment benefits, etc.Early retirement
Note 1: Per annual average number of unemployed people.Note 2: In this figure, vocational training targets people who are unemployed, those who may suffer involuntary unemployment, and those who are motivated but are outside the labor market, excluding such training generally provided to young people.Source: Eurostat.
(1,000 euros) 2006 Eligibility criteria for the benefits were tightened
(Year)
109
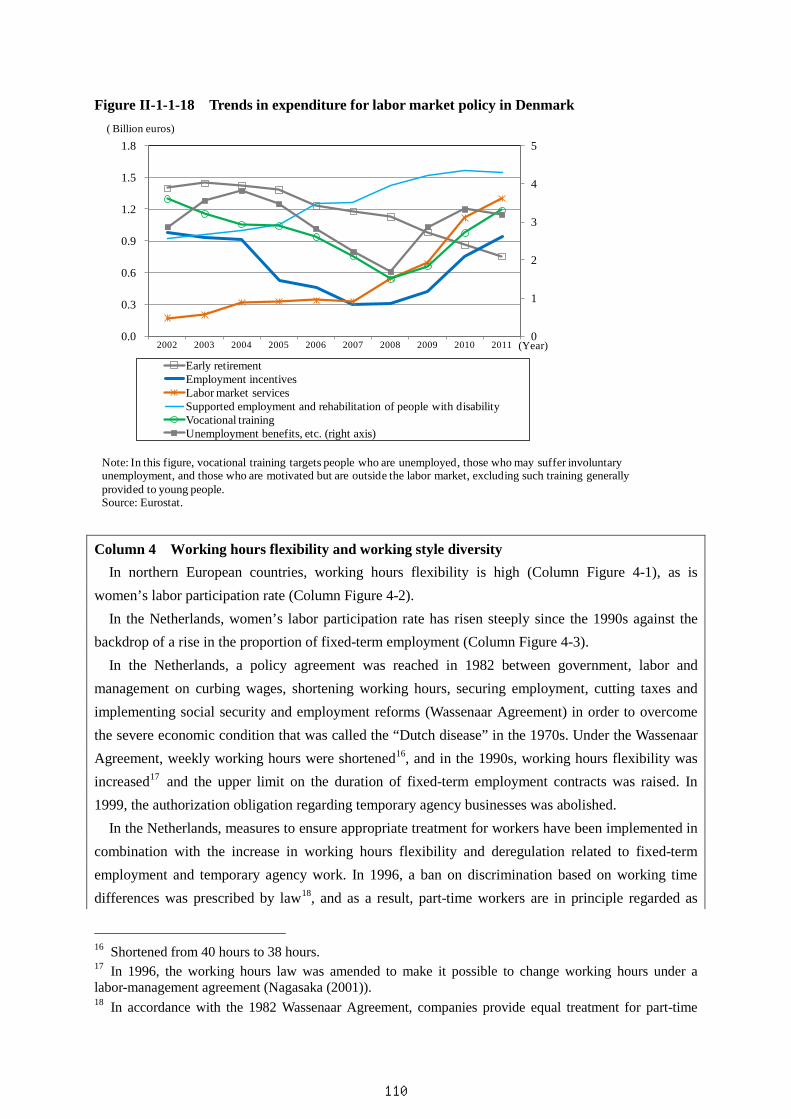
Figure II-1-1-18 Trends in expenditure for labor market policy in Denmark
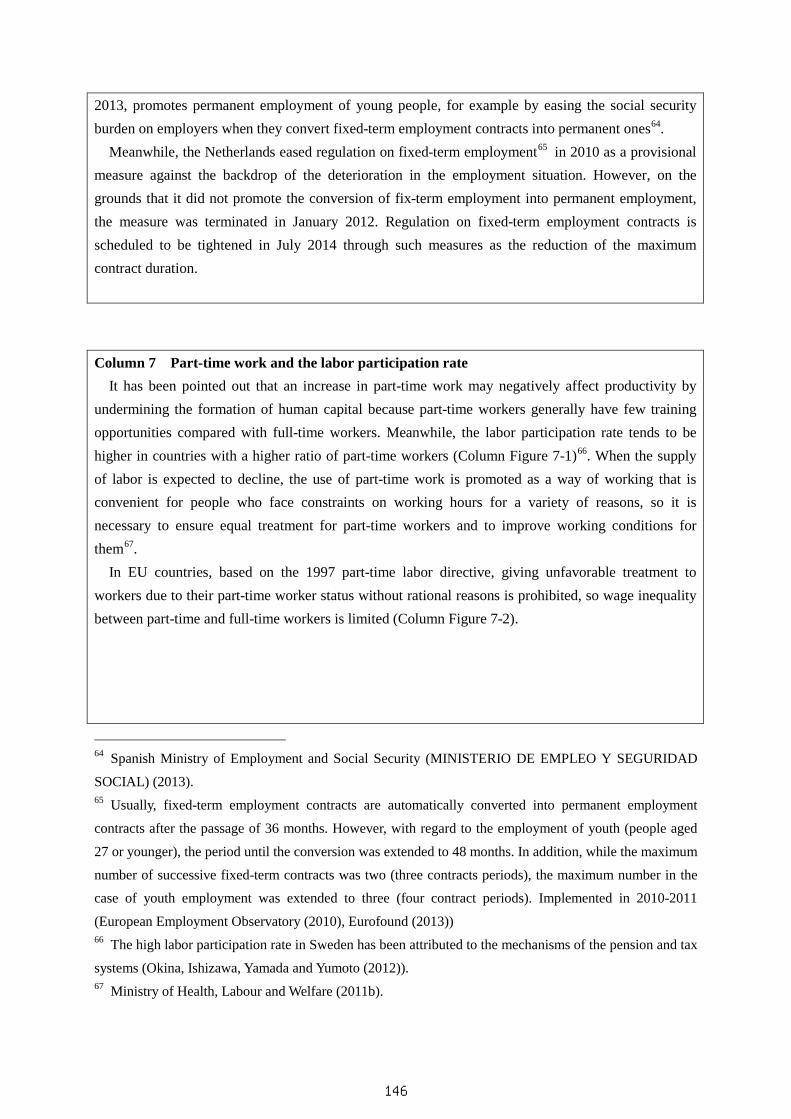
Column 4 Working hours flexibility and working style diversity In northern European countries, working hours flexibility is high (Column Figure 4-1), as is
women’s labor participation rate (Column Figure 4-2). In the Netherlands, women’s labor participation rate has risen steeply since the 1990s against the
backdrop of a rise in the proportion of fixed-term employment (Column Figure 4-3). In the Netherlands, a policy agreement was reached in 1982 between government, labor and
management on curbing wages, shortening working hours, securing employment, cutting taxes and implementing social security and employment reforms (Wassenaar Agreement) in order to overcome the severe economic condition that was called the “Dutch disease” in the 1970s. Under the Wassenaar Agreement, weekly working hours were shortened16, and in the 1990s, working hours flexibility was increased17 and the upper limit on the duration of fixed-term employment contracts was raised. In 1999, the authorization obligation regarding temporary agency businesses was abolished.
In the Netherlands, measures to ensure appropriate treatment for workers have been implemented in combination with the increase in working hours flexibility and deregulation related to fixed-term employment and temporary agency work. In 1996, a ban on discrimination based on working time differences was prescribed by law18, and as a result, part-time workers are in principle regarded as
16 Shortened from 40 hours to 38 hours. 17 In 1996, the working hours law was amended to make it possible to change working hours under a labor-management agreement (Nagasaka (2001)). 18 In accordance with the 1982 Wassenaar Agreement, companies provide equal treatment for part-time
0
1
2
3
4
5
0.0
0.3
0.6
0.9
1.2
1.5
1.8
2002 2003 2004 2005 2006 2007 2008 2009 2010 2011
Early retirementEmployment incentivesLabor market servicesSupported employment and rehabilitation of people with disabilityVocational trainingUnemployment benefits, etc. (right axis)
(Year)
( Billion euros)
Note: In this figure, vocational training targets people who are unemployed, those who may suffer involuntary unemployment, and those who are motivated but are outside the labor market, excluding such training generally provided to young people.Source: Eurostat.
110
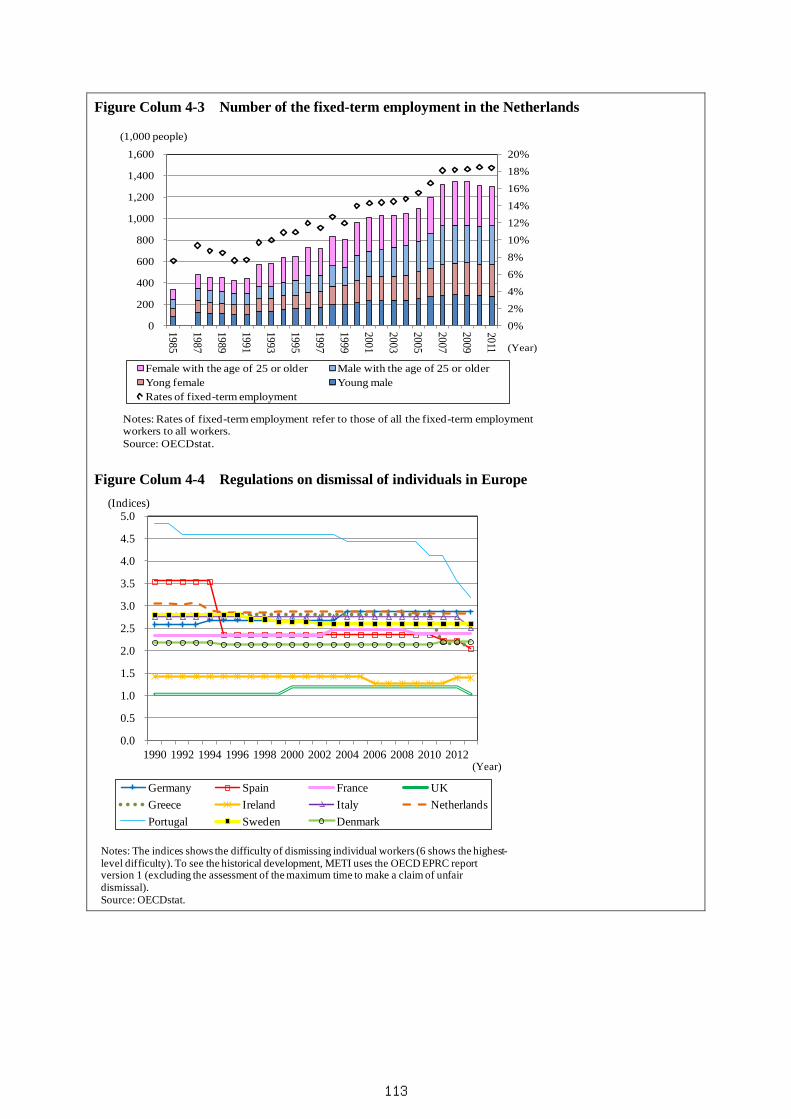
regular workers. It was also prescribed that fixed-term employment should be converted into permanent employment after the passage of a maximum fixed-term period. Regarding temporary agency workers, who account for a large proportion of fixed-term workers, their legal position was strengthened19 20.and, relatively strict regulation of dismissal has been maintained compared with other major European countries (Column Figure 4-4).
While increased working hours flexibility made it possible for companies to make adjustments flexibly in accordance with economic cycles, measures that reflect concern for the treatment of workers were also implemented. While the proportions of part-time workers, temporary agency workers and fixed-term workers are large, the poverty rate before income transfer is the lowest among major European countries, presumably because of the effects of those measures (Figure II-1-1-12 (presented earlier), Column Figures 4-5 and 4-6).
and full-time workers. As of 1996, 80% of collective labor agreements already adopted time-proportional
allocation of wages, etc. (Nagasaka (2001)). 19 Under the law concerning employment flexibility and security of 1999, contracts between temporary
agency workers and temporary agencies are regarded as employment contracts in order to clarify the
responsibilities of temporary agencies as employers. If temporary agency workers’ working period exceeds
26 weeks, they become eligible to receive equal treatment with directly-employed workers engaging in a
similar job at the company where they work under this law. But under collective labor agreements which
cover a number of workers, the requirements of this law are eased (the duration of working time required
for equal treatment is extended to 78 weeks; with regard to the requirement for “conversion into permanent
employment after the passage of three years” that was introduced with respect to fixed-term employment
contracts, the duration is extended to 78 weeks plus two years) (Japan Institute for Labour Policy and
Training (2011)). 20 In February 2014, a bill for the Work and Security Act, which provides for improvement of the treatment
of fixed-term workers, reduction of the duration of unemployment benefits, etc., was approved in the Dutch
Lower House, and it will take effect after approval in the Upper House. (An article in January 2014 in
Germany Spain France UKGreece Ireland Italy NetherlandsPortugal Sweden Denmark
(Indices)
Notes: The indices shows the difficulty of dismissing individual workers (6 shows the highest-level difficulty). To see the historical development, METI uses the OECD EPRC report version 1 (excluding the assessment of the maximum time to make a claim of unfair dismissal).Source: OECDstat.
(Year)
113
Figure Colum 4-5 Poverty rates by type of employment
Figure Colum 4-6 Penetration rate of temporary agency workers by country
0
10
20
30
40
50
60
70
80
90
100
0
2
4
6
8
10
12
14
Fixed-termPart-tim
ePerm
anentFull-tim
eTotalFixed-termPart-tim
ePerm
anentFull-tim
eTotalFixed-termPart-tim
ePerm
anentFull-tim
eTotalFixed-termPart-tim
ePerm
anentFull-tim
eTotalFixed-termPart-tim
ePerm
anentFull-tim
eTotalFixed-termPart-tim
ePerm
anentFull-tim
eTotalFixed-termPart-tim
ePerm
anentFull-tim
eTotalFixed-termPart-tim
ePerm
anentFull-tim
eTotal
Spain Italy UK France Germany Sweden Denmark Netherlands
Poverty rates Employment rates (right axis)
(%)
Notes: Poverty rates for a worker’s income is defined to be less than 60% of the median values in each country; figures show rates of poor workers to all the workers for any type of employment (after income transfer); "total" shows the poverty rates for total wiorkers; poverty rates shows the data for the fourth quarter of 2012; the figures for employment rates shows the data for 2012.Source: Eurostat.
0.0
0.5
1.0
1.5
2.0
2.5
3.0
3.5
4.0
UK Netherlands
Germany
France
the U.S.
Japan
Sweden
Italy
Spain
Denmark
(%)
Notes: The figure shows the ratios of temporary agency workers in full time equivalents to the total number of employed workers (calculated by dividing total working hours of temporary agency workers by annual average working hours of full-term workers) in 2012. Source: CIETT (International Confederation of Private Employment Agencies).
114
Column 5 Sweden’s work-first principle and wage system based on job evaluation model As the basic concept behind Sweden’s labor policy, there is a work-first principle that people should
engage in work to the extent possible and support the social welfare state through tax payments21. Based on this work-first principle, Sweden’s pension and unemployment benefits systems are designed to increase incentives for working to earn high incomes 22. In addition, Sweden has maintained a high labor participation rate23 by implementing active labor market policy measures to help unemployed people return to work.
Major labor market policy measures include labor market programs, such as counseling for unemployed people, vocational training, workplace training, support for business startup, and employment subsidies that reduce employers’ burdens of social security payments when they employ long-term unemployed people. While employment subsidies account for the largest proportion of the labor market policy expenditure, that related to labor market services and supported employment and rehabilitation have also been growing in recent years (Column Figure 5-1).
On the other hand, Sweden implemented such reforms as raising insurance premiums, reducing benefits and tightening the criteria for benefit provision based on the recognition that the traditional generous unemployment insurance system is undermining work motivation.
A comparison of the cost of unemployment benefits per unemployed worker with other countries shows that the cost is lower in Sweden than in France and Italy (Column Figure 5-2).
In addition, based on the idea that in order to improve national export competitiveness, it is rational to shift the labor force from low productivity sectors to high productivity sectors, Sweden has adopted the concept of “equal pay for equal work” as a principle of the wage system, and judgment as to whether wage differences between workers can be justified is made based on the job evaluation model24. This aims to improve the competitiveness of the country as a whole by ensuring that profits in low productivity sectors are reduced while additional profits are generated in high productivity sectors as a result of the narrowing of wage differences between similar jobs between industries and between companies, thereby encouraging an advancement of the industrial structure25. Regarding dismissal of workers, insufficient job performance is allowed to constitute a legitimate reason for dismissal and the level of severance pay is low. In addition, regulation on collective dismissal is looser in Sweden than in the United Kingdom and the United States, according to a relevant OECD indicator.
As for the correlation between productivity (per-capita value added) and the personnel cost by industry, the correlation is much stronger in Sweden than in other countries. In addition, both the median value of the productivity level and the productivity of the manufacturing industry as a whole
21 Morozumi (2012). 22 Okina, Nishizawa, Yamada and Yumoto (2012). 23 In 2012, the labor participation rate in Sweden, at 80%, was the third highest among the OECD member countries, after the rates in Iceland (85%) and Switzerland (83%) (OECDstat). 24 It is possible to identify jobs with equal value based on points calculated under the job evaluation model
(which evaluates knowledge concerning work, skills, responsibilities associated with job duties, level of
effort and the working environment) (Japan Institute for Labour Policy and Training (2012)). 25 Okina, Nishizawa, Yamada and Yumoto (2012).
115
are high (Column Table 5-3 and Column Figure 5-4). Meanwhile, Sweden introduced a higher vocational education system that meets the labor market’s
needs in the 2000s, as priority is placed on providing workers with continuous opportunities for vocational training so that they can acquire skills adapted to changes in the industrial structure. This aims to provide people who did not necessarily have adequate opportunities to receive higher education, such as blue-collar workers and people with low-level educations, with opportunities to climb the career ladder, thereby radically correcting the cause of inequality in the labor market. This vocational education system basically provides a two-year full-time education comprised of practical and theoretical education. In program formulation and implementation, emphasis is placed on the involvement of employers who provide practical education. This has been conceived as a system that provides capable personnel that immediately make contributions to companies26.
Figure Colum 5-1 Trends in expenditures for labor market policy in Sweden
26 Morozumi (2012).
0
1
2
3
4
5
0.0
0.4
0.8
1.2
1.6
2.0
2002 2003 2004 2005 2006 2007 2008 2009 2010 2011Employment incentivesLabor market servicesStart-up incentivesSupported employment and rehabilitation of people with disabilityVocational trainingUnemployment benefits, etc. (right axis)
(Year)
(Billion euros)
Note: In this figure, vocational training targets people who are unemployed, those who may suffer involuntary unemployment, and those who are motivated but are outside the labor market, excluding such training generally provided to young people.Source: Eurostat.
116
Figure Colum 5-2 Breakdown of the expenditures for labor market policy by unemployed person by country
Table Colum 5-3 Productivity in European counties concerning added values by person
0
5
10
15
20
25
0
10
20
30
40
50
60
70
2002
2005
2008
2011
2002
2005
2008
2011
2002
2005
2008
2010
2002
2005
2008
2011
2002
2005
2008
2011
2002
2005
2008
2011
2002
2004
2008
2011
2002
2005
2008
2011
2002
2005
2008
2011
2002
2005
2008
2011
2002
2005
2008
2011
2002
2005
2008
2010
2002
2005
2008
2011
Netherlands Denmark Ireland France Germany Italy Sweden Spain Japan the U.S. Portugal Greece UK
Unemployment benefits Early retirement
Job creation Supported employment and rehabilitation of people with disability
Note 1: The figures are the results of calculation in which cost in each national currency are converted to euro and divided by the annual average number of unemployed people.Note 2: Long-term unemployment rates refer to share of the number of people who are unemployed for one year or longer to the labor force.Note 3: Regarding Sweden, figures in 2004 is shown instead of 2005, since the OECD does not disclose the number of unemployed people in 2005. In principle, the latest data show figures in 2011, while the figures above for Ireland and Greece are based on the latest data for labor policy cost, and those in UK are based on the data for unemployment rates in 2011 alone since the latest data for labor policy cost are those for 2009.Note 4: In this figure, vocational training targets people who are unemployed, those who may suffer involuntary unemployment, and those who are motivated but are outside the labor market, excluding such training generally provided to young people.Source: OECDstat, ECB.
Productivity of the industry closer tothe median values of national value
added, when industries are arranged inthe order of high productivity (1,000
euros)
Productivity in themanufacturing industry
(1,000 euros)
Spain 0.43 54.7 56.9
France 0.46 59.9 65.7
Italy 0.30 60.6 61.9
Denmark 0.33 63.5 76.0
UK 0.40 70.8 70.5
Germany 0.26 72.2 70.4
Sweden 0.60 76.4 90.7
Netherlands 0.30 77.8 92.2
Notes: The figures show the inclination of correlation coefficient between productivity and personnel costs per employee (see FigureColum 5-4). The target types of industries include: manufacturing (no data for manufacture of pharmaceutical products in UK),construction, services (whole sale & retail trade, accommodations & food/beverage, professionals, scientific & technical services,administrative support, and transporting & warehousing), and information & communication. No data is available for the financial &insurance, education, medical, healthcare & welfare, arts& amusement, and house maker services. The figure exclude those for realestate, electricity & gas supplying, water supplying & waste treatment, manufacture of coke/petroleum products, and mining, since thefigures for these industries are significantly larger in some countries (based on the data for 2011).Source: Eurostat
117
Figure Colum 5-4 Industry-based distribution of personnel costs and productivity by person
Notes: The size of bubbles is based on the Gross value added per sector. Right green shows services (whole sale & retail trade, accommodations & food/beverage, professionals, scientific & technical services, administrative support, and transporting & warehousing), blue shows manufacturing (no data for manufacture of pharmaceutical products in UK), red shows information & communication, yellow shows construction. No data is available for the financial & insurance, education, medical, healthcare & welfare, arts& amusement, and house maker services. The figure exclude those for real estate, electricity & gas supplying, water supplying & waste treatment, manufacture of coke/petroleum products, and mining, since the figures for these industries are significantly larger in some countries (based on the data for 2011). Source: Eurostat
5. Germany’s labor policy (1) Labor market reform since 1998
In Germany, generous unemployment benefits and a rigid labor system were prevalent until the 1990s. However, between 2002 and 2005, labor market reforms were implemented under the idea of “welfare to work” against the backdrop of a high unemployment rate due to economic stagnation.
The reforms covered a comprehensive set of measures, including active labor market policy measures, such as promoting employment of unemployed workers by reducing unemployment benefits and tightening the criteria for receiving unemployment benefits and supporting unemployed people in finding jobs, increasing collective labor agreement flexibility, and improving the treatment of non-regular workers.
During the global economic crisis and the European debt crisis that occurred after the series of labor market reforms, Germany, unlike other countries, succeeded in maintaining jobs despite a GDP
y = 0.6029x + 7.5079
0
20
40
60
80
100
120
0 100 200 300
Person
nel costs p
er emp
lyee
Gross value added per employee
Sweden(1,000 euros)
y = 0.2958x + 23.137
0
20
40
60
80
100
120
0 100 200 300
Person
nel costs p
er emp
lyee
Gross value added per employee
Netherlands(1,000 euros)
y = 0.2588x + 25.417
0
20
40
60
80
100
120
0 100 200 300
Person
nel costs p
er emp
lyee
Gross value added per employee
Germany(1,000 euros)
y = 0.3998x + 8.0151
0
20
40
60
80
100
120
0 100 200 300
Personnel costs per em
plyee
Gross value added per employee
UK(1,000 euros)
y = 0.3296x + 22.228
0
20
40
60
80
100
120
0 100 200 300
Personnel costs per em
plyee
Gross value added per employee
Denmark(1,000 euros)
p p y
Gross value added per employee
Gross value added per employee
118
contraction, and this achievement was called the “German miracle.” Below, we look at labor market reforms implemented in the first half of the 2000s and the labor policy in recent years.
(2) Tightening of the provision of unemployment benefits and creation of unemployment benefits II for long-term unemployed people
Germany’s unemployment benefits were traditionally generous, and until the end of 2004, unemployed workers were entitled to receive full unemployment benefits for up to 32 months and, after the passage of 32 months, they were eligible to receive unemployment assistance equivalent to 53% of their previous income for an unlimited period of time27. Based on the recognition that such generous unemployment benefits were undermining unemployed people’s work motivation, the maximum duration of unemployment benefits was reduced to 12 months in 2005, and unemployment benefits II, which are not linked to the previous income, were introduced for workers who have been unemployed for more than 12 months.
The unemployment benefits II system is separate from the existing unemployment benefits system (unemployment benefits I), which is applicable to ordinary unemployed people, and is applicable to people receiving social assistance who are able to work as well as people eligible for previous unemployment assistance. In addition to providing benefits, this system requires unemployed people to seek jobs.
By reducing the duration of ordinary unemployment benefits and requiring long-term unemployed people to seek jobs, the unemployment benefits II system was aimed at lowering the unemployment rate and cutting social security expenditures28.
(3) Enhancement of support for unemployed people to find jobs, and creation of jobs
The tightening of the provision of unemployment benefits described above was intended to increase unemployment people’s work incentive. Under Laws for Reform of the Job Market (Hartz I to IV), enacted in 2002 and 2003, support for unemployed people to find jobs was significantly enhanced.
Major measures included integrating unemployment assistance provided by federal agencies and social assistance provided by local governments in order to improve the efficiency of the provision of benefits for long-term unemployed people and support for such people to find jobs29. The approach of requiring unemployed people to seek jobs was clarified, and in order to receive unemployment benefits II, unemployed people need to be registered with a local employment agency and make efforts to find a job. If they refuse a job introduced to them or if they neglect to make efforts to find a job, the provision of unemployment benefits II is suspended30. In addition, it is stipulated that personnel service agencies (PSA), which dispatch unemployed people as workers, be established at local
27 Japan Institute for Labour Policy and Training (2006). 28 Japan Institute for Labour Policy and Training (2006). 29 Takeda (2012). 30 Japan Institute for Labour Policy and Training (2007).
119
employment agencies31 Moreover, in order to integrate people with low skills and long-term unemployed people into the
labor market, such measures were implemented, as providing subsidies to employers, creating a minijob system, which exempts employees with monthly income of 400 euros or less from tax and social security payments32, and the public sector subsidized employment system (1 euro job) (Figure II-1-1-22).
The efficiency of vocational training intended for unemployed people was improved33, and the participation rate declined between 2000 and 2005. However, compared with other labor market programs, the participation rate of unemployed people remains at the highest level and the allocation of expenditures is also at a high level (Figures II-1-1-20 and II-1-1-21).
31 Since June 2005, the establishment of PSA has been voluntary. 32 Under the minijob system, employers are responsible for making payments equivalent to a universal rate
of 30.88% of wages as disease insurance premiums, pension premiums and taxes. In 2013, the maximum
monthly income eligible for exemption was raised to 450 euros. The midijob system, which is applicable to
monthly income of 800 euros or less (850 euros or less since 2013) and which reduces tax and social
security payments by employees, was also introduced. Since January 2013, people engaging in minijobs
have also been required to join legally prescribed pension plans (an article published in January 2013 on the
website of the Japan Institute for Labour Policy and Training
(http://www.jil.go.jp/foreign/jihou/2013_1/german_02.htm); and an article published on April 2, 2014 on
the website of the German Ministry of Labour and Social Affairs
(http://www.bmas.de/EN/Our-Topics/Social-Security/450-euro-mini-jobs-marginal-employment.html)). 33 Under a program that issues vocational training coupons at employment agencies’ discretion, trainees
have primarily become people with high employability.
120
Table II-1-1-19 Longest duration of unemployment benefits in major countries
Figure II-1-1-20 Trends in expenditure for labor market policy in Germany
Longest duration ofunemployment benefits Notes
UK 6 months (182 days)
Italy 8 months 12 months for unemployed people with the ages of 50 or older.
Sweden 10 months (300 days) 450 days for unemployed people who have a child or children younger than18 years old.
Germany 6 to 12 monthsDepending on the insured period of unemployed people; allowed to extend 15to 24 months for such people with the age of 50 or older depending on theinsured period and their age.
Denmark 24 months
France4 to 24 months
(730 days)The duration is the same period as the insured period; up to 36 months forunemployed people with the age of 50 or older.
Spain 4 to 24 months Depending on the insured period of unemployed people.
Netherlands 3 to 38 months Depending on the employment history.
the U.S. 19 to 28 weeksDepending on the state governments. From 2008 to 2013, Federalgovernment allowed extra period for Emergency unemployment compensationup to 47 weeks, depending on state govenments.
Japan 3 to 5 months5 to 12 months for people who have difficulty in finding jobs, e.g., people withdisabiliy.
Source: Report on Labor and Social Security Conditions Overseas (France and Spain (2010-2011); UK (2009-2010));Eurofound website (Jul. 2013) (Italy); the Arbeitsförmedlingen, an employment service agency, of Sweden (Sep. 2013); Workin Denmark website (Ministry of Foreign Affairs of Denmark) (2012); HelloWork website of Japan (Apr. 2014); BEI EIDOKU FUTSU NO JINZAI Business 2014 (Human resource business in the U.S., U.K., Germany, and France in 2014)(Recruit Works Institute); the Ministry of Social Affairs and Employment of the Netherlands (Jan. 2014); and Social Securityat a Glance (Jan. 2013) (Federal Ministry of Labour and Social Affairs of Germany).
0
10
20
30
40
50
60
0
2
4
6
8
10
12
14
2002 2005 2008 2011
Job creationEmployment incentivesLabor market servicesStart-up incentives Supported employment and rehabilitation of people with disabilityVocational trainingUnemployment benefits, etc. (right axis)
Note: In this figure, vocational training targets people who are unemployed, those who may suffer involuntary unemployment, and those who are motivated but are outside the labor market, excluding such training generally provided to young people.Source: Eurostat.
(Year)
(Billion euros)
121
Figure II-1-1-21 Ratio of job seekers’ participation in programs for active labor market policy in Germany
Figure II-1-1-22 Ratio of long-term unemployed people who participate in programs for active labor market policy to all the participants in Germany
(4) Deregulation of employment contracts and improvement of treatment
Regarding fixed-term employment contracts, it became possible in 2000 to conclude fixed-term
0
2
4
6
8
10
12
14
16
Supported employm
ent and rehabilitation of people w
ith disability
Start-up incentives
Job creation
Employm
ent incentives
Labor market services
Vocational training
Notes: This figure shows the ratio of job seekers’ participation in the programs in 2011.Source: Eurostat.
Job creation Employment incentivesLabor market servicesStart-up incentives Supported employment and rehabilitation of people with disabilityVocational training
Notes: This figure shows the ratios of people who are unemployed for one year or longer to all the participants in the programs.Source: Eurostat.
(Year)
(%)
122
contracts without an objective reason. At the same time, the maximum duration of a fixed term contract was set at two years, and it was prescribed that with the passage of two years, fixed-term employment be converted into permanent employment.
Regarding temporary agency contracts, the maximum duration of temporary agency work was removed in 2002. Although the principle of equal treatment regarding wages, holidays, etc. was introduced in 2002, exemption from the principle subject to a collective labor agreement was permissible. As a result, low wages were applied in many cases, with 68% of temporary agency workers in the low wage category34 as of 201035.
Regarding the regulation of dismissal, the scope of exemption from the dismissal restriction law was expanded through the law for Reform of the Job Market of 2003. Although it became possible for workplaces with a workforce of 10 or less employees to dismiss workers hired in 2004 or later without providing any particular reason36, the regulation is stricter compared with those in other countries (Column Figure 4-4 (presented earlier)).
(5) Wage curb
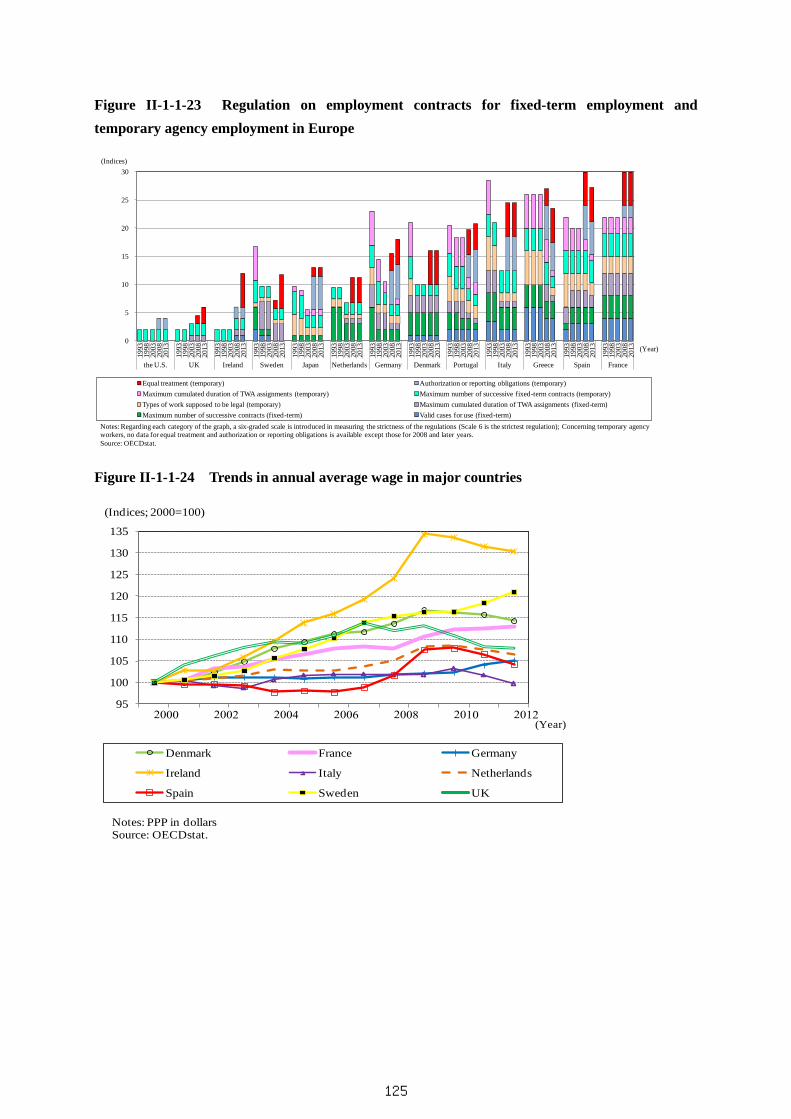
The rate of wage increase has stayed low in Germany compared with in other countries (Figure II-1-1-24).
Among matters pointed out as background factors for the wage curb are reduction of the labor cost due to an increase in atypical employment, including minijobs, a gradual decline in the binding power of collective labor agreements since the 1990s37, and the diffusion since the second half of the 1990s of a working time accounts system38, which made it possible to adjust working hours flexibly39.
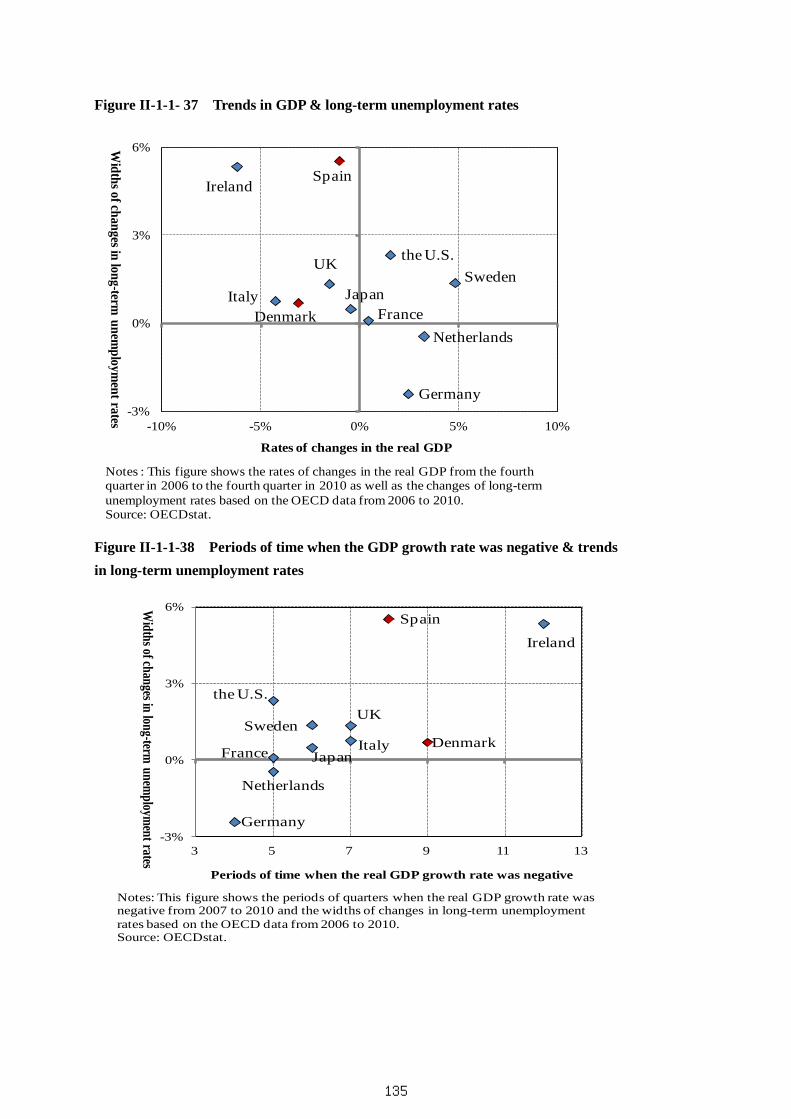
As for the wage trend, in Sweden and the United Kingdom, wages declined by a larger margin than the value added at the time of economic contraction and increased by a larger margin than the value added at the time of economic expansion. In Germany and Denmark, wages declined by a larger margin than the value added at the time of economic contraction although not as much as in Sweden and the United Kingdom. On the other hand, in southern European countries, the margin of decline in wages was small at the time of economic contraction (Figure II-1-1-25). Moreover, in Spain and Italy, there were few periods of time when the growth rate of hourly wages turned negative although there were many periods of time when the GDP growth rate was negative (Figure II-1-1-26).
34 Workers whose wage is lower than two-thirds of the median wage for full-time workers 35 Spermann (2013). 36 Japan Institute for Labour Policy and Training (2006). 37 The number of companies which opted out of sectoral agreements and concluded company-specific
labor agreements increased. In addition, in many cases, sectoral agreements have come to contain an “open
clause,” which allows individual decisions to be made on a company-by-company basis (Saito (2012)). 38 A mechanism which let workers record and accumulate actual working hours, just as people accumulate
savings in their bank accounts, and settle the difference between the accumulated hours and the prescribed
working hours through working-time adjustments, rather than through monetary payment. 39 Sugiura and Yoshida (2014).
123
As is notable in the case of Spain and Italy, the downward rigidity of wages may become a factor that further depresses corporate earnings at the time of economic contraction and impedes economic recovery. However, the wage adjustment mechanism that lies behind the rigidity varies from country to country as is explained below.
As for a mechanism that makes it possible to change wages in accordance with business performance, in many cases in Germany and Sweden, a collective labor agreement specifies the criteria for an opt-out from contractual terms, which allows companies with sluggish business performance to reduce wages40 by opting out from the contract.
In the United Kingdom and Ireland, unlike in southern Europe, the small proportion of workers to which collective wage agreements are applied presumably makes it easy to make wage adjustments flexibly.
In addition, while union representatives’ right to involve themselves in governments’ decision making is weak in southern Europe, it is strong in Sweden, Denmark and Germany (Figure II-1-1-27).
In Germany, as bodies that represent workers’ interests, there are workers’ councils, which are established at workplaces with a workforce of five or more employees, in addition to labor unions. Workers’ councils exist at many large-scale workplaces to represent all workers there. Workers’ councils receive information from and hold consultations with employers. They have the right to determine, together with employers, mainly work-related matters and contribute to close communications between employers and workers and resolution of disputes41, so it is possible that their presence has led to wage adjustments that do not depress corporate earnings.
40 In Sweden, a case (2012) in which a company reduced wages by opting out from a collective labor
agreement at the time of business rehabilitation was reported (Eurofound (2012)). In Germany as well, a
case in which wages were reduced through an opt-out from a collective labor agreement was reported
(Japan Institute for Labour Policy and Training (2013)). 41 Bernd Waas (2013).
124
Figure II-1-1-23 Regulation on employment contracts for fixed-term employment and temporary agency employment in Europe
Figure II-1-1-24 Trends in annual average wage in major countries
0
5
10
15
20
25
30
1993
1998
2003
2008
2013
1993
1998
2003
2008
2013
1993
1998
2003
2008
2013
1993
1998
2003
2008
2013
1993
1998
2003
2008
2013
1993
1998
2003
2008
2013
1993
1998
2003
2008
2013
1993
1998
2003
2008
2013
1993
1998
2003
2008
2013
1993
1998
2003
2008
2013
1993
1998
2003
2008
2013
1993
1998
2003
2008
2013
1993
1998
2003
2008
2013
the U.S. UK Ireland Sweden Japan Netherlands Germany Denmark Portugal Italy Greece Spain France
Equal treatment (temporary) Authorization or reporting obligations (temporary)Maximum cumulated duration of TWA assignments (temporary) Maximum number of successive fixed-term contracts (temporary)Types of work supposed to be legal (temporary) Maximum cumulated duration of TWA assignments (fixed-term)Maximum number of successive contracts (fixed-term) Valid cases for use (fixed-term)
(Indices)
Notes: Regarding each category of the graph, a six-graded scale is introduced in measuring the strictness of the regulations (Scale 6 is the strictest regulation); Concerning temporary agency workers, no data for equal treatment and authorization or reporting obligations is available except those for 2008 and later years.Source: OECDstat.
(Year)
95
100
105
110
115
120
125
130
135
Denmark France Germany
Ireland Italy Netherlands
Spain Sweden UK
(Indices; 2000=100)
Notes: PPP in dollarsSource: OECDstat.
(Year)
125
Figure II-1-1-25 Trends in difference between growth rates of hourly wages and GDP
Notes: This figure shows the past three-quarter moving averages, which are calculated by deducting the GDP growth rates (nominal; %) from the growth rates (%) of wage indices (growth rates are those compared with the previous quarter); Figures are seasonally adjusted, excluding the wage indices for Ireland.Source: Eurostat.
Notes: These figures show the past three-quarter moving averages, which are calculated by deducting the GDP growth rates (nominal; %) from the growth rates (%) of wage indices (growth ratesare those compared with the previous quarter); The wage indices are seasonally adjusted; Regarding Greece, figures are shown for the first quarter in 2011 and earlier.Source: Eurostat.
France, Italy, Spain, etc.(%)
126
Figure II-1-1-26 Periods of time when the growth rate of hourly wages and GDP was negative
Figure II-1-1-27 Workers’ involvement in labor-management negotiations
Notes: The size of a bubble shows the strength of rights by which representatives of workers are able to participate in decision-making processes, evaluated by a three-graded scale; Rates of workers who join labor unions are based on the OECD figures in 2010; The rest of the rates is the OECD figures in 2009. Source: worker-participation.eu, OECDstat. (6) Effects on the labor market
Under the labor market reform carried out in and after 2002, the long-term unemployment rate has declined significantly since 2007 due to the implementation of such measures as the creation of
Denmark
France
Germany
Ireland
ItalyNetherlands
Portugal
Spain
Sweden
3
6
9
12
15
18
3 6 9 12 15 18
Wage per hour
Nominal GDPNotes: In this figure, each dot represents the number of quarters in which the growth rate from the previous quarter was negative from the first quarter in 2008 to the third quarter in 2013.Source: Eurostat.
(Number of quarters)
UK
Ireland UK
Germany
Denmark
Sweden
Italy
Spain
Netherlands France
Rates of workers who join labor unions in 2010
Rates
of w
orkers covered
by collective
bargaining agreements
127
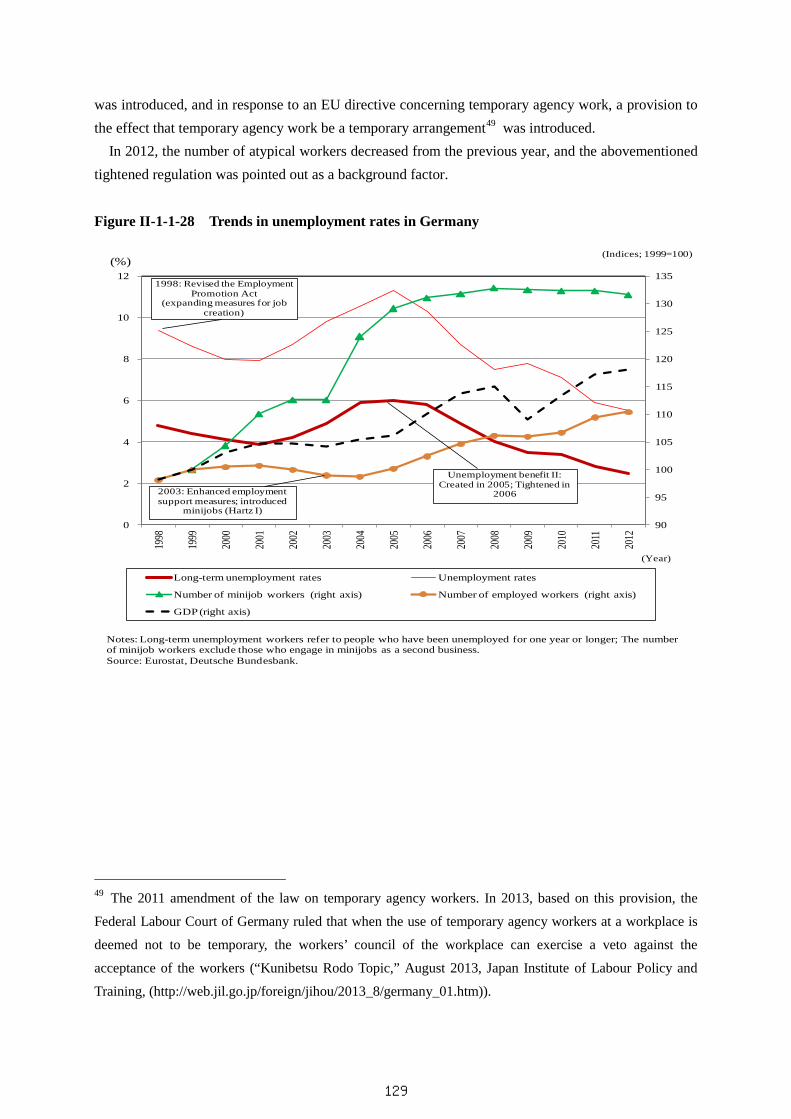
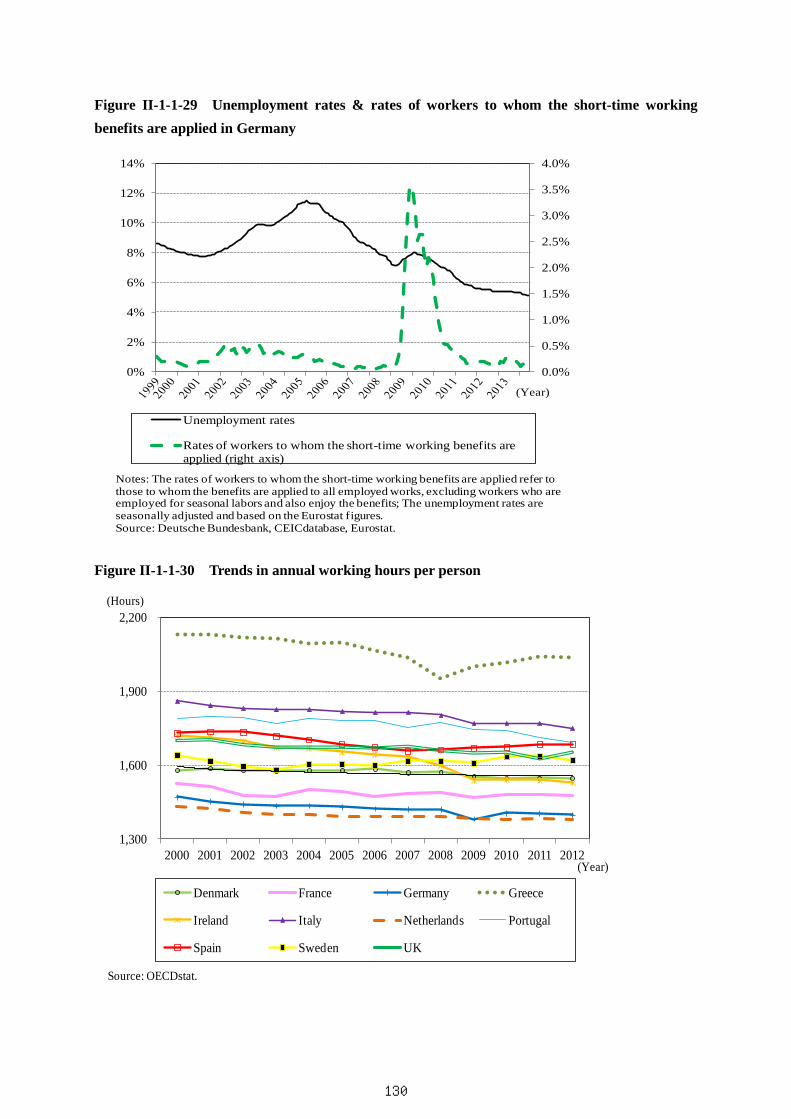
unemployment benefits II, enhancement of support for unemployed people to find jobs, reduction of the ratio of social security premiums paid by companies42 and expansion of employment promotion for middle-age and elderly people 43 . At the time of the European debt crisis, the long-term unemployment rate did not rise but fell close to the level in northern Europe and the Netherlands (Figures II-1-1-28 and II-1-1-8 (presented earlier). Moreover, at the time of the European debt crisis, the short-time working benefits system44 and the
working time accounts system have helped to maintain employment by allowing companies to cut working hours instead of dismissing workers (Figures II-1-1-29 and II-1-1-30).
Meanwhile, following a succession of deregulation measures, the number of atypical workers45 increased (Figure II-1-1-31). Between 2000 and 2012, the number of regular workers increased only 2% but the number of atypical workers grew 31%. In particular, in 2005, when the unemployment benefits II system was introduced, the number of part-time workers, fixed-term workers and marginal employment workers increased steeply.
However, whether or not the increase in minijobs led to the creation of actual jobs is a point of contention46. Moreover, it has been pointed out that the standards of living for minijob workers47 is low, as indicated by the fact that slightly more than 10% of such workers receive unemployment benefits II while working (Figure II-1-1-32), and the proportion of minijob workers who shift to other modes of employment is small.
Regarding temporary agency work, in January 2012, a minimum wage was introduced and regulation was tightened. For example, a provision for preventing abuse of temporary agency work48
42 The ratio was reduced from 20.725% in 2005 to 20% in 2007 and to 19.275% in 2013 (the ratio to total
income of an average-income single-person household without children) (OECDstat). The growth (from
2000 to 2008) in companies’ payments of social insurance premiums and labor-related taxes per working
hour was the lowest among major European countries (Eurostat). 43 Wage subsidies for employers intended to promote employment of middle-age and elderly unemployed
people. 44 A system that provides funds to employers in order to make up for a decrease in wages when they
reduce operating hours instead of dismissing employees on economic grounds or due to force majeure
incidents. 45 Atypical workers as defined by the German Federal Statistical Office include fixed-term workers,
marginal employment workers and non-regular part-time workers. 46 It has been pointed out that the increase merely reflects conversion of illegal jobs that were previously unregistered into legal minijobs and conversion of regular jobs involving social security obligations into low-cost minijobs (Japan Institute for Labour Policy and Training (2007). 47 Excluding people engaging in marginal employment jobs. 48 There were cases of so-called “revolving door,” which refers to dismissing regular workers and then
employing them as low-wage temporary agency workers. However, a new provision stipulates that an
arrangement for an opt-out from the principle of equal treatment should not be applied to the same
workplace (or a workplace within the same corporate group) for six months after the termination of the
was introduced, and in response to an EU directive concerning temporary agency work, a provision to the effect that temporary agency work be a temporary arrangement49 was introduced.
In 2012, the number of atypical workers decreased from the previous year, and the abovementioned tightened regulation was pointed out as a background factor.
Figure II-1-1-28 Trends in unemployment rates in Germany
49 The 2011 amendment of the law on temporary agency workers. In 2013, based on this provision, the
Federal Labour Court of Germany ruled that when the use of temporary agency workers at a workplace is
deemed not to be temporary, the workers’ council of the workplace can exercise a veto against the
acceptance of the workers (“Kunibetsu Rodo Topic,” August 2013, Japan Institute of Labour Policy and
Number of minijob workers (right axis) Number of employed workers (right axis)
GDP (right axis)
(%)
Notes: Long-term unemployment workers refer to people who have been unemployed for one year or longer; The number of minijob workers exclude those who engage in minijobs as a second business.Source: Eurostat, Deutsche Bundesbank.
(Year)
(Indices; 1999=100)
1998: Revised the Employment Promotion Act
(expanding measures for job creation)
2003: Enhanced employment support measures; introduced
minijobs (Hartz I)
Unemployment benefit II: Created in 2005; Tightened in
2006
129
Figure II-1-1-29 Unemployment rates & rates of workers to whom the short-time working benefits are applied in Germany
Figure II-1-1-30 Trends in annual working hours per person
0.0%
0.5%
1.0%
1.5%
2.0%
2.5%
3.0%
3.5%
4.0%
0%
2%
4%
6%
8%
10%
12%
14%
Unemployment rates
Rates of workers to whom the short-time working benefits are applied (right axis)
Notes: The rates of workers to whom the short-time working benefits are applied refer to those to whom the benefits are applied to all employed works, excluding workers who are employed for seasonal labors and also enjoy the benefits; The unemployment rates are seasonally adjusted and based on the Eurostat figures.Source: Deutsche Bundesbank, CEICdatabase, Eurostat.
Figure II-1-1-31 Trends in the number of atypical workers in Germany
Figure II-1-1-32 Breakdown of the recipients of unemployment benefits II in Germany
0
50
100
150
200
250
80
90
100
110
120
130
140
150
160
1998 2000 2002 2004 2006 2008 2010 2012
Total number of female regular workers Total number of female atypical workers
Marginal employment female workers Total number of male regular workers
Total number of male atypical workers Part-time workers
Fixed-term employment workers Male marginal employment (right axis)
(Indices; 2000=100)
Notes: The values in this figure exclude those who engage in defense services and volunteering activities; Fixed-term employment workers are sometimes also counted as part-time workers, and vice versa.Source: Statistisches Bundesamt
Recipients of the benefits II under the minijob systemRecipients of the benefits II under the midijob systemRecipients of the benefits II who receive 800 euros or more as a monthly incomeUnemployed recipients of the benefits IIRates of the recipients of the benefits II who engage in minijobs (right axis)
(1 million people)
Notes: Regarding the ratios of the recipients of benefits II who engage in minijobs above, the recipients of benefits II who engage in minijobs exclude those who do so as a second job; The category for people who receive 800 euros or more as monthly income was revised in 2013 to people who receive 850 euros or more, since the upper limit of the monthly income under the midijobs system changed to 850 euros.Source: Federal Institute for Employment of Germany, Deutsche Bundesbank.
(Month, year)
131
(7) Recent developments related to the minimum wage system In order to improve the treatment of low-income workers, mainly marginal employment workers, in
April 2014, the German government adopted a bill for a minimum wage law that contains a provision for phasing in a nationwide minimum wage between 2015 and 2017.
While the introduction of a minimum wage system in Germany is expected to narrow wage inequality (Figure II-1-1-33), it may trigger a wage increase not commensurate with companies’ productivity growth if the minimum wage ratio is excessively high.
Meanwhile, the introduction of a minimum wage of 8.5 euros per hour will result in a wage increase for atypical workers as well as for some industries and some regions. A look at industry-by-industry collective labor agreements shows that 19% of contractual wages in 2013 are lower than 8.5 euros per hour in the services sector, and the ratio is much lower, 3%, in the industrial sector (Figure II-1-1-34). However, the ratio of German workers covered by collective labor agreements is only 50%, so it should be kept in mind that the proportion of low-wage workers may be higher at companies not covered by collective labor agreements.
Figure II-1-1-33 Minimum wage ratios and wage inequality
132
Figure II-1-1-34 Agreed wage by hourly wage level in Germany
Figure II-1-1-35 Rates of the low-wage workers in 2010
<7.5€7%
<8.5€12%
<10€13%<15€
50%
<20€14%
<25€4%
≧25€0% <7.5€
<8.5€
<10€
<15€
<20€
<25€
≧25€
Service sector
Notes: This figure shows the wage-based classes by the agreed hourly wage by sector, including the security services, wholesale & retailing, hairdressing, cleaning sector, hotel & restaurant services, public services, private waste management, private transport industry, commercial banks.Source: WSI Tarifarchiv.
<7.5€1%
<8.5€2%
<10€6%
<15€46%
<20€27%
<25€11%
≧25€7%
<7.5€
<8.5€
<10€
<15€
<20€
<25€
≧25€
Industrial sector
Notes: This figure shows the wage-based classes by the agreed hourly wage by sector, including chemical, printing, fine ceramic, wood processing, automotive, plastic processing, painting, metal & electrical, metal crafts, paper, and textile industries.Source: WSI Tarifarchiv.
0
5
10
15
20
25
30
0
10
20
30
40
50
60
70
Sweden
France
Denm
ark
Italy
Greece
Spain
Portugal
Netherlands
Ireland
UK Germ
any
Fixed-term employment Permanent employment
Total Rates of the fixed-term employment (right axis)
(%)
Notes: This figure shows the ratios of low-wage workers to the number of workers by mode of employment as well as those of fixed-term employment workers to all the workers; low-wage meanswhere the wages are two thirds or less of the median across each country; No data for fixed-term and permanent employment is available for Sweden; This figure shows data as of 2010; The ratios of fixed-term employment are those of fixed-term employment workers to all the workers (as of the third quarter in 2013).Source: Eurostat.
133
Figure II-1-1-36 Comparison of monthly wage by mode of employment and industry in Germany
Notes: This figure shows the data for the third quarter in 2013. Source: Statistics of the wage, labor costs (Statistisches Bundesamt).
6. Labor market reforms in Spain (1) Employment situation
In Spain, the employment environment deteriorated significantly against the backdrop of the European debt crisis. In 2013, the unemployment rate exceeded 26%, with the youth unemployment rate peaking above 56%.
Since the global economic crisis, the increase in the long-term unemployment rate relative to the degree of GDP contraction in Spain has been extremely large compared with many other countries that experienced GDP contraction (Figures II-1-1-37 and II-1-1-38).
By age group, the employment situation deteriorated remarkably for young people. Although the labor participation rate among the young has been declining since 2009, the unemployment rate has risen significantly compared with in other age groups (Figures II-1-1-39 and II-1-1-40). Meanwhile, among people aged between 25 and 64, despite an increase in the labor force due to a decrease in the female non-labor force (an increase in women who work in order to make up for reduced household income), the unemployment rate has not risen as much as among young people (Figures II-1-1-41 and II-1-1-42).
By employment contract type, the employment situation deteriorated remarkably for fixed-term workers. In 2012, the ratio of workers who moved into the category of unemployed workers was 30% among fixed-term workers but was only 5% among permanent workers (Figure II-1-1-43). While the number of permanent workers decreased moderately among people aged 25 or older, the number of fixed-term workers fell steeply across all age groups (however, from 2010 to 2011, the number of fixed-term workers increased only among people aged 25 or older) (Figure II-1-1-44).
0
500
1,000
1,500
2,000
2,500
3,000
3,500
4,000
4,500
5,000
Total
Industries
Mining
Manufacturing
Construction
Energy supply
Water supply
Services
Marginal Part-time Total Full-time
(Euro)
134
Figure II-1-1- 37 Trends in GDP & long-term unemployment rates
Figure II-1-1-38 Periods of time when the GDP growth rate was negative & trends in long-term unemployment rates
Ireland
ItalyDenmark
UK
Spain
JapanFrance
the U.S.
Germany
Netherlands
Sweden
-3%
0%
3%
6%
-10% -5% 0% 5% 10%
Widths of changes in long-term
unemploym
ent rates
Rates of changes in the real GDP
Notes : This figure shows the rates of changes in the real GDP from the fourth quarter in 2006 to the fourth quarter in 2010 as well as the changes of long-term unemployment rates based on the OECD data from 2006 to 2010.Source: OECDstat.
Ireland
Italy Denmark
UK
Spain
JapanFrance
the U.S.
Germany
Netherlands
Sweden
-3%
0%
3%
6%
3 5 7 9 11 13
Widths of changes in long-term
unemploym
ent rates
Periods of time when the real GDP growth rate was negative
Notes: This figure shows the periods of quarters when the real GDP growth rate was negative from 2007 to 2010 and the widths of changes in long-term unemployment rates based on the OECD data from 2006 to 2010.Source: OECDstat.
135
Figure II-1-1-39 Trends in unemployment rates by age in Spain
Figure II-1-1-40 Trends in labor participation rates by age in Spain
Unemployed people (male) Unemployed people (female)
Non-labor force (male) Non-labor force (female)
Source: OECDstat.
(Million people)
(Year)
137
Figure II-1-1-43 Ratio of workers who moved into the category of unemployed people by mode of employment in the previous year in Spain
Figure II-1-1-44 Changes of number of workers by mode of employment and by age in Spain
(2) Reduction of inequality between regular and non-regular workers and easing of regulation on dismissal
0
5
10
15
20
25
30
2006 2007 2008 2009 2010 2011 2012
Permanent employment Fixed-term employment
Non-labor force
Notes: This figure shows the ratio of unemployed people in each year to all employed workers by mode of employment in the previous year.Source: Eurostat.
Young people (fixed-term)People with the age of 25- 64 (fixed-term)Young people (permanent)People with the age of 25- 64 (permanent)
Source: OECDstat.
(Year-on-year)
(Year)
138
The first among the factors for the significant rise in the unemployment rate in Spain is the generous protection of regular workers.
Previously, dismissal of regular workers required a high cost regardless of the reason due to the high level of severance pay. Moreover, because the definition of justifications for dismissal was unclear, many dismissals were treated as unfair dismissals requiring higher severance pay50, and as a result, dismissal of regular workers posed a very high hurdle for companies.
On the other hand, the level of severance pay for fixed-term workers is lower than that for regular workers51 and the level of wages for fixed-term workers is also lower (Figure II-1-1-45). In order to avoid a cost increase due to the hiring of regular workers, companies hired new workers mainly with a fixed-term contract52. Consequently, in the first half of the 2000s, the ratio of fixed-term workers in Spain, particularly among youth, was more than 10 percentage points higher than the ratios in other countries (Figure II-1-1-46).
Amid the contraction of economic activities due to the European debt crisis, labor force adjustments were made mainly through the dismissal or contract termination of fixed-term workers, resulting in a steep increase in unemployment among fixed-term workers.
Based on the recognition that inequality in treatment between regular and non-regular workers contributed to the growth in unemployment by causing an increase in fixed-term contracts, the government of Spain reduced the merit for companies of concluding fixed-term employment contracts under the labor market reforms since 201153.
In addition, the government of Spain defined specific justifications for dismissal on economic grounds, such as “three consecutive quarters of decline in revenue.”54 In addition, the cost of dismissing regular workers was lowered by reducing the amount of severance pay in cases where dismissal of permanent workers is judged to be unfair55.
50 Ministry of Health, Labour and Welfare (2011a). 51 Ministry of Health, Labour and Welfare (2011a). 52 Murata (2011). 53 Severance pay for fixed-term employment contracts was gradually raised (starting in 2011). The
maximum contract duration was set at two years, and it was prescribed that when employment was
extended beyond the maximum duration, that should be regarded as the conclusion of a permanent
employment contract (2012). (Clauwaert, Schömann (2013)). 54 JETRO (2012a). 55Severance pay was reduced from 45 days of wages to 33 days of wages per year of service and the maximum severance pay amount was reduced from 42 months of wages to 24 months of wages (Clauwaert, Schömann (2013)).
139
Figure II-1-1-45 Average wage by mode of employment in Spain
Figure II-1-1-46 Rates of fixed-term employment
(3) Flexibilization of wage adjustment
Among the factors contributing to the rise in the unemployment rate in Spain is the wage rigidity (Figures II-1-1-25 (presented earlier) and II-1-1-26 (presented earlier)).
In Spain, sectoral agreements restricted wage adjustments, making it difficult for companies to reduce wages when business performance was poor. Based on the recognition that the rigidity of wage
0
5
10
15
20
25
30
2008 2009 2010 2011
Permanent employment
Fixed-term employment
(1,000 euros)
(Year)Notes: This figure shows the annual average wage per person. Source: National Statistics Institute (INE) of Spain.
140
adjustment was a background factor for the deterioration of the employment situation, the reform of collective labor agreements has been implemented since 2011.
It has become possible for companies to make wage and working time adjustments by opting out from region-specific and sectoral agreements when their revenue has declined for two consecutive quarters or longer56. While workers covered by collective labor agreements from which there was an opt-out accounted for only 1.2% of all employees as of December 2013, 64% of those workers (90% of the relevant collective labor agreements) were affected by opt-outs related to wages57.
Company-level collective agreements were previously required to be in accordance with region-specific and sectoral agreements, but as a result of the reforms, company-level collective
agreements are now given precedence over collective labor agreements, making it possible for companies to conclude labor agreements on working conditions, including wages, working hours and internal personnel transfers, etc. independently without being bound by the contents of collective labor agreements58.
As most of the workers covered by collective labor agreements are covered by sectoral agreements, the worker coverage ratio of company-specific agreements is less than 10% (Figure II-1-1-47). However, there are expectations that under the new framework, company-specific agreements will increase, leading to an increase in wage adjustment flexibility. It should be noted that the worker coverage ratio of collective agreements, which traditionally was higher than 70% fell below that line in 2012. (Figure II-1-1-48). Figure II-1-1-47 Ratio of industry agreements by type in Spain
Notes: This figure shows the ratios of workers covered by each type of wage agreements in 2013; one worker may be covered by several agreements. Source: Ministry of Employment and Social Security of Spain.
56 JETRO (2012a), Clauwaert, Schömann (2013). 57 Statistics for 2013 compiled by the Spanish Ministry of Employment and Social Security. 58 Clauwaert, Schömann (2013).
7%
1%
40%42%
10%
0%
10%
20%
30%
40%
50%
Enterprise-level entities
Enterprise groups
Sector (country)
Sector (states)
Sector (others)
141
Figure II-1-1-48 Trends in ratios of workers who are covered by labor agreements in Spain
(4) Easing of regulation on working hours In Spain, collective labor agreements had a strong binding power with regard to working hours as
well, making it difficult for companies to flexibly adjust working time. Therefore, companies relied on the termination of contracts of fixed-term workers as a means of labor adjustment, which became a cause of a steep increase in unemployed people at the time of the European debt crisis. From the fact that annual working hours per worker have increased since 2009, when the employment situation deteriorated, it can be presumed that there was a tendency to opt for the dismissal or contract termination of fixed-term workers, rather than reduction of working hours (Figure II-1-1-30 (presented earlier).
In 2012, working hours were made flexible so as to make it possible for companies to change annual working hours as they like by up to 5% in principle. In addition, the requirement for obtaining local government approval for labor adjustments such as temporary reduction of working hours and layoff was abolished, making it possible to implement such measures as long as there is a labor-management agreement59 60.
59 JETRO (2012a、2012b). 60 Previously, part-time workers were not allowed to work overtime. However, in order to promote
employment by increasing flexibility of the use of part-time work contracts, the government made it
possible for part-time workers to work overtime in 2012-2013. In 2013, the government raised the
maximum overtime working hours and made it possible to flexibly allocate working hours by reducing the
advance notice period concerning overtime work (JETRO (2014)).
73% 75%70%
72%65%
0%
20%
40%
60%
80%
100%
0 2 4 6 8
10 12 14 16 18 20
2008 2009 2010 2011 2012Number of covered employeesNumber of non-covered employeeRatios of covered employees (right axis)
Notes: This figure shows the number of employees covered by labor agreements and ratios thereofSource: Ministry of Employment and Social Security of Spain.
(Million people)
(Year)
142
In the Netherlands, jobs increased as a result of the reduction of working hours per worker in the 1990s (Figure II-1-1-49). There is the possibility that in Spain as well, jobs will increase as a result of deregulation. However, a high ratio of part-time jobs does not necessarily lead to an improvement in the employment situation (Figure II-1-1-50).
In Spain and other southern European countries, while fixed-term workers and full-time workers have decreased since the global economic crisis, part-time workers have increased (Figures II-1-1-51 and II-1-1-52). In particular, given that people working involuntarily as part-time employees have increased steeply61, full-time jobs may have been replaced by part-time jobs.
Figure II-1-1-49 Trends in working hours per person and the number of employed workers in the Netherlands
61 Eurostat.
1,280
1,300
1,320
1,340
1,360
1,380
1,400
1,420
0
2
4
6
8
10
1995 1997 1999 2001 2003 2005 2007 2009 2011
Number of employed workers
Working hours per person (right axis)
(Million people) (hours)
Notes: This figure shows anual working hours per person based on the data before 2012.Source: Eurostat, OECDstat.
(Year)
143
Figure II-1-1-50 Long-term unemployment rates and part-time employment rates in the OECD member countries
Figure II-1-1-51 Trends in the number of workers by mode of employment in Spain
Spain
Ireland
Italy
France
UKGermany
the U.S. Denmark Netherlands
JapanSweden0%
5%
10%
15%
0% 10% 20% 30% 40%
Long-term unem
ployment rates
Part-time employment ratesNotes: This figure shows the rates of people who have been unemployed for one year or longer to all the workers in the private sector in 2012.Source: OECDstat.
Notes: This figure targets people who continue the employment contract with companies at the end of each contract term, based on the data before the fourth quarter in 2013.Source: Ministry of Employment and Social Security of Spain.
(Quarter, year)
144
Figure II-1-1-52 Trends in ratios of workers by mode of employment from 2008-2012
Column 6 Fixed-term employment as a path to permanent employment While a fixed-term employment contract tends to pay low wages, provides few vocational training
opportunities and is vulnerable to the impact of recession, it may also help to secure jobs, improve skills through workplace vocational training during a provisional employment period and open the path to permanent employment.
In Germany, many young people obtain vocational qualifications through a high-quality vocational training system (dual system)62, and it is said that the youth unemployment rate in Germany is low partly because this system helps to secure employment.
On the other hand, before enrolling with vocational training schools, young people need to find companies willing to accept them as trainees and conclude employment contracts. Employment contracts concluded in this case are low-wage, fixed-term contracts that can be viewed as a sort of trial employment, so the hurdle for employers is low. Nevertheless, after the completion of training, 50-60% of trainees are employed by the companies that have trained them63, so it can be said that fixed-term employment is a path to permanent employment.
In Spain, the “Strategy for Entrepreneurship and Youth Employment,” which was announced in
62 This is an education system intended for young people who have finished mandatory education (9 to 10
years). Trainees engage in practical training in their areas of expertise at companies and learn theoretical
basics at vocational schools (Ministry of Economy, Trade and Industry (2013)). 63 Federal Institute for Vocational Education and Training (BIBB) (2012).
0
5
10
15
20
25
30
35
40
-30%
-20%
-10%
0%
10%
20%
30%
40%
50%
Portugal
Spain
Greece
Ireland
Italy
Denm
ark
UK
France
Japan
Netherlands
Germ
any
PermanentFixed-termPart-timeFull-timeRates of part-time employment (right axis)
Notes: This figure shows the growth rates of workers by mode of employment from 2008 to 2012; Fixed-term employment workers are sometimes also counted as part-time workers, and vice versa.; The rates of part-time employment are the data for 2012.Source: OECDstat.
145
2013, promotes permanent employment of young people, for example by easing the social security burden on employers when they convert fixed-term employment contracts into permanent ones64.
Meanwhile, the Netherlands eased regulation on fixed-term employment65 in 2010 as a provisional measure against the backdrop of the deterioration in the employment situation. However, on the grounds that it did not promote the conversion of fix-term employment into permanent employment, the measure was terminated in January 2012. Regulation on fixed-term employment contracts is scheduled to be tightened in July 2014 through such measures as the reduction of the maximum contract duration. Column 7 Part-time work and the labor participation rate
It has been pointed out that an increase in part-time work may negatively affect productivity by undermining the formation of human capital because part-time workers generally have few training opportunities compared with full-time workers. Meanwhile, the labor participation rate tends to be higher in countries with a higher ratio of part-time workers (Column Figure 7-1)66. When the supply of labor is expected to decline, the use of part-time work is promoted as a way of working that is convenient for people who face constraints on working hours for a variety of reasons, so it is necessary to ensure equal treatment for part-time workers and to improve working conditions for them67.
In EU countries, based on the 1997 part-time labor directive, giving unfavorable treatment to workers due to their part-time worker status without rational reasons is prohibited, so wage inequality between part-time and full-time workers is limited (Column Figure 7-2).
64 Spanish Ministry of Employment and Social Security (MINISTERIO DE EMPLEO Y SEGURIDAD
SOCIAL) (2013). 65 Usually, fixed-term employment contracts are automatically converted into permanent employment
contracts after the passage of 36 months. However, with regard to the employment of youth (people aged
27 or younger), the period until the conversion was extended to 48 months. In addition, while the maximum
number of successive fixed-term contracts was two (three contracts periods), the maximum number in the
case of youth employment was extended to three (four contract periods). Implemented in 2010-2011
(European Employment Observatory (2010), Eurofound (2013)) 66 The high labor participation rate in Sweden has been attributed to the mechanisms of the pension and tax
systems (Okina, Ishizawa, Yamada and Yumoto (2012)). 67 Ministry of Health, Labour and Welfare (2011b).
146
Figure Colum 7-1 Labor participation rates and part-time employment rates
Figure Colum 7-2 Ratio of wages between part-time workers and full-time workers
Notes: This figure shows the rates of hourly wages of part-time workers to those of full-time workers; The full-time workers’ wages in Japan are estimated values based on the annual wages of regular workers in 2013; The figure shows the data for 2010 for Spain, the third quarter for 2013 for Germany, and 2012 for the Netherlands. Source: National Statistics Institute (INE) of Spain, Statistisches Bundesamt of Germany, Statistics Netherlands (CBS), Basic Survey on Wage Structure of the Statistics and Information Department, Minister's Secretariat, Ministry of Health, Labour and Welfare
Denmark
France
Germany
Italy
Japan
NetherlandsSpain
SwedenSwitzerland
UKthe U.S.
50%
55%
60%
65%
70%
75%
80%
85%
90%
0 10 20 30 40
(%)Notes: Labor participation rates target workers with the age of 15 to 64; Part-time employment rates target all workers; The trendline indicate all of the OECD member states; The figure shows the data as of 2012.Source: OECDstat
Part-time employment rates
Labor participation rates
0%
20%
40%
60%
80%
100%
Spain Germany Netherlands Japan
147
(5) Active labor market policy and enhancement of youth employment As for expenditures on active labor market policy measures, Spain’s expenditures are at a middle
level among European countries. Although Spain’s expenditures on measures to promote employment declined in 2011 due to fiscal austerity, the country has been implementing various labor policy measures against the backdrop of an increase in youth unemployment.
The measures are wide-ranging and include: employment incentives, such as reducing or exempting social insurance premium payment by employers when they employ young people and long-term unemployed people; enhancing public employment service agencies and improving their efficiency (building cooperative relationships between local and national agencies, developing indicators (of efficiency, etc.) that serve as standards for allocation of budget to local agencies); establishing a job-matching database; expanding the vocational training system (training of personnel who meet market needs, such as those with information and communication technology skills and foreign language skills, introducing a vocational training system for young people (dual system) similar to the one in Germany, expanding job experience opportunities, etc.); making it obligatory for recipients of unemployment benefits to engage in activities to seek jobs and improve their employability; and helping unemployed people start new business (tax reduction, continuation of unemployment benefits, etc.)68.
Emphasis is placed on youth employment. In 2012, expenditures on youth employment measures69 totaled 286 million euros, but under the “Strategy for Entrepreneurship and Youth Employment” that was announced in March 2013, 871 million euros per year are scheduled to be spent per year on average until 2016. The budget for employment promotion measures, including youth employment measures, increased 25% in 2014 from the previous year, compared with the year-on-year increase of 3% in the entire national budget70 (Figure II-1-1-53).
68 The government of Spain (2013), the Spanish Ministry of Employment and Social Security (MINISTERIO DE EMPLEO Y SEGURIDAD SOCIAL) (2013). 69 Paid out of the European Social Fund. 70 Statistics compiled by the Spanish Ministry of Finance and Public Administration.
148
Figure II-1-1-5 (presented earlier) Labor policy indicators in Spain
Notes: Refer to FigureⅡ-1-1-3. Source: OECDstat.
Figure II-1-1-53 Trends in budgets in Spain
Notes: The expenditures for promoting employment do not meet those of the OECD’s active labor market policy; As of 2011, the former accounts for 78% of the latter. Source: Ministry of the Finance and Public Administration of Spain.
(6) Effects of the labor market reforms
The effects of the abovementioned labor market reforms can be seen by Spain’s reputation as an export base. Since 2011, growth in Spain’s export prices has been limited compared with export prices of many other countries, and its export volume has declined only slightly although many other countries’ export volume dropped steeply (Figures II-1-1-54 and II-1-1-55). According to a
0
5
10
Dismissal regulation
Non-regular employment (regulation on employment
contracts)
Non-regular employment (equal
treatment)
Expenditures for active labor market
policy
Expenditures for passive labor market policy
Spain
0
5
10
15
20
25
30
35
2009 2010 2011 2012 2013 2014
Expenditures for promoting employmentUnemployment benefits
(Billion euros)
(Year)
149
questionnaire survey conducted by the European Commission on manufacturing companies, the proportion of companies that say their competitiveness is improving has increased significantly in Spain since 201171 (Figure II-1-1-56).
Also, inward direct foreign investment is increasing (Figure II-1-1-57). While the recovery of the global economy and other factors are contributing to the increase in investment, some investments were made because of the progress in labor market reforms in Spain, such as easing of regulations on wages and dismissal.
The number of workers is not yet increasing, as the number is decreasing in the construction and industrial sectors (Figure II-1-1-58). However, there are expectations that the employment situation will recover in the medium and long term as a result of future expansion of corporate activity to be caused by increased flexibility of the labor market.
Figure II-1-1-54 Trends in export unit value indices in major European countries
France Germany GreeceIreland Italy NetherlandsPortugal Spain UK
(Indices; Jan. 2008=100)
Notes: This figure shows the values in and before Dec. 2013; It shows the past three-month moving averages.Source: Eurostat.
(Year)
150
Figure II-1-1-55 Trends in export volume indices in major European countries
Figure II-1-1-56 Competitiveness of enterprises outside the EU (Economic Sentiment Surveys by the European Commission)
Notes: Based on the surveys targeting the manufacturing industries, this figure shows the difference in ratios of answers of: “improved,” “aggravated” and “no change” to the question about how their companies change in the competitive positions outside the EU over the past three months; This figure shows the past three-quarter moving averages. Source: Industry/Business Indicator (European Commission).
75
80
85
90
95
100
105
2010 2011 2012 2013
France Germany Greece
Ireland Italy Netherlands
Portugal Spain UK
(Indices; Jan. 2008=100)
Notes: This figure shows the values in and before Dec. 2013; It shows the past three-month moving averages.Source: Eurostat.