1 Chapter 1. Source and behaviour of arsenic in natural waters Pauline L Smedley and David G Kinniburgh British Geological Survey, Wallingford, Oxon OX10 8BB, U.K. 1.1 Importance of arsenic in drinking water .......................................................................... 2 1.2 Arsenic in natural waters .................................................................................................. 2 1.2.1 Abundance and distribution .......................................................................................... 2 1.2.2 Aqueous speciation of arsenic ....................................................................................... 2 1.2.3 Redox and kinetics...................................................................................................... 13 1.3 Sources of arsenic ........................................................................................................... 14 1.3.1 Minerals ..................................................................................................................... 14 1.3.2 Rocks, sediments and soils .......................................................................................... 17 1.3.3 The atmosphere .......................................................................................................... 22 1.4 Mineral-water interactions ............................................................................................. 22 1.4.1 Relevance to arsenic mobilisation ............................................................................... 22 1.4.2 Arsenic interactions in sediments ................................................................................ 26 1.4.3 Iron in reduced sediments and aquifers ....................................................................... 27 1.4.4 Arsenic release from soils and sediments following reduction ..................................... 28 1.4.5 Transport of arsenic .................................................................................................... 29 1.5 Groundwater environments showing enhanced arsenic concentrations ...................... 30 1.5.1 World distribution of groundwater arsenic problems ................................................... 30 1.5.2 Reducing environments .............................................................................................. 35 1.5.3 Arid oxidising environments ....................................................................................... 40 1.5.4 Mixed oxidising and reducing environments ............................................................... 43 1.5.5 Geothermal sources .................................................................................................... 44 1.5.6 Arsenic mineralisation and mining-related arsenic problems ....................................... 45 1.6 Common features of groundwater arsenic problem areas ............................................ 46 1.6.1 A hydrogeochemical perspective ................................................................................. 46 1.6.2 The source term .......................................................................................................... 46 1.6.3 The necessary geochemical trigger .............................................................................. 47 1.6.4 The hydrogeological dimension – aquifer flushing ...................................................... 52 1.7 Outstanding questions and further needs ...................................................................... 54 1.7.1 Field analytical methods for arsenic determination...................................................... 54 1.7.2 Surveys of groundwater quality................................................................................... 55 1.7.3 Will the problem groundwaters get better or worse with time? .................................... 55 1.7.4 Transport under natural flow conditions ...................................................................... 56 1.7.5 Interaction of arsenic with sediments .......................................................................... 56 1.8 Strategy for locating arsenic problems in groundwater................................................ 57 1.9 Non-technical Summary ................................................................................................. 59 Acknowledgments .................................................................................................................... 61
Transcript
1
Chapter 1. Source and behaviour of arsenic in natural waters
Pauline L Smedley and David G Kinniburgh
British Geological Survey, Wallingford, Oxon OX10 8BB, U.K.
1.1 Importance of arsenic in drinking water..........................................................................21.2 Arsenic in natural waters ..................................................................................................2
1.2.1 Abundance and distribution .......................................................................................... 21.2.2 Aqueous speciation of arsenic....................................................................................... 21.2.3 Redox and kinetics...................................................................................................... 13
1.3 Sources of arsenic ...........................................................................................................141.3.1 Minerals ..................................................................................................................... 141.3.2 Rocks, sediments and soils.......................................................................................... 171.3.3 The atmosphere .......................................................................................................... 22
1.4 Mineral-water interactions .............................................................................................221.4.1 Relevance to arsenic mobilisation ............................................................................... 221.4.2 Arsenic interactions in sediments................................................................................ 261.4.3 Iron in reduced sediments and aquifers ....................................................................... 271.4.4 Arsenic release from soils and sediments following reduction ..................................... 281.4.5 Transport of arsenic .................................................................................................... 29
1.5 Groundwater environments showing enhanced arsenic concentrations......................301.5.1 World distribution of groundwater arsenic problems ................................................... 301.5.2 Reducing environments .............................................................................................. 351.5.3 Arid oxidising environments....................................................................................... 401.5.4 Mixed oxidising and reducing environments ............................................................... 431.5.5 Geothermal sources .................................................................................................... 441.5.6 Arsenic mineralisation and mining-related arsenic problems ....................................... 45
1.6 Common features of groundwater arsenic problem areas ............................................461.6.1 A hydrogeochemical perspective................................................................................. 461.6.2 The source term.......................................................................................................... 461.6.3 The necessary geochemical trigger .............................................................................. 471.6.4 The hydrogeological dimension – aquifer flushing...................................................... 52
1.7 Outstanding questions and further needs ......................................................................541.7.1 Field analytical methods for arsenic determination...................................................... 541.7.2 Surveys of groundwater quality................................................................................... 551.7.3 Will the problem groundwaters get better or worse with time? .................................... 551.7.4 Transport under natural flow conditions...................................................................... 561.7.5 Interaction of arsenic with sediments .......................................................................... 56
1.8 Strategy for locating arsenic problems in groundwater................................................571.9 Non-technical Summary.................................................................................................59
Arsenic (As) is a ubiquitous element found in the atmosphere, soils and rocks, natural watersand organisms. It is mobilised in the environment through a combination of natural processes such asweathering reactions, biological activity and volcanic emissions as well as through a range ofanthropogenic activities. Most environmental arsenic problems are the result of mobilisation undernatural conditions, but man has had an important impact through mining activity, combustion of fossilfuels, the use of arsenical pesticides, herbicides and crop desiccants and the use of arsenic as anadditive to livestock feed, particularly for poultry. Although the use of arsenical products such aspesticides and herbicides has decreased significantly in the last few decades, their use for woodpreservation is still common. The impact on the environment of the use of arsenical compounds, atleast locally, will remain for some years.
Of the various sources of arsenic in the environment, drinking water probably poses thegreatest threat to human health. Airborne arsenic, particularly through occupational exposure, has alsogiven rise to known health problems in some areas.
Drinking water is derived from a variety of sources depending on local availability: surfacewater (rivers, lakes, reservoirs and ponds), groundwater (aquifers) and rain water. These sources arevery variable in terms of arsenic risk. Alongside obvious point sources of arsenic contamination, highconcentrations are mainly found in groundwaters. These are where the greatest number of, as yetunidentified, sources are likely to be found. This review therefore focuses on the factors controllingarsenic concentrations in groundwaters.
Following the accumulation of evidence for the chronic toxicological effects of As in drinkingwater, recommended and regulatory limits of many authorities are being reduced. The WHO guidelinevalue for As in drinking water was provisionally reduced in 1993 from 50 µg l–1 to 10 µg l–1. The newrecommended value is based largely on analytical capability. If the standard basis for risk assessmentapplied to industrial chemicals were applied to arsenic, the maximum permissible concentrationwould be lower still. The US-EPA limit was also reduced from 50 µg l–1 to 10 µg l–1 in January 2001following prolonged debate over the most appropriate limit. The EC maximum admissibleconcentration (MAC) for As in drinking water is also to be reduced to 10 µg l–1. The Japanese limitfor drinking water is 10 µg l–1 and the interim maximum acceptable concentration for Canadiandrinking water is 25 µg l–1.
Whilst many national authorities are seeking to reduce their limits in line with the WHOguideline value, many countries and indeed all affected developing countries, still operate at presentto the 50 µg l–1 standard, in part because of lack of adequate testing facilities for lower concentrations.
Until recently, arsenic was often not on the list of constituents in drinking water routinelyanalysed by national laboratories, water utilities and NGOs and so the body of information about thedistribution of arsenic in drinking water is not as well known as for many other drinking-waterconstituents. In recent years, it has become apparent that both the WHO guideline value and currentnational standards are quite frequently exceeded in drinking-water sources, and often unexpectedly so.Indeed, arsenic and fluoride are now recognised as the most serious inorganic contaminants indrinking water on a worldwide basis. In areas of high arsenic concentrations, drinking water providesa potentially major source of arsenic in the diet and so its early detection is of great importance.
1.2 Arsenic in natural waters
1.2.1 Aqueous speciation
Arsenic is perhaps unique among the heavy metalloids and oxyanion-forming elements (e.g.arsenic, selenium, antimony, molybdenum, vanadium, chromium, uranium, rhenium) in its sensitivityto mobilisation at the pH values typically found in groundwaters (pH 6.5–8.5) and under bothoxidising and reducing conditions. Arsenic can occur in the environment in several oxidation states
3
(-3, 0, +3 and +5) but in natural waters is mostly found in inorganic form as oxyanions of trivalentarsenite (As(III)) or pentavalent arsenate (As(V)). Organic arsenic forms may be produced bybiological activity, mostly in surface waters, but are rarely quantitatively important. Organic formsmay however occur where waters are significantly impacted by industrial pollution.
Most toxic trace metals occur in solution as cations (e.g. Pb2+, Cu2+, Ni2+, Cd2+, Co2+, Zn2+)which generally become increasingly insoluble as the pH increases. At the near-neutral pH typical ofmost groundwaters, the solubility of most trace-metal cations is severely limited by precipitation as,or coprecipitation with, an oxide, hydroxide, carbonate or phosphate mineral, or more likely by theirstrong adsorption to hydrous metal oxides, clay or organic matter. In contrast, most oxyanionsincluding arsenate tend to become less strongly sorbed as the pH increases (Dzombak and Morel,1990). Under some conditions at least, these anions can persist in solution at relatively highconcentrations (tens of µg l–1) even at near-neutral pH values. Therefore the oxyanion-formingelements such as Cr, As, U and Se are some of the most common trace contaminants in groundwaters.
However, relative to the other oxyanion-forming elements, arsenic is among the mostproblematic in the environment because of its relative mobility over a wide range of redox conditions.Selenium is mobile as the selenate (SeO4
3-) oxyanion under oxidising conditions but is immobilizedunder reducing conditions either due to the stronger adsorption of its reduced form, selenite (SeO3
3–),or due to its reduction to the metal. Chromium can similarly be mobilized as stable Cr(VI) oxyanionspecies under oxidising conditions, but forms cationic Cr(III) species in reducing environments andhence behaves like other trace cations (i.e. is relatively immobile at near-neutral pH values). Otheroxyanions such as molybdate, vanadate, uranyl and rhenate also appear to be less mobile underreducing conditions. In sulphur-rich, reducing environments, many of the trace metals also forminsoluble sulphides. By contrast, arsenic is perhaps unique in being relatively mobile under reducedconditions. It can be found at concentrations in the mg l–1 range when all other oxyanion-formingmetals are present in the µg l–1 range.
Redox potential (Eh) and pH are the most important factors controlling arsenic speciation.Under oxidising conditions, H2AsO4
– is dominant at low pH (less than about pH 6.9), whilst at higherpH, HAsO4
2– becomes dominant (H3AsO40 and AsO4
3– may be present in extremely acidic andalkaline conditions respectively). Under reducing conditions at pH less than about pH 9.2, theuncharged arsenite species H3AsO3
0 will predominate (Figure 1.1; Brookins, 1988; Yan et al., 2000).The distributions of the species as a function of pH are given in Figure 1.2. In practice, most studies inthe literature report speciation data without consideration of the degree of protonation. In the presenceof extremely high concentrations of reduced sulphur, dissolved arsenic-sulphide species can besignificant. Reducing, acidic conditions favour precipitation of orpiment (As2S3), realgar (AsS) orother sulphide minerals containing coprecipitated arsenic. Therefore high arsenic waters are notexpected where there is a high concentration of free sulphide (Moore et al., 1988). Thioarsenitespecies will be more important at neutral and alkaline pH in the presence of very high sulphideconcentrations.
4
Figure 1.1 Eh-pH diagram of aqueous arsenic species in the system As–O2–H2O at 25ºC and1 bar total pressure
PENDING
Figure 1.2 Arsenic speciation (arsenite and arsenate) against pH
1.2.2 Abundance and distribution
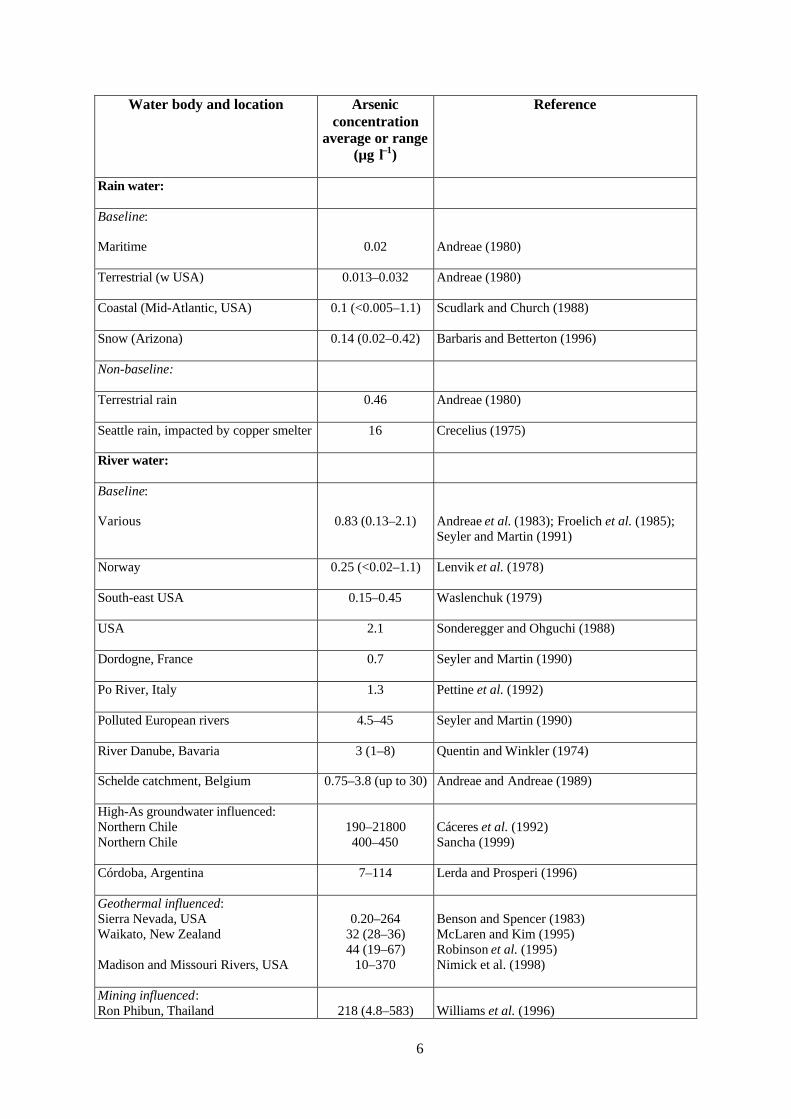
Concentrations of arsenic in fresh water vary by more than four orders of magnitude(Table 1.1) depending on the source of arsenic, the amount available and the local geochemicalenvironment. Under natural conditions, the greatest range and the highest concentrations of arsenicare found in groundwaters as a result of the strong influence of water-rock interactions and the greatertendency in aquifers for the physical and geochemical conditions to be favourable for arsenicmobilization and accumulation. The range of concentrations for many water bodies is large and hence
pH
0 2 4 6 8 10 12 14
Eh
(mV
)
-800
-400
0
400
800
1200
pe
-15
-10
-5
0
5
10
15
20
H3AsO40
H2AsO4-
HAsO42-
AsO43-
H3AsO30
H2AsO3-
HAsO32-
AsO33-
5
‘typical’ values are difficult to derive. Many studies of arsenic reported in the literature have alsopreferentially targeted known problem areas and hence reported ranges are often extreme andunrepresentative of natural waters as a whole. Nonetheless, the following compilation of data forranges of arsenic concentrations found in various parts of the hydrosphere and lithosphere gives abroad indication of the expected concentration ranges and their variation in the environment.
Atmospheric precipitationArsenic enters the atmosphere through inputs from wind erosion, volcanic emissions, low-
temperature volatilisation from soils, marine aerosols and pollution and is returned to the earth’ssurface by wet and dry deposition. The most important anthropogenic inputs are from smelteroperations and fossil-fuel combustion. The arsenic appears to consist of mainly As(III)2O3 dustparticles (Cullen and Reimer, 1989). Nriagu and Pacyna (1988) estimated that anthropogenic sourcesof atmospheric arsenic (around 18,800 tonnes yr–1) amounted to around 30% of the globalatmospheric arsenic flux. While it is accepted that these anthropogenic sources have an importantimpact on airborne arsenic compositions, their influence on the overall arsenic cycle is not wellestablished.
Baseline concentrations of arsenic in rainfall and snow in rural areas are invariably low attypically less than 0.03 µg l–1 (Table 1.1). Concentrations in areas affected by smelter operations, coalburning and volcanic emissions are generally higher. Andreae (1980) found rainfall potentiallyaffected by smelting and coal burning to have arsenic concentrations of around 0.5 µg l–1 (Table 1.1),although higher concentrations (average 16 µg l–1) have been found in rainfall collected in Seattlesome 35 km downwind of a copper smelter (Crecelius, 1975). Values given for Arizona snowpacks(Table 1.1; Barbaris and Betterton, 1996) are also probably slightly above baseline concentrationsbecause of potential inputs of airborne As from smelters, power plants and soil dust. In generalhowever, sources of airborne As in most industrialized nations are limited as a result of air-pollutioncontrol measures. Unless significantly contaminated with industrial sources of As, atmosphericprecipitation contributes little As to surface and groundwater bodies.
River waterBaseline concentrations of arsenic in river waters are also low (in the region of 0.1–0.8 µg l–1
but up to ca. 2 µg l–1; Table 1.1). They vary according to the composition of the surface recharge, thecontribution from baseflow and the bedrock lithology. Concentrations at the low end of the rangehave been found in rivers draining As-poor bedrocks. Seyler and Martin (1991) found average riverconcentrations as low as 0.13 µg l–1 in the Krka region of Yugoslavia where the bedrock is As-poorkarstic limestone (Table 1.1). Lenvik et al. (1978) also found low average concentrations of about0.25 µg l–1 in rivers draining basement rocks in Norway, the lowest being in catchments onPrecambrian rocks. Waslenchuk (1979) found concentrations in river waters from the south-easternUSA in the range 0.15–0.45 µg l–1 (Table 1.1).
6
Water body and location Arsenicconcentration
average or range(µg l–1)
Reference
Rain water:
Baseline:
Maritime 0.02 Andreae (1980)
Terrestrial (w USA) 0.013–0.032 Andreae (1980)
Coastal (Mid-Atlantic, USA) 0.1 (<0.005–1.1) Scudlark and Church (1988)
Snow (Arizona) 0.14 (0.02–0.42) Barbaris and Betterton (1996)
Non-baseline:
Terrestrial rain 0.46 Andreae (1980)
Seattle rain, impacted by copper smelter 16 Crecelius (1975)
River water:
Baseline:
Various 0.83 (0.13–2.1) Andreae et al. (1983); Froelich et al. (1985);Seyler and Martin (1991)
Norway 0.25 (<0.02–1.1) Lenvik et al. (1978)
South-east USA 0.15–0.45 Waslenchuk (1979)
USA 2.1 Sonderegger and Ohguchi (1988)
Dordogne, France 0.7 Seyler and Martin (1990)
Po River, Italy 1.3 Pettine et al. (1992)
Polluted European rivers 4.5–45 Seyler and Martin (1990)
River Danube, Bavaria 3 (1–8) Quentin and Winkler (1974)
Schelde catchment, Belgium 0.75–3.8 (up to 30) Andreae and Andreae (1989)
Iron Mountain up to 850,000 Nordstrom and Alpers (1999)
Ural Mountains 400,000 Gelova (1977)
Sediment pore water:
Baseline, Swedish Estuary 1.3–166 Widerlund and Ingri (1995)
Baseline, clays, Saskatchewan, Canada 3.2–99 Yan et al. (2000)
Baseline, Amazon shelf sediments up to 300 Sullivan and Aller (1996)
Mining-contam’d, British Columbia 50–360 Azcue et al. (1994)
Tailings impoundment, Ontario, Canada 300–100,000 McCreadie et al. (2000)
Oilfield and related brine:
Ellis Pool, Alberta, Canada 230 White et al. (1963)
Searles Lake brine, California up to 243,000
Relatively high concentrations of naturally-occurring arsenic can occur in some areas as aresult of inputs from geothermal sources or high-arsenic groundwaters. Arsenic concentrations in riverwaters from geothermal areas have been reported typically at around 10–70 µg l–1 (e.g. western USAand New Zealand; McLaren and Kim, 1995; Robinson et al., 1995; Nimick et al., 1998; Table 1.1),although higher concentrations have been found. Nimick et al. (1998) for example found arsenicconcentrations up to 370 µg l–1 in Madison River water (Wyoming and Montana) as a result ofgeothermal inputs from the Yellowstone geothermal system. Wilkie and Hering (1998) also foundconcentrations in the range 85–153 µg l–1 in Hot Creek (tributary of the Owens River, California).Some river waters affected by geothermal activity show distinct seasonal variations in arsenicconcentration. Concentrations in the Madison River have been noted to be highest during low-flowconditions. This has been attributed to a greater contribution of geothermal water during times of lowflow and dilution from spring runoff at times of high flow (Nimick et al., 1998). In the Waikato riversystem of New Zealand, As maxima were found in the summer months. These increases were linkedto temperature-controlled microbial reduction of As(V) to As(III) with consequent increased mobilityof As(III) (McLaren and Kim, 1995).
9
Increased concentrations are also reported in some river waters from arid areas where thesurface water is dominated by river baseflow, i.e. by water flowing into the surface water from thesurrounding rocks. The resulting surface waters often have a high pH and alkalinity. For example, insurface waters from the Loa River Basin of northern Chile (Antofagasta area, Atacama desert),Cáceres et al. (1992) found concentrations of naturally-occurring arsenic ranging between 190–21,800 µg l–1. The high arsenic concentrations correlated well with salinity and were presumablyrelated to evaporative concentration of baseflow-dominated river water. Increased arsenicconcentrations (up to 114 µg l–1) have also been reported in river waters from central Argentina whereregional groundwater-arsenic concentrations (and pH, alkalinity) are high (Lerda and Prosperi, 1996).
Although bedrock inevitably has an influence on river-water arsenic concentrations,concentrations in rivers with more typical pH and alkalinity values (c. pH 5–7, alkalinity <100 mg l–1
as HCO3) do not show the extremely high concentrations found in groundwaters because of oxidationand adsorption of arsenic species onto the river sediments as well as dilution by surface recharge andrunoff. Arsenic concentrations in seven river water samples from Bangladesh have been reported inthe range <0.5–2.7 µg l–1 but with one sample having a high concentration of 29 µg l–1 (BGS andDPHE, 2001). The highest value observed is significantly above world-average baselineconcentrations (Table 1.1) but is much lower than some of the values found in the groundwaters(Section 1.5).
Significant increases in arsenic concentrations of river waters may also occur as a result ofpollution from industrial or sewage effluents. Andreae and Andreae (1989) found concentrations of upto 30 µg l–1 in water from the River Zenne, Belgium which is affected by inputs from urban andindustrial sources, particularly sewage. However, the concentration of arsenic in water from most ofthe catchment was in the range 0.75–3.8 µg l–1 and not significantly different from baselineconcentrations. Durum et al. (1971) reported arsenic concentrations in 727 samples of surface watersfrom the United States. While 79% of the samples had As concentrations below the (rather high)detection limit of 10 µg l–1, the highest observed concentration, 1,100 µg l–1, was found in SugarCreek, South Carolina, downstream of an industrial complex.
Arsenic can also be derived from mine wastes and mill tailings. Azcue and Nriagu (1995)found baseline concentrations in the Moira River, Ontario of 0.7 µg l–1 upstream of the influence oftailings from gold-mine workings. Downstream, concentrations increased to 23 µg l–1. Azcue et al.(1994) found concentrations up to 556 µg l–1 (average 17.5 µg l–1) in streams adjacent to tailingsdeposits in British Columbia. Williams et al. (1996) and Smedley et al. (1996) noted high arsenicconcentrations (typically around 200–300 µg l–1) in surface waters affected respectively by tin- andgold-mining activities. Though often involving notable increases above baseline concentrations, suchanomalies tend to be relatively localised around the pollution source, principally because of the strongadsorption affinity of oxide minerals, especially iron oxide, for arsenic under oxidising, neutral tomildly acidic conditions.
Lake waterConcentrations of arsenic in lake waters are typically close to or lower than those found in
river water. Baseline concentrations have been found at <1 µg l–1 in Canada (Azcue and Nriagu, 1995;Azcue et al., 1995). As with river waters, increased concentrations are found in lake waters affectedby geothermal water and by mining activity. Ranges of typically 100–500 µg l–1 have been reported insome mining areas and up to 1000 µg l–1 in geothermal areas (Table 1.1). Arsenic concentrations inmining-affected lake waters are not always high however, as removal from solution can be achievedeffectively by adsorption onto iron oxides under neutral to mildly acidic conditions. Azcue et al.(1994), for example, found arsenic concentrations in Canadian lake waters affected by mining effluentsimilar to those not affected by mining effluent, in each case about 0.3 µg l–1.
High arsenic concentrations are also found in some alkaline closed-basin lakes as a result ofextreme evaporation and/or geothermal inputs. Mono Lake in the California, USA, for example, has
10
concentrations of dissolved arsenic of 10–20 mg l–1, with pH values in the range 9.5–10 as a result ofinputs from geothermal springs and the weathering of volcanic rocks followed by evaporation (Maestet al., 1992).
There is also much evidence for stratification of arsenic concentrations in some lake waters.Azcue and Nriagu (1995) found that concentrations increased with depth (up to 10 m) in lake watersfrom Ontario, probably because of an increasing ratio of As(III) to As(V) with depth and an influx ofmining-contaminated sediment pore waters at the sediment-water interface. The concentrations werehigher in summer when the proportion of As(III) was observed to be higher. Depleted oxygen levelsin the bottom lake waters as a result of biological productivity during the summer months are a likelycause of the higher arsenic concentrations in the deeper lake waters.
Seawater and estuariesAverage arsenic concentrations in open seawater usually show little variation and are
typically around 1.5 µg l–1 (Table 1.1).
Concentrations in estuarine water are more variable as a result of varying river inputs andsalinity or redox gradients but are also usually low, at typically less than 4 µg l–1 under naturalconditions. Peterson and Carpenter (1983) found concentrations between 1.2–2.5 µg l–1 in waters fromSaanich Inlet, British Columbia. Values less than 2 µg l–1 were found in Oslofjord, Norway (Abdullahet al., 1995; Table 1.1). Concentrations are commonly higher when riverine inputs are affected byindustrial or mining effluent (e.g. Tamar, Schelde, Loire Estuaries; Table 1.1) or by geothermal water.Unlike some other trace elements such as boron, saline intrusion of seawater into an aquifer isunlikely to lead to a significant increase of arsenic in the affected groundwater.
Arsenate shares many chemical characteristics with phosphate and hence in oxic marine andestuarine waters, depletions in phosphate in biologically productive surface waters are mirrored bydepletions in arsenate. Arsenate concentration minima often coincide with photosynthetic maximaevidenced by high concentrations of chlorophyll a (Cullen and Reimer, 1989).
Several studies have noted variations in the behaviour of arsenic during estuarine mixing.Some have reported conservative behaviour. In the unpolluted Krka Estuary of Yugoslavia, Seylerand Martin (1991) observed a linear increase in total As with increasing salinity ranging from0.13 µg l–1 in fresh waters to 1.8 µg l–1 offshore (i.e. seawater value). However, other studies haveobserved non-conservative behaviour (departures from simple mixing) in estuaries due to processessuch as diffusion from sediment pore waters, coprecipitation with iron oxides or anthropogenic inputs(e.g. Andreae et al., 1983; Andreae and Andreae, 1989). The flocculation of iron oxides at thefreshwater-saline interface is important as a result of increases in pH and salinity. This can lead tomajor decreases in the arsenic flux to the oceans (Cullen and Reimer, 1989).
GroundwaterBackground concentrations of arsenic in groundwater are in most countries less than 10 µg l–1
(e.g. Edmunds et al., 1989 for the UK; Welch et al., 2000 for the USA) and sometimes substantiallylower. However, values quoted in the literature show a very large range from <0.5–5000 µg l–1 (i.e.four orders of magnitude). This range occurs under natural conditions. High concentrations of arsenicare found in groundwater in a variety of environments. This includes both oxidising (under conditionsof high pH) and reducing aquifers and in areas affected by geothermal, mining and industrial activity.Evaporative concentration can also increase concentrations substantially. Most high-arsenicgroundwater provinces are the result of natural occurrences of arsenic. Cases of mining-inducedarsenic pollution are numerous in the literature but tend to be localised. Cases of industrially-inducedarsenic pollution (including that from agriculture) may be severe locally (Table 1.1) but occurrencesare relatively rare. Groundwater provinces with naturally-occurring As problems are discussed inmore detail in Section 1.5.
11
Mine drainageUnder the extremely acid conditions of some acid mine drainage (AMD), which can have
negative pH values (Nordstrom et al., 2000), high concentrations of a wide range of solutes are found,including iron and arsenic. The highest reported arsenic concentration of 850,000 µg l–1 is from anacid seep in the Richmond mine at Iron Mountain, California (Nordstrom and Alpers, 1999). In acompilation of some 180 samples of mine drainage from the USA, Plumlee et al. (1999) reportedconcentrations ranging from detection limits (<1 µg l–1 or more) to 340,000 µg l–1, again the highestvalues being from the Richmond mine. Gelova (1977) also reported an arsenic concentration of400,000 µg l–1 from the Ural Mountains. Dissolved arsenic in acid mine waters is rapidly removed asthe iron is oxidised and precipitated and the arsenic scavenged through adsorption. At Iron Mountain,an efficient neutralization plant removes the arsenic and other metals for safe disposal.
Sediment pore watersSome high concentrations of As have been found in pore waters extracted from
unconsolidated sediments and often form sharp contrasts to the concentrations observed in overlyingsurface waters (e.g. Belzile and Tessier, 1990). Widerlund and Ingri (1995) found concentrations inthe range 1.3–166 µg l–1 in pore waters from the Kalix River estuary of northern Sweden. Yan et al.(2000) found As concentrations in the range 3.2–99 µg l–1 in pore waters from clay sediments inSaskatchewan, Canada (Table 1.1). Even higher concentrations can be found in pore waters fromsediments affected by mining contamination (tailings, mineral-rich deposits). McCreadie et al. (2000)reported As concentrations up to 100,000 µg l–1 in porewaters extracted from tailings in Ontario(Table 1.1). In such cases, high pore water arsenic concentrations are most likely to be linked to thestrong redox gradients that occur below the sediment-water interface often over depth scales ofcentimeters. Burial of fresh organic matter and the slow diffusion of oxygen through the sedimentleads to reducing conditions just below the sediment-water interface. This encourages the reduction ofAs(V) and desorption from Fe and Mn oxides, as well as reductive dissolution of these minerals.There is much evidence for cycling of As between shallow sediment pore waters and overlyingsurface waters in response to temporal variations in redox conditions.
Sullivan and Aller (1996) carried out an elegant study of the cycling of arsenic in shallowsediments from the offshore shelf of the Amazon situated far from population centres. They measuredpore water As and Fe concentration profiles as well as sediment As and Fe(II) concentrations. Therewas frequently a well-correlated peak in dissolved As and Fe concentrations some 50 cm to 150 cmbeneath the surface with As concentrations in the peak averaging about 135 µg l–1 and reaching amaximum of 300 µg l–1, much greater than from marine coastal environments. The dissolved As/Femolar ratio varied but was typically about 1:300. Dissolved As varied inversely with easily-leachable(6M HCl) As in the sediment and increased directly with solid-phase Fe(II). In these sediments, Feoxides were believed to be a much more important source of As than Mn oxides.
Oilfield and other brinesOnly limited data are available for arsenic in oilfield and other brines, but some published
accounts suggest that concentrations can be very high. White et al. (1963) reported a dissolved arsenicconcentration of 230 µg l–1 in a sodium-bicarbonate groundwater from a 1000 m deep oilfield wellfrom Ellis Pool, Alberta, Canada. They also reported a concentration of 5800 µg l–1 arsenic in asodium-chloride-dominated brine from Tisakürt, Hungary. Composite brines from the interstices ofsalt deposits from Searles Lake, California, have arsenic concentrations up to 243 mg l–1 (Na 119 g l–1;White et al., 1963; Table 1.1).
1.2.3 Distribution of arsenic species in water bodies
Most studies of arsenic speciation in natural waters attempt to separate the inorganic speciesinto As(III) and As(V) usually by chromatographic separation or by making use of the relatively slowreduction of As(V) by sodium borohydride. Some studies also measure the organic arsenic species
12
too. The sampling and analytical techniques required are far from trivial and not yet well-established(Edwards et al., 1998). Separation of species may be carried out in the field to avoid the problem ofpreserving species for later laboratory analysis. Alternatively, preservation with HCl and ascorbic acidhas been successful.
In rain water, oxidation states will vary according to the arsenic source. This is likely to bedominantly As(III)2O3 when derived from smelters, coal burning and volcanic sources, althoughorganic species may be derived by volatilization from soils, arsine (As(-III)H3) may derive fromlandfills and reducing soils such as peats and arsenate may be derived from marine aerosols. Reducedforms will undergo oxidation by O2 in the atmosphere and reactions with atmospheric SO2 or O3 arelikely (Cullen and Reimer, 1989).
In oxic seawater, the As is typically dominated by As(V), though some As(III) is invariablypresent and becomes of increasing importance in anoxic bottom waters. Ratios of As(V)/As(III) aretypically in the range 10–100 in open seawater (Andreae, 1979; Peterson and Carpenter, 1983; Pettineet al., 1992). Arsenic(V) should exist mainly as HAsO4
2– and H2AsO4– in the pH range of seawater
(pH around 8.2; Figures 1.1. and 1.2) and As(III) will exist mainly as the neutral species H3AsO3.Relatively high proportions of H3AsO3 are found in surface waters. These coincide with zones ofprimary productivity. Increases in organic arsenic species have also been recorded in these zones as aresult of methylation reactions by phytoplankton (Cullen and Reimer, 1989).
The relative proportions of arsenic species are more variable in estuarine waters because ofvariable redox and salinity, and terrestrial inputs (Howard et al., 1988; Abdullah et al., 1995).However, they are still dominated by As(V). Andreae and Andreae (1989) found As(V)/As(III) ratiosvarying between 5–50 in the Schelde Estuary of Belgium with the lowest ratios in anoxic zones whereinputs of industrial effluent had an impact. Elevated proportions of As(III) also result from inputs ofmine effluent (Klumpp and Peterson, 1979). Seasonal variations in As concentration and speciationhave been noted in estuaries (Riedel, 1993). In seasonally anoxic estuarine waters, variations in therelative proportions of As(III) and As(V) can be large. Peterson and Carpenter (1983) found a distinctcrossover in the proportions of the two species with increasing depth in response to the onset ofanoxic conditions in the estuarine waters of Saanich Inlet of British Columbia. Arsenic(III)represented only 5% (0.10 µg l–1) of the dissolved As above the redox front but 87% (1.58 µg l–1)below it. In marine and estuarine waters, organic forms are usually less abundant but are nonethelessoften detected (e.g. Riedel, 1993; Howard et al., 1999). Concentrations of these will depend onabundance and species of biota present and on temperature.
In lake and river waters, As(V) is also generally the dominant species (e.g. Seyler and Martin,1990; Pettine et al., 1992), though significant seasonal variations in speciation as well as absoluteconcentration have been found. Concentrations and relative proportions of As(V) and As(III) varyaccording to changes in input sources, redox conditions and biological activity. The presence ofAs(III) may be maintained in oxic waters by biological reduction of As(V), particularly duringsummer months. Higher relative proportions of As(III) have been found in river stretches close toinputs of As(III)-dominated industrial effluent (Andreae and Andreae, 1989) and in waters with acomponent of geothermal water.
Proportions of As(III) and As(V) are particularly variable in stratified lakes where redoxgradients can be large and seasonally variable (Kuhn and Sigg, 1993). As with estuarine waters,distinct changes in arsenic speciation occur in lake profiles as a result of redox changes. For example,in the stratified, hypersaline and hyperalkaline Mono Lake (California, USA), there is a predominanceof As(V) in the upper oxic layer and of As(III) in the reducing part (Maest et al., 1992; Oremland etal., 2000). Rapid oxidation of As(III) occurs during the early stages of lake turnover as a result ofmicrobial activity (Oremland et al., 2000). This occurs before Fe(II) oxidation.
Unlike Mono Lake, speciation of As in lakes does not necessarily follow that expected fromthermodynamic considerations. Recent studies have shown that arsenite predominates in the oxidised
13
epilimnion of some stratified lakes whilst arsenate may persist in the anoxic hypolimnion (Kuhn andSigg, 1993; Newman et al., 1998). Proportions of arsenic species may also vary according to theavailability of particulate Fe and Mn oxides (Pettine et al., 1992; Kuhn and Sigg, 1993).
Organic forms of arsenic are usually minor in surface waters. In lake waters from Ontario,Azcue and Nriagu (1995) found As(III) concentrations of 7–75 µg l–1, As(V) of 19–58 µg l–1 and only0.01–1.5 µg l–1 of organic As. Nonetheless, proportions of organic forms of arsenic can increase as aresult of methylation reactions catalysed by microbial activity (bacteria, yeasts, algae). The dominantorganic forms found are dimethylarsinic acid (DMAA; (CH3)2AsO(OH)) and monomethylarsonic acid(MMAA; CH3AsO(OH)2), where As is present in both cases in the pentavalent oxidation state.Proportions of these two species have been noted to increase in summer as a result of increasedmicrobial activity (e.g. Hasegawa, 1997). The organic species may also be more prevalent close to thesediment-water interface (Hasegawa et al., 1999).
In groundwaters, the ratio of As(III) to As(V) can vary enormously as a result of largevariations in aquifer redox conditions, redox gradients and history. In strongly reducing aquifers(Fe(III)- and sulphate-reducing), As(III) typically dominates. Reducing arsenic-rich groundwatersfrom Bangladesh have As(III)/AsT ratios varying between 0.1–0.9 but are typically around 0.5–0.6(DPHE/BGS/MML, 1999). Ratios in reducing groundwaters from Inner Mongolia are typically 0.7–0.9 (Smedley et al., 2000b). Concentrations of organic forms are generally low or negligible ingroundwaters (e.g. Chen et al., 1995).
1.2.4 Redox and kinetics
Redox reactions are important for controlling the behaviour of many major and minor speciesin natural waters, including that of arsenic. However, in practice, redox equilibrium is often achievedonly slowly. For example, Wersin et al. (1991) estimated that the complete reductive dissolution ofFe(III) oxides in an anoxic Swiss lake sediment would take more than 1000 years. Equilibriumthermodynamic calculations predict that As(V) should dominate over As(III) in all but stronglyreducing conditions, i.e. at least sulphate-reducing conditions (Section 1.2.1). However, suchtheoretical behaviour is not necessarily followed quantitatively in natural waters where different redoxcouples can point to different implied redox potentials (Eh values) reflecting thermodynamicdisequilibrium (Seyler and Martin, 1989; Eary and Schramke, 1990; Kuhn and Sigg, 1993). InOslofjord, Norway, As(III) was found under oxidising conditions (Abdullah et al., 1995). Also, inoxygenated seawater, the As(V)/As(III) ratios should be of the order of 1015–1026 (Andreae, 1979)whereas measured ratios of 0.1–250 have been found largely supported by biological transformations(Johnson and Pilson, 1975; Cullen and Reimer, 1989). Oxidation of As(III) by dissolved oxygen, so-called oxygenation, is a particularly slow reaction. Johnson and Pilson (1975) gave half-lives for theoxygenation of As(III) in seawater ranging from several months to a year.
Other studies have demonstrated the stability of As(V)/As(III) ratios over periods of days orweeks during water sampling when no particular care was taken to prevent oxidation again suggestingrelatively slow oxidation rates. Andreae (1979) found stable ratios in seawater for up to 10 days (4ºC).Cherry et al. (1979) found from experimental studies that the As(V)/As(III) ratios were stable inanoxic solutions for up to 3 weeks but that gradual changes occurred over longer timescales. Theyalso suggested that the measured As(V)/As(III) ratios in natural waters might be used as an indicatorof the ambient redox (Eh) conditions, particularly in groundwater where equilibration times are long.Yan et al. (2000) have also concluded that the As(V)/As(III) ratio may be used as a reliable redoxindicator for groundwater systems. However, this optimism may be unfounded since Welch et al.(1988) found that the Eh calculated from the As(V)-As(III) couple neither agreed with that from theFe(II)-Fe(III) and other redox couples nor with the measured Eh. Therefore, the reliability of thearsenic redox couple as a redox indicator remains to be seen. It is clearly important that where suchcomparisons are made, reliable Eh measurements are carried out (Yan et al., 2000). Perhaps the mostthat can be said at present is that the existence of As(III) implies reducing conditions somewhere inthe system.
14
Laboratory studies show that the kinetics of oxygenation of As(III) are slowest in the slightlyacid range, around pH 5 (Eary and Schramke, 1990) which is why water samples are often acidified toabout this pH to preserve their in situ speciation. Eary and Schramke (1990) also gave an empiricalrate equation for the reaction over the pH range 8–12.5. This was based on the concentration (activity)of the H2AsO3
– species in solution. They suggested that the half-life for As(III) in natural waters is 1–3 years although the rate may be greater because of the presence of ‘unknown aqueous species’ oroxide particles, especially manganese oxides. Certainly there is considerable evidence that manganeseoxides can increase the rate of As(III) oxidation with half-lives being reduced to as little as 10–20 minin the presence of manganese-oxide particles (Oscarson et al., 1981; Scott and Morgan, 1995). This isused to advantage in the removal of As(III) from drinking water (Driehaus et al., 1995). The rate ofoxidation is independent of the concentration of dissolved oxygen (Scott and Morgan, 1995), the ratebeing controlled by the rate of a surface reaction. Less is known about the role of iron oxides inaltering the oxygenation kinetics. Photochemical oxidation and reduction may be additional factors insurface waters. Ti-containing particles may aid the photo-oxidation (Foster et al., 1998).
As with most redox reactions in the natural environment, both the oxidation of arsenite andthe reduction of arsenate can be bacterially catalysed. Sterile water samples have been noted to be lesssusceptible to speciation changes than non-sterile samples (Cullen and Reimer, 1989). Wilkie andHering (1998) found that As(III) in geothermal waters input to streams in south-west USA oxidisedrapidly downstream (pseudo first-order half-life calculated at as little as 0.3 hours) and attributed thefast rate to bacterial mediation. The reduction of As(V) to As(III) in Mono Lake was also rapidlycatalysed by bacteria with rate constants ranging from 0.02 to 0.3 day–1 (Oremland et al., 2000).Methylated As species are also readily oxidised chemically and biologically (Abdullah et al., 1995).
Less is known about the rate of solid-phase reduction of As(V) to As(III) but there have beensome studies with soils and sediments. The evidence from soils is that under moderately reducingconditions (Eh < 100 mV) induced by flooding, As(V) is reduced to As(III) in a matter of days orseveral weeks and adsorbed As(V) is released as As(III) (Masscheleyn et al., 1991; Reynolds et al.,1999). Masscheleyn et al. (1991) found from laboratory experiments that some of the As was releasedbefore Fe, implying reductive desorption from iron oxides rather than reductive dissolution. Up to 10per cent of the total As in the soil eventually became soluble. Smith and Jaffé (1998) modelled As(V)reduction in benthic sediments as a first order reaction with respect to arsenate with a rate coefficientof 125 yr–1.
1.3 Sources of arsenic
1.3.1 Minerals
Major arsenic mineralsArsenic occurs as a major constituent in more than 200 minerals, including elemental arsenic,
arsenides, sulphides, oxides, arsenates and arsenites. A list of some of the most common As mineralsis given in Table 1.2. Most are ore minerals or their alteration products. However, these minerals arerelatively rare in the natural environment. The greatest concentrations of these minerals occur inmineralised areas and are found in close association with the transition metals as well as Cd, Pb, Ag,Au, Sb, P, W and Mo. The most abundant As ore mineral is arsenopyrite, FeAsS. It is generallyaccepted that arsenopyrite, together with the other dominant As-sulphide minerals realgar andorpiment, are only formed under high temperature conditions in the earth’s crust. However, authigenicarsenopyrite has been reported in sediments by Rittle et al. (1995). Although often present in oredeposits, arsenopyrite is much less abundant than arsenian (‘arsenic-rich’) pyrite (Fe(S,As)2) which isprobably the most important source of As in ore zones (Nordstrom, 2000).
15
Table 1.2 Major arsenic minerals occurring in nature
Mineral Composition Occurrence
Native arsenic As Hydrothermal veins
Niccolite NiAs Vein deposits and norites
Realgar AsS Vein deposits, often associated with orpiment, clays andlimestones, also deposits from hot springs
Orpiment As2S3 Hydrothermal veins, hot springs, volcanic sublimation product
Pharmacosiderite Fe3(AsO4)2(OH)3.5H2O Oxidation product of arsenopyrite and other As minerals
Where arsenopyrite is present in sulphide ores associated with sediment-hosted gold deposits,it tends to be the earliest-formed mineral, derived from hydrothermal solutions and formed attemperatures typically of 100ºC or more. This is followed by the formation of rarer native arsenic andthereafter arsenian pyrite. Realgar and orpiment generally form later still. This paragenetic sequenceis often reflected by zonation within sulphide minerals, with arsenopyrite cores zoning out to arsenianpyrite and realgar-orpiment rims. Oxides and sulphates are formed at the latest stages of oremineralisation (Arehart et al., 1993).
Rock-forming mineralsThough not a major component, arsenic is also often present in varying concentrations in
other common rock-forming minerals. As the chemistry of arsenic follows closely that of sulphur, thegreatest concentrations of the element tend to occur in sulphide minerals, of which pyrite is the mostabundant. Concentrations in pyrite, chalcopyrite and galena can be very variable, even within a givengrain, but in some cases reach up to 10 weight percent (Table 1.3). Arsenic is present in the crystalstructure of many sulphide minerals as a substitute for sulphur.
16
Table 1.3. Typical arsenic concentrations in common rock-forming mineralsMineral As concentration range
(mg kg–1)References
Sulphide minerals:
Pyrite 100–77,000 Baur and Onishi (1969); Arehart et al. (1993); Fleetand Mumin (1997)
Pyrrhotite 5–100 Boyle and Jonasson (1973);
Marcasite 20–126,000 Dudas (1984); Fleet and Mumin (1997)
Galena 5–10,000
Sphalerite 5–17,000
Chalcopyrite 10–5000
Oxide minerals:
Haematite up to 160
Fe oxide (undifferentiated) up to 2000
Fe(III) oxyhydroxide up to 76,000 Pichler et al. (1999)
Magnetite 2.7–41
Ilmenite <1
Silicate minerals:
Quartz 0.4–1.3
Feldspar <0.1–2.1
Biotite 1.4
Amphibole 1.1–2.3
Olivine 0.08–0.17
Pyroxene 0.05–0.8
Carbonates minerals:
Calcite 1–8
Dolomite <3
Siderite <3
Sulphate minerals:
Gypsum/anhydrite <1–6
Barite <1–12
Jarosite 34–1000
17
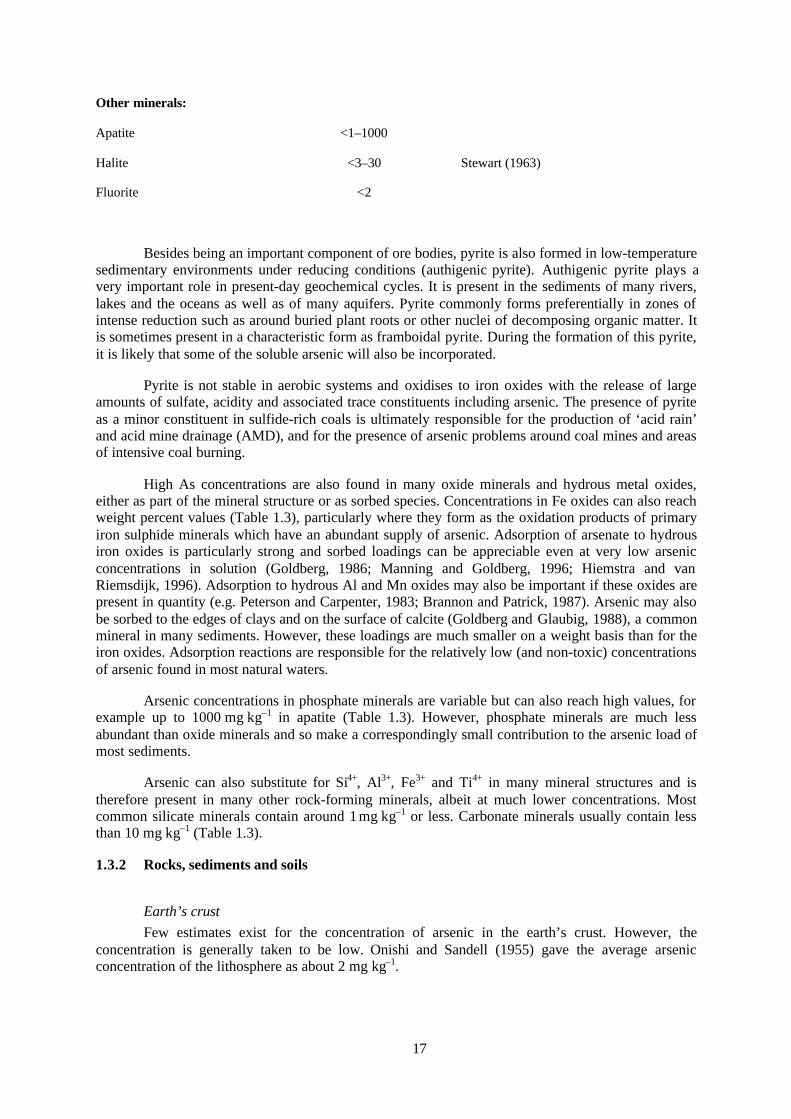
Other minerals:
Apatite <1–1000
Halite <3–30 Stewart (1963)
Fluorite <2
Besides being an important component of ore bodies, pyrite is also formed in low-temperaturesedimentary environments under reducing conditions (authigenic pyrite). Authigenic pyrite plays avery important role in present-day geochemical cycles. It is present in the sediments of many rivers,lakes and the oceans as well as of many aquifers. Pyrite commonly forms preferentially in zones ofintense reduction such as around buried plant roots or other nuclei of decomposing organic matter. Itis sometimes present in a characteristic form as framboidal pyrite. During the formation of this pyrite,it is likely that some of the soluble arsenic will also be incorporated.
Pyrite is not stable in aerobic systems and oxidises to iron oxides with the release of largeamounts of sulfate, acidity and associated trace constituents including arsenic. The presence of pyriteas a minor constituent in sulfide-rich coals is ultimately responsible for the production of ‘acid rain’and acid mine drainage (AMD), and for the presence of arsenic problems around coal mines and areasof intensive coal burning.
High As concentrations are also found in many oxide minerals and hydrous metal oxides,either as part of the mineral structure or as sorbed species. Concentrations in Fe oxides can also reachweight percent values (Table 1.3), particularly where they form as the oxidation products of primaryiron sulphide minerals which have an abundant supply of arsenic. Adsorption of arsenate to hydrousiron oxides is particularly strong and sorbed loadings can be appreciable even at very low arsenicconcentrations in solution (Goldberg, 1986; Manning and Goldberg, 1996; Hiemstra and vanRiemsdijk, 1996). Adsorption to hydrous Al and Mn oxides may also be important if these oxides arepresent in quantity (e.g. Peterson and Carpenter, 1983; Brannon and Patrick, 1987). Arsenic may alsobe sorbed to the edges of clays and on the surface of calcite (Goldberg and Glaubig, 1988), a commonmineral in many sediments. However, these loadings are much smaller on a weight basis than for theiron oxides. Adsorption reactions are responsible for the relatively low (and non-toxic) concentrationsof arsenic found in most natural waters.
Arsenic concentrations in phosphate minerals are variable but can also reach high values, forexample up to 1000 mg kg–1 in apatite (Table 1.3). However, phosphate minerals are much lessabundant than oxide minerals and so make a correspondingly small contribution to the arsenic load ofmost sediments.
Arsenic can also substitute for Si4+, Al3+, Fe3+ and Ti4+ in many mineral structures and istherefore present in many other rock-forming minerals, albeit at much lower concentrations. Mostcommon silicate minerals contain around 1 mg kg–1 or less. Carbonate minerals usually contain lessthan 10 mg kg–1 (Table 1.3).
1.3.2 Rocks, sediments and soils
Earth’s crustFew estimates exist for the concentration of arsenic in the earth’s crust. However, the
concentration is generally taken to be low. Onishi and Sandell (1955) gave the average arsenicconcentration of the lithosphere as about 2 mg kg–1.
18
Table 1.4. Typical arsenic concentrations in rocks, sediments, soils and other surficial deposits
Rock/sediment type As concentrationaverage and/orrange (mg kg–1)
Soils near sulphide deposits 126 (2–8000) 193 Boyle and Jonasson (1973)
Contaminated surficial deposits:
Mining-contaminated lake sediment, BritishColombia
342 (80–1104) Azcue et al. (1994; 1995)
Mining-contaminated reservoir sediment, Montana 100–800 Moore et al. (1988)
Mine tailings, British Colombia 903 (396–2000) Azcue et al. (1995)
Soils and tailings-contaminated soil, UK 120–52,600 86 Kavanagh et al. (1997)
Tailings-contaminated soil, Montana up to 1100 Nagorski and Moore (1999)
Industrially polluted inter-tidal sediments, USA 0.38–1260 Davis et al. (1997)
Soils below chemicals factory, USA 1.3–4770 Hale et al. (1997)
Sewage sludge 9.8 (2.4–39.6) Zhu and Tabatabai (1995)
20
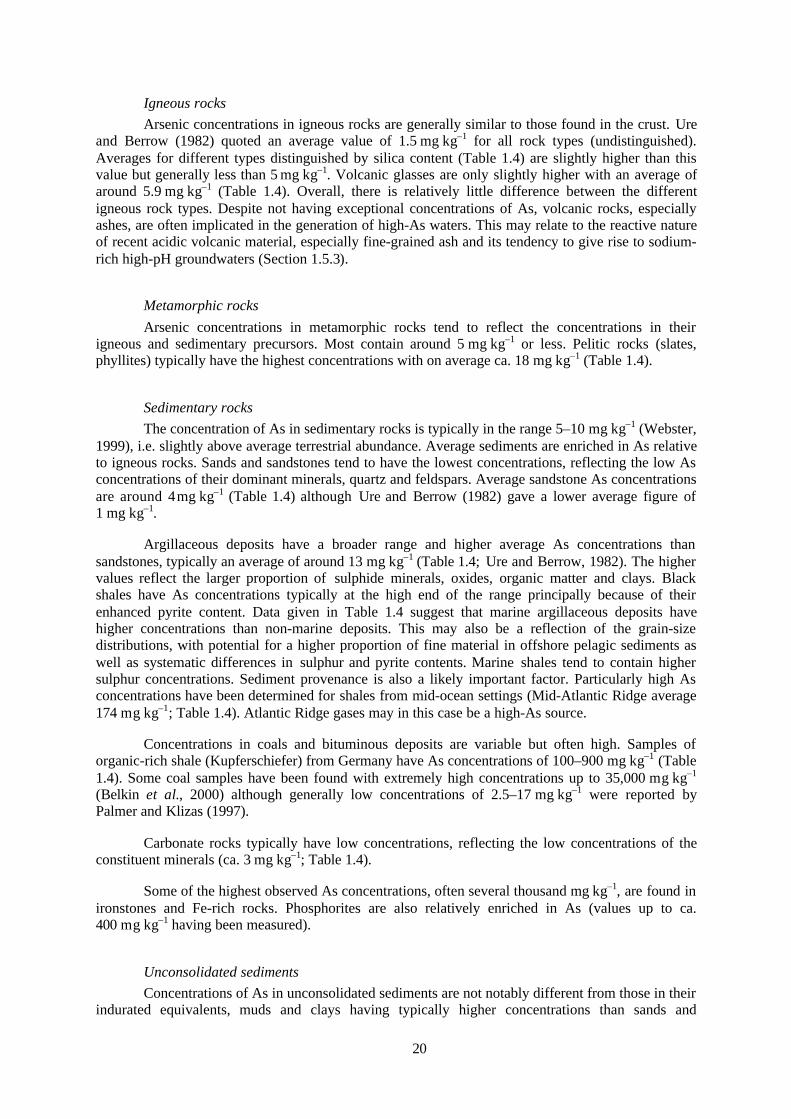
Igneous rocksArsenic concentrations in igneous rocks are generally similar to those found in the crust. Ure
and Berrow (1982) quoted an average value of 1.5 mg kg–1 for all rock types (undistinguished).Averages for different types distinguished by silica content (Table 1.4) are slightly higher than thisvalue but generally less than 5 mg kg–1. Volcanic glasses are only slightly higher with an average ofaround 5.9 mg kg–1 (Table 1.4). Overall, there is relatively little difference between the differentigneous rock types. Despite not having exceptional concentrations of As, volcanic rocks, especiallyashes, are often implicated in the generation of high-As waters. This may relate to the reactive natureof recent acidic volcanic material, especially fine-grained ash and its tendency to give rise to sodium-rich high-pH groundwaters (Section 1.5.3).
Metamorphic rocksArsenic concentrations in metamorphic rocks tend to reflect the concentrations in their
igneous and sedimentary precursors. Most contain around 5 mg kg–1 or less. Pelitic rocks (slates,phyllites) typically have the highest concentrations with on average ca. 18 mg kg–1 (Table 1.4).
Sedimentary rocksThe concentration of As in sedimentary rocks is typically in the range 5–10 mg kg–1 (Webster,
1999), i.e. slightly above average terrestrial abundance. Average sediments are enriched in As relativeto igneous rocks. Sands and sandstones tend to have the lowest concentrations, reflecting the low Asconcentrations of their dominant minerals, quartz and feldspars. Average sandstone As concentrationsare around 4 mg kg–1 (Table 1.4) although Ure and Berrow (1982) gave a lower average figure of1 mg kg–1.
Argillaceous deposits have a broader range and higher average As concentrations thansandstones, typically an average of around 13 mg kg–1 (Table 1.4; Ure and Berrow, 1982). The highervalues reflect the larger proportion of sulphide minerals, oxides, organic matter and clays. Blackshales have As concentrations typically at the high end of the range principally because of theirenhanced pyrite content. Data given in Table 1.4 suggest that marine argillaceous deposits havehigher concentrations than non-marine deposits. This may also be a reflection of the grain-sizedistributions, with potential for a higher proportion of fine material in offshore pelagic sediments aswell as systematic differences in sulphur and pyrite contents. Marine shales tend to contain highersulphur concentrations. Sediment provenance is also a likely important factor. Particularly high Asconcentrations have been determined for shales from mid-ocean settings (Mid-Atlantic Ridge average174 mg kg–1; Table 1.4). Atlantic Ridge gases may in this case be a high-As source.
Concentrations in coals and bituminous deposits are variable but often high. Samples oforganic-rich shale (Kupferschiefer) from Germany have As concentrations of 100–900 mg kg–1 (Table1.4). Some coal samples have been found with extremely high concentrations up to 35,000 mg kg–1
(Belkin et al., 2000) although generally low concentrations of 2.5–17 mg kg–1 were reported byPalmer and Klizas (1997).
Carbonate rocks typically have low concentrations, reflecting the low concentrations of theconstituent minerals (ca. 3 mg kg–1; Table 1.4).
Some of the highest observed As concentrations, often several thousand mg kg–1, are found inironstones and Fe-rich rocks. Phosphorites are also relatively enriched in As (values up to ca.400 mg kg–1 having been measured).
Unconsolidated sedimentsConcentrations of As in unconsolidated sediments are not notably different from those in their
indurated equivalents, muds and clays having typically higher concentrations than sands and
21
carbonates. Values are typically 3–10 mg kg–1, depending on texture and mineralogy (Table 1.4).Elevated concentrations tend to reflect the amounts of pyrite or Fe oxides present. Increases are alsotypically found in mineralised areas. Placer deposits in streams can have very high concentrations as aresult of the abundance of sulphide minerals.
Average As concentrations for stream sediments in England and Wales are in the range 5–8 mg kg–1 (AGRG, 1978). Similar concentrations have also been found in river sediments wheregroundwater-arsenic concentrations are high: Datta and Subramanian (1997) found concentrations insediments from the River Ganges averaging 2.0 mg kg–1 (range 1.2–2.6 mg kg–1), from theBrahmaputra River averaging 2.8 mg kg–1 (range 1.4–5.9 mg kg–1) and from the Meghna Riveraveraging 3.5 mg kg–1 (range 1.3–5.6 mg kg–1).
Cook et al. (1995) found concentrations in lake sediments ranging between 0.9–44 mg kg–1
(median 5.5 mg kg–1) but noted that the highest concentrations were present up to a few kilometresdown-slope of mineralised areas. The upper baseline concentration for these sediments is likely to bearound 13 mg kg–1 (90th percentile). They also found concentrations in glacial till of 1.9–170 mg kg–1
(median 9.2 mg kg–1; Table 1.4) and noted the highest concentrations down-ice of mineralised areas(upper baseline, 90th percentile, 22 mg kg–1).
Relative arsenic enrichments have been observed in reducing sediments in both nearshore andcontinental-shelf deposits (Peterson and Carpenter, 1986; Legeleux et al., 1994). Legeleux et al.(1994) noted concentrations increasing with depth (up to 30 cm) in continental shelf sediments as aresult of the generation of increasingly reducing conditions. Concentrations varied between sites, butgenerally increased with depth in the range 2.3–8.2 mg kg–1 (Table 1.1).
SoilsBaseline concentrations of As in soils are generally of the order of 5–10 mg kg–1. Boyle and
Jonasson (1973) quoted an average baseline concentration in world soils of 7.2 mg kg–1 (Table 1.4)and Shacklette et al. (1974) quoted an average of 7.4 mg kg–1 (901 samples) for American soils. Ureand Berrow (1982) gave a higher average value of 11.3 mg kg–1. Peats and bog soils can have higherconcentrations (average 13 mg kg–1; Table 1.4), principally because of increased prevalence ofsulphide mineral phases under the reduced conditions. Acid sulphate soils which are generated by theoxidation of pyrite in sulphide-rich terrains such as pyrite-rich shales, mineral veins and dewateredmangrove swamps can also be relatively enriched in As. Dudas (1984) found As concentrations up to45 mg kg–1 in the B horizons of acid sulphate soils derived from the weathering of pyrite-rich shalesin Canada. Concentrations in the overlying leached (eluvial, E) horizons were low (1.5–8.0 mg kg–1)as a result of volatilisation or leaching of As to lower levels. Gustafsson and Tin (1994) foundsimilarly elevated concentrations (up to 41 mg kg–1) in acid sulphate soils from the Mekong delta ofVietnam.
Although the dominant source of As in soils is geological, and hence dependent to someextent on the concentration in the parent rock material, additional inputs may be derived locally fromindustrial sources such as smelting and fossil-fuel combustion products and agricultural sources suchas pesticides and phosphate fertilisers. Ure and Berrow (1982) quoted concentrations in the range366–732 mg kg–1 in orchard soils as a result of the historical application of arsenical pesticides to fruitcrops.
Contaminated surficial depositsArsenic concentrations much higher than baseline values have been found in sediments and
soils contaminated by the products of mining activity, including mine tailings and effluent.Concentrations in tailings piles and tailings-contaminated soils can reach up to several thousandmg kg–1 (Table 1.4). The high concentrations reflect not only increased abundance of primary arsenic-rich sulphide minerals, but also secondary iron arsenates and iron oxides formed as reaction products
22
of the original ore minerals. The primary sulphide minerals are susceptible to oxidation in the tailingspile and the secondary minerals have varying solubility in oxidising conditions in groundwaters andsurface waters. Scorodite (FeAsO4.2H2O) is a common sulphide oxidation product and its solubility isconsidered to control arsenic concentrations in such oxidising sulphide environments. Scorodite ismetastable under most groundwater conditions and tends to dissolve incongruently, forming ironoxides and releasing arsenic into solution (Robins, 1987; Kraus and Ettel, 1989). However, inpractice, a wide range of Fe-As solubility relationships are found which in part relate to the mineraltype (Kraus and Ettel, 1989). There is some confusion in the analysis of these solubility relationshipsbetween congruent dissolution, incongruent dissolution and sorption/desorption reactions. Secondaryarsenolite (As2O3) is also relatively soluble. Arsenic bound to iron oxides is relatively immobile,particularly under oxidising conditions.
1.3.3 The atmosphere
The concentrations of arsenic in the atmosphere are usually low but as noted above, areincreased by inputs from smelting and other industrial operations, fossil-fuel combustion and volcanicactivity. Concentrations amounting to around 10–5–10–3 µg m–3 have been recorded in unpollutedareas, increasing to 0.003–0.18 µg m–3 in urban areas and greater than 1 µg m–3 close to industrialplants (PCS/WHO, 2001). Much of the atmospheric arsenic is particulate. Total arsenic depositionrates have been calculated in the range <1–1000 µg m–2 yr–1 depending on the relative proportions ofwet and dry deposition and proximity to contamination sources (Schroeder et al., 1987). Values in therange 38–266 µg m–2 yr–1 (29–55% as dry deposition) were estimated for the mid-Atlantic coast(Scudlark and Church, 1988). Concentrations in atmospheric precipitation are given in Section 1.2.1.
Airborne arsenic is transferred to water bodies by wet or dry deposition and may thereforeincrease the aqueous concentration slightly. However, there is little evidence to suggest thatatmospheric arsenic poses a real health threat for drinking-water sources. Atmospheric arsenic arisingfrom coal burning has been invoked as a major cause of lung cancer in parts of China (GuizhouProvince), but the threat is from direct inhalation of domestic coal-fire smoke and especially fromconsumption of foods dried over coal fires, rather than from drinking water affected by atmosphericinputs (Finkelman et al., 1999).
1.4 Mineral-water interactions
1.4.1 Relevance to arsenic mobilisation
As with most trace metals, the concentration of arsenic in natural waters is probably normallycontrolled by some form of solid-solution interaction. This is most clearly the case for soil solutions,interstitial waters and groundwaters where the solid/solution ratio is large but it is also often true inopen bodies of water (oceans, lakes and reservoirs) where the concentration of solid particles is smallbut still significant. In these open bodies, the particles can be of mineral and biological origin. It islikely that in most soils and aquifers, mineral-As interactions are likely to dominate over organicmatter-As interactions, although organic matter may interact to some extent through its reactions withthe surfaces of minerals.
Knowing the types of interaction involved is important because this will govern the responseof As to changes in water chemistry. It will also determine the modelling approach required formaking predictions about possible future changes and for understanding past changes in arsenicconcentrations (see Box 1.1).
23
Box 1.1. Mineral-water interactions
Mineral-water interactions can be divided into two broad types from a geochemical point of view:precipitation-dissolution reactions and adsorption-desorption reactions. Precipitation-dissolution reactionsinvolve the growth or erosion of a mineral structure and so only involve structural ions, i.e. those elementsincluded in the chemical formula of the mineral. The solubility of minerals can in principle be described quitewell by a solubility product, although this may vary with the particle size and crystallinity of the mineral. Alsothe rate of dissolution or precipitation can be very slow and so thermodynamic equilibrium is often not attainedin practical time-scales.
Adsorption-desorption reactions involve the binding of chemicals to the surface of minerals (or othersolids) and are described by adsorption (or desorption) isotherms. Ion exchange is a special type of surfacereaction in which one ion (e.g. Ca2+) replaces another ion or ions of equivalent charge (e.g. 2 Na+). Anadsorption or exchange isotherm relates the concentration of a chemical in solution to its concentration on asurface. Generally, the greater the concentration of a chemical in solution, the greater its concentration boundto the surface. The actual concentration on the surface depends on the chemical involved and with what else itis competing for space on the surface. There is always a preference for the binding of some ions over othersbut it is normal in nature for a wide variety of ions to be adsorbed at once. This competition for binding sitesmeans that the amount of an ion adsorbed may be quite sensitive to the concentration of other ions present,i.e. the water quality. As a result, there are many complex formulae to describe adsorption-desorption and ionexchange reactions in the natural environment. Being surface reactions, these reactions tend to be rapid,certainly by geological time-scales.
Coprecipitation is also a common natural process whereby minor constituents are incorporated orscavenged into a mineral structure as it forms, e.g. arsenic can be coprecipitated during the formation ofpyrite. Also, both phosphate and arsenic are coprecipitated during the formation of iron oxides. The termcoprecipitation does not imply any particular mechanism and in practice both adsorption and precipitation mayoccur at the same time. The reverse process, which may be called codissolution, is also likely to be importantfor the release of trace metals in the natural environment. Coprecipitation often leads to solid solutions inwhich the mixing of components extends into the bulk mineral structure. Solid solutions are very common innature since mineral precipitation tends to occur from highly ‘impure’ natural waters. Solid solutions occurmost commonly between ions of similar size and character. If the composition of the solution from which thesolid solution is forming changes during formation, then the resulting mineral may be ‘zoned’, i.e. itscomposition may vary from core to rim.
Adsorption reactions (e.g. on iron oxides) tend to apply to a broad range of ions since they are onlybased on the formation of a two-dimensional surface structure. Coprecipitation reactions are more selectiveand precipitation reactions even more so. The relatively unspecific nature of adsorption and coprecipitationreactions means that trace elements in nature are subject to a wide range of interactions that are often difficultto quantify, and therefore to model. This applies to the reactions that affect arsenic.
Precipitation-dissolution and adsorption-desorption reactions are not entirely unrelated processes andin practice, the distinction is not always that clear. For example, arsenic which forms highly insoluble arsenic-sulfide minerals will tend to adsorb strongly to other sulphide minerals such as pyrite (FeS2).
The importance of oxides in controlling the concentration of arsenic in natural waters hasbeen appreciated for a long time (Table 1.5) (Livesey and Huang, 1981; Matisoff et al., 1982; Korte,1991; Korte and Fernando, 1991). Clays can also adsorb As(III) and As(V) (Manning and Goldberg,1997b). Frequently, one of the best correlations between the concentration of As in sediments andother elements is with iron. This is also the basis for the use of iron, aluminum and manganese salts inwater treatment, including for arsenic removal (e.g. Edwards, 1994). The As content of residualsludges can be in the range 1,000–10,000 mg kg–1 (Forstner and Haase, 1998; Driehaus et al., 1998).
24
Table 1.5 Studies of arsenic adsorption by metal oxides
Mineral Comment Reference
Aluminium oxides As(V) and As(III) adsorption on activated alumina: pHdependence, kinetics, column breakthrough. Regeneration bydesorbing with NaOH. Modelling with pH-dependent Langmuirisotherm (for As) and surface complexation model (for protons).
Ghosh and Yuan (1987)
‘Amorphous’aluminium hydroxide
As(V) on precipitated Al(OH)3 (pH 3–10). ‘Adsorption’exceeded 15 mol kg–1 at pH 5. Fitted data to pH dependentLangmuir isotherm.
Anderson et al. (1976)
Hfo Kinetics and pH dependence of As(V) and As(III) adsorption onHfo (202 m2 g–1). Found very high As(V) and As(III) loadings(up to 4–5 mol As kg–1) at the highest concentrations. pHadsorption envelopes at various AsT loadings.
Raven et al. (1998)
Hfo Adsorption isotherms for arsenite and arsenate over freeconcentration range from 10–7M to 10–3M (pH 4–10). Fitted toLangmuir isotherm at low concentrations and linear isotherm athigher concentrations. Dzombak and Morel (1990) fitted thisdata to their diffuse double layer model.
Pierce and Moore (1982)
Hfo Sorption of As(V) and As(III) on Hfo at As concentrations ofenvironmental significance (low micromolar range) and pH 4–9.Compared results with Dzombak and Morel (1990) modelpredictions – generally reasonable agreement. SO4 decreasedadsorption of As(V) and As(III), especially at low pH, while Caincreased As(V) adsorption at high pH. 1 mM bicarbonate didnot affect either As(V) or As(III) adsorption greatly.
Wilkie and Hering (1996)
Hfo A wide angle X-ray scattering (and EXAFS) study of 2-lineferrihydrite coprecipitated with varying amounts of As(V)suggested that the As reduced crystallite size because of theformation of strongly bound inner sphere complex betweenAs(V) and edge sharing Fe(O,OH)6 octahedra. Saturation atAs/Fe mole ratio of 0.68.
Waychunas et al. (1996)
Hfo As(III) and As(V) adsorption and OH– release/uptake onsynthetic two-line ferrihydrite. As(V) at pH 9.2 released up to 1mol OH– per mol As sorbed whereas As(III) released <0.25 molAs per mol Fe. At pH 4.6, OH– release was much less for As(V)adsorption and under these conditions there was a net release ofH+ by arsenite. These differences reflect the mechanism of Asadsorption and influence the pH dependence of adsorption.
Jain et al. (1999)
Granular ‘ferrichydroxide’(akageneite)
As(V) isotherms given in the sub-µM concentration range; SO4competition significant at mM concentrations below pH 7 only;phosphate competition at ‘natural’ groundwater concentrations.
Driehaus et al. (1998)
Goethite An EXAFS and XANES study of As(III) adsorption to asynthetic goethite suggested bidentate inner sphere binding. Oneplot of As(III) and As(V) pH adsorption envelopes. As(III) data
Manning et al. (1998)
25
Mineral Comment Reference
fitted to Constant Capacitance SCM.
Goethite Batch adsorption of As(V) on synthetic goethite. Used Mo blueanalysis for As. Shows pH edge at about pH 9. Data fittedLangmuir isotherm presumably at constant pH (up to 60 mg l–1
As).
Matis et al. (1997)
Goethite Successfully applied the CD-MUSIC surface complexationmodel to literature data for anion adsorption to goethiteincluding As(V)–P competition. The CD-MUSIC is the mostpromising of the SCMs for modelling complex natural systems.
Hiemstra and van Riemsdijk(1999)
Goethite As(V) adsorption on synthetic goethite primarily for a study ofimpact on flocculation and electrokinetics. No isotherms. FinalpH varied but not defined.
Matis et al. (1999)
Hematite Fendorf et al. (1997)
Manganese oxides As(III) & As(V) removal by MnO2(s) is similar, up to say 5mmol As mol–1 Mn at µM As equilibrium solutionconcentrations. Freundlich isotherm obeyed. As(III) oxidised toAs(V). Rapid (minutes) oxidation and adsorption of As(III).Monitored Mn release and effect of pH, Ca, phosphate andsulphate.
Driehaus et al. (1995)
Birnessite,cryptomelane andpyrolusite
Studied adsorption of As(III) and As(V) and kinetics of As(III)oxidation in presence of various MnO2. As(III) adsorption (perunit weight of oxide): cryptomelane>birnessite>pyrolusitewhereas for As(V): Cryptomelane>pyrolusite>birnessite (notdetectable). No isotherms given.
Oscarson et al. (1983)
Goethite, hematiteand lepidocrocite
Batch adsorption of As(V), As(III), MMAA and DMAA onnatural minerals (coarse-grained and very low He-Ar surfacearea). As adsorption: generally goethite > lepidocrocite >>hematite (pH 2–12, maximum often pH 5–8). At pH 7 ongoethite, As(III) > MMAA > DMAA > As(V) (?). FA (up to 50mg l–1) tended to reduce As adsorption. Gives Kd values.
Bowell (1994)
Alumina, hematite,quartz and kaolin
As(V) adsorption on natural, low surface area alumina, hematite,quartz and kaolin (0.12–5 m2 g–1) at pH 3–10. Adsorptiondecreases with pH; alumina = kaolin > hematite >> quartz. GivesKd values and isotherms at low concentrations. Some SO4
2–
competition especially below pH 7. FA (>10 mg l–1) generallyreduced adsorption at pH 5–7 but not above pH 7 where FA isnot adsorbed.
Xu et al. (1988)
Alumina On natural alumina, adsorption was As(V) >As(III) >MMAA =DMAA (pH>6). Maximum adsorption at pH 5 for As(V) and pH7 for As(III). As(V) but not As(III) adsorption decreased rapidlyabove pH 6. Log Kd (l kg–1) at micromolar concentrations (pH7) was 2.5–3.5 for As(V) and about 1.5 for As(III). FAdecreased adsorption.
Xu et al. (1991)
Notes: Hfo= Hydrous ferric oxide or ferrihydrite
26
SCM = Surface Complexation Model
EXAFS = Extended X-ray absorption fine structure
XANES = X-ray absorption near-edge structure
MMAA = monomethylarsonic acid, CH3AsO(OH)2
DMAA = dimethylarsinic acid, (CH3)2AsO(OH))
FA = fulvic acid
CD-MUSIC = Charge Distribution - Multisite Complexation model
It is difficult to study mineral-water interactions directly in aquifers. Most studies, includingthose with a bearing on arsenic in groundwater, have been undertaken either in soils, or in lake orocean sediments and usually from quite shallow depths. There is much to be learnt from the studieswith soils and sediments since the same general principles are expected to apply. One of the mostimportant areas where cross-fertilization of ideas can occur is in understanding the behaviour of ironoxides in reducing soils and sediments and the influence of this on the release of arsenic. Matisoff etal. (1982) related reductive dissolution of iron oxides to the possible release of arsenic in groundwaterfrom an alluvial aquifer in north-east Ohio. Korte (1991) also speculated that desorption of arsenicfrom iron oxides could occur in reducing, alluvial sediments and that this could lead to high-arsenicgroundwaters.
1.4.2 Arsenic interactions in sediments
The major minerals binding arsenic (as both arsenate and arsenite) in sediments are the metaloxides, particularly those of iron, aluminum and manganese. About 50% of the iron in freshwatersediments is in the form of iron oxides and about 20% of the iron is ‘reactive’ iron. Clays also adsorbarsenic because of the oxide-like character of their edges, as do carbonates. Of these components,adsorption by iron oxides is probably most important in sandy aquifers because of their greaterabundance and the strong binding affinity. Nevertheless, if studies of soil phosphate are a guide, thenaluminium oxides can also be expected to play a significant role when present in quantity. Experiencefrom water treatment (Edwards, 1994) suggests that below pH 7.5 aluminium hydroxides are about aseffective as iron hydroxides (on a molar basis) for adsorbing As(V) but that iron salts are moreefficient at higher pH and for adsorbing As(III). Arsenic(V), like phosphate, is expected to be stronglyadsorbed by calcium carbonate minerals and this may limit As concentrations in groundwater fromlimestone aquifers.
The interactions of arsenic with iron oxides have been studied in considerable detail in thelaboratory and therefore provide the best insight into the likely behavior of arsenic-mineralinteractions in aquifers. However, most of these laboratory studies, particularly the older studies, havebeen undertaken at rather high arsenic concentrations and there is a paucity of reliable adsorption dataat the low µg l–1 level of relevance to natural waters. In addition, there is uncertainty over the extent towhich the iron oxides most commonly studied in the laboratory reflect the iron oxides found in thefield.
Field data for As(V) adsorption to natural ‘diagenetic’ Fe oxides (captured in a lake withvertically-installed Teflon sheets) closely paralleled the laboratory data of Pierce and Moore (1982)which was included in the Dzombak and Morel (1990) database (De Vitre et al., 1991). However, itwas considerably greater than that calculated using Hingston’s (1971) data for As(V) adsorption ongoethite highlighting the high affinity of freshly-formed ‘amorphous’ iron oxides for arsenic. Paige etal. (1997) measured the As/Fe ratios during the acid dissolution of a synthetic ferrihydrite containingsorbed As(V) and concluded that the dissolution was incongruent (i.e. iron and arsenic were notreleased in the same proportion as found in the bulk mineral) and that the initial As released wasprobably sorbed on the surface of the very small ferrihydrite particles. The same is likely to happen
27
during reductive dissolution. The adsorbed As also slowed down the acid dissolution of theferrihydrite.
1.4.3 Iron in reduced sediments and aquifers
The processes causing changes in iron redox chemistry need to be understood because theydirectly affect the mobility of arsenic. One of the principal causes of high arsenic concentrations insubsurface waters is the reductive dissolution of hydrous iron oxides and/or the release of adsorbed orcombined arsenic. A sequence of reduction reactions occurs when lakes, fjords, soils, sediments andaquifers become anaerobic (Stumm and Morgan, 1995). This sequence begins with the consumptionof oxygen and an increase in dissolved CO2 from the decomposition of organic matter. Next, NO3
–
decreases by reduction to NO2– and the gases N2O and N2. Insoluble manganic oxides dissolve by
reduction to soluble Mn2+ and hydrous ferric oxides are reduced to Fe2+. These processes are followedby SO4
2– reduction to S2–-, then CH4 production from fermentation and methanogenesis, and finallyreduction of N2 to NH4
+. During sulphate reduction, the consequent sulphide reacts with any availableiron to produce FeS and ultimately pyrite, FeS2. Iron is often more abundant than sulphur so that thereis ‘excess iron’ beyond that which can be converted to pyrite (Widerlund and Ingri, 1995). Arsenic(V)reduction would normally be expected to occur after Fe(III) reduction but before SO4
2–- reduction.
In sulphate-poor environments, iron from free iron oxides is solubilized as Fe2+ underreducing conditions. This gives rise to characteristically high-Fe waters, which in groundwaters tendto range from 0.1–30 mg l–1 Fe. The reaction is microbially mediated (Lovley and Chappelle, 1995).There is also evidence for solid-state transformations of the iron oxides under reducing conditions.This is most obviously reflected in a colour change from reddish/orange/brown/tan colours togrey/green/blue colours. Changes to the magnetic properties have also been documented (Sohlenius,1996). Direct analysis of the Fe(II) and Fe(III) contents of iron oxides from reduced lake waters andsediments often indicates the presence of a mixed Fe(II)-Fe(III) oxide with an approximate averagecharge on the iron of 2.5 (Davison, 1993). The exact fate of iron during reduction is not wellunderstood, in part because it is probably very fine-grained and difficult to observe directly.Mössbauer spectroscopy is a useful technique for identifying the form of iron oxides in sediments,including anoxic sediments (Boughriet et al., 1997; Drodt et al., 1997).
‘Green rusts’ are one possible product of the transformations. These have occasionally beenidentified or suspected in anoxic soils and sediments (Taylor, 1980; Boughriet et al., 1997; Cummingset al., 1999). They consist of a range of green-coloured Fe(II)-Fe(III) hydroxide minerals with alayered structure and a charge-balancing interlayer counterion, usually carbonate or sulphate. Greenrusts were originally referred to as ‘hydrated magnetite’ and given a composition ‘Fe3(OH)8’.Boughriet et al. (1997) suspected the presence of either green-rust-like compounds, Fe(III)-Fe(II)-(CO3)(OH) or Fe(II)xCa1–xCO3 solid solutions, in anoxic sediments from the Seine Estuary. They used57Fe Mössbauer spectroscopy to characterize the iron. Green rusts have also been identified inanaerobic soils and are thought to play an important role in controlling soil solution Fe concentrations(Genin et al., 1998).
Authigenic magnetite (Fe3O4), is another possible product which has been identified inanaerobic sediments (Fredrickson et al., 1998), often with extremely small particle sizes (Maher andTaylor, 1988; Canfield, 1989). Magnetite is frequently found in sediments as a residual detrital phasefrom rock weathering but very fine-grained magnetite is also formed by so-called ‘magnetotactic’bacteria. Magnetite formation has been established under reducing conditions in the laboratory(Guerin and Blakemore, 1992). However, under strongly reducing conditions magnetite is unstableand in the presence of high concentrations of H2S, it slowly converts to pyrite over a period of 100years or more (Canfield and Berner, 1987). At the sediment/water interface in oceans, partialoxidation of primary magnetite (Fe3O4) can lead to a coating of maghemite, ?-Fe2O3. Further burialand reduction leads to the dissolution of the primary magnetite (Torii, 1997).
28
These studies of Fe oxides in reducing environments indicate a lack of an as yet well-definedsequence of events taking place when Fe(III) oxides are subjected to strongly reducing conditions.The changes are evidently substantial and can result in the partial dissolution of the oxides and theirtransformation to completely new mineral phases. It is not yet clear what impact these transformationshave on the adsorbed As load of the original Fe(III) oxides. Suffice it to say that even quite smallchanges in As binding could have a large impact on porewater As concentrations because of the largesolid/solution ratio in sediments. Therefore, it is likely that understanding the changes to the nature ofiron oxide minerals in sedimentary environments is an important aspect in understanding theprocesses leading to As mobilisation in sedimentary environments.
1.4.4 Arsenic release from soils and sediments following reduction
There is considerable evidence from laboratory studies that arsenic is released from soilsfollowing flooding and the development of anaerobic conditions (Deuel and Swoboda, 1972; Hessand Blanchar, 1977; McGeehan and Naylor, 1994; McGeehan, 1996; Reynolds et al., 1999). Similarevidence is available from laboratory and field studies of marine and lake sediments. Numerousstudies have demonstrated the release of both phosphorus (Mortimer, 1942; Farmer et al., 1994;Slomp et al., 1996) and arsenic below the redox boundary in sediments (Moore et al., 1988; De Vitreet al., 1991; Azcue and Nriagu, 1995; Widerlund and Ingri, 1995).
This release has long been associated with iron oxide dissolution. Deuel and Swoboda (1972)found that reducing an untreated black clay soil led to the release of As and that the amount releasedwas related to the total arsenic content of the soil and the redox potential. They proposed that therelease was primarily due to reduction (and dissolution) of ‘ferric arsenates’ rather than to changes inthe As speciation. Arsenic release occurred in less than a week.
De Vitre et al. (1991) showed that there was a rapid increase in pore water As concentrations(up to about 30 µg l–1) with depth in a lake sediment and that this was mirrored by an increase indissolved Fe. Upwardly diffusing Fe2+ was oxidised near the sediment-water interface and precipitatedas an iron oxide which then adsorbed the upwardly diffusing As. Guo et al. (1997) measured the rateof release of As (and other trace elements) as a spiked sediment was progressively reduced. Arsenicwas rapidly released after the Fe and Mn had dissolved suggesting that dissolution rather thandesorption was the dominant process, or at least that dissolution and adsorption occurredsimultaneously. Selective extractions suggested that most of the As in the sediments was associatedwith Fe and Mn oxides. Riedel et al. (1997) monitored the release of metals when a column ofestuarine sediment was subjected to reducing conditions for several months. Both As and Mn werereleased following reduction.
A few studies have attempted to differentiate between the oxidation states of arsenic sorbedby sediments. Masscheleyn et al. (1991) measured the release of As and other metals following theflooding and reduction of an arsenic-contaminated soil and found that the release of some As occurredbefore Fe dissolution but that the amount of As released rapidly increased as the amount of iron-oxidedissolution increased. Both As(V) and As(III) were released. Rochette et al. (1998) demonstrated withXANES spectroscopy that reducing conditions can lead to the conversion of As(V) to As(III) in thesolid phase of arsenic minerals. Preliminary results based on XANES also indicate a change in solid-state speciation of the As in Bangladesh sediments in going from oxidising to reducing conditions(Foster et al., 2000).
The As concentration in sediments is normally too low and/or the particles too small for directinvestigation of solid phase arsenic speciation using techniques such as XAFS and PIXE and soselective dissolution has been most widely used. A number of extraction ‘schemes’ exist whichattempt to allocate elements to particular solid phases.
Gómez-Ariza et al. (1998) developed a method to speciate solid phase arsenic based onselective extraction of sediments with hydroxylamine hydrochloride, an acidic and reducing extractant
29
that is rather selective for extracting manganese oxides but that also extracts small amounts of ironoxides. Hydroxylamine hydrochloride did not reduce the As(V) during the extraction.
Brannon and Patrick (1987) studied the kinetics of As release and speciation (As(V), As(III),organic) from freshwater sediments when incubated under both oxidising and reducing conditions.This included sediments with and without added As(V). Most of the native and added As was foundin the ‘moderately reducible’ (oxalate-extractable) fraction. During incubation, a steady release of Aswas observed over a three-month period, with As(V) occurring under oxidising conditions and As(III)under reducing conditions. There was no concomitant release of Fe (or Al or Mn) indicating thatreductive dissolution of iron oxides was not responsible for the As release. Brannon and Patrick(1987) speculated that a change in the structure of the iron oxides may have been important.McGeehan (1996) was not sure whether the As(V) reduction that occurs in flooded soils occurs in thesoil solution or on the soil particles.
Manning and Goldberg (1997a) measured As(V) and As(III) adsorption by three Californiansoils and found that the soils with the highest citrate-dithionite-bicarbonate extractable Fe and percentclay had the greatest affinity for both As(III) and As(V). As(V) sorbed to a greater extent than As(III)at the micromolar As concentrations used, suggesting that As would be released under reducingconditions when As(V) is reduced to As(III).
Cummings et al. (1999) found that As(V) was released from hydrous ferric oxide (Hfo) underreducing conditions without any pre-reduction of As(V) to As(III). Scorodite, a ferric arsenate mineral(Table 1.2), was also in part transformed to various ferrous arsenates. Therefore, the reduction ofAs(V) to As(III) may follow the initial release of As into solution rather than initiate it.
All of these studies demonstrate the ability of soils and sediments to release As whensubjected to reducing conditions but there is no clear consensus on the precise mechanisms involvedparticularly with respect to the roles played by reductive desorption, reductive dissolution and/ordiagenetic changes to the mineral structure.
None of the extraction schemes is perfect or universally applicable and there is littleconsensus on the best techniques to use. The interpretation is particularly difficult for minor and traceconstituents which may be released by both dissolution and desorption processes. Nonetheless, theseextractants can probe the solid phase in a useful way that reflects to a varying extent the nature of anelement in the solid phase, and therefore its potential behaviour or availability. In particular, suchtechniques are particularly useful for characterising the very fine-grained minerals or organic phasesthat are presently poorly characterised by direct examination but which nevertheless play an importantrole in the behaviour of many trace elements. The usefulness of the various extractants shouldincrease as our quantitative understanding of the dissolution kinetics of typical minerals increases andas the various sorption/desorption reactions involved are quantified. In the meantime, they can serveas a useful guide to the forms of the elements present and to significant variations in such forms, butcare has to be taken in interpreting their results in a quantitative and uncritical way.
1.4.5 Transport of arsenic
The transport of chemicals and adsorption are closely related in that adsorption slows downthe transport of a chemical compared with the water flow (Appelo and Postma, 1992). In the simplestcase of a linear adsorption isotherm, this relationship is straightforward and the partition coefficient,Kd, defines a constant retardation factor. With non-linear adsorption, which is most likely to be thecase for arsenic adsorption, the value of Kd varies with concentration and is related to the slope of theisotherm. Normally, the Kd decreases with increasing concentration, leading to less retardation at highconcentrations and ultimately to self-sharpening and diffuse fronts. For example, the greater the non-linearity, the longer it will take to flush completely all of the arsenic from an aquifer – the last bit isremoved reluctantly because the binding is so strong at low concentrations.
30
Since transport is so closely related to the adsorption isotherms, it follows that arsenate andarsenite should travel through an aquifer with different velocities leading to their increased separationalong a flow path. This was demonstrated by Gulens et al. (1979) using breakthrough experimentswith columns of sand (containing 0.6% Fe and 0.01% Mn) and various groundwaters pumpedcontinuously from piezometers. They studied As(III) and As(V) mobility with groundwaters having arange of Eh and pH values using radioactive 74As (t½=17.7 d) and 76As (t½=26.4 hr) to monitor thebreakthrough of As. They showed that: (i) As(III) moved 5–6 times faster than As(V) under oxidisingconditions (pH 5.7); (ii) with a ‘neutral’ groundwater (pH 6.9), As(V) moved much faster than under(i) but was still slower than As(III); (iii) with reducing groundwater (pH 8.3), both As(III) and‘As(V)’ moved rapidly through the column; (iv) when the amount of As injected was substantiallyreduced, the mobility of the As(III) and As(V) was greatly reduced.
This chromatographic effect may account in part for the highly variable As(III)/As(V) ratiosfound in many reducing aquifers. Such a separation is used to advantage in analytical chemistry tospeciate arsenic with various columns. Chromatographic separation during transport will also tend touncorrelate any correlations found at the source, for example in the As versus Fe relationship, thuscomplicating a simple interpretation of well water analyses.
There have been few studies of the transport of arsenic in aquifers derived from naturalsources. Most studies of arsenic leaching have concerned industrially-contaminated sites. Kuhlmeier(1997a,b) studied the transport of arsenic in highly-contaminated clayey and sandy soils from aroundan old arsenic herbicide plant in Houston, Texas. He used column experiments to estimate ‘apparent’Kd values. These were time- and implicitly concentration-dependent and for the sandy soils rangedfrom 0.26 l kg–1 after one void volume to 3.3 l kg–1 after 6 void volumes. They were not too differentfor the clayey materials. However, the overall As concentrations were very high: the groundwater washeavily contaminated with As (408–464 mg l–1), mostly as MMAA. The sediment contained only afew mg kg–1 of inorganic As. Baes and Sharp (1983) gave Kd values of 1.0–8.3 l kg–1 (median 3.3) forAs(III) binding by soils and 1.9–18.0 l kg–1 (median 6.7) for As(V).
1.5.1 World distribution of groundwater arsenic problems
A number of large aquifers in various parts of the world have been identified with problemsfrom As occurring at concentrations above 50 µg l–1, often significantly so. The most noteworthyoccurrences are in parts of Argentina, Bangladesh, Chile, northern China, Hungary, India (WestBengal), Mexico, Romania, Taiwan (China) and many parts of the USA, particularly the south-west(Figure 1.3). Some of the better documented cases are summarised in Table 1.6. These include naturalsources of contamination as well as mining-related sources. Arsenic associated with geothermalwaters has also been reported in several areas, including hot springs from parts of Argentina, Japan,New Zealand, Chile, Kamchatka, Iceland, France, Dominica and the USA.
PENDING
Figure 1.3 Map of documented world arsenic problems
Localised groundwater arsenic problems are now being reported from an increasing numberof countries and many new cases are likely to be discovered. Until recently, arsenic was nottraditionally on the list of elements routinely tested by water quality testing laboratories and so manyarsenic-rich sources undoubtedly remain to be identified. The intended revision of the drinking waterstandard for arsenic in a number of countries has prompted a reassessment of the situation in manycountries. The recent discovery of arsenic contamination on a large scale in Bangladesh hashighlighted the need for a rapid assessment of the situation in alluvial aquifers worldwide.
As described above, arsenic problems also occur in some areas where sulphide-miningactivity is prevalent, the As being released from sulphide minerals as they are oxidised as a result of
31
mining operations. In mining areas, As problems can be severe with concentrations in affected watersoften being in the milligram-per-litre range. However, unlike As occurrences in major aquifers, theproblems in these areas are typically localised, rather than of widespread occurrence. Mining-relatedAs problems in water have been identified in many parts of the world, including Austria, Ghana,Greece, India (Madhya Pradesh), South Africa, Thailand and the USA (Fig. 1.3).
33
Table 1.6 Summary of documented cases of naturally-occurring As problems in world groundwaters (includes some mining cases)
Country/Region
Area (km2) Populationexposed*
Concentrationranges (µg l–1)
Aquifer type Groundwater conditions Reference
Bangladesh 150,000 ca. 3x10⁷ <0.5 to 2500 Holocene alluvial/ deltaicsediments. Abundance ofsolid organic matter
Strongly reducing, neutral pH, high alkalinity,slow groundwater flow rates
DPHE/BGS/MML (1999)
West Bengal 23,000 6x10⁶ <10 to 3200 As Bangladesh As Bangladesh CGWB (1999); POA(1999)
Inner Mongolia(Huhhot Basin (HB),Bayingao, Hexi, BaMeng, Tumet Plain)
4300 (HB)?30,000 total
?
ca. 105 inHB
<1 to 2400 Holocene alluvial andlacustrine sediments
Strongly reducing conditions, neutral pH, highalkalinity. Deep groundwaters often artesian,some have high concentrations of humic acid
Luo et al. (1997), Zhai etal. (1998), Ma et al.(1999), Sun et al. (1999),Smedley et al. (2000b,2001b)
Xinjiang (TianshanPlain)
38,000 ? (500diagnosed)
40 to 750 Holocene alluvial plain Reducing, deep wells (up to 660 m) are artesian Wang and Huang (1994)
Shanxi Alluvial plain ?Reducing Sun et al. (1999)
Hungary, Romania(Danube Basin)
110,000 29,000 <2 to 176 Quaternary alluvial plain Reducing groundwater, some artesian. Somehigh in humic acid
Varsányi et al. (1991);Gurzau (2000)
Argentina (Chaco-Pampean Plain
106 2x10⁶ <1 to 5300 (7800in someporewaters)
Holocene and earlier loesswith rhyolitic volcanic ash
Oxidising, neutral to high pH, high alkalinity.Groundwaters often saline. As(V), accompaniedby high B, V, Mo, U. Also high Asconcentrations in some river waters
Nicolli et al., 1989; Nicolliand Merino (2001);Smedley et al. (2001a);Sancha and Castro (2000)
Northern Chile(Antofagasta)
125,000 500,000 100 to 1000 ?Quaternary volcanogenicsediment
Generally oxidising. Arid conditions, highsalinity, high B. Also high-As river waters
Cáceres et al. (1992),Karcher et al. (1999);Sancha and Castro (2000)
South-west USA:
Basin & Range,Arizona
200,000
3.5x10⁵ (tot)
up to 1300 Alluvial basins, someevaporites
Oxidising, high pH. As (mainly As(V))correlates positively with Mo, Se, V, F
Smith et al. (1992)
Robertson (1989)
3
34
Country/Region
Area (km2) Populationexposed*
Concentrationranges (µg l–1)
Aquifer type Groundwater conditions Reference
Tulare Basin, SanJoaquin Valley,California
Southern CarsonDesert, Nevada
Salton Sea Basin
5000
1300
<1 to 2600
up to 2600
Holocene and older basin-fill sediments
Holocene mixed aeolian,alluvial, lacustrinesediments, some thinvolcanic ash bands
Internally-drained basin. Mixed redoxconditions. Proportion of As(III) increases withwell depth. High salinity in some shallowgroundwaters. High Se, U, B, Mo
Largely reducing, some high pH. Some withhigh salinity due to evaporation. Associatedhigh U, P, Mn, DOC (Fe to a lesser extent)
Some saline groundwaters, with high U
Fujii and Swain (1995)
Welch and Lico (1998)
Welch and Lico (1998)
Mexico (Lagunera) 32,000 4x10⁵ 8 to 620 Volcanic sediments Oxidising, neutral to high pH, As mainly asAs(V)
Del Razo et al. (1990)
Some problem areas related to mining activity and mineralised areas
up to 1400 Valley-fill deposits River water and groundwater affected by lead-zinc-silver mining
Welch et al. (1988), Mokand Wai (1990)
Lake Oahe, SouthDakota, USA
up to 2000 Lake sediments As in sediment porewaters from gold mining inthe Black Hills
Ficklin and Callender(1989)
Bowen Island, BritishColombia
50 0.5–580 Sulphide mineral veins involcanic country rocks
neutral to high-pH groundwaters (up to 8.9), Ascorrelated with B, F
Boyle et al. (1998)
* Exposed refers to population drinking water with As >50 µg l–1 (drinking-water standard of most countries)
4
35
While natural high-arsenic groundwaters (with arsenic above drinking-water standards) arenot uncommon, they are by no means typical of most aquifers and only exist under specialcircumstances. These relate to both the geochemical environment and to the past and presenthydrogeology. Paradoxically, high-arsenic groundwaters are not necessarily related to areas of higharsenic concentrations in the source rocks.
Distinctive groundwater arsenic problems occur under both reducing and oxidisinggroundwater conditions; also in both ‘wet’ and ‘dry’ environments. Below we discuss thecharacteristics of the arsenic problems worldwide through a series of type examples. These exampleshave been ordered according to the type of environment under which they are developed.
1.5.2 Reducing environments
Bangladesh and India (West Bengal)In terms of the population exposed, As problems in groundwater from the alluvial and deltaic
aquifers of Bangladesh and West Bengal represent the most serious occurrences identified globally.Concentrations in groundwaters from the affected areas have a very large range from <0.5 µg l–1 to ca.3200 µg l–1 (DPHE/BGS/MML, 1999; CGWB, 1999). Resultant health problems were first identifiedin West Bengal in the late 1980s but the first diagnosis in Bangladesh was not made until 1993.Between 30 and 36 million people in Bangladesh are estimated to be exposed to As in drinking waterat concentrations above 50 µg l–1 (BGS and DPHE, 2001) and up to 6 million in West Bengal (Table1.6). Skin disorders including hyper/hypopigmentation changes and keratosis are the most commonexternal manifestations, although skin cancer has also been identified (see Chapter 4). Around 5000patients have been identified with As-related health problems in West Bengal (including skinpigmentation changes) although some estimates put the number of patients with arsenicosis at morethan 200,000 (Smith et al., 2000). The number in Bangladesh is not known but must be many timesgreater than in West Bengal. The instance of internal arsenic-related health problems is not known butcould be appreciable.
36
Box 1.3. The Bangladesh groundwater arsenic problem
The map of Bangladesh shows quite clearly the regional pattern of arsenic contamination of the groundwaterbased on the analysis of water from 3500 wells. The blue and green areas are below the Bangladesh drinking-water standard (50 µg l–1) while the blue areas are below the WHO guideline value (10 µg l–1). The worst-affected area is in southern Bangladesh especially the south-east. Water from the southern-most coastal regionhas low arsenic concentrations because the water is drawn from wells greater than 200 m depth in order toavoid salinity problems in the shallower horizons. Most of the other wells are from a depth of 15–80 m. Whilemany wells in northern Bangladesh have acceptably low arsenic concentrations, there are occasional, highlylocalised ‘hot spots’ as shown by the red dots. The concentration of arsenic in these hot spots can exceed2000 µg l–1.
MAP PENDING
West Bengal and Bangladesh rely heavily on groundwater for public drinking-water supply.Groundwater development has been actively encouraged in the region over the last few decades bygovernment and other agencies as a means of providing an alternative to polluted surface water andthereby reducing the incidence of water-borne diseases. There has also been a rapid increase in thenumber of private tubewells and now the number of private tubewells exceeds the number of publictubewells. In this sense, the increase in use of groundwater has been very successful. Theidentification of chronic health problems related to As was unforeseen and has taken a number ofyears to become apparent.
The affected aquifers are generally shallow (less than 100–150 m deep), of Holocene age andcomprise a mixed sequence of micaceous sands, silts and clays deposited by the Ganges, Brahmaputraand Meghna river systems and their precursors. The sediments are derived from the upland Himalayancatchments and from basement complexes of the northern and western parts of West Bengal. In mostaffected areas, the sediment sequence is capped by a layer of clay or silt (of variable thickness) whicheffectively restricts entry of air to the aquifers. This, together with an abundance of recent solidorganic matter deposited with the sediments, has resulted in the development of highly reducingaquifer conditions which favour the mobilisation of As. The mobilisation has probably occurred by acomplex combination of redox changes brought on by rapid burial of the alluvial and deltaicsediments, including reduction of the solid-phase As to As(III), desorption of As from iron oxides,reductive dissolution of the oxides themselves and likely changes in iron-oxide structure and surfaceproperties following the onset of reducing conditions (BGS and DPHE, 2001). Deep wells, tappingdepths greater than 150–200 m, almost invariably have low arsenic concentrations, less than 5 µg l–1
and usually less than 0.5 µg l–1 (BGS and DPHE, 2001). Also wells from the older Plio-Pleistocenesediments of the Barind and Madhupur Tracts have low arsenic concentrations. It is a fortunate factthat both Calcutta and Dhaka draw their water from older sediments and do not have an arsenicproblem. Dhaka is sited at the southern tip of the Madhupur Tract (BGS and DPHE, 2001).
The characteristic chemical features of the high-arsenic groundwaters are high iron(>0.2 mg l–1), manganese (>0.5 mg l–1), bicarbonate (>500 mg l–1) and often phosphorus (>0.5 mg l–1)concentrations, and low chloride (<60 mg l–1), sulphate (<1 mg l–1), nitrate and fluoride (<1 mg l–1)concentrations, with pH values close to or greater than 7. Measured redox potentials are typically lessthan 100 mV (AIP Steering Committee, 1991; CGWB, 1999; DPHE/BGS/MML, 1999; BGS andDPHE, 2001). However, the correlations between dissolved elements are usually far from perfect andwhere good correlations with arsenic are found, these are only applicable locally and are of limitedvalue for quantitative prediction of arsenic concentrations, even at a village scale. For example, someworkers have found a positive correlation between arsenic and iron in village studies (e.g. Nag et al.,1996), but this is not true of Bangladesh and West Bengal as a whole. One commonly observedrelationship in the groundwaters is a general negative correlation between As and SO4 concentrations(BGS and DPHE, 2001). This association suggests that As mobilisation is effected under the most
37
strongly reducing conditions, coincident with sulphate reduction. Some of the groundwaters ofBangladesh are sufficiently reducing for methane generation to have taken place.
The worst-affected areas of Bangladesh are to the south and east of Dhaka (Fig. 1.3) where insome villages, more than 90% of the wells have arsenic concentrations above 50 µg l–1. Thegroundwaters are predominantly reducing, as evidenced by the major-element chemistry describedabove. Arsenic speciation studies have revealed a large range in the relative proportions of dissolvedarsenate and arsenite (e.g. Das et al., 1995; Acharyya, 1997). The modal proportion of arseniteappears to be between 50% and 60% of the total arsenic (BGS and DPHE, 2001). This may reflectlack of redox equilibrium in the aquifer or a mixed groundwater from a strongly stratified aquifer.
The regional distribution of the high-arsenic waters in West Bengal and Bangladesh is knownto be extremely patchy (AIP Steering Committee, 1991; CSME, 1997; BGS and DHPE, 2001),presumably in part because of great variation in sedimentary characteristics and variations inabstraction depth. Estimates of the proportions of tubewells affected in West Bengal are not well-documented and difficult to assess. However, the indications are that the degree of contamination isnot as severe in West Bengal as in the worst-affected districts of Bangladesh (e.g. Dhar et al. 1997),where in some instances more than 90% of tubewells investigated exceed the Bangladesh and Indiandrinking-water standard for arsenic (50 µg l–1; BGS and DPHE, 2001). Certainly, the overall arealextent of contamination in West Bengal is less than in Bangladesh.
The arsenic-affected groundwaters in the Bengal Basin are associated with sediments havingtotal arsenic concentrations in the range <2–20 mg kg–1, i.e. not exceptional by world-average values.This is not surprising given the scale of the problem. These sediments are derived from the drainagesystems of three major rivers (Ganges, Brahmaputra and Meghna) which are themselves sourced froma wide area of the Himalaya. Therefore, while it could be argued that the source of much of thearsenic in the Bengal Basin sediments is derived from specific mineralised areas in the source region,these are likely to be so widespread as to be academic and of little practical relevance.
Isotopic evidence suggests that some groundwater from the Bengal Basin has had a longresidence time in the aquifers. In Bangladesh, BGS and DPHE (2001) found that tritium, an indicatorof modern groundwater, was usually detectable at a few TU in the shallowest groundwaters butdeeper groundwaters usually had lower concentrations, typically <0.4 TU. Such low concentrationsare indicative of older groundwater, with a large proportion having been recharged prior to the 1960s.Radiocarbon data also suggest the presence of old groundwater at some sites. Groundwater from 10–40 m depth in groundwaters from western Bangladesh was ‘modern’ (83 pmc or greater) indicating anage of the order of decades. Shallow groundwaters from south-central Bangladesh were also modern(78 pmc or greater), although groundwater from 150 m was notably older (51 pmc) with a model ageof about 2000 years. Deep groundwaters analysed from southern Bangladesh were even older with 14Cactivities of 28 pmc or less, suggesting the presence of palaeowaters with ages of 2,000–12,000 years.
The reasons for the distinction between groundwater As concentrations in the shallow anddeep aquifers of the Bengal Basin are not yet well-understood. Differences between the sediments atdepth may occur in terms of absolute As concentrations and in the oxidation states and bindingproperties of the As to the sediments. However, it is also possible that the history of groundwatermovement and aquifer flushing in the Bengal Basin has been important in generating the differencesin dissolved As concentrations between the shallow and deep aquifers. Older, deeper sediments havebeen subject to longer periods of groundwater flow, aided by greater hydraulic heads during thePleistocene period when glacial sea levels around the Bangladesh landmass were up to 130 m lowerthan today (e.g. Umitsu, 1993). Flushing of the deeper older aquifers with groundwater is thereforelikely to have been much more extensive than in the Holocene sediments deposited during the last5000–10000 years. Hence, much of the As in the deep sediments may have previously been flushedaway.
38
Salinity becomes a problem in the near-coastal parts of the aquifers in southern Bangladesh asa result of saline intrusion (BGS and DPHE, 2001). This affects the usability of the shallow aquifer inBangladesh and means that deep wells, often more than 200 m deep, need to be constructed to obtainfresh water. As mentioned above, these almost always have low arsenic concentrations.
Taiwan (China)The south-west coastal zone of Taiwan, China was perhaps the first area to be identified as a
problem area for health effects arising from chronic arsenic exposure. Arsenic problems are alsodocumented in north-eastern parts of the island (Hsu et al., 1997). Awareness of the arsenic problembegan during the 1960s (e.g. Tseng et al., 1968) and arsenic-related health problems have been well-documented by several workers since then (e.g. Chen et al., 1985). Taiwan is the classic area for theidentification of black-foot disease but a number of other typical health problems, including internalcancers, have been described.
Kuo (1968) observed As concentrations in groundwater samples from south-west Taiwanranging between 10 µg l–1 and 1800 µg l–1 (mean 500 µg l–1, n=126) and found that half the samplesanalysed had concentrations between 400 µg l–1 and 700 µg l–1. A large study carried out by theTaiwan Provincial Institute of Environmental Sanitation established that 119 townships in the affectedarea had As concentrations in groundwater of >50 µg l–1 and 58 townships had >350 µg l–1 (Lo et al.,1977). In north-eastern Taiwan, Hsu et al. (1997) found As concentrations in groundwaters in therange <10 to >600 µg l–1 with an average of 135 µg l–1 (377 samples).
In the south-west, the high As concentrations are found in groundwaters from deep artesianwells (mostly 100–280 m) abstracted from sediments which include fine sands, muds and black shale(Tseng et al., 1968). Groundwaters abstracted from the north-east of Taiwan are also artesian, but ofshallower depth (typically in the range 16–40 m; Hsu et al., 1997). In each area, the groundwaters arelikely to be strongly reducing and hence may be analogous to groundwaters in the affected areas ofBangladesh and India (West Bengal). This is supported by the observation that the As is presentlargely as As(III) (Chen et al., 1994). However, both the geochemistry of the groundwaters and themineral sources in Taiwan are poorly defined at present. Groundwater from shallow open dug wells inthe area have low arsenic concentrations (Guo et al., 1994).
Northern ChinaArsenic has been found at high concentrations (in excess of the Chinese national standard of
50 µg l–1) in groundwaters from Inner Mongolia as well as Xinjiang and Shanxi Provinces (Fig. 1.2;Wang, 1984; Wang and Huang, 1994; Niu et al., 1997; Smedley et al., 2001). The first cases of Aspoisoning were recognised in Xinjiang Province in the early 1980s. Wang (1984) found Asconcentrations in groundwaters from the province at up to 1200 µg l–1. Wang and Huang (1994)reported As concentrations of between 40 µg l–1 and 750 µg l–1 in deep artesian groundwater from theDzungaria Basin on the north side of the Tianshan Mountains (from Aibi Lake in the west to MamasRiver in the east, a stretch of ca. 250 km). Arsenic concentrations in artesian groundwater from deepboreholes (up to 660 m) were found to increase with depth. Shallow (non-artesian) groundwaters hadobserved As concentrations between <10 µg l–1 and 68 µg l–1. The concentration of As in the salineAibi Lake was reported as 175 µg l–1, while local rivers had concentrations of between 10 µg l–1 and30 µg l–1. Artesian groundwater has been used for drinking in the region since the 1960s and chronichealth problems have been identified as a result (Wang and Huang, 1994).
39
Box 1.4: Arsenic in groundwater of the Huhhot Basin, Inner Mongolia, China
High arsenic concentrations in groundwaters and associated health problems have been identified inseveral parts of northern China, especially Inner Mongolia (e.g. Ba Meng, Tumet Plain, Huhhot Basin,Baiyingao), Xinjiang and Shanxi Provinces.
One of the worst-affected areas is the Huhhot Basin. Huhhot, the capital city of Inner Mongolia, lieswithin an alluvial basin bounded by mountains to the north, east and south. The alluvial sediments are ofHolocene age and are composed of a mixed sequence of sands, silts and clays derived from a former lake andmarginal alluvial fan deposits eroded from the surrounding mountains. Groundwater is important in the ruralareas of the basin, both for irrigation and domestic supply and has been abstracted from dug wells since the1930s. Today, groundwater is abstracted from tubewells using both motorised pumps and hand pumps.
The groundwater is derived from varying depths but mostly from a shallow (less than around 50 m)aquifer and a deeper aquifer (100–400 m). Both aquifers are in parts contaminated with arsenic. The observedrange of total arsenic concentrations in groundwater varies from <1 µg l-1 to 1400 µg l-1. The arsenic-richgroundwaters are highly reducing with low nitrate and high ammonium concentrations. Concentrations ofarsenic are highest in the low-lying part of the basin where conditions are most reducing and groundwater flowis most sluggish. Like Bangladesh, the arsenic is present in both oxidised (arsenate) and reduced (arsenite)forms, although arsenite is dominant. The deep groundwaters often also have high concentrations of dissolvedhumic materials and can contain high concentrations of fluoride (up to 7 mg l-1) though this is not correlatedwith arsenic. In a study by Smedley et al. (2001), about 40% of the wells sampled had arsenic concentrationsexceeding the WHO guideline value of 10 µg l-1. Many of the people in the region drinking high-arsenicgroundwater have visible skin lesions. Currently, about 200 cases of arsenic-related disease have beenidentified in the basin including various cancers, lung cancer being the most common.
Figures: Map of Huhhot Basin with As concentrations; location map of China
PENDING
In Inner Mongolia, concentrations of As in excess of the Chinese national standard (50 µg l–1)have been identified in groundwaters from aquifers in the Huhhot Basin, Ba Meng Region, and TumetPlain (e.g. Luo et al., 1997; Ma et al., 1999). These areas include the cities of Boutou and Togto. Inthe Huhhot Basin, the problem is found in groundwaters from Holocene alluvial and lacustrineaquifers under highly reducing conditions and is worst in the lowest-lying parts of the basin (Smedleyet al., 2001b). Concentrations have been found in the groundwaters at up to 1500 µg l–1, with asignificant proportion of the As being present as As(III). Some shallow dug wells also havegroundwater with relatively high As concentrations (up to 556 µg l–1; Smedley et al., 2001b). Shallowgroundwaters in parts of the region are saline as a result of evaporative concentration exacerbated byirrigation and many have high fluoride concentrations, although the F does not generally correlatewith As. In the affected region, As-related disease has been identified by Luo et al. (1997).Recognised health effects include lung, skin and bladder cancer as well as prevalent keratosis andskin-pigmentation problems.
VietnamThe aquifers of the large deltas of the Mekong and Red Rivers are now widely exploited for
drinking water. The total number of tubewells in Vietnam is unknown but could be on the order ofone million, with perhaps 150,000 in the Red River delta region. The majority of these are privatetubewells. The capital city, Hanoi, is now largely dependent on groundwater for its public watersupply. The aquifers exploited are of both Holocene and Pleistocene age.
In the Red River delta region, the Holocene sediments form the shallowest aquifer but thesemay be only 10–15 m deep and in some cases are entirely absent. Older Pleistocene sediments are
40
then exposed at the surface. Unlike Bangladesh, even when the Holocene sediments are present, thereis not always a layer of fine silt-clay at the surface. Normally the Holocene sediments are separatedfrom the underlying Pleistocene sediments by a clay layer several metres thick, although ‘windows’ inthis clay layer exist where there is hydraulic continuity between the Holocene and Pleistoceneaquifers. The total thickness of sediments is typically 100–200 m.
The groundwaters in the delta regions are usually strongly reducing with high concentrationsof iron, manganese and ammonium. Much of the shallow aquifer in the Vietnamese part of theMekong delta region is affected by salinity and cannot be used for drinking water.
Little was known about the arsenic concentrations in groundwater in Vietnam until recently.UNICEF and EAWAG/CEC (Hanoi National University) are now carrying out extensiveinvestigations to assess the scale of the problem. Preliminary results from Hanoi (Berg et al., 2000;Wegelin et al., 2000) indicate that there is a significant arsenic problem in shallow tubewells in thecity, particularly in the south. There appears to be a seasonal pattern with significantly higherconcentrations in the rainy season. This could be related to the local hydrology since there aresignificant interactions between the aquifer and the adjacent Red River.
Little is known about the arsenic concentrations in groundwater from the middle and upperparts of the Mekong delta (and into adjacent Cambodia and Laos) and other smaller alluvial aquifersin Vietnam but investigations are presently taking place.
HungaryConcentrations of As above 50 µg l–1 have been identified in groundwaters from alluvial
sediments associated with the River Danube in the southern part of the Great Hungarian Plain(Fig. 1.2). Concentrations up to 150 µg l–1 (average 32 µg l–1, 85 samples) have been found byVarsányi et al. (1991). The Plain, some 110,000 km2 in area, consists of a thick sequence of subsidingQuaternary sediments. Groundwaters vary from Ca-Mg-HCO3-type in the recharge areas of the basinmargins to Na-HCO3-type in the low-lying discharge regions. Groundwaters in deep parts of the basin(80–560 m depth) with high As concentrations are reducing with high concentrations of Fe and NH4
and many have reported high concentrations of humic acid (up to 20 mg l–1; Varsányi et al., 1991).The groundwaters have highest As concentrations in the lowest parts of the basin, where the sedimentis fine-grained.
1.5.3 Arid oxidising environments
MexicoThe Lagunera Region of north central Mexico has a well-documented arsenic problem in
groundwater with significant resulting chronic health problems. The region is arid and groundwater isan important resource for potable supply. Groundwaters from the region are predominantly oxidisingwith neutral to high pH. Del Razo et al. (1990) quoted pH values for groundwaters in the range 6.3 to8.9. They found As concentrations in the range 8 µg l–1 to 624 µg l–1 (average 100 µg l–1, n=128), withhalf the samples having concentrations greater than 50 µg l–1. They also noted that most (>90%) of thegroundwater samples investigated had As present predominantly as As(V). Del Razo et al. (1994)determined the average concentration of As in drinking water from Santa Ana town in the region as404 µg l–1. The estimated population exposed to As in drinking water with >50 µg l–1 is around400,000 in Lagunera Region (Del Razo et al., 1990). Groundwaters from the region also have highconcentrations of fluoride (up to 3.7 mg l–1; Cebrián et al., 1994).
High As concentrations have also been identified in groundwaters from the state of Sonora innorth-west Mexico. Wyatt et al. (1998) found concentrations in the range 2–305 µg l–1 (76 samples)with highest concentrations in groundwaters from the towns of Hermosillo, Etchojoa, Magdalena andCaborca. The As concentrations were also positively correlated with fluoride. Highest observed F
41
concentration in the area was 7.4 mg l–1. It is also believed that high arsenic groundwaters have beenfound in other parts of northern Mexico.
ChileHealth problems related to As in drinking water were first recognised in northern Chile in
1962. Typical symptoms included skin-pigmentation changes, keratosis, squamous-cell carcinoma(skin cancer), cardiovascular problems and respiratory disease (Zaldivar, 1974). More recently, Asingestion has been linked to lung and bladder cancer. It has been estimated that around 7% of alldeaths occurring in Antofagasta between 1989 and 1993 were due to past exposure to As in drinkingwater at concentrations of the order of 500 µg l–1 (Smith et al., 1998). Since exposure was chiefly inthe period 1955–1970, this pointed to a long latency period of cancer mortality. Other reportedsymptoms include impaired resistance to viral infection and lip herpes (Karcher et al., 1999).
High As concentrations have been recorded in surface waters and groundwaters fromAdministrative Region II (incorporating the cities of Antofagasta, Calama and Tocopilla) of northernChile (Cáceres et al., 1992). The region is arid (Atacama Desert) and water resources are limited.High As concentrations are accompanied by high salinity (due to evaporation) and high Bconcentrations. Arsenic concentrations below 100 µg l–1 in surface waters and groundwaters areapparently quite rare, and concentrations up to 21,000 µg l–1 have been found. Karcher et al. (1999)quoted ranges of 100 µg l–1 to 1000 µg l–1 in raw waters (average 440 µg l–1). The affected waters ofChile are taken to be predominantly oxidising (with dissolved oxygen present), largely because the Asis reported to be present in the waters as arsenate (Thornton and Farago, 1997 and references citedtherein). However, the geochemistry of the aquifers of Chile is as yet poorly understood. The aquifersare composed of volcanogenic sediments, but these have not been characterised in detail. InAntofagasta, concentrations of As in the sediments are ca. 3.2 mg kg–1 (Cáceres et al., 1992).Additional As exposure from smelting of copper ore has also been noted in northern Chile (Cáceres etal., 1992) and geothermal sources are also recognised (Section 1.5.5).
Arsenic treatment plants were installed in the towns of Antofagasta and Calama in 1969 tomitigate the problems. Today, the urban populations of the major towns are supplied with treatedwater from the Rivers Toconce and Loa (Karcher et al., 1999) which is transported from the foot ofthe Andes mountains to the treatment works. However, rural communities still largely rely onuntreated water supplies which contain As.
ArgentinaThe Chaco-Pampean Plain of central Argentina constitutes perhaps one of the largest regions
of high-arsenic groundwaters known, covering around 1 million km2. High concentrations of arsenichave been documented from Córdoba, La Pampa, Santa Fe and Buenos Aires Provinces in particular(Box 1.5). Symptoms typical of chronic arsenic poisoning, including skin lesions and some internalcancers, have been recorded in these areas (e.g. Hopenhayn-Rich et al., 1996). The climate istemperate with increasing aridity towards the west. Groundwaters are derived from Quaternarydeposits of loess (mainly silt) with intermixed rhyolitic or dacitic volcanic ash (Nicolli et al., 1989;Nicolli and Merino, 1997; Smedley et al., 1998). The sediments display abundant evidence of post-depositional diagenetic changes under semi-arid conditions, with common occurrences of calcrete inthe form of cements, nodules and discrete layers, sometimes many centimetres thick.
42
Box 1.5. Arsenic in La Pampa, Argentina
The population of La Pampa Province in central Argentina relies heavily upon groundwater for drinkingand agricultural production. Water-quality problems from high arsenic concentrations are common.Concentrations in groundwater from wells and boreholes (having depths in the range 6–140 m) have beenfound by Smedley et al. (1998) ranging between <4 and 5300 µg l-1. The concentrations are log-normallydistributed, with a median of 145 µg l-1. The spatial variability of arsenic concentrations is large and there is nodistinct regional trend in the distribution of high-arsenic groundwaters. Of the groundwaters sampled, 95%were found to exceed the WHO guideline value for arsenic in drinking water. The high concentrations havebeen linked with development of skin lesions and internal cancers.
Arsenic is not the only element of health concern: high salinity, as well as fluoride (0.03–29 mg l-1)and many other trace elements (uranium, boron, vanadium, molybdenum and nitrate) also occur in many ofthe groundwaters. Dental fluorosis from chronic exposure to fluoride is common but the health effects of othertrace elements present in the drinking water are unknown.
Groundwaters from La Pampa are oxidising with typically high dissolved-oxygen concentrations andlow concentrations of dissolved iron and manganese. Groundwater pHs are neutral to alkaline (up to 8.7).Groundwater arsenic is dominated by As(V), As(III) rarely exceeds 5% of the total present. Total arseniccorrelates positively with pH, alkalinity (HCO3) and with fluoride and vanadium and weaker positive correlationsare also observed between arsenic and beryllium as well as boron. These occur in solution as anion (fluoride)and oxyanion (arsenate, vanadate, borate and molybdate) species. High salinity is caused by groundwaterevaporation under arid conditions; high pH and alkalinity derive by extensive silicate and carbonate weatheringreactions. These characteristics are particularly pronounced in low-lying depressions which act as localgroundwater-discharge areas (ponding) during rainy periods and sites of evaporation during dry periods.
Concentrations of arsenic in the aquifer sediments are similar to average values for silty and sandysediments. Measured total concentrations range between 3 mg kg-1 and 18 mg kg-1, with finer-grainedsediments being at the higher end of the range. Arsenic bound to amorphous oxides (iron, manganese,aluminum) ranges between 0.5 mg kg-1 and 9.6 mg kg-1 (mean 2 mg kg-1) and represents around 10–50% ofthe total present. Of this fraction, roughly half (0.02 mg kg-1 to 4.7 mg kg-1, mean 1.0 mg kg-1) appears to beassociated with the manganese oxides. This suggests that much of the arsenic present in the sediments isrelatively labile. Much of the remaining arsenic appears to be bound to more crystalline iron-oxide minerals.Mobilisation of arsenic together with the other anionic and oxyanion species can be achieved readily bydesorption from iron, manganese and possibly aluminium oxides in the sediments under the ambient conditionsof high pH and alkalinity. The aquifer is also composed of young Quaternary loess sediments (silts and finesands) with low regional hydraulic gradients and presumed slow groundwater-flow rates. Aquifer flushing rates,and rates of removal of problem elements, are therefore thought to be have been low.
Figures: map of La Pampa, location map of Argentina and histogram.
Arsenic (µg l-1)
10 20 30 40 50 100
200
300
400
500
1000
2000
3000
4000
5000
Fre
quen
cy
0
5
10
15
20
25WHO guideline value forarsenic in drinking water
10 :g l-1
MAP PENDING
Nicolli et al. (1989) found arsenic concentrations in groundwaters from Córdoba in the range6–11500 µg l–1 (median 255 µg l–1). Nicolli and Merino (2001) in a study of the Carcarañá RiverBasin (Córdoba and Santa Fe Provinces) found concentrations in the range <10–720 µg l–1 (mean
43
201 µg l–1) and Smedley et al. (1998) found concentrations for groundwaters in La Pampa Province inthe range <4–5280 µg l–1 (median 145 µg l–1). The groundwaters often have high salinity and thearsenic concentrations are generally well-correlated with other anion and oxyanion elements (F, V,HCO3, B, Mo). They are also predominantly oxidising with low dissolved Fe and Mn concentrationsand under the pertaining arid conditions, with pronounced silicate and carbonate weathering reactions,often have high pH values (range typically 7.0–8.7). Arsenic is dominantly present as As(V) (Smedleyet al., 1998). Metal oxides in the sediments (especially Fe and Mn oxides and hydroxides) are thoughtto be the main source of dissolved arsenic, caused by desorption under high-pH conditions (Smedleyet al., 1998) although the direct dissolution of volcanic glass has also been cited as a potential source(Nicolli et al., 1989; Nicolli and Merino, 2001).
1.5.4 Mixed oxidising and reducing environments
South-western USAMany areas have been identified in the USA with arsenic problems in groundwater. Most of
the worst-affected and best-documented cases occur in the south-western states (Nevada, California,Arizona). However, within the last decade, aquifers in Maine, Michigan, Minnesota, South Dakota,Oklahoma and Wisconsin have been found with concentrations of arsenic exceeding 10 µg l–1 andsmaller areas of high arsenic groundwaters have been found in many other States. Much wateranalysis and research has been carried out in the USA, particularly in view of the long-plannedreduction in the US-EPA drinking-water limit and public concern over the possible long-term healtheffects. Occurrences in groundwater are therefore noted to be widespread, although of those reported,relatively few have significant numbers of sources with concentrations greater than 50 µg l–1. A recentreview of the analyses of some 17,000 water analyses from the USA suggested that around 40%exceeded 1 µg l–1 and about 5% exceeded 20 µg l–1 (percentage above 50 µg l–1 unknown; Welch etal., 1999). The As is thought to be derived from various sources, including naturaldissolution/desorption reactions, geothermal water and mining activity. The natural occurrences ofarsenic in groundwater occur under both reducing and oxidising conditions in different areas.Concentration by evaporation is thought to be an important process in the more arid areas.
In Nevada, at least 1000 private wells have been found to contain As concentrations in excessof 50 µg l–1 (Fontaine, 1994). The city of Fallon, Nevada (population 8000) is served by agroundwater supply with an As concentration of 100 µg l–1 which for many years has been suppliedwithout treatment other than chlorination. Welch and Lico (1998) reported high As concentrations,often exceeding 100 µg l–1 but with extremes up to 2600 µg l–1, in shallow groundwaters from thesouthern Carson Desert. These are largely present under reducing conditions, having low dissolved-oxygen concentrations and high concentrations of dissolved organic C, Mn and Fe. The groundwatersalso have associated high pH (>8) and high concentrations of P (locally >4 mg l–1) and U (>100 µg l–1;Welch and Lico, 1998). The high As and U concentrations were thought to be due to evaporativeconcentration of groundwater, combined with the influence of redox and desorption processesinvolving metal oxides.
In groundwaters from the Tulare Basin of the San Joaquin Valley, California, a large range ofgroundwater As concentrations from <1 µg l–1 to 2600 µg l–1 have been found (Fujii and Swain,1995). Redox conditions in the aquifers appear to be highly variable and high As concentrations arefound in both oxidising and reducing conditions. The proportion of As present as As(III) increases inthe groundwaters with increasing well depth. The groundwaters from the Basin are often stronglyaffected by evaporative concentration with resulting high TDS values. Many also have highconcentrations of Se (up to 1000 µg l–1), U (up to 5400 µg l–1), B ( up to 73,000 µg l–1) and Mo (up to15,000 µg l–1; Fujii and Swain, 1995).
Robertson (1989) also noted the occurrence of high As concentrations in groundwaters underoxidising conditions in alluvial aquifers in the Basin and Range Province in Arizona. Dissolvedoxygen values of the groundwaters were found to be in the range 3–7 mg l–1. Arsenic in the
44
groundwater was found from a limited number of samples to be present predominantly as As(V). Thedissolved As correlated well with Mo, Se, V, F and pH, the latter being in the range 6.9–9.3. Of the467 samples analysed, 7% had As concentrations greater than 50 µg l–1. Arsenic concentrations in thesediments ranged between 2–88 mg kg–1. Oxidising conditions (with dissolved oxygen present) werefound to persist in the aquifers down to significant depths (600 m) despite significant groundwater age(up to 10,000 years old). The high arsenic (and other oxyanion) concentrations are a feature of theclosed basins of the province.
1.5.5 Geothermal sources
Arsenic associated with geothermal waters has been reported in several areas, including hotsprings from parts of the USA, Japan, New Zealand, Iceland, Kamchatka, France and Dominica (e.g.White et al., 1963; Welch et al., 1988; Criaud and Fouillac, 1989). Parts of Salta and Jujuy Provincesin north-west Argentina also have thermal springs with high As concentrations.
In the USA, occurrences of As linked to geothermal sources have been summarised by Welchet al. (1988). Reported occurrences include Honey Lake Basin, California (As up to 2600 µg l–1),Coso Hot Springs, California (up to 7500 µg l–1), Imperial Valley, California (up to 15,000 µg l–1),Long Valley, California (up to 2500 µg l–1) and Steamboat Springs, Nevada (up to 2700 µg l–1).Geothermal waters in Yellowstone National Park also contain high concentrations of As (<1–7800 µg l–1 in geysers and hot springs; Thompson and Demonge, 1996; values up to 2830 µg l–1
reported by Ball et al., 1998). As noted in Section 1.2.1, these have given rise to high concentrations(up to 370 µg l–1) in waters of the Madison River (Nimick et al., 1998). Geothermal waters at LassenPark, California have arsenic concentrations ranging up to 27,000 µg l–1 (Thompson et al., 1985). Anarsenic concentration of 3800 µg l–1 has also been reported for Geyser Bight, Umnak Island, Alaska(White et al., 1963). Geothermal inputs from Long Valley, California are believed to be responsiblefor relatively high concentrations (20 µg l–1) of As in the Los Angeles Aqueduct which provides thewater supply for the city of Los Angeles (Wilkie and Hering, 1998). Geothermal inputs alsocontribute significantly to the high dissolved As concentrations (up to 20 mg l–1) in Mono Lake,California (Section 1.2.2; Maest et al., 1992).
Welch et al. (1988) noted a general relationship between As and salinity in geothermal watersfrom the USA. Despite a lack of good positive correlation between As and Cl, geothermal waters withAs greater than ca. 1000 µg l–1 generally had Cl concentrations of 800 mg l–1 or more. Wilkie andHering (1998) noted the high alkalinity and pH values (average pH 8.3) as well as high Cl and Bconcentrations of As-rich geothermal waters in Long Valley.
Of 26 geothermal water samples analysed from five geothermal fields in Kyushu, Japan, Asconcentrations have been reported in the range 500–4600 µg l–1. The waters are typically of Na-Cltype and the As is present in all but one sample overwhelmingly as As(III) (Yokoyama et al., 1993).
Increased As concentrations have been documented in waters from the geothermal areas ofNew Zealand. Robinson et al. (1995) found an As concentration in groundwater from the Wairakeigeothermal field of 3800 µg l–1 and found river and lake waters receiving inputs of geothermal waterfrom the Wairakei, Broadlands, Orakei Korako and Atiamuri geothermal fields to have concentrationsup to 121 µg l–1, although concentrations diminished significantly downstream away from thegeothermal input areas.
High arsenic concentrations have also been found in geothermal waters from the El Tatiosystem in the Antofagasta region of Chile. The geothermal area lies in a basin (altitude 4250 m)between the volcanoes of the Andes and the Serrania de Tucle. The geothermal waters are highlysaline (sodium-chloride solutions with sodium concentrations in the range 2000–5000 mg l–1). Arsenicconcentrations of the waters are reported to be in the range 45,000–50,000 µg l–1 (Ellis and Mahon,1977).
45
White et al. (1963) also reported arsenic concentrations in the range 50–120 µg l–1 for thermalwaters from Iceland and in the range 100–5900 µg l–1 for thermal waters from Kamchatka.
1.5.6 Sulphide mineralisation and mining-related arsenic problems
ThailandProbably the worst recorded case of As poisoning related to mining activity is that of Ron
Phibun District in Nakhon Si Thammarat Province of southern Thailand. Health problems were firstrecognised in the area in 1987. Around 1000 people have been diagnosed with As-related skindisorders, particularly in and close to Ron Phibun town (Williams, 1997; Choprapawon and Rodcline,1997). The affected area lies within the South-East Asian Tin Belt. Arsenic concentrations have beenfound at up to 5000 µg l–1 in shallow groundwaters from Quaternary alluvial sediment that has beenextensively dredged during tin-mining operations. Deeper groundwaters from older limestone aquifershave been found to be less contaminated (Williams et al., 1996) although a few high Asconcentrations occur, presumably also as a result of contamination from the mine workings. Themobilisation of As is believed to be caused by oxidation of arsenopyrite, exacerbated by the formertin-mining activities. The recent appearance in groundwater has occurred during post-mininggroundwater rebound (Williams, 1997).
GhanaSeveral workers have reported the effects of mining activity on the environment in Ghana.
Ghana is an important gold-mining country and mining has been active since the late 19th century.Today, Ghana produces about one third of the world’s gold. The most important mining area is theAshanti Region of central Ghana. As with Ron Phibun District in Thailand, the gold is associated withsulphide mineralisation, particularly arsenopyrite. Arsenic mobilises in the local environment as aresult of arsenopyrite oxidation, induced (or exacerbated) by the mining activity. Around the town ofObuasi, high As concentrations have been noted in soils close to the mines and treatment works(Amasa, 1975; Bowell, 1992; 1993). Some high concentrations have also been reported in river watersclose to the mining activity (Smedley et al., 1996).
Despite the presence of high As concentrations in the contaminated soils and in bedrocksclose to the mines, Smedley et al. (1996) found that many of the groundwaters of the Obuasi area hadlow As concentrations, with a median concentration in tubewell waters of just 2 µg l–1. Some highconcentrations were observed (up to 64 µg l–1) but these were not generally in the vicinity of themines or related directly to mining activity. Rather, the higher concentrations were found to be presentin relatively reducing groundwaters (Eh 220–250 mV). Oxidising groundwaters, especially fromshallow hand-dug wells, had low As concentrations. This was taken to be due retardation of As byadsorption onto hydrous ferric oxides under the ambient low pH condition of the groundwaters(median pH 5.4 in dug wells; 5.8 in tubewells; Smedley et al., 1996).
United StatesArsenic contamination from mining activities has been identified in numerous areas of the
USA, many of which have been summarised by Welch et al. (1988; 1999). Groundwater from someareas has been reported to have very high As concentrations locally (up to 48,000 µg l–1). Well-documented cases of As contamination include the Fairbanks gold-mining district of Alaska (Wilsonand Hawkins, 1978; Welch et al., 1988), the Coeur d’Alene Pb-Zn-Ag mining area of Idaho, (Mokand Wai, 1990), Leviathan Mine, California (Webster et al., 1994), Kelly Creek Valley, Nevada(Grimes et al., 1995), Clark Fork river, Montana (Welch et al., 2000) and Lake Oahe in South Dakota(Ficklin and Callender, 1989). Some mining areas of the USA have significant problems with acidmine drainage resulting from extensive oxidation of iron oxides. In these, pH values can be extremelylow and iron oxides dissolve and release bound arsenic. Iron Mountain has some extremely acidic
46
mine-drainage waters with negative pH values and As concentrations in the milligram-per-litre range(Nordstrom et al., 2000; Section 1.2.1).
In Wisconsin, As and other trace-element problems in groundwater have arisen as a result ofthe oxidation of sulphide minerals (pyrite and marcasite) present as a discrete secondary cementhorizon in the regional Ordovician sandstone aquifer. Concentrations of As up to 12,000 µg l–1 havebeen reported in the well waters (Schreiber et al., 2000). The oxidation appears to have beenpromoted by groundwater abstraction which has led to the lowering of the piezometric surface at arate of around 0.6 m year–1 since the 1950s with partial dewatering of the aquifer. The high Asconcentrations are observed where the piezometric surface intersects, or lies close to, the sulphidecement horizon (Schreiber et al., 2000).
Other areasMany other areas have increased concentrations of As in soils, sediments and waters as a
result of mining activity. Documented cases include the Lavrion region of Greece, associated withlead- and silver-mining activity (Komnitsas et al., 1995), the Zimapán Valley of Mexico, parts ofsouth-west England (Thornton and Farago, 1997), South Africa, Zimbabwe and Bowen Island, BritishColumbia (Boyle et al., 1998). Although severe contamination of the environment has often beendocumented in these areas, the impact on groundwaters used for potable supply is usually minor.
1.6 Common features of groundwater arsenic problem areas
1.6.1 A hydrogeochemical perspective
Historically, as new sources of high arsenic groundwaters have been found, treatment plantshave been built and the problem has receded from public attention. With the exception of a number ofrecent studies in the USA, there have been few detailed hydrogeochemical and hydrogeologicalstudies of the arsenic-affected areas. Therefore much remains uncertain about the detailedmechanisms by which high-arsenic groundwaters have formed.
However, as described above, sufficient is already known that it is useful to attempt to bringtogether the common features and to speculate about the critical factors that could lead to high-Asgroundwaters. This will help to focus future scientific studies and should provide some guidance tothose water undertakers who have to undertake a rapid assessment of their supplies for arsenic. It ishelpful to consider the formation of high-arsenic groundwaters in terms of the three major factorsinvolved, namely, the source of the arsenic, its mobilisation, and its subsequent transport (or lack ofit).
1.6.2 The source of arsenic
In the cases where affected groundwaters are found close to obvious geological or industrialsources rich in arsenic (geothermal springs, drainage from mineralised and mining areas, specificcontaminant sources), it is clear that the anomalously high arsenic concentrations in the source regionare responsible. The extent of this contamination is usually highly localised because the geochemicalconditions within most aquifers do not favour arsenic mobilisation on a regional scale. However, inareas strongly affected by geothermal activity, high-arsenic groundwaters may be more widespread asa result of the large source of arsenic and the fact that the source arsenic is already in solution.
Perhaps more puzzling is the way by which exceptionally high concentrations of arsenic – upto several mg l–1 – are found in groundwaters from areas with apparently near-average source rocks.In the extensive high groundwater arsenic areas, this appears to be the rule rather than the exception.Most of these cases arise in aquifers derived from relatively young aquifer materials, often consistingof alluvium or loess where the total As concentrations in the sediments are usually in the range 1–20 mg kg–1. A recognition of this fact is a recent development and its late appreciation has delayed thediscovery of many high-arsenic groundwater provinces.
47
A critical point is that the drinking-water limit for arsenic is very low in relation to the overallabundance of arsenic in the natural environment (Section 1.5.1 and Box 1.6). Fortunately, most of thisarsenic is normally immobilized by various minerals, particularly iron oxides, and so is not availablefor abstraction. However, it only takes a small percentage of this ‘solid’ arsenic to dissolve or desorbto give rise to a serious groundwater problem. This can provide an explanation for both the oxidizingand reducing high-arsenic environments described in Section 1.5. An abundant source of iron oxideswith its surface-bound and coprecipitated arsenic provides a ready source of arsenic that may bereleased given an appropriate change in geochemical conditions.
Box 1.6. Why is arsenic such a problem in some ‘natural’ groundwaters?
Importance of the very high solid/solution ratio in aquifers
One of the paradoxes of arsenic and groundwater is that extensive arsenic problems are found inareas in which the aquifer sediments themselves appear to have near-to-average arsenic concentrations, i.e. inthe range 2–10 mg kg–1. While the detailed mechanisms for the evolution of high-arsenic groundwaters are notyet well understood, sufficient is already known to provide some insight into the reasons for this. Firstly,because of the high solid/solution ratios found in soils and aquifers (3–6 kg l–1) and the low absolute value ofthe drinking water limit for arsenic, even small changes in the distribution of arsenic between solid and solutionare important. Secondly, in many soils and aquifers, much of the arsenic appears to be associated withsecondary minerals such as iron, aluminium and manganese oxides, probably in large part as adsorbed arsenicspecies. This form is particularly sensitive to changes in the environment and it only takes a small change inthe amount of arsenic adsorbed to change the concentration of arsenic in the groundwater significantly. Forexample, if it assumed that say 1 mg kg–1 of the sediment arsenic is present in a labile form, in the event ofcomplete dissolution or desorption, this would produce up to 3000–6000 µg As l–1 in the groundwater, manytimes the WHO guideline value.
The triggers for change
There appear to be two main drivers leading to a change in the amount of arsenic adsorbed. Firstly, it is wellknown that an increase in pH leads to the release of many anions adsorbed onto iron, aluminium andmanganese oxides, including that of arsenate but less so arsenite (see Box 1.2). For arsenate, a change frompH 7 to pH 8.5 or above can be critical. Such a change frequently occurs in arid and semi-arid areas as a resultof evaporation in inland (closed) basins. These pH changes normally occur under oxidising conditions.
Secondly, a change from oxidising conditions to reducing conditions may promote the desorption of arsenic.This is likely to reflect changes in the oxidation state of arsenic in groundwater: changing from strongly sorbedarsenate under oxidising conditions to less strongly sorbed arsenite under reducing conditions. Changes in theoxide minerals themselves also appear to be important, including possible changes to their structure andsurface properties as well as partial dissolution in the case of iron and manganese oxides. Again these changesoccur under conditions that are not uncommon in aquifers, especially in young alluvial aquifers where a readysupply of organic carbon from the constituent sediments readily consumes any free oxygen.
However, these changes alone are not enough. An additional and critical factor is the extent to which theaquifer has been flushed. In closed basins, there is little flushing and a wide variety of chemicals accumulate,often including fluoride, phosphate, uranium, vanadium and selenium as well as arsenic. In aquifers with moreactive groundwater flow, any arsenic released by the above processes will eventually be flushed away andthere is unlikely to be substantial further release since the sediments will have re-equilibrated with the newenvironment. Therefore present-day arsenic problem areas are most likely to be found in areas where theamount of flushing has been low either due to their young age or to very slow groundwater movement. Thevery low hydraulic gradients found in large delta regions, such as the Bengal Basin, are ideal for minimising theextent of flushing and hence preserving high arsenic concentrations in groundwater.
1.6.3 Mobilisation – the necessary geochemical trigger
There appear to be two key factors involved in the formation of high-As groundwaters on aregional scale: firstly, there must be some form of geochemical trigger which releases arsenic fromthe aquifer solid phase into the groundwater. Secondly, the released arsenic must remain in thegroundwater and not be flushed away.
48
There are a number of possible geochemical triggers but the most important appears to be thedesorption/dissolution of arsenic from oxide minerals, particularly iron oxides. An important featureof this process is that the initial adjustment is probably quite rapid since it involves a shift in theadsorption isotherm from one point on the isotherm to another point and adsorption reactions, beingsurface reactions, are usually rapid. The rate limiting factors are probably those controlling the majorchanges in pH, Eh and associated water quality parameters of the aquifer. These are in part related tophysical factors such as the rate of diffusion of gases through the sediment and the rate ofsedimentation, in part due to the extent of microbiological activity and in part related to the rates ofchemical reactions. However, many of these factors can be seen as being rapid on a geological timescale (tens of thousands of years and longer). Dissolution reactions are slower but even oxidedissolution is rapid on a geological time scale and can be observed in a matter of weeks in paddysoils.
A qualification is that if diagenetic changes to the mineral structure are important (see below)or if burial to a certain depth is important, then there could be a slow release of arsenic over a muchlonger time scale. Details of the rate of release of arsenic and how this varies with time are not yetclear. It is likely that the rate will diminish with time with the greatest changes occurring early on.Natural groundwater flushing means that very slow releases of arsenic are likely to be of littleconsequence since the arsenic released will not tend to accumulate to a significant extent.
A corollary of this hypothesis is that once the diagenetic readjustment has taken place and thesediments have equilibrated with their new environment, there should be little further release ofarsenic – this contrasts with some mineral-weathering reactions which occur in ‘open’ systems andcan continue for millions of years until all of the mineral has dissolved. Seen in this context, thedesorption/dissolution of arsenic in young aquifers is essentially a step change responding to a new setof conditions. As discussed above (Section 1.4), the type of reactions that may occur can be seentoday most clearly where they occur at a small spatial scale and over a short time scale, for example,across a redox boundary in a lake sediment. The geochemical triggers involved could arise for anumber of possible reasons. Below we speculate what these might be. Some model calculations oftheir possible impact are given in BGS and DPHE (2001).
Desorption at high pH under oxidising conditionsUnder aerobic and acidic to near-neutral conditions, arsenic is very strongly adsorbed by
oxide minerals as the arsenate ion (Box 1.2). The highly non-linear nature of the adsorption isothermfor arsenate ensures that the amount of arsenic adsorbed is relatively large, even at low solutionconcentrations. In a simple system with no competing anions, hydrous ferric oxide (Hfo) can have anAs loading of nearly 15,000 mg kg–1 when in equilibrium with 1 µg As(V) l–1 at pH 7. This adsorptionreaction protects many natural environments from widespread As toxicity problems. As the pHincreases, especially above pH 8.5, arsenic desorbs from the oxide surfaces, thereby increasing theconcentration of arsenic in solution. The impact of this is magnified by the high solid/solution ratiostypical of aquifers (3–10 kg l–1).
There are several reasons why the pH might increase but the most important in the presentcontext is the uptake of protons by mineral weathering reactions combined with the effect ofevaporation in arid and semi-arid regions. This pH increase is commonly associated with thedevelopment of salinity and the salinisation of soils. Inputs of high-pH geothermal waters may beimportant in maintaining high As concentrations in some alkaline lakes. Desorption at high pH is themost likely mechanism for the development of groundwater-arsenic problems under the oxidisingconditions described in Section 1.5.3 and would account for the observed positive correlation ofarsenic concentrations with increasing pH.
49
Box 1.2. Adsorption of arsenic by iron oxides
The adsorption of arsenic by iron oxides is a very important natural process that is to a large extentresponsible for preventing widespread arsenic toxicity problems in nature. Arsenic is very strongly adsorbed byiron oxides, especially under oxidising and slightly acidic conditions. This is often the basis for the removal ofarsenic during water treatment. The amount of adsorption is described by the adsorption isotherm whichrelates the concentration of arsenic adsorbed to its concentration in solution. Once this is known for a widerange of conditions then many properties can be calculated, including the percentage of arsenic adsorbed as afunction of pH (see Figure), the likely efficiency of arsenic removal plants and the extent of retardation ofarsenic during movement through soils and aquifers.
Adsorption isotherms are either linear or non-linear. A linear isotherm means that the amount of aspecies adsorbed is directly proportional to its concentration in solution. The isotherms for the two forms ofarsenic, arsenate and arsenite, are very different including their pH dependence (see Figure). The arsenateisotherm is highly non-linear, the arsenite isotherm less so. An important consequence of the highly non-linearadsorption for arsenate is that even at the µg l-1 level of arsenic in solution, the arsenic loading on the oxidecan be appreciable corresponding to thousands of mg As/kg in the case of hydrous ferric oxide (Hfo). Theloading on more crystalline iron oxides such as goethite and hematite is somewhat lower because of their lowersurface area, but is still appreciable.
While there have been many studies of arsenic adsorption by iron oxides, many of the details that areimportant for understanding the groundwater arsenic problem remain unclear, including the best mathematicalformulation of the isotherm and how adsorption changes with pH and redox status. The most popular basis atpresent for calculating the amount of arsenic adsorbed by iron oxides is the diffuse double- layer model ofDzombak and Morel (1990) and its associated database but this model cannot account for the competitiveinteractions found in nature very well and the database is based on a limited amount of experimental data. TheCD-MUSIC model of Hiemstra and van Riemsdijk (1999) is more promising but is more complex and at presentis not coded into the popular geochemical modelling packages.
As such a pH increase induces the desorption of a wide variety of oxyanions, other oxyanionssuch as phosphate, vanadate, uranyl and molybdate will also tend to accumulate. There is evidencethat this is indeed the case (Box 1.5). These specifically-adsorbed anions all interact with theadsorption sites on the oxides in a competitive way and so influence, in a complex way, the extent ofbinding of each other. This is not well understood in a quantitative sense. Phosphate in particular mayplay an important role in arsenic binding since it is invariably more abundant than arsenic, often by afactor of 50 or more (in molar terms), and is also strongly bound to oxide surfaces. Phosphate is asstrongly bound as arsenate. The role of bicarbonate, often the major anion in arsenic-affected
Figure showing the pH dependence ofarsenate and arsenite adsorption on hydrousferric oxide (Hfo) calculated according to theDzombak and Morel (1990) diffuse double-layer model. Arsenate is very stronglyadsorbed below pH 8 while arsenite is morestrongly bound than arsenate at pH valuesgreater than about 9. Therefore desorption ofarsenic can occur either from an increase inpH from say 8.0 to 9.0 or from a change inoxidation state from arsenate to arsenite.Unfortunately, applying these observations tothe ‘real world’ is not so straightforward: thepresence of other specifically adsorbed ionssuch as phosphate changes theserelationships. Also natural iron oxides maydiffer significantly from Hfo.
50
groundwaters, in promoting the desorption of arsenate is unclear at present, as is the role of dissolvedorganic carbon (fulvic and humic acids). Some cations, because of their positive charge, may promotethe adsorption of negatively charged arsenate (Wilkie and Hering, 1996). Calcium is likely to be themost important cation in this respect because of its abundance in most natural waters and its +2charge. Divalent Fe may be important in reduced waters. Silica also exerts a control on the sorption ofAs (Swedlund and Webster, 1998).
The aridity described above enables the high pH values to be maintained and minimises theflushing of the arsenic. It also allows the build-up of high chloride and fluoride concentrations. Otherhigh-pH environments (up to pH 8.3), particularly open-system calcareous environments, are likely tobe too well flushed to allow any released arsenic to have accumulated. Arsenate may also be sorbedby carbonate minerals. The pH dependence of adsorption is critical but has not yet been measured indetail for any aquifer materials especially in the presence of typical groundwater compositions. ThepH dependence is likely to depend to some extent on the heterogeneity of the aquifer material. Otherspecifically adsorbed anions, particularly phosphate and perhaps bicarbonate, may also significantlyaffect the pH dependence of As(V) and As(III) binding. High pH values cannot explain thedevelopment of high arsenic concentrations in reducing environments such as Bangladesh sincegroundwaters in reducing environments normally have a near-neutral pH.
Desorption and dissolution due to a change to reducing conditionsThe onset of strongly reducing conditions – sufficient to enable iron(III) and probably
sulphate reduction to take place – appears to be a second trigger for the release of arsenic. The mostcommon cause of this is the rapid accumulation and burial of sediments. This occurs in river valleys,especially in broad valleys with wide meandering river channels carrying heavy sediment loads.Large, rapidly advancing deltas are an extreme case. Aeolian deposition of extensive deposits of loesscan provide the necessary conditions. The organic carbon content of the buried sediment will largelydetermine the rate at which reducing conditions are created. Freshly-produced soil organic matterreadily decomposes and it does not take much of this to use up all of the dissolved oxygen, nitrate andsulphate. Reducing conditions can only be maintained if the diffusion and convection of dissolvedoxygen and other oxidants from the surface is less rapid than their consumption. This is helped ifthere is a confining layer of fine-grained material close to the surface. This often occurs in large deltaswhere fine-grained overbank deposits overly coarser-grained alluvial deposits.
Change in arsenic speciation
While the detailed reactions (in surface chemical terms) which occur when reduction takesplace are not well understood, the change from normally strongly adsorbed As(V) to normally lessstrongly adsorbed As(III) may be one of the first reactions to take place, although not all the evidencesupports this (e.g. De Vitre et al., 1991). A change in the redox state of the adsorbed ions could havewider-ranging repercussions since it will also affect the extent to which other anions can compete foradsorption sites. Phosphate-arsenite competition, for example, is likely to be less important thanphosphate-arsenate competition. There is also the potential for arsenite-arsenate competition. Modelcalculations suggest that adsorbed phosphate can reverse the relative affinity of As(III) and As(V) atnear neutral pH values (BGS and DPHE, 2001). These complexities are poorly understood at presentbut are important if reliable quantitative predictions of arsenic concentrations under reducingconditions are to be made.
Reduction in surface area of oxide minerals
Freshly-precipitated metal oxides, particularly iron oxides, are often highly disordered andgradually transform to more ordered forms. Such disordered and fine-grained iron oxides, which mayinclude Hfo, lepidocrocite, schwertmannite and magnetite, are commonly formed in the early stagesof weathering. Furthermore, cycling between oxidized and reduced states of Fe in shallow sediments,with the aid of sulphide-sulphate cycling, may serve to keep the iron oxides in a ‘reactive’ state(Canfield, 1989). Once the oxides are more deeply buried and subject to groundwater flow, especiallywith oxidising water, they are likely to transform to the more stable forms of goethite and hematite.
51
There is ample evidence that this ageing reaction can take place rapidly in the laboratory but the rateof the reaction in nature is likely to be somewhat inhibited by the presence of other ions, particularlystrongly adsorbed ions such as aluminium, phosphate, sulphate, arsenate and silicate (Cornell andSchwertmann, 1996).
All other things being equal, if the surface area of an oxide mineral is reduced, then adsorbedions will be desorbed into solution. Some will be readsorbed, depending on the shape of theadsorption isotherm, the solid/solution ratio and the extent of inclusion within the evolving solidphase but the concentration in solution will tend to increase. Such reductions in surface area are well-established for Hfo which has a specific surface area of 100–600 m2 g–1 compared with a muchsmaller specific surface area for its aged products, typically 150 m2 g–1 or less for goethite and muchless still for hematite (Cornell and Schwertmann, 1996).
Reduction in binding strength between arsenic and the mineral surfaces
It is perhaps not unreasonable to speculate that the diagenetic reactions that take place once asediment is buried not only lead to a reduction in specific surface area but could also lead to areduction in the binding strength of the adsorbed arsenic. This could arise from the mineraltransformations described in section 1.4.3. However, it is also possible that the adsorption affinity (i.e.the intrinsic binding constant) could actually increase following crystallisation. This would tend tooffset changes taking place due to a reduction in surface area. On balance, laboratory and fieldevidence suggests that at micromolar As concentrations freshly-formed Hfo does bind more arsenicthan goethite on a mole of Fe basis (De Vitre et al., 1991).
Under strongly reducing conditions, it appears that additional processes could operate whichmay lead to a reduction in the overall adsorption of arsenic. Specifically for iron oxides, some of thesurface iron centers could be reduced from Fe3+ to Fe2+ to produce a mixed valence oxide perhapsakin to that of a magnetite or a green rust-type compound (section 1.3.4). This would tend to reducethe net positive charge of the surface (or increase its net negative charge) and would thereby reducethe electrostatic interaction between the surface and anions. This could result in the desorption ofarsenic and a corresponding increase in the concentration of arsenic in solution.
The role of mineral dissolution
Mineral dissolution reactions would release both adsorbed As and irreversibly bound Aslocated within the mineral structure. The most likely candidate for such a reaction is the reductivedissolution of iron oxides and this has been extensively discussed in the context of estuarine, lake andriver sediments. Such a reaction accounts for the high ferrous iron content of anaerobic waters. Whilethis undoubtedly accounts for some of the release of arsenic in reducing groundwaters, it does notappear to be sufficient to account for all of the arsenic released. In a few reducing groundwaters inBangladesh, for example, the dissolved arsenic concentration is greater than that of iron (on a weightbasis). If congruent dissolution alone were responsible for the arsenic release, this would requireeither the extensive precipitation of secondary iron phases (most likely carbonates or sulphides) or thechromatographic separation or iron and arsenic as a result groundwater movement. Congruentdissolution of a typical iron oxide without any precipitation of secondary iron phases would onlyrelease a few µg As l–1. Reductive dissolution cannot of course explain the high-arsenic oxidisinggroundwaters.
The sequence of events that occur during the reductive dissolution of iron(III) oxidescontaining adsorbed and coprecipitated arsenic is complex and has not been studied in detail.Incongruent dissolution of arsenic from iron oxides probably occurs at the same time as desorptionreactions. It is even more complex than for phosphate because of the added complication of thevariable oxidation state of arsenic. The reduction of both the oxide and the arsenic are microbiallycatalyzed and the relative rates depend on the viability and nutrient supply of the specific microbialstrains involved (Ehrlich, 1996).
52
Manganese oxides also undergo reductive desorption and dissolution and so could contributeto the arsenic load of groundwaters in the same way as iron. Certainly many of the reducinggroundwaters of Bangladesh contain high concentrations of manganese (DPHE/BGS/MML, 1999).The Mn oxide surfaces also readily catalyse the oxidation of As(III) (Oscarson et al., 1981). It is notknown whether or not the dissolution of carbonate minerals (calcite, dolomite, siderite), which arecommon minerals in aquifers, contribute significantly to the release of arsenic to groundwater, or itsuptake from groundwater.
Sulphide oxidation, particularly pyrite oxidation, can also be an important source of arsenicespecially where these minerals are freshly exposed as a result of a lowering of the water table. Thiscan occur locally in and around mines and on a more regional scale in aquifers. In extreme cases, thiscan lead to highly acidic groundwaters rich in sulphate, iron and trace metals. As the dissolved iron isneutralized, it tends to precipitate as a hydrous ferric oxide (sometimes schwertmannite) with aresultant adsorption and coprecipitation of dissolved As(V). In this sense, pyrite oxidation is not avery efficient mechanism for releasing As to surface and groundwaters.
1.6.4 Transport – the hydrogeological dimension
The geochemical triggers described above may release arsenic into groundwater but are notalone sufficient to account for the distribution of high-arsenic groundwaters observed. The additionalfactor is that the released arsenic must not have been flushed away or diluted by normal groundwaterflow. This also places a time dimension on the problem since the rate of release must be set againstthe accumulated flushing of the aquifer that has taken place during the period of release. The rocks ofmost aquifers used for drinking water are several hundred million years old and yet containgroundwater that may be only a few thousand years old or younger. This implies that many porevolumes of fresh water have passed through the aquifer over its history.
The oldest fresh groundwaters are found in the Great Artesian Basin of Australia and are upto one million years old. The water moves slowly through this aquifer – at a rate of about 0.1 m yr–1 –and over its 2.5 billion year history, there have been many pore volumes of fresh water flushedthrough the system. Any desorbed arsenic will have long since disappeared. The same is true of mostyoung aquifers with actively flowing groundwater. On the other hand, many deltaic and alluvialaquifers are characterised by relatively young sediments and often relatively old groundwater. Therelative ages of the aquifer rocks and of the groundwater are important. It is only when thegeochemical trigger to mobilise arsenic and the hydrogeological regime to preserve it are bothoperating that we see high groundwater arsenic concentrations on a regional scale.
It is also necessary to consider historical water flows which may have been very differentfrom the present-day flows. One of the more significant ‘recent’ events is the global change in sealevels that has occurred over the last 130,000 years (Pirazzoli, 1996). Sea levels broadly respond tothe amount of ice stored in glaciers and so reflect global climate patterns. Between about 120,000years ago and 18,000 years ago, the sea-level steadily declined (with a few ups and downs) as glaciersexpanded. The last glaciation was at a maximum some 21,000–13,500 years ago with sea levels beingup to 130 m below present mean sea-level. This was a worldwide phenomenon and would haveaffected all then existing coastal aquifers. Continental and closed basin aquifers on the other handwould have been unaffected. The hydraulic gradient in coastal aquifers would therefore have beenmuch greater than at present which would have resulted in correspondingly large groundwater flowsand extensive flushing. The arsenic in these older aquifers would therefore tend to have been flushedaway. The deep unsaturated zone would also have led to more extensive oxidation of the shallowerhorizons with possible increased sorption of As to Fe(III) oxides. Relics of these high flows are seenin the extensive fissure formation in some of the world’s older carbonate aquifers.
Between some 13,500–7000 years ago, warming occurred and sea levels rapidly rose to theirexisting levels. Therefore aquifers that are younger than some 7,000 years old will not have beensubjected to this increased flushing that occurred during the most recent glaciation.
53
The time taken to flush an aquifer depends on many factors (Appelo and Postma, 1994). Acritical factor is the number of pore volumes of ‘fresh’ water that have passed through the aquifersince the initial release of arsenic has taken place. The other important factor is the partitioning ofarsenic between the aquifer solid phase and the groundwater. This determines how easy it is to flushout the arsenic and is related to the slope of the adsorption isotherm (Appelo and Postma, 1994). Insimple cases, this can be expressed by a partition coefficient or Kd. The greater the Kd, the greater thecapacity of the sediment to withstand changes and the slower the arsenic will tend to be flushed fromthe aquifer. The Kd depends on many factors both relating to the aquifer material itself and to thechemistry of the groundwater, i.e. its pH, arsenic concentration and speciation, phosphateconcentrations and so on. In practice, the adsorption isotherms are usually non-linear which meansthat the Kd varies with concentration which leads to more complex transport but the same generalprinciples apply. The Kd will be less than under ‘normal’ oxidised conditions since a reduced Kd isprecisely the reason for the arsenic problem in the first place. There have so far been no reliablestudies of Kd values applicable to arsenic-affected aquifers. The greater the quantity of arsenicinvolved, the more strongly it is adsorbed and the slower the rate of groundwater movement, thelonger that high-arsenic groundwaters will persist.
As described above, the number of pore volumes that have passed through the aquifer is itselfa function of the groundwater flow velocity integrated over the time since sediment burial. InBangladesh, the age of sediment–depth relationship is particularly important since this has a directbearing on the extent of flushing. Many of the shallow sediments in southern Bangladesh are less than13,000 years old, even less than 5,000 years old, and so will not have experienced the extensiveflushing of the last glacial period. These are where the majority of the tubewells are situated.Certainly at present flushing is slow because of the extremely small hydraulic gradients especially insouthern Bangladesh. However, deeper and older sediments, which may exceed 13,000 years old, willhave been subjected to more extensive flushing. This may account for the ‘arsenic-free’ groundwatersfound in the deep aquifers of Bangladesh. Geochemical factors may also play a role since theevidence is that while the deep groundwaters are currently reducing, they are less strongly reducingthan the shallow aquifers. Certainly, the aquifers in the Pleistocene uplifted alluvial sediments of theBarind and Madhupur Tracts will have been well flushed since they are at least 25,000–125,000 yearsold. These sediments invariably yield low-As groundwaters, typically containing less than 0.5 µg l–1
arsenic. A complication is that the Bengal Basin is locally rapidly subsiding and filling in withsediments. This adds to the high degree of local and regional variation.
Not only are the regional flow patterns important. At a local scale, small variations in relief orin drainage patterns may dictate local flow patterns and hence the distribution of arsenic-richgroundwater. For example, there is evidence from Argentina that the highest groundwater arsenicconcentrations are found in the slightly lower areas where seasonal discharge occurs. The same is truein Inner Mongolia and may also be true in Bangladesh. In any case, it is a characteristic ofgroundwater arsenic problem areas that there is a high degree of local-scale variation. This reflects thepoor mixing and low flushing characteristic of the affected aquifers.
It is clear that flat low-lying areas, particularly large plains and delta regions, are particularlyprone to potentially high arsenic groundwaters since they combine many of the risk factors identifiedabove. The process of delta development also favours the separation of minerals based on particle sizeand produces the characteristic upwardly fining sequences of sand–silt–clay which leads to confiningor semi-confining layers which aid the development of strongly reducing conditions. The youngest,distal part of the deltas will tend to contain the greatest concentration of fine-grained material and thisprovides an abundant source of arsenic in the form of colloidal-sized oxide materials. Flocculation ofcolloidal material, including iron oxides, at the freshwater-sea water interface will tend to lead torelatively large concentrations of these colloids in the lower parts of a delta. The larger the delta, andthe more rapid the infilling, the lower the hydraulic gradient and the less flushing that is likely to haveoccurred. However, some deltas – even large deltas – may be so old and well-flushed that even theexisting low hydraulic gradients would have been sufficient to flush away any desorbed or dissolvedarsenic.
54
While we have attempted to explain some of the factors that give rise to high-arsenicgroundwaters, we are aware that much remains unknown about exactly how such waters are formedand that our generalizations may not apply universally. They should serve as hypotheses to be testedand amended by further detailed field and laboratory investigations.
1.7 Outstanding questions and further needs
1.7.1 Field analytical methods for arsenic determination
In view of the characteristic high degree of spatial variation of groundwater arsenicconcentrations in arsenic-affected areas, the analysis of each water supply is the only certain way ofdetermining its potability.
In countries such as Bangladesh which have a very large number of wells to be tested and inwhich the existing laboratory-testing infrastructure is not able to cope with the demand, a rapid fieldtesting programme is necessary. Carrying out such a programme is a major organisational challengeand reliable field tests are critical to the success of such a programme. The less need for retesting in alaboratory the better since this involves difficult sample tracking and could result in confusion andcould even discredit the field testing programme. If field testing is to be carried out, then ideally itshould be capable of giving a reliable result first time. Of course, all analytical results have anuncertainty or error associated with them and this should be monitored through some form of qualitycontrol programme. It also means that there is inevitably some uncertainty in the classification ofwells with concentrations close to the standard value.
Most of the current field test kits are based on the Gutzeit method which involves thereduction of As(III) and As(V) by zinc to give arsine gas which is then used to produce a stain onmercuric bromide paper. Hydrogen sulphide gas is removed with zinc acetate-treated glass wool.There have been many studies of the sensitivity and reliability of these kits, particularly in India andBangladesh. The early kits were usually good at detecting high-As waters (say greater than 100 µg l–1)but often were found to have rather poor reliability at lower concentrations. Ideally a field test kit forarsenic should be:
• sensitive and reliable – it should be quantitative at the 5–200 µg l–1 level and have aprecision that is about the same as, or slightly better than, the short-term variabilityobserved in the field, say ± 20 percent or ± 5 µg l–1 for low concentrations;
• robust – it should be able to maintain a good performance for long periods under actualfield conditions assuming reasonable care is taken;
• simple to use – it should be designed to be as simple as possible to use by field workerswith the minimum of technical training and supervision;
• affordable – it must not be so expensive as to preclude its use either in terms of capital orrecurrent costs;
• safe to use – it must not pose a hazard to the user or environment even after heavy use.
A number of improvements have been made to the early kits and several promising kits arenow either in production or in development. Perhaps the most promising is a field-test kit beingdeveloped by Professor Walter Kosmus of Karl-Franzens University of Graz, Austria. This is a logicaldevelopment of the standard Gutzeit kit in that it: (i) replaces zinc with sodium borohydride and thusremoves the problem of obtaining low-As zinc; (ii) uses solid tablets instead of liquid chemicals andthus avoids the need for carrying strong acids or sodium borohydride solution in the field; (iii) has asimple, robust and easy-to-make straight-through arsine generator; (iv) forces all of the arsine gasthrough a smaller portion of mercury bromide-treated filter paper to ensure maximum sensitivity and
55
precision; (v) uses a separate, small calculator-style device to measure the stain developedphotometrically; (vi) determines total arsenic, and (vii) is relatively stable and easily calibrated.
The challenge with all such devices is to reduce their costs sufficiently to enable them to bewidely used where needed.
1.7.2 Surveys of groundwater quality
The first priority must be to carry out reconnaissance regional surveys of all possible higharsenic areas where there is currently little or suitable data. This should be done on as close to astratified-random basis as possible with the stratification based on a knowledge of local geology andthe desire to get a reasonably uniform coverage. Suspect areas should then be sampled in more detail.
Aside from its primary role as part of a public health programme, high density village-scaletesting of wells for arsenic will also lead to a better understanding of the causes of the arsenic problemand ultimately will help to guide any future development of groundwater resources. Therefore animportant task is the careful recording of well details and combining this with the test results intosome form of database. Ideally the geographic coordinates of a well should be recorded to within 10m or so that reliable large-scale maps can be made. Ordinary GPS devices can now usually givecoordinates to better than about ± 10 m and can certainly aid this mapping.
In arsenic problem areas, detailed studies should be undertaken to provide a sounder basis forunderstanding the causes of the problem and its variation in space and time. These could include amore comprehensive range of water quality parameters including all of the major, and a range ofminor, constituents. Age-related parameters such as 3H and 14C should also be measured. Studiesshould be made of the local geology and hydrogeology including water level monitoring, pumpingtests, and studies of the mineralogy, sedimentology, chemical composition and adsorption behaviourof the aquifer materials. Either purpose-built piezometers or suitable production wells should bemonitored for changes in arsenic and other water quality parameters with time. Such studies areexpensive and are not warranted unless the scale of the problem is large. As experience is gained andthe processes better understood, some of these studies may become unnecessary.
Perhaps one of the lessons from Bangladesh is that surprises can still happen and that in anynew large-scale groundwater development, a broad-ranging ‘water quality’ survey should be carriedout before full-scale development takes place. ‘Water quality’ here is taken to include a wide range ofparameters not just those on the existing lists of statutory ‘health-related’ parameters. For theinorganic elements, recent advances in analytical methodology mean that this should now be possiblein most well-equipped water quality laboratories. For the organics, particularly the anthropogenicpersistent organic compounds, this is less straightforward but still possible albeit very expensive. Thescope of such broad and open-ended surveys should be commensurate with the anticipated scale of thegroundwater development.
1.7.3 Will the problem groundwaters get better or worse with time?
The answer to this question is probably ‘better’ but over a long time and on a timescale that isnot relevant to the present exploitation. High arsenic groundwaters tend to be found in aquifers ofHolocene age, i.e. aquifers in which the sediments have been deposited in the last ten thousand years.With time, the high concentrations of arsenic will be flushed away in the normal groundwater flow.The actual timescale depends on many factors that are poorly understood. The arsenic concentrationin an individual well could increase before it decreases as arsenic is transported through the aquifer.
The influence of time is also connected to the relationship between the depth of well and thearsenic concentration since deeper sediments tend to be older. In Bangladesh, the deeper aquifer(below about 150–200 m depth) where studied appears to be essentially arsenic-free at present. Mostof the problems are confined to the shallow aquifer, particularly over the depth interval 12–70 mbeneath ground level. The past is not necessarily a good guide to the future – the extensive flushing of
56
aquifers that took place during the last glaciation and the preceding period of globally low sea levelswill have led to unusually high hydraulic gradients and relatively rapid flushing. At present sea levelsare rising as a result of global warming further reducing hydraulic gradients. Of more importance inthe Bengal Basin context is the extent to which present and future exploitation of both shallow anddeep aquifers for domestic supply and for irrigation might impact on the present good quality ofgroundwater from the deep aquifer. There is the possibility that heavy pumping of the deep aquifermay draw contaminated shallow groundwater down to the deep aquifer especially in the absence of aconfining layer of clay at intermediate depths. There is also the possibility that poor well constructionmay lead to the rapid movement of contaminated water to depth.
Significant changes in arsenic transport in groundwater may occur locally due to the influenceof mining, groundwater pumping and irrigation. Mining in hardrock areas may in effect create a newaquifer with extensive fracturing, adits and other drainage channels. The water table is also oftenlowered by drainage or pumping and this can induce air entry and enhanced oxidation.
1.7.4 Transport under natural flow conditions
It is necessary to know how arsenic moves in an aquifer to predict how concentrations mightchange in the future. Arsenic, like any other solute, moves in response to the flow of groundwater andits interaction with the aquifer solid phase. Adsorption or precipitation reactions will tend to retardmovement relative to that of the groundwater whereas the co-transport of chemicals, includingphosphate from fertilisers, that enhance the release of arsenic could lead to its more rapid movementthrough the aquifer, albeit limited by the rate of flow of the groundwater. Establishing the basicgroundwater flow patterns within an aquifer is a prerequisite to understanding the movement ofarsenic. The concentration profile of a non-reactive solute such as chloride can help to establish this.Age-related tracers such as 3H, 14C and CFCs can also help as well as basic hydrogeologicalinvestigations of the aquifer.
Aside from the basic hydrogeology of the aquifer, it is also important to understandquantitatively the solid-solution interactions which take place. This refers principally to the nature ofthe adsorption-desorption isotherms and the mechanisms of reductive dissolution of iron andmanganese oxides. It is likely that what is conveniently called ‘reductive dissolution’ is in fact amixture of desorption, dissolution and structural rearrangement of the oxides themselves. A two-stranded approach is required: firstly, a detailed characterisation of sediments and associated porewaters is needed from a variety of aquifers, both affected and not affected, akin to that undertaken bylimnologists and oceanographers when studying their sedimentary environments. In reduced aquifers,special care should be taken to avoid oxidation of the sediment. Secondly, these field studies need tobe backed up by new theoretical advances in modelling the relevant surface chemical reactions of theoxides and sediments particularly in reducing environments. This will involve both modelling andlaboratory work. There are probably some important scientific discoveries yet to be made!
1.7.5 Interaction of arsenic with sediments
Calculations of the rate of movement of arsenic through an aquifer depend on knowing theappropriate solid-solution partition coefficient (Kd), or more particularly, on knowing the nature ofthe adsorption isotherm and in being able to predict how the partitioning changes with changes ingroundwater chemistry. Therefore there is a need for laboratory studies of the interaction of arsenate,and if appropriate of arsenite also, with the affected aquifer materials. These will need to be carriedout under conditions as close as possible to those found in the field including reducing conditions ifappropriate. This can be difficult.
These studies need to be backed up by laboratory studies of the interaction of arsenic withmodel oxide materials to establish better models for competitive adsorption of both arsenate andarsenite with other common anions and cations. It is likely that this will lead to the development ofnew models, or at least to a refinement of existing ones. Any new adsorption models need to beincorporated into a groundwater solute transport package.
57
Reductive dissolution of oxides with adsorbed As is poorly understood and needs carefulexperimental investigations to establish the sequence of events in terms of changes in arsenic and ironspeciation, changes in mineral surface chemistry and the kinetics and stoichiometry of Fe and Asrelease.
1.8 Strategy for locating arsenic problems in groundwater
The greatest challenge facing many water utilities and water providers in terms of the arsenicproblem is the large number of wells that may not have been analysed for arsenic and that need to betested. The challenge is to identify and mitigate any contaminated wells as soon as possible, and ifthere is going to be a substantial delay, the most seriously contaminated should be tackled first.Therefore a major task is to identify rapidly the most contaminated wells.
For many water providers, including NGOs in rural communities in developing countries,arsenic represents a new and poorly understood threat. There is almost certainly a general lack ofunderstanding of the variation of arsenic concentrations in their area. In some cases, such as WestBengal (India) and Bangladesh, the scale of the testing programme required is unprecedented. In othercases, there is a lack of knowledge of the potential problem, or the lack of suitable facilities fortesting. A rapid testing programme carried out in some randomised manner will establish if anextensive arsenic problem exists. It is far more difficult to identify every actual contaminated well inview of the high degree of spatial variability usually found in arsenic-contaminated areas. This isespecially true where there is an extensive network of rural wells. Figure 1.4 helps to identify ‘at risk’areas for priority testing. It can only be used to identify susceptible provinces, not individual wells.
High chemical spatial variabilityLarge volume of young sediments:
Large deltas & inland basins
Pyrite oxidationOxidising or mildly
reducing
Low Eh (<50 mV)No dissolved O2
High Fe, Mn, NH4
Low SO4 (<5 mg/l)High alkalinity (>500
mg/l)Possibly high DOC
(>10 mg/l)
Increased temperature
Increased salinity (Na, Cl)
High B, Li, F, SiO2
High pH >7
High Fe, SO4
Possibly low pH Presence of other trace
metals (Cu, Ni, Pb, Zn, Al, Co,
Cd)
Mixing/dilution
Geothermally-influenced groundwater
OXIDISING:Desorption (Fe oxides)
High pH (>8)High alkalinity (>
500 mg/l)Possibly high F,
U, B, Se, MoIncreased
salinityHigh Eh, DO
REDUCING:Reductive desorption
and dissolution(Fe oxides)
Confined aquifers
PROCESS
INDICATORS
ENVIRONMENT
Figure 1.4 Flow diagram to aid locating possible high-arsenic groundwaters
59
1.9 Non-technical Summary
Arsenic in the environment
• Arsenic is a well-known poison. It has featured in history as a poison for killing people bothin fact and in fiction. It was once a popular poison because it conveniently left no easilydetectable trace. The analysis was difficult, and remains so.
• Arsenic is not that rare. Small amounts are found in all rocks, soils and sediments and arseniccan be detected at low concentrations in most natural waters – rain, rivers, lakes, groundwaterand seawater. Occasionally it is present at much higher concentrations and this is of concernwhere the water is being used for drinking water or irrigation. Groundwater presents aparticular risk since this is where most of the naturally high concentrations of arsenic havebeen found and groundwater is often used as a source of drinking water.
The scale of the problem
• Well-known cases of arsenic poisoning from natural arsenic in the drinking water have beenfound in Taiwan, Chile, Argentina, Mexico, China and more recently in West Bengal (India)and Bangladesh. The scale of the problem in terms of population exposed to high arsenicconcentrations is greatest in the Bengal Basin with perhaps 40 million people drinking watercontaining ‘excessive’ arsenic. Many of the worst problems occur in poor countries withoutthe necessary infrastructure to be able to respond rapidly.
• The problem in Bangladesh was undetected for many years because of the lack of suitablearsenic testing laboratories within the country. The problem is made worse by the very largenumber of wells present. An estimate of 6–11 million wells has been made. Most of these areoperated by hand-pumps and obtain their water from depths of 10–70 metres.
National drinking-water standards
• Each country defines the maximum amount of arsenic that it permits in drinking water. Thisis usually done formally through a national drinking-water standard. The WHO has set itsprovisional guideline value at 10 µg l–1 but many countries have yet to adopt this standard intheir legislation.
• The standard currently adhered to in India, Bangladesh and most of the countries which havegroundwater arsenic problems is 50 µg l–1 although the US-EPA and EC limits have bothrecently been reduced to 10 µg l–1. The chronic or long-term toxicity of arsenic is believed tobe such that if the standard basis for risk assessment that is applied to industrial chemicalswere applied to arsenic, the maximum permissible concentration would be lower still.
The nature and causes of the problem
• The range of arsenic concentrations found in natural waters is unusually large, ranging fromless than 0.5 µg l–1 to more than 5000 µg l–1, i.e. a range of greater than ten thousand times.Typical concentrations in freshwater are less than 10 µg l–1 and often less than 1 µg l–1.Rarely, much higher concentrations are found and this gives rise to arsenic problem areas. Insuch areas, the percentage of ‘affected’ wells (defined as those exceeding 50 µg l–1) mayexceed 10 percent of all wells and even in the worst cases, may exceed 90 percent of wells.
• These large-scale ‘natural’ arsenic groundwater problem areas are found all over the worldbut they tend to be confined to two types of environment: firstly, inland or closed basins inarid or semi-arid areas, and secondly, strongly reducing aquifers often derived from alluvium.Both types of susceptible environments tend to contain very young sediments and to be inlow-lying, flat areas where groundwater flow is sluggish. Historically, these are poorlyflushed aquifers and any arsenic released from the sediments has therefore been able to
60
accumulate in the groundwater. Arsenic-contaminated groundwaters are also found ingeothermal areas and, on a more localised scale, in areas of mining activity or where sulphideoxidation has occurred. There are likely to be other known problems in mining areas relatedto acid mine drainage (AMD) and the generally metal-rich waters. In most cases, thesemineralized sources do not pose a major threat to drinking water supplies.
• Similarly, sources of geothermal water are usually well known and suitably monitored.
• Although the way in which the high-arsenic groundwaters are formed is not well understoodin detail, some general features are emerging. These are listed below:
o the arsenic content of the aquifer materials does not appear to be exceptionally high –it is normally in the range 2–10 mg kg–1;
o there appear to be two distinct ‘triggers’ that can lead to the release of arsenic fromthe aquifer material into the pore water. The first is the development of high pH(>8.5) conditions in semi-arid or arid environments usually as a result of thecombined effects of mineral weathering and high evaporation rates. This pH changeleads to the desorption of adsorbed arsenic (especially arsenate species) from naturalmineral oxides, or prevents arsenic from being adsorbed in the first place. The secondtrigger is the development of strongly reducing conditions at near neutral pH values,leading to the reductive desorption of arsenic from natural mineral oxides and to thereductive dissolution of iron and manganese oxides also leading to arsenic release.These are both responses to a change in the geochemical environment;
o there is as yet little direct evidence to support these arsenic release mechanisms foraquifers but the circumstantial evidence is strong. Detailed observations from otherrelated environments such as lake and ocean sediments and soils, and from laboratoryexperiments with pure minerals, also lends credence to them;
o high concentrations of phosphate, bicarbonate, silicate and possibly organic matter,either individually or in combination, can enhance the mobility of arsenic in waterthrough competition for adsorption sites;
o there is also potential for release of arsenic into groundwaters through the oxidationof sulphide minerals, particularly pyrite, brought about by aeration of the aquifer, forexample by ‘over-abstraction’ of groundwater. However, compared with the ‘iron-oxide reduction hypothesis’, the ‘pyrite oxidation hypothesis’ is not an efficientmechanism for releasing arsenic because of the readsorption of As by the iron(III)oxides that invariably precipitates further along the flow path.
The future
• Very little is known about how long it will take to flush out the arsenic released by theprocesses described above in specific aquifers. This is likely to depend on the past, presentand future groundwater flows, and hence on the detailed palaeohydrogeology of the aquifer,and on the sediment chemistry. It is almost certainly longer than the timescales of relevanceto the present groundwater As problems;
• the extent of flushing of an aquifer since the original deposition of the aquifer ‘rocks’ isclearly critical — the greater this is, the less likely it is that there will be an arsenic problem.This means that deeper, older aquifers will tend to suffer fewer problems (all other thingsbeing equal). Groundwater flows were greater than at present during the last glacial period(21,000–7,000 years ago) when sea levels were much lower and so aquifers laid down beforethis are less likely to be severely affected;
61
• while we suspect that the arsenic problem will gradually disappear under natural groundwaterflow, this may take many thousands of years and in the meantime, some wells may increase inarsenic concentration and some may decrease. Some of the arsenic may return via baseflow tobe readsorbed by iron(III) oxides in the river sediments. The quantities of arsenic involved inaffected aquifers are very large and there is little possibility of completely flushing it out inthe short-term by pumping;
• a characteristic feature of high groundwater arsenic areas is the large degree of spatialvariability – the well-to-well variability is usually large which means that it may be difficultto predict what the concentration of arsenic is likely to be in a particular well from the resultsof neighbouring wells. This means that in affected areas there is little alternative but toanalyse each well separately for arsenic. Affected aquifers are the exception rather than therule. In most aquifers, the majority of wells are likely to be unaffected even when theycontain high concentrations of dissolved iron.
Acknowledgments
We thank Kirk Nordstrom, Don Runnells, Alan Welch and Rick Johnstone for thorough andconstructive reviews. We also thank the Department for International Development (UK) and theWorld Health Organisation for support in preparing this review. The maps of Argentina and China arecourtesy of the University of Texas at Austin map library. The review is published with thepermission of the Director, British Geological Survey (NERC).